

ABSTRACT
Colonization with Oxalobacter formigenes may reduce the risk of calcium oxalate kidney stone disease. To improve our limited understanding of host-O. formigenes and microbe-O. formigenes interactions, germfree mice and mice with altered Schaedler flora (ASF) were colonized with O. formigenes. Germfree mice were stably colonized with O. formigenes, which suggests that O. formigenes does not require other organisms to sustain its survival. Examination of intestinal material indicated no viable O. formigenes in the small intestine and ∼4 × 10⁶ CFU O. formigenes per 100 mg contents in the cecum and proximal colon, with ∼0.02% of total cecal O. formigenes cells being tightly associated with the mucosa. O. formigenes did not alter the overall microbial composition of ASF, and ASF did not affect the capacity of O. formigenes to degrade dietary oxalate in the cecum. Twenty-four-hour collections of urine and feces in metabolic cages in semirigid isolators demonstrated that the introduction of ASF into germfree mice significantly reduced urinary oxalate excretion. These experiments also showed that O. formigenes-monocolonized mice excreted significantly more urinary calcium than did germfree mice, which may be due to degradation of calcium oxalate crystals by O. formigenes and subsequent intestinal absorption of free calcium. In conclusion, the successful establishment of mouse models with defined flora and O. formigenes should improve our understanding of O. formigenes-host and O. formigenes-microbe interactions. These data support the use of O. formigenes as a probiotic that has limited impact on the composition of the resident microbiota but provides an efficient oxalate-degrading function.
IMPORTANCE Despite evidence suggesting that a lack of Oxalobacter formigenes colonization is a risk factor for calcium oxalate stone formation, little is known about O. formigenes biology. This study is the first to utilize germfree mice to examine the response to monocolonization with O. formigenes, as well as the impact of a defined bacterial cocktail (i.e., ASF) on O. formigenes colonization. This study demonstrated that germfree mice receiving their regular diet remained monocolonized with O. formigenes, and it suggests that further studies with O. formigenes gnotobiotic mouse models could improve our understanding of O. formigenes biology and host-O. formigenes and microbe-O. formigenes interactions.
INTRODUCTION
Oxalobacter formigenes is part of the bacterial flora in the large intestine of many humans and other mammalian species and is unique in that it is the only bacterium yet identified in the intestines of mammals that requires oxalate as both an energy source and a carbon source. Recent evidence suggests that a lack of colonization with this oxalate-degrading specialist is a risk factor for idiopathic recurrent calcium oxalate stone disease (1, 2). A review of worldwide data indicated that 38% to 77% of a normal population and only 17% of stone formers were colonized with O. formigenes (1). The ability to recolonize individuals lacking O. formigenes was previously addressed in a study in which two healthy adults not colonized with O. formigenes became colonized following the ingestion of cultured O. formigenes (3) and remained colonized for 9 months. However, studies in which O. formigenes was provided in either a lyophilized form in enteric coated capsules or as a frozen paste to patients suffering from primary hyperoxaluria resulted in only a minority of the patients remaining colonized posttreatment (4, 5). Therefore, although it seems quite possible that O. formigenes colonization of noncolonized stone formers may be an effective way to minimize the risk of recurrent calcium oxalate stone disease, a better understanding of the factors that influence colonization is required.
Little is known about how and when individuals become colonized or how colonization persists over time. To date, studies suggest that colonization occurs early in childhood (6) and, if animal experiments provide insight, it is obtained from the environment and not directly from the mother (7); however, survival of bacteria outside the intestine has not been documented in any detail. Successful colonization of the gut presumably requires O. formigenes to occupy both mucosal and luminal niches. The intestinal sites of O. formigenes colonization have been examined only in the study by Weaver and colleagues (8). Their study, in which subjects underwent preparation for colonoscopy, showed that oxalate degradation was detected in cecal (∼90 cm from the anus) and/or sigmoid (∼40 cm from the anus) brush samples from 22 of 24 subjects, with concentrations of oxalate-degrading bacteria being estimated to be 10-fold greater in cecal brush samples than in sigmoid brush samples.
Rodent models colonized with O. formigenes have been used to answer a number of biological questions (9–12). Colonization has been demonstrated to induce gastrointestinal oxalate secretion, which may be an important mechanism by which this organism decreases oxalate levels within the body (10, 13, 14). Our recent studies with conventional mice artificially colonized with O. formigenes indicated that nondietary sources of oxalate, such as enteric oxalate secretion, may play an important role in the survival of O. formigenes during periods of dietary oxalate deprivation (11). Monocolonization and defined-flora models have become useful tools for the study of both microbe-microbe and host-bacterium interactions (15). A specific example of selective colonization of germfree (GF) animals involves the altered Schaedler flora (ASF), consisting of eight normal murine bacterial species. ASF mice have been in use for decades and offer significant advantages for the investigation of mechanisms governing host-microbiota relationships and how members of the gastrointestinal microbiota interact with one another (16). Of note, the genome of one of the ASF bacterial species, Lactobacillus intestinalis, contains oxalyl-coenzyme A (oxalyl-CoA) decarboxylase and therefore may have the capacity to degrade oxalate. The primary objectives of this study were to utilize defined mouse models to examine (i) responses to monocolonization with O. formigenes, (ii) the influence of O. formigenes on ASF microbial composition, (iii) the distribution of O. formigenes throughout the gastrointestinal tract, (iv) the impact of ASF on O. formigenes numbers, and (v) changes in various urinary and intestinal chemical levels following colonization of germfree animals with O. formigenes and ASF.
MATERIALS AND METHODS
Animals.
All animal studies were approved by the Institutional Animal Use and Care Committee of the University of Alabama at Birmingham (UAB). Germfree Swiss-Webster (SW) outbred mice (Taconic Biosciences Inc., Hudson, NY) were maintained in semirigid or flexible film isolators that had been previously sterilized with Exspor (Alcide, Redmond, WA). Isolators were housed within the UAB Gnotobiotic Facility, with a 12-hour light/dark cycle and an ambient temperature of 23 ± 1°C. Animals had free access to food (LM-485 autoclavable rodent diet; Teklad, Madison, WI) and water. Diet LM-485 contains 10 mg calcium/g diet and 1 mg oxalate/g diet and is considered a high-calcium/normal-oxalate rodent chow diet, similar to that used in our previous study (11). Homogenization of the diet in water versus 2 M hydrochloric acid was used to determine how much of the oxalate was incorporated in crystals; homogenization in acid ensures complete dissolution of all crystalline oxalate. Oxalate was quantified by ion chromatography (IC), as described previously (17), which indicated that 86% of the total oxalate in the diet was incorporated in crystals. Previous studies with ASF mice suggested that the age and gender of mice played important roles in the colonization levels of some ASF strains in the intestinal tracts of SW mice (18). In this study, however, cecal O. formigenes densities were not significantly different between 3-month-old male and female animals monocolonized with O. formigenes or between 3-month-old and 9-month-old female animals monocolonized with O. formigenes (Fig. 1). All further experiments were performed with 3-month-old male animals. Group sizes for experiments varied from 4 to 7 animals.
FIG 1.

O. formigenes CFU density in cecal contents from O. formigenes-monocolonized 3-month-old and 9-month-old female mice and 3-month-old male mice (A) and in intestinal contents from O. formigenes-monocolonized 3-month-old male mice (B). Solid lines, means. There were no differences in CFU between 3-month-old female animals, 3-month-old male animals, and 9-month-old female animals in panel A (P = 0.07; using the log-transformed CFU data and one-way ANOVA). There were significant differences in O. formigenes CFU between intestinal regions in panel B (P = 0.008; using the log-transformed CFU data and one-way ANOVA). In panel B, different letters indicate the significance (P < 0.05) of Tukey’s honestly significant difference (HSD) multiple-comparison tests (after one-way ANOVA). Animals were housed singly in Nalgene metabolic cages for 2 weeks prior to determinations of CFU density.
Colonization with O. formigenes and altered Schaedler flora.
Pure cultures of O. formigenes (strain OxCC13) were grown in Schaedler broth containing 100 mM oxalate (SBO), as described previously (19). ASF mice were kindly provided by the UAB Gnotobiotic Facility. GF or ASF mice were colonized with O. formigenes through the oral administration of a few drops of an early-stationary-phase SBO culture (∼107 CFU). Cohousing of four GF mice for 4 weeks in a regular cage with either one animal colonized with ASF, one GF animal monocolonized with O. formigenes (GF/OxF), or one animal colonized with ASF plus O. formigenes (ASF/OxF) led to the successful colonization of all four GF mice. After 4 weeks, the animals were housed singly in Nalgene metabolic cages (Teciplast USA, West Chester, PA) for 2 weeks, for the collection of 24-hour samples of feces and urine. At the end of the metabolic cage collections, the mice were euthanized for collection of intestinal contents and tissue. O. formigenes and ASF colonization were confirmed by PCR using DNA isolated from fecal material and cecal contents, as described previously (19, 20). CFU in the GF/OxF group were determined in contents from the stomach, small intestine, cecum, proximal colon, and distal colon. Preformed pellets were removed from the distal colon prior to CFU determination. O. formigenes CFU tightly associated with the cecal mucosa were determined after vortex-mixing of an opened cecum three times (10 s each time) with 25 ml of cold sterile phosphate-buffered saline (PBS) (pH 7.4). To determine O. formigenes CFU, 80 to 100 mg of intestinal material was added to a tube containing approximately 0.5 ml of zirconia beads (0.7 mm in diameter; BioSpec Products Inc., Bartlesville, OK). Sterile PBS (pH 7.4) supplemented with 0.05% cysteine-HCl (0.8 ml) was added to the tube, and the tube was chilled on ice for 5 min. A Mini-BeadBeater-16 (BioSpec Products Inc.) was used to bead beat the samples for 30 s. Serial dilutions of the homogenized intestinal samples were used to determine CFU on solid agar plates, as described previously (19). Plates were incubated at 37°C in anaerobic containers using a GasPak EZ anaerobe container system with indicator sachets (BD Biosciences, San Jose, CA). Quantitative PCR was used to compare cecal O. formigenes numbers between GF/OxF and ASF/OxF mice, as reported previously (21).
Collection of urine and feces.
Mice were housed singly in Nalgene metabolic cages within semirigid isolators, for collection of 24-hour samples of fecal material and urine and determination of dietary oxalate intake. Mice were acclimated for 1 week prior to 1 week of sample collection and had free access to food and water in the metabolic cages. Twenty-four-hour urine samples were collected on 1 ml of mineral oil (to prevent evaporation) and 50 μl of 2% sodium azide (to prevent bacterial growth). Three or four collections of urine and feces were performed for each mouse.
O. formigenes survival in fecal pellets.
Fecal pellets from GF/OxF animals were collected in metabolic cages, over a 3-h period. O. formigenes CFU in whole fecal pellets were determined immediately after the 3-h collection period and after an additional 24-hour incubation in isolators.
Preparation of urine, feces, and intestinal material.
For oxalate measurements, part of the 24-hour urine samples was acidified to a final level of 100 mM HCl, to prevent oxalate crystallization with cold storage and the degradation of ascorbic acid to oxalate. Urine and feces were stored at −80°C. Intestinal material was harvested immediately following metabolic cage collections, to determine O. formigenes CFU. The concentrations of free oxalate and other anions in the cecum were determined by centrifuging fresh cecal contents (∼50 mg) and recovering the cecal water. The remaining cecal contents were lyophilized overnight using a FreeZone 1-liter benchtop freeze-dry system (Labconco Inc., Kansas City, MO), and lyophilized material was used for measurement of total oxalate levels and the isolation of DNA. Fecal material was also lyophilized prior to total oxalate measurements. Total cecal and fecal oxalate levels were determined following homogenization with 2 M HCl at a ratio of 1 part lyophilized sample/9 parts acid (wt/vol).
Analytical assays.
Creatinine levels were measured in nonacidified urine samples with a Medica EasyRA clinical chemistry analyzer. Twenty-four-hour urinary creatinine values were used to identify incomplete collections or overcollections (22). Three to four 24-hour urine samples were collected from each mouse; any urine sample with a creatinine value less than 3.5 μmol or greater than 5.5 μmol was considered to represent an inaccurate collection and was discarded. Oxalate levels were determined in samples by IC, as described previously (21). Urinary calcium levels were determined in acidified urine samples with a Medica EasyRA clinical chemical analyzer, according to the manufacturer's protocol. Ion chromatography-mass spectroscopy (IC-MS) (Thermo Fisher Scientific Inc., Waltham, MA) was used to examine anion concentrations in cecal water and urine. The IC portion involved a Dionex ICS-5000 system fitted with a Dionex ERS 500 anion electrolytically regenerated suppressor and an AS11-HC-4 μm anion exchange column (2 by 150 mm) operated at a controlled temperature of 30°C. A KOH gradient from 0.5 to 80 mM over 60 min, at a flow rate of 0.38 ml/min, was used to separate anions in the samples. A MSQ-PLUS mass detector was operated in negative ion mode with electrospray ionization (ESI), with a needle voltage of 1.5 V, a cone voltage of 30 V, and a temperature of 500°C. The column eluent was mixed with 50% acetonitrile at 0.38 ml/min, using a zero-dead-volume mixing tee, prior to entry into the mass spectrometer. Selected ion monitoring (anion mass − 1) was used to measure anion concentrations in the samples.
DNA isolation.
Cecal contents were harvested from animals after metabolic cage collections, for microbial inventories. Samples were immediately frozen in liquid nitrogen and were stored at −80°C until DNA extraction. DNA was extracted from lyophilized cecal contents using a ZR fecal DNA minikit (Zymo, Irvine, CA), with bead beating.
Sequencing of 16S rRNA.
PCR with unique bar-coded primers was used to amplify the V4 region of the 16S rRNA gene from individual samples, to create an amplicon library (23). The oligonucleotide primers (Eurofins Genomics, Inc., Huntsville, AL) used for PCR amplification of the V4 region of the 16S rRNA gene were as follows: forward V4, 5′-AAT GAT ACG GCG ACC ACC GAG ATC TAC ACT ATG GTA ATT GTG TGC CAG CMG CCG CGG TAA-3′; and reverse V4, 5′-CAA GAG AAG ACG GCA TAC GAG ATN NNN NNA GTC AGT CAG CCG GAC TAC HVG GGT WTC TAA T-3′. Individual PCRs were set up as described by Kumar et al. (23). Cycling conditions for the PCRs were as follows: initial denature at 94°C for 1 min, 32 cycles of 94°C for 30 s, 50°C for 1 min, and 65°C for 1 min, and a final extension at 65°C for 3 min. The entire PCR mixture was electrophoresed on a 1.0% agarose-Tris-borate-EDTA gel. The PCR product (approximately 380 bp) was visualized by UV illumination. The band was excised and purified from the agarose gel using a Qiagen QIAquick gel extraction kit, according to the manufacturer's instructions.
The PCR products were sequenced using the Illumina MiSeq platform (23). Paired-end reads of approximately 250 bp from the V4 region of the 16S rRNA gene were analyzed. The samples were quantitated using Pico Green, adjusted to a concentration of 4 nM, and then used for sequencing with the Illumina MiSeq system (23). FASTQ conversion of the raw data files was performed following demultiplexing. Quality control of the FASTQ files was performed, with quality assessment and filtering using the FASTX toolkit. The rest of the steps were performed using the QIIME suite (version 1.8) (23–25).
The sequence data covered the V4 region of the 16S rRNA gene with a PCR product length of ∼255 bases and 250-bp end reads. Since the overlap between fragments was approximately 245 bases, information from both ends of the paired reads was merged to generate a single high-quality read, using the fastq_mergepairs module of USEARCH (26). Read pairs with an overlap of less than 50 bases or with too many mismatches (>20 mismatches) in the overlap region were discarded. Chimeric sequences were filtered using the identify_chimeric_seqs.py module of USEARCH (26). Overall read quality was assessed before and after filtering using FASTQC. The QIIME data analysis package was used for subsequent 16S rRNA data analysis (27). Sequences were grouped into operational taxonomic units (OTUs) using the clustering program UCLUST, at a similarity threshold of 0.97 (26). The Ribosomal Database Program (RDP) classifier was used to make taxonomic assignments (to the genus and/or species level) for all OTUs, at a confidence threshold of 80% (i.e., 0.8) (28). The RDP classifier was trained using the Greengenes (version 13.8) 16S rRNA database (29). The resulting OTU table included all OTUs, their taxonomic identification, and abundance information. In order to detect ASF in the study, the OTU sequences were matched against the ASF genomes using BLAST. OTUs were assigned ASF identity when 100% full-length identical matches with the ASF genomes were found. OTUs whose average abundance was less than 0.0005% were filtered out. OTUs were then grouped together to summarize taxon abundance at different hierarchical levels of classification (e.g., phylum, class, order, family, genus, and species). Multiple-sequence alignment of OTUs was performed with PyNAST (30). Alpha diversity (diversity within the samples) was calculated using Shannon's diversity matrix, which measures both richness (number of OTUs per species present in a sample) and evenness (relative abundance of different OTUs per species and their even distribution in a sample) (31), as implemented in QIIME (27). Beta diversity (diversity between the samples) was measured using weighted UniFrac analysis (32). Principal-coordinate analysis (PCoA) was performed by QIIME to visualize the dissimilarity matrix for all samples, such that samples that were more similar were closer in space than samples that were more divergent. A three-dimensional PCoA plot was generated using EMPEROR (33).
Statistical analyses.
All graphing and statistical analyses were conducted with GraphPad Prism (version 6) and SAS (version 9.4; SAS Institute, Cary, NC), respectively. Data were not transformed beyond the levels indicated in the figures and the text. Figures report the significance of Tukey's post hoc test after one-way analysis of variance (ANOVA) or simple ANOVA, as described in the figure legends. Data are expressed as means ± standard deviations (SDs) unless otherwise indicated. The criterion for statistical significance was a P value of <0.05.
RESULTS
Colonization with O. formigenes and altered Schaedler flora.
The successful colonization of four GF animals after placement of one artificially colonized ASF, GF/OxF, or ASF/OxF animal in the same cage indicates that colonization likely occurred through fecal-oral transmission. This is consistent with a previous report demonstrating that colonization of rats with O. formigenes occurs primarily through horizontal transmission (7). Analysis of fecal and cecal DNA indicated that all ASF and ASF/OxF animals were colonized with seven of the eight ASF bacterial species. ASF360 (Lactobacillus intestinalis) was not detectable by PCR in any of the animals. The loss of this species with certain diets has been reported previously (34, 35).
Viable O. formigenes numbers in contents harvested from the cecum and proximal colon of GF/OxF mice were ∼4 × 10⁶ CFU per 100 mg of contents (Fig. 1B). Following single housing of GF/OxF mice in metabolic cages, O. formigenes CFU were not present in the small intestine. In contrast, group-housed GF/OxF animals had small numbers of viable O. formigenes both in the stomach and throughout the small intestine (<6 × 10³ CFU per 100 mg of contents). The levels of viable O. formigenes tightly associated with cecal mucosa from GF/OxF mice were 1.2 × 10³ ± 0.51 × 10³ CFU per 100 mg tissue.
Sequencing of 16S rRNA was used to determine the relative abundance of ASF species in ASF and ASF/OxF mice (Fig. 2). Consistent with previous reports, Parabacteroides goldsteinii (ASF519) was the dominant microorganism in the cecum, with Lactobacillus murinus (ASF361) and Clostridium sp. (ASF502) being the next most prevalent organisms (20). The relative abundance of O. formigenes in ASF/OxF animals was ≤0.1%. Principal-coordinate analysis showed that the introduction of O. formigenes resulted in no significant changes in the ASF microbial composition (Fig. 3). O. formigenes cecal cell density was 18% lower in ASF/OxF mice (6.64 ± 0.03 log10 CFU per 100 mg cecal contents) than in GF/OxF animals (6.55 ± 0.07 log10 CFU per 100 mg cecal contents) (P = 0.03); however, a limitation of these experiments was that the ASF/OxF animals ingested 30% less food and thus less dietary oxalate than did the GF/OxF group. Although the findings were not significant, this lower dietary oxalate intake in the ASF/OxF group (Table 1) likely decreased O. formigenes numbers.
FIG 2.
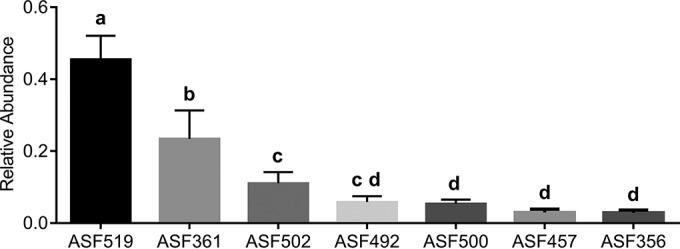
Relative abundances of ASF bacterial species within cecal contents. The relative abundances of ASF bacterial species differed significantly (P < 0.0001; after one-way ANOVA). Different letters indicate the significance (P < 0.05) of Tukey's HSD multiple-comparison tests (after one-way ANOVA). Relative numbers of each ASF bacterial strain can be estimated from our finding that O. formigenes cell densities were approximately ∼4 × 10⁶ CFU per 100 mg cecal contents and O. formigenes represented at most 0.1% of the bacteria in animals with ASF plus O. formigenes. ASF519, Parabacteroides goldsteinii; ASF361, Lactobacillus murinus; ASF502, Clostridium sp.; ASF492, Eubacterium plexicaudatum; ASF500, Pseudoflavonifractor sp.; ASF457, Mucispirillum schaedleri; ASF356, Clostridium sp.
FIG 3.
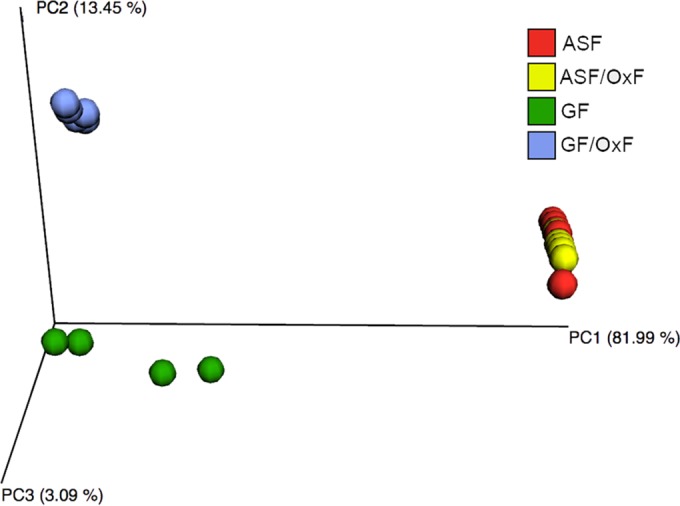
Weighted UniFrac PCoA plot of microbiome samples. The plot shows very similar microbiome profiles for the ASF and ASF/OxF groups. As expected, the GF/OxF and GF groups showed very different microbiome profiles, compared with the ASF group. ASF, altered Schaedler flora; OxF, monocolonized with O. formigenes; GF, germfree.
TABLE 1.
Parameters for GF, GF/OxF, ASF, and ASF/OxF micea
| Parameter | GF (n = 7) | GF/OxF (n = 5) | ASF (n = 7) | ASF/OxF (n = 5) | P |
|---|---|---|---|---|---|
| Body weight (g) | 43.9 ± 1.9 | 39.2 ± 1.7 | 38.2 ± 4.0 | 38.7 ± 4.7 | 0.055 |
| 24-h dietary oxalate intake (μmol) | 32 ± 9 | 37 ± 10 | 30 ± 0.6 | 26 ± 6 | 0.261 |
| 24-h urine volume (ml) | 4.4 ± 1.7 | 3.9 ± 1.7 | 5.3 ± 1.8 | 4.0 ± 2.3 | 0.598 |
| 24-h urinary creatinine level (μmol) | 4.2 ± 0.4 | 4.3 ± 0.6 | 4.0 ± 0.2 | 4.7 ± 0.7 | 0.090 |
| 24-h urinary oxalate level (μmol) | 2.3 ± 0.5 Ab | 2.3 ± 0.3 A | 1.3 ± 1.1 B | 1.0 ± 0.3 B | 0.001 |
| 24-h urinary calcium level (μmol) | 7.8 ± 2.3 A | 19.0 ± 10.0 B | 7.0 ± 2.5 A | 9.5 ± 3.5 A | 0.003 |
| 24-h urinary glycolate level (μmol) | 1.7 ± 0.4 | 2.2 ± 0.3 | 1.9 ± 0.2 | 1.8 ± 0.5 | 0.198 |
| 24-h urinary hippurate level (μmol) | 0.11 ± 0.02 A | 0.14 ± 0.03 A | 0.30 ± 0.06 B | 0.41 ± 0.10 C | 0.001 |
| 24-h urinary gluconate level (μmol) | 4.3 ± 0.8 | 5.6 ± 1.0 | 4.2 ± 0.3 | 4.3 ± 1.0 | 0.100 |
| 24-h urinary sulfate level (μmol) | 68 ± 31 | 102 ± 23 | 80 ± 19 | 81 ± 9 | 0.220 |
| 24-h urinary phosphate level (μmol) | 351 ± 38 A | 472 ± 69 B | 386 ± 58 AB | 373 ± 15 A | 0.005 |
| 24-h urinary citrate level (μmol) | 0.18 ± 0.13 | 0.22 ± 0.06 | 0.21 ± 0.05 | 0.21 ± 0.08 | 0.917 |
Data are expressed as means ± SDs. GF, germfree; OxF, monocolonized with O. formigenes; ASF, altered Schaedler flora. One-way ANOVA was used to determine whether mean values for each parameter differed between the animal groups (P values indicated above), followed by Tukey's HSD test for P values of <0.05.
Different letters (A, B, C) indicate the significance (P < 0.05) of Tukey's HSD multiple-comparison tests among the groups (after one-way ANOVA).
Fecal O. formigenes CFU from GF/OxF animals were used to determine the aerotolerance of O. formigenes. CFU density in fecal pellets declined 4-fold after 24 hours of incubation at room temperature (6.25 ± 0.34 log10 CFU per 100 mg versus 5.55 ± 0.42 log10 CFU per 100 mg) (P = 0.0008).
Oxalate degradation.
Total cecal oxalate levels (Fig. 4) and the recovery of ingested dietary oxalate in fecal matter (Fig. 5) were not significantly different between GF and ASF animals, which is consistent with the seven bacterial ASF species that colonized GF mice in this study lacking known oxalate-degrading genes. Total cecal oxalate levels (Fig. 4) and the recovery of ingested dietary oxalate in fecal matter (Fig. 5) were significantly lower in GF/OxF and ASF/OxF animals than in GF and ASF animals, which suggests efficient degradation of oxalate in the intestine by O. formigenes.
FIG 4.
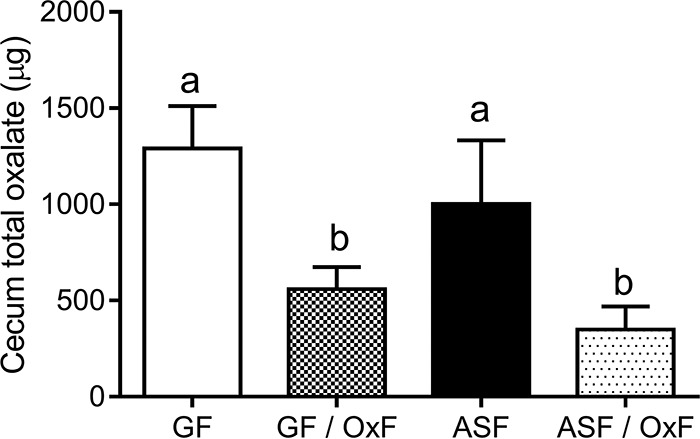
Total oxalate levels in the cecum of mice. GF, germfree; OxF, monocolonized with O. formigenes; ASF, altered Schaedler flora. Absolute cecal oxalate levels between the animal groups differed significantly (P < 0.0001; after one-way ANOVA). Different letters indicate the significance (P < 0.05) of Tukey's HSD multiple-comparison tests (after one-way ANOVA). Total oxalate levels were determined following homogenization of lyophilized material with acid.
FIG 5.
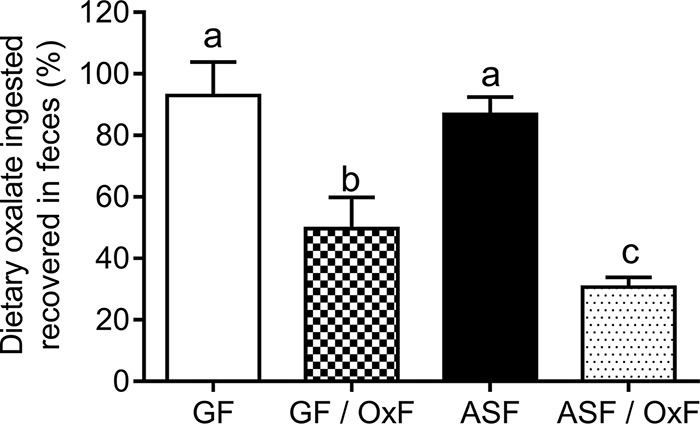
Levels of dietary oxalate recovered in feces over 24 hours. GF, germfree; OxF, monocolonized with O. formigenes; ASF, altered Schaedler flora. The percentages of dietary oxalate ingested that was recovered in feces were significantly different between the animal groups (P < 0.0001; after one-way ANOVA). Different letters indicate the significance (P < 0.05) of Tukey's HSD multiple-comparison tests (after one-way ANOVA).
Urinary excretion.
Urinary parameters measured as part of the metabolic evaluation of kidney stone formers include phosphate, citrate, sulfate, glycolate, oxalate, and calcium levels (36–38). Urinary oxalate, calcium, and phosphate excretion differed significantly between the animal groups (P < 0.001) (Table 1). Colonization of GF or ASF mice with O. formigenes did not result in significant reductions in urinary oxalate excretion. This finding is consistent with our previous study, which showed that urinary oxalate excretion did not decrease with O. formigenes colonization when conventional mice were fed a diet similar to that used in this study (i.e., high calcium and normal oxalate levels) (11). In comparison, ASF or ASF/OxF colonization of GF mice resulted in ∼40% reductions in urinary oxalate excretion. Hippurate is a known bacterial metabolite excreted in urine (39). This study showed that colonization of GF mice with ASF resulted in increased urinary hippurate excretion.
Cecal analyses.
There were significant differences in cecal wet weights between the groups (Table 2). Post hoc analysis showed that the wet weights of ceca from ASF or ASF/OxF animals were significantly lower than those from the GF and GF/OxF groups. These data are consistent with previous studies that showed that GF and monocolonized mice displayed enlarged ceca, whereas colonization of GF mice with ASF resulted in smaller ceca of similar morphology, compared with ceca from conventional mice (16, 40). In keeping with total cecal oxalate levels (Fig. 4), free oxalate levels in the cecum were significantly higher in GF and ASF animals than in GF/OxF and ASF/OxF animals (Table 2). IC-MS was used to identify anions that O. formigenes and ASF might produce in vivo. Formate is an end product of O. formigenes oxalate catabolism (41), and levels were significantly increased in cecal water from GF/OxF animals, compared to all other groups (Table 2). In contrast, cecal formate concentrations were significantly lower in the ASF/OxF group than in the GF/OxF group, which suggests that ASF may degrade the formate produced by O. formigenes. Levels of the short-chain fatty acids propionate, n-butyrate, and valerate were elevated in the ASF and ASF/OxF groups, which is in keeping with a previous report showing that ASF356 and ASF492 produced large amounts of short-chain fatty acids (42). A previous report showed that gluconate levels were lower in intestinal samples from conventional mice versus GF mice (43). In keeping with that previous study, cecal gluconate levels were significantly lower in ASF and ASF/OxF animals than in GF mice (Table 2). However, cecal gluconate levels were higher in GF/OxF mice than in GF animals (P = 0.0004) (Table 2). In vitro culture experiments with SBO were performed with [13C2]oxalate, to investigate whether O. formigenes secreted 13C-labeled gluconate isoptomers into the medium. However, these in vitro experiments did not detect gluconate isoptomers from [13C2]oxalate (data not shown).
TABLE 2.
Cecal water parameters for GF, GF/OxF, ASF, and ASF/OxF micea
| Parameter | GF (n = 7) | GF/OxF (n = 5) | ASF (n = 7) | ASF/OxF (n = 5) | P |
|---|---|---|---|---|---|
| Cecal contents (g) | 2.8 ± 0.4 Ab | 3.0 ± 0.4 A | 1.4 ± 0.4 B | 1.6 ± 0.2 B | <0.0001 |
| Oxalate level (μmol) | 0.74 ± 0.22 A | 0.06 ± 0.02 B | 0.29 ± 0.06 C | 0.04 ± 0.01 B | <0.0001 |
| Gluconate level (μmol) | 1.7 ± 0.2 A | 2.6 ± 0.6 B | 0.16 ± 0.11 C | 0.30 ± 0.06 C | <0.0001 |
| Phosphate level (μmol) | 15.9 ± 9.1 | 12.6 ± 3.1 | 13.7 ± 5. 4 | 17.2 ± 6.2 | 0.69 |
| Formate level (μmol) | 1.3 ± 0.15 A | 2.0 ± 0.5 B | 0.27 ± 0.12 C | 0.58 ± 0.17 C | <0.0001 |
| Acetate level (μmol) | 21.1 ± 6.2 A | 23.3 ± 5.2 A | 11.1 ± 5.1 B | 23.5 ± 2.7 A | 0.001 |
| Propionate level (μmol) | <0.03 A | <0.03 A | 2.7 ± 1.8 AB | 4.1 ± 1.1 BC | <0.0001 |
| n-Butyrate level (μmol) | <0.07 A | <0.07 A | 1.1 ± 1.3 AB | 2.2 ± 0.7 BC | 0.001 |
| Valerate level (μmol) | <0.03 A | <0.03 A | 0.09 ± 0.07 A | 0.22 ± 0.05 B | <0.0001 |
Data are expressed as means ± SDs. GF, germfree; OxF, monocolonized with O. formigenes; ASF, altered Schaedler flora. One-way ANOVA was used to determine whether mean values for each parameter differed between the animal groups (P values indicated above), followed by Tukey's HSD test for P values of <0.05. The level of each cecal anion was determined following centrifugation of freshly harvested cecal contents and recovery of the cecal water. Anions were measured by IC-MS.
Different letters (A, B, C) indicate the significance (P < 0.05) of Tukey's HSD multiple-comparison tests among the groups (after one-way ANOVA).
DISCUSSION
Recent evidence suggests that a lack of colonization with the specialist oxalate-degrading bacterium O. formigenes increases the risk of recurrent calcium oxalate stone disease (1, 2). Protection from calcium oxalate stone disease appears to be due to the oxalate degradation that occurs in the gut with low-calcium diets, with a possible additional contribution from intestinal oxalate secretion (13, 21, 44). Despite its potential clinical significance, little is known about the factors that influence O. formigenes colonization and host-O. formigenes interactions. We showed previously, with conventional mice, that the ratio of calcium to oxalate in the diet was important in determining colonization densities and conditions under which urinary oxalate excretion and fecal oxalate excretion were modified (11), and findings were consistent with studies we performed with naturally colonized and noncolonized human subjects (21). In the present study, we utilized GF mice to examine O. formigenes-altered Schaedler flora interactions and the response to monocolonization with O. formigenes.
Colonization of germfree mice with O. formigenes.
It has been demonstrated that stable monocolonization with at least some strictly anaerobic bacteria in germfree mice appears to require the presence of other bacteria to reduce the oxidation-reduction potential of the intestinal contents (45), which is relatively high in germfree animals (15). However, GF mice remained monocolonized with O. formigenes, which suggests that O. formigenes does not require other organisms to reduce its environment. It is known that several anaerobic bacteria show oxygen tolerance and possess systems to respond to oxygen (46–48). In this study, we demonstrated that O. formigenes survives in fecal pellets excreted from animals monocolonized with O. formigenes, which is consistent with our recent finding that O. formigenes survives in static broth cultures exposed to the air (49). Of note, the genomes of two O. formigenes strains (50) and the proteome of O. formigenes OxCC13 (51) contain superoxide dismutase, which may play a key role in the survival of O. formigenes during periods of oxygen exposure. The ability of O. formigenes to tolerate exposure to air is likely an important biological property through which this organism colonizes mammals via horizontal transmission, and it also may play an important role in the successful manufacture of O. formigenes as a probiotic.
Intestinal microbiota occupy both mucosal and luminal niches during normal colonization (52–56). To limit the impact of coprophagy on the intestinal distribution of O. formigenes, animals in this study were housed singly in metabolic cages for 2 weeks prior to determination of viable O. formigenes cell numbers. O. formigenes colonized the cecum and colon of GF/OxF mice but not the small intestine. O. formigenes may be lacking in the small intestine of mice because O. formigenes cannot adhere to the small intestinal mucosa and the oxygen tension in the small intestine is too high for O. formigenes to survive. Interestingly, group-housed GF/OxF animals had small numbers of viable O. formigenes organisms throughout the gastrointestinal tract. This finding not only highlights the coprophagic behavior of group-housed mice in regular cages but also supports previous in vitro reports showing that O. formigenes tolerates exposure to acid and bile (3, 49).
Examination of intestinal tissue from GF/OxF mice suggested that ∼0.02% of total viable O. formigenes cells in the cecum were tightly associated with the mucosa. Consistent with this finding, a previous report showed that the number of Bacteroides fragilis cells closely associated with the intestinal mucosa represented only a tiny fraction (<0.001%) of the total CFU (55). The same study, using immunofluorescence confocal microscopy, revealed microcolonies of B. fragilis residing within colonic crypts (55). The authors suggested that such a mucosal niche may represent an important population of cells that maintain host-bacterium symbiosis at the epithelial surface of the gut. Further studies to examine the association of O. formigenes with the intestinal mucosa are needed; however, given the limitations of germfree animal models (57, 58), future experiments should use conventional animals with normal intestinal physiology and microbiota. Furthermore, developing antibodies to O. formigenes or engineering O. formigenes to express fluorescent proteins should allow a closer examination of O. formigenes-mucosa interactions. A better understanding of O. formigenes-mucosa interactions may shed light on the mechanisms by which O. formigenes influences the secretion of oxalate into the intestinal lumen.
ASF-O. formigenes interactions.
To date, no studies have examined the impact of O. formigenes on resident microbiota. This is of particular importance because there is an interest in manufacturing O. formigenes as a probiotic that can decrease oxalate levels in the body while not disrupting the composition of the healthy resident microbiota. For example, whether the ingestion of high oral doses of O. formigenes is safe and promotes sufficient intestinal oxalate secretion to diminish the oxalate burden on the kidney in individuals with primary hyperoxaluria is currently being tested in a clinical trial financed by the biopharmaceutical company OxThera AB. In this study, we used ion chromatography coupled with mass spectroscopy and 16S rRNA profiling of ASF mouse models to show that O. formigenes did not disrupt the overall microbial composition of ASF but significantly reduced oxalate levels in the cecum. Although ASF gnotobiotic mice provide a well-defined model, with normalized intestinal physiology, for the study of host-microbe and microbe-microbe interactions (16), they contain a limited set of bacterial species and, in this study, also lacked the ability to degrade oxalate. Thus, further work examining the interactions between O. formigenes and non-oxalate-degrading and oxalate-degrading microbes in animal models with greater microbial diversity is warranted.
Effects of ASF and O. formigenes on cecal and urinary oxalate levels.
Germfree animals have very altered gut physiology, including an enlarged cecum and altered absorptive function (59). Germfree rats, for example, show increased absorption of minerals, including calcium (60), and are susceptible to forming calcium oxalate-containing stones in the bladder (61). In contrast, ASF mice have normal-size ceca and normalized intestinal functions (16). It is possible that improved intestinal epithelial integrity in ASF and ASF/OxF mice, compared to GF and GF/OxF animals, resulted in lower net gastrointestinal oxalate absorption, which in turn could explain the lower levels of urinary oxalate excretion in ASF and ASF/OxF animals than in GF and GF/OxF animals.
Studies in rats (10, 12) and mice (11, 14), performed by different investigators, showed that O. formigenes colonization reduces urinary oxalate excretion. This effect appears to occur only with diets rich in soluble oxalate, although differences in intestinal physiology and microbial populations among the various rodent models studied to date might have influenced the findings. In the present study, which used normal rodent chow, O. formigenes colonization of GF or ASF mice did not result in a reduction in urinary oxalate excretion; this was expected, however, because our previous mouse study showed that urinary oxalate excretion did not decrease following artificial O. formigenes colonization of conventional mice fed normal rodent chow containing a high level of calcium and a low level of soluble oxalate (11). In light of the abnormal gastrointestinal physiology of GF mice and the extensive dietary studies we have already performed in a conventional mouse model of O. formigenes colonization, we did not define the dietary conditions that result in reductions in urinary oxalate excretion following O. formigenes colonization of GF and ASF mice.
IC-MS was used to identify anions that O. formigenes and ASF may produce in vivo. As described in more detail in Results, these studies show that ASF degrades formate and gluconate and produces short-chain fatty acids and benzoic acid (with the appearance of hippurate in the urine). Gluconic acid levels were significantly elevated in the GF/OxF group, compared to GF animals; however, further work is needed to determine whether the increased gluconic acid levels in the cecum of GF/OxF mice are derived from the host or brought about by O. formigenes metabolic processes. Of interest, gluconic acid is thought to play a predominant role in the phosphate crystal solubilization activity of Pseudomonas fluorescens (62). Does O. formigenes use a similar approach to facilitate the solubilization of oxalate-containing crystals in vivo? Our determinations of both total and free oxalate levels indicated that 86% of the oxalate in the chow diet is crystalline. Under such conditions, it would be advantageous for O. formigenes to have the ability to facilitate solubilization of dietary crystalline oxalate. Previous rodent studies suggested that oxalate-degrading organisms degrade calcium oxalate crystals (63, 64); however, the mechanism by which this occurs is not known. In this study, O. formigenes-monocolonized mice excreted significantly more urinary calcium and phosphate than did germfree mice, which might be due to degradation of calcium oxalate and calcium phosphate crystals by O. formigenes and subsequent intestinal absorption of free calcium and phosphate. Further work to explore the dynamics of crystal formation and degradation in the intestines of germfree mice and to determine how O. formigenes influences this process is of interest in light of these findings.
In conclusion, these studies with mice with defined flora demonstrate several significant new findings, as follows. (i) O. formigenes human strain OxCC13 can colonize germfree mice receiving their regular diets; therefore, future studies with models using mice with defined flora may be useful for further characterizing host-O. formigenes and microbe-O. formigenes interactions. (ii) O. formigenes does not disrupt ASF colonization and ASF colonization does not disrupt the oxalate-degrading capacity of O. formigenes in the intestine, which supports the use of O. formigenes as a probiotic. (iii) O. formigenes may degrade oxalate crystals (the predominant form of oxalate in the gut), and a small number of O. formigenes organisms associate tightly with the gut epithelium, which may be important mechanisms by which these organisms persist in the host.
ACKNOWLEDGMENTS
This work was supported by NIH grant DK087967. The following are acknowledged for their support of the Microbiome Resource at the University of Alabama at Birmingham: School of Medicine, Comprehensive Cancer Center (grant P30AR050948), Center for AIDS Research (grant 5P30AI027767), and Center for Clinical and Translational Science (grant UL1TR001417).
We thank Song Lian Zhou and Zhixin Wang in the Department of Urology and Stacey Sinclair and Billie Parsons in the UAB Gnotobiotic Facility for technical assistance.
We declare no conflicts of interest, financial or otherwise.
Funding Statement
This work was funded as follows: National Institutes of Health (NIH)/DK087967/John Knight, NIH/P30AR050948/Edward Partridge, NIH/UL1TR000165/Robert Kimberly, and NIH/5P30AI027767/Michael Saag.
REFERENCES
- 1.Kaufman DW, Kelly JP, Curhan GC, Anderson TE, Dretler SP, Preminger GM, Cave DR. 2008. Oxalobacter formigenes may reduce the risk of calcium oxalate kidney stones. J Am Soc Nephrol 19:1197–1203. doi: 10.1681/ASN.2007101058. [DOI] [PMC free article] [PubMed] [Google Scholar]
- 2.Siener R, Bangen U, Sidhu H, Honow R, von Unruh G, Hesse A. 2013. The role of Oxalobacter formigenes colonization in calcium oxalate stone disease. Kidney Int 83:1144–1149. doi: 10.1038/ki.2013.104. [DOI] [PubMed] [Google Scholar]
- 3.Duncan SH, Richardson AJ, Kaul P, Holmes RP, Allison MJ, Stewart CS. 2002. Oxalobacter formigenes and its potential role in human health. Appl Environ Microbiol 68:3841–3847. doi: 10.1128/AEM.68.8.3841-3847.2002. [DOI] [PMC free article] [PubMed] [Google Scholar]
- 4.Hoppe B, Beck B, Gatter N, von Unruh G, Tischer A, Hesse A, Laube N, Kaul P, Sidhu H. 2006. Oxalobacter formigenes: a potential tool for the treatment of primary hyperoxaluria type 1. Kidney Int 70:1305–1311. doi: 10.1038/sj.ki.5001707. [DOI] [PubMed] [Google Scholar]
- 5.Hoppe B, von Unruh G, Laube N, Hesse A, Sidhu H. 2005. Oxalate degrading bacteria: new treatment option for patients with primary and secondary hyperoxaluria? Urol Res 33:372–375. doi: 10.1007/s00240-005-0497-z. [DOI] [PubMed] [Google Scholar]
- 6.Sidhu H, Yenatska L, Ogden SD, Allison MJ, Peck AB. 1997. Natural colonization of children in the Ukraine with the intestinal bacterium, Oxalobacter formigenes, using a PCR-based detection system. Mol Diagn 2:89–97. doi: 10.1016/S1084-8592(97)80015-X. [DOI] [PubMed] [Google Scholar]
- 7.Cornelius JG, Peck AB. 2004. Colonization of the neonatal rat intestinal tract from environmental exposure to the anaerobic bacterium Oxalobacter formigenes. J Med Microbiol 53:249–254. doi: 10.1099/jmm.0.05418-0. [DOI] [PubMed] [Google Scholar]
- 8.Weaver GA, Krause JA, Allison MJ, Lindenbaum J. 1992. Distribution of digoxin-reducing, oxalate-degrading, and total anaerobic bacteria in the human colon. Microb Ecol Health Dis 5:227–234. doi: 10.3109/08910609209141590. [DOI] [Google Scholar]
- 9.Daniel SL, Hartman PA, Allison MJ. 1987. Intestinal colonization of laboratory rats with Oxalobacter formigenes. Appl Environ Microbiol 53:2767–2770. [DOI] [PMC free article] [PubMed] [Google Scholar]
- 10.Hatch M, Cornelius J, Allison M, Sidhu H, Peck A, Freel RW. 2006. Oxalobacter sp. reduces urinary oxalate excretion by promoting enteric oxalate secretion. Kidney Int 69:691–698. doi: 10.1038/sj.ki.5000162. [DOI] [PubMed] [Google Scholar]
- 11.Li X, Ellis ML, Knight J. 2015. Oxalobacter formigenes colonization and oxalate dynamics in a mouse model. Appl Environ Microbiol 81:5048–5054. doi: 10.1128/AEM.01313-15. [DOI] [PMC free article] [PubMed] [Google Scholar]
- 12.Sidhu H, Allison MJ, Chow JM, Clark A, Peck AB. 2001. Rapid reversal of hyperoxaluria in a rat model after probiotic administration of Oxalobacter formigenes. J Urol 166:1487–1491. doi: 10.1016/S0022-5347(05)65817-X. [DOI] [PubMed] [Google Scholar]
- 13.Hatch M, Freel RW. 2013. A human strain of Oxalobacter (HC-1) promotes enteric oxalate secretion in the small intestine of mice and reduces urinary oxalate excretion. Urolithiasis 41:379–384. doi: 10.1007/s00240-013-0601-8. [DOI] [PMC free article] [PubMed] [Google Scholar]
- 14.Hatch M, Gjymishka A, Salido EC, Allison MJ, Freel RW. 2011. Enteric oxalate elimination is induced and oxalate is normalized in a mouse model of primary hyperoxaluria following intestinal colonization with Oxalobacter. Am J Physiol Gastrointest Liver Physiol 300:G461–G469. doi: 10.1152/ajpgi.00434.2010. [DOI] [PMC free article] [PubMed] [Google Scholar]
- 15.Gordon HA. 1968. Is the germ free animal normal? A review of its abnormalities in young and old age, p 127–150. In Coates ME. (ed), The germ free animal in research. Academic Press, New York, NY. [Google Scholar]
- 16.Wymore Brand M, Wannemuehler MJ, Phillips GJ, Proctor A, Overstreet AM, Jergens AE, Orcutt RP, Fox JG. 2015. The altered Schaedler flora: continued applications of a defined murine microbial community. ILAR J 56:169–178. doi: 10.1093/ilar/ilv012. [DOI] [PMC free article] [PubMed] [Google Scholar]
- 17.Knight J, Assimos DG, Callahan MF, Holmes RP. 2011. Metabolism of primed, constant infusions of [1,2-13C2]glycine and [1-13C1]phenylalanine to urinary oxalate. Metabolism 60:950–956. doi: 10.1016/j.metabol.2010.09.002. [DOI] [PMC free article] [PubMed] [Google Scholar]
- 18.Ge Z, Feng Y, Taylor NS, Ohtani M, Polz MF, Schauer DB, Fox JG. 2006. Colonization dynamics of altered Schaedler flora is influenced by gender, aging, and Helicobacter hepaticus infection in the intestines of Swiss Webster mice. Appl Environ Microbiol 72:5100–5103. doi: 10.1128/AEM.01934-05. [DOI] [PMC free article] [PubMed] [Google Scholar]
- 19.Ellis ML, Shaw KJ, Jackson SB, Daniel SL, Knight J. 2015. Analysis of commercial kidney stone probiotic supplements. Urology 85:517–521. doi: 10.1016/j.urology.2014.11.013. [DOI] [PMC free article] [PubMed] [Google Scholar]
- 20.Sarma-Rupavtarm RB, Ge Z, Schauer DB, Fox JG, Polz MF. 2004. Spatial distribution and stability of the eight microbial species of the altered Schaedler flora in the mouse gastrointestinal tract. Appl Environ Microbiol 70:2791–2800. doi: 10.1128/AEM.70.5.2791-2800.2004. [DOI] [PMC free article] [PubMed] [Google Scholar]
- 21.Jiang J, Knight J, Easter LH, Neiberg R, Holmes RP, Assimos DG. 2011. Impact of dietary calcium and oxalate, and Oxalobacter formigenes colonization on urinary oxalate excretion. J Urol 186:135–139. doi: 10.1016/j.juro.2011.03.006. [DOI] [PMC free article] [PubMed] [Google Scholar]
- 22.Bingham SA, Cummings JH. 1985. The use of creatinine output as a check on the completeness of 24-hour urine collections. Hum Nutr Clin Nutr 39:343–353. [PubMed] [Google Scholar]
- 23.Kumar R, Eipers P, Little RB, Crowley M, Crossman DK, Lefkowitz EJ, Morrow CD. 2014. Getting started with microbiome analysis: sample acquisition to bioinformatics. Curr Protoc Hum Genet 82:18.8.1–18.8.29. doi: 10.1002/0471142905.hg1808s82. [DOI] [PMC free article] [PubMed] [Google Scholar]
- 24.Lozupone CA, Hamady M, Kelley ST, Knight R. 2007. Quantitative and qualitative beta diversity measures lead to different insights into factors that structure microbial communities. Appl Environ Microbiol 73:1576–1585. doi: 10.1128/AEM.01996-06. [DOI] [PMC free article] [PubMed] [Google Scholar]
- 25.Navas-Molina JA, Peralta-Sanchez JM, Gonzalez A, McMurdie PJ, Vazquez-Baeza Y, Xu Z, Ursell LK, Lauber C, Zhou H, Song SJ, Huntley J, Ackermann GL, Berg-Lyons D, Holmes S, Caporaso JG, Knight R. 2013. Advancing our understanding of the human microbiome using QIIME. Methods Enzymol 531:371–444. doi: 10.1016/B978-0-12-407863-5.00019-8. [DOI] [PMC free article] [PubMed] [Google Scholar]
- 26.Edgar RC. 2010. Search and clustering orders of magnitude faster than BLAST. Bioinformatics 26:2460–2461. doi: 10.1093/bioinformatics/btq461. [DOI] [PubMed] [Google Scholar]
- 27.Caporaso JG, Kuczynski J, Stombaugh J, Bittinger K, Bushman FD, Costello EK, Fierer N, Pena AG, Goodrich JK, Gordon JI, Huttley GA, Kelley ST, Knights D, Koenig JE, Ley RE, Lozupone CA, McDonald D, Muegge BD, Pirrung M, Reeder J, Sevinsky JR, Turnbaugh PJ, Walters WA, Widmann J, Yatsunenko T, Zaneveld J, Knight R. 2010. QIIME allows analysis of high-throughput community sequencing data. Nat Methods 7:335–336. doi: 10.1038/nmeth.f.303. [DOI] [PMC free article] [PubMed] [Google Scholar]
- 28.Wang Q, Garrity GM, Tiedje JM, Cole JR. 2007. Naive Bayesian classifier for rapid assignment of rRNA sequences into the new bacterial taxonomy. Appl Environ Microbiol 73:5261–5267. doi: 10.1128/AEM.00062-07. [DOI] [PMC free article] [PubMed] [Google Scholar]
- 29.McDonald D, Price MN, Goodrich J, Nawrocki EP, DeSantis TZ, Probst A, Andersen GL, Knight R, Hugenholtz P. 2012. An improved Greengenes taxonomy with explicit ranks for ecological and evolutionary analyses of bacteria and archaea. ISME J 6:610–618. doi: 10.1038/ismej.2011.139. [DOI] [PMC free article] [PubMed] [Google Scholar]
- 30.Caporaso JG, Bittinger K, Bushman FD, DeSantis TZ, Andersen GL, Knight R. 2010. PyNAST: a flexible tool for aligning sequences to a template alignment. Bioinformatics 26:266–267. doi: 10.1093/bioinformatics/btp636. [DOI] [PMC free article] [PubMed] [Google Scholar]
- 31.Jost L. 2007. Partitioning diversity into independent alpha and beta components. Ecology 88:2427–2439. doi: 10.1890/06-1736.1. [DOI] [PubMed] [Google Scholar]
- 32.Lozupone C, Hamady M, Knight R. 2006. UniFrac: an online tool for comparing microbial community diversity in a phylogenetic context. BMC Bioinformatics 7:371. doi: 10.1186/1471-2105-7-371. [DOI] [PMC free article] [PubMed] [Google Scholar]
- 33.Vazquez-Baeza Y, Pirrung M, Gonzalez A, Knight R. 2013. EMPeror: a tool for visualizing high-throughput microbial community data. GigaScience 2:16. doi: 10.1186/2047-217X-2-16. [DOI] [PMC free article] [PubMed] [Google Scholar]
- 34.Dubos R, Schaedler RW, Costello R, Hoet P. 1965. Indigenous, normal, and autochthonous flora of the gastrointestinal tract. J Exp Med 122:67–76. doi: 10.1084/jem.122.1.67. [DOI] [PMC free article] [PubMed] [Google Scholar]
- 35.Dubos RJ, Schaedler RW. 1962. The effect of diet on the fecal bacterial flora of mice and on their resistance to infection. J Exp Med 115:1161–1172. doi: 10.1084/jem.115.6.1161. [DOI] [PMC free article] [PubMed] [Google Scholar]
- 36.Han H, Segal AM, Seifter JL, Dwyer JT. 2015. Nutritional management of kidney stones (nephrolithiasis). Clin Nutr Res 4:137–152. doi: 10.7762/cnr.2015.4.3.137. [DOI] [PMC free article] [PubMed] [Google Scholar]
- 37.Knight J, Jiang J, Assimos DG, Holmes RP. 2006. Hydroxyproline ingestion and urinary oxalate and glycolate excretion. Kidney Int 70:1929–1934. doi: 10.1038/sj.ki.5001906. [DOI] [PMC free article] [PubMed] [Google Scholar]
- 38.Liebow A, Li X, Racie T, Hettinger J, Bettencourt BR, Najafian N, Haslett P, Fitzgerald K, Holmes RP, Erbe D, Querbes W, Knight J. 2016. An investigational RNAi therapeutic targeting glycolate oxidase reduces oxalate production in models of primary hyperoxaluria. J Am Soc Nephrol doi: 10.1681/ASN.2016030338. [DOI] [PMC free article] [PubMed] [Google Scholar]
- 39.Wheeler LA, Halula M, DeMeo M, Sutter VL, Finegold SM. 1979. Metabolism of shikimic, quinic, and cyclohexanecarboxylic acids in germfree, conventional, and gnotobiotic rats. Curr Microbiol 2:85–90. doi: 10.1007/BF02603061. [DOI] [Google Scholar]
- 40.Loesche WJ. 1969. Effect of bacterial contamination on cecal size and cecal contents of gnotobiotic rodents. J Bacteriol 99:520–526. [DOI] [PMC free article] [PubMed] [Google Scholar]
- 41.Anantharam V, Allison MJ, Maloney PC. 1989. Oxalate:formate exchange: the basis for energy coupling in Oxalobacter. J Biol Chem 264:7244–7250. [PubMed] [Google Scholar]
- 42.Smith PM, Howitt MR, Panikov N, Michaud M, Gallini CA, Bohlooly YM, Glickman JN, Garrett WS. 2013. The microbial metabolites, short-chain fatty acids, regulate colonic Treg cell homeostasis. Science 341:569–573. doi: 10.1126/science.1241165. [DOI] [PMC free article] [PubMed] [Google Scholar]
- 43.Matsumoto M, Kibe R, Ooga T, Aiba Y, Kurihara S, Sawaki E, Koga Y, Benno Y. 2012. Impact of intestinal microbiota on intestinal luminal metabolome. Sci Rep 2:233. doi: 10.1038/srep00233. [DOI] [PMC free article] [PubMed] [Google Scholar]
- 44.Hoppe B, Dittlich K, Fehrenbach H, Plum G, Beck BB. 2011. Reduction of plasma oxalate levels by oral application of Oxalobacter formigenes in 2 patients with infantile oxalosis. Am J Kidney Dis 58:453–455. doi: 10.1053/j.ajkd.2011.05.012. [DOI] [PubMed] [Google Scholar]
- 45.Syed SA, Abrams GD, Freter R. 1970. Efficiency of various intestinal bacteria in assuming normal functions of enteric flora after association with germ-free mice. Infect Immun 2:376–386. [DOI] [PMC free article] [PubMed] [Google Scholar]
- 46.Rocha ER, Selby T, Coleman JP, Smith CJ. 1996. Oxidative stress response in an anaerobe, Bacteroides fragilis: a role for catalase in protection against hydrogen peroxide. J Bacteriol 178:6895–6903. [DOI] [PMC free article] [PubMed] [Google Scholar]
- 47.Lemos RS, Gomes CM, Santana M, LeGall J, Xavier AV, Teixeira M. 2001. The ‘strict’ anaerobe Desulfovibrio gigas contains a membrane-bound oxygen-reducing respiratory chain. FEBS Lett 496:40–43. doi: 10.1016/S0014-5793(01)02399-7. [DOI] [PubMed] [Google Scholar]
- 48.Fournier M, Zhang Y, Wildschut JD, Dolla A, Voordouw JK, Schriemer DC, Voordouw G. 2003. Function of oxygen resistance proteins in the anaerobic, sulfate-reducing bacterium Desulfovibrio vulgaris Hildenborough. J Bacteriol 185:71–79. doi: 10.1128/JB.185.1.71-79.2003. [DOI] [PMC free article] [PubMed] [Google Scholar]
- 49.Ellis ML, Dowell AE, Li X, Knight J. 2016. Probiotic properties of Oxalobacter formigenes: an in vitro examination. Arch Microbiol doi: 10.1007/s00203-016-1272-y. [DOI] [PMC free article] [PubMed] [Google Scholar]
- 50.Knight J, Deora R, Assimos DG, Holmes RP. 2013. The genetic composition of Oxalobacter formigenes and its relationship to colonization and calcium oxalate stone disease. Urolithiasis 41:187–196. doi: 10.1007/s00240-013-0566-7. [DOI] [PMC free article] [PubMed] [Google Scholar]
- 51.Ellis ME, Mobley JA, Holmes RP, Knight J. 2016. Proteome dynamics of the specialist oxalate degrader. J Proteomics Bioinform 9:19–24. [DOI] [PMC free article] [PubMed] [Google Scholar]
- 52.Freter R, Brickner H, Botney M, Cleven D, Aranki A. 1983. Mechanisms that control bacterial populations in continuous-flow culture models of mouse large intestinal flora. Infect Immun 39:676–685. [DOI] [PMC free article] [PubMed] [Google Scholar]
- 53.Freter R, Brickner H, Fekete J, Vickerman MM, Carey KE. 1983. Survival and implantation of Escherichia coli in the intestinal tract. Infect Immun 39:686–703. [DOI] [PMC free article] [PubMed] [Google Scholar]
- 54.Freter R, Stauffer E, Cleven D, Holdeman LV, Moore WE. 1983. Continuous-flow cultures as in vitro models of the ecology of large intestinal flora. Infect Immun 39:666–675. [DOI] [PMC free article] [PubMed] [Google Scholar]
- 55.Round JL, Lee SM, Li J, Tran G, Jabri B, Chatila TA, Mazmanian SK. 2011. The Toll-like receptor 2 pathway establishes colonization by a commensal of the human microbiota. Science 332:974–977. doi: 10.1126/science.1206095. [DOI] [PMC free article] [PubMed] [Google Scholar]
- 56.Sonnenburg JL, Xu J, Leip DD, Chen CH, Westover BP, Weatherford J, Buhler JD, Gordon JI. 2005. Glycan foraging in vivo by an intestine-adapted bacterial symbiont. Science 307:1955–1959. doi: 10.1126/science.1109051. [DOI] [PubMed] [Google Scholar]
- 57.Lesher S, Walburg HE Jr, Sacher GA Jr. 1964. Generation cycle in the duodenal crypt cells of germ-free and conventional mice. Nature 202:884–886. doi: 10.1038/202884a0. [DOI] [PubMed] [Google Scholar]
- 58.Thompson GR, Trexler PC. 1971. Gastrointestinal structure and function in germ-free or gnotobiotic animals. Gut 12:230–235. doi: 10.1136/gut.12.3.230. [DOI] [PMC free article] [PubMed] [Google Scholar]
- 59.Smith K, McCoy KD, Macpherson AJ. 2007. Use of axenic animals in studying the adaptation of mammals to their commensal intestinal microbiota. Semin Immunol 19:59–69. doi: 10.1016/j.smim.2006.10.002. [DOI] [PubMed] [Google Scholar]
- 60.Reddy BS, Pleasants JR, Wostmann BS. 1969. Effect of intestinal microflora on calcium, phosphorus and magnesium metabolism in rats. J Nutr 99:353–362. [DOI] [PubMed] [Google Scholar]
- 61.Gustafsson BE, Norman A. 1962. Urinary calculi in germfree rats. J Exp Med 116:273–284. doi: 10.1084/jem.116.3.273. [DOI] [PMC free article] [PubMed] [Google Scholar]
- 62.de Werra P, Pechy-Tarr M, Keel C, Maurhofer M. 2009. Role of gluconic acid production in the regulation of biocontrol traits of Pseudomonas fluorescens CHA0. Appl Environ Microbiol 75:4162–4174. doi: 10.1128/AEM.00295-09. [DOI] [PMC free article] [PubMed] [Google Scholar]
- 63.Palgi N, Ronen Z, Pinshow B. 2008. Oxalate balance in fat sand rats feeding on high and low calcium diets. J Comp Physiol B 178:617–622. doi: 10.1007/s00360-008-0252-1. [DOI] [PubMed] [Google Scholar]
- 64.Shirley EK, Schmidt-Nielsen K. 1967. Oxalate metabolism in the pack rat, sand rat, hamster and white rat. J Nutr 91:496–502. [DOI] [PubMed] [Google Scholar]