

ABSTRACT
Rhinovirus (RV) species A and C are the most frequent cause of respiratory viral illness worldwide, and RV-C has been linked to more severe exacerbations of asthma in young children. Little is known about the immune responses to the different RV species, although studies comparing IgG1 antibody titers found impaired antibody responses to RV-C. Therefore, the aim of this study was to assess whether T-cell immunity to RV-C is similarly impaired. We measured T-cell proliferation to overlapping synthetic peptides covering the entire VP1 capsid protein of an RV-A and RV-C genotype for 20 healthy adult donors. Human leukocyte antigen (HLA) was typed in all the donors in order to investigate possible associations between the HLA type and RV peptide recognition. Total and specific IgG1 antibody titers to the VP1 proteins of both RV-A and RV-C were also measured to examine associations between the antibody and T-cell responses. We identified T-cell epitopes that are specific to and representative of each RV-A and RV-C species. These epitopes stimulated CD4+-specific T-cell proliferation, with similar magnitudes of response for both RV species. All the donors, independent of their HLA-DR or -DQ type, were able to recognize the immunodominant RV-A and -C regions of VP1. Furthermore, the presence or absence of specific antibody titers was not related to changes in T-cell recognition. Our results indicate a dissociation between the antibody and T-cell responses to rhinoviruses. The species-representative T-cell epitopes identified in this study are valuable tools for future studies investigating T-cell responses to the different RV species.
IMPORTANCE Rhinoviruses (RVs) are mostly associated with the common cold and asthma exacerbations, although their contributions to most upper and lower respiratory tract diseases have increasingly been reported. Species C (RV-C) has been associated with more frequent and severe asthma exacerbations in young children and, along with RV-A, is the most clinically relevant species. Little is known about how our immune system responds to rhinoviruses, and there are limited tools to study specific adaptive immunity against each rhinovirus species. In this study, we identified immunodominant T-cell epitopes of the VP1 proteins of RV-A and RV-C, which are representative of each species. The study found that T-cell responses to RV-A and RV-C were of similar magnitudes, in contrast with previous findings showing RV-C-specific antibody responses were low. These findings will provide the basis for future studies on the immune response to rhinoviruses and can help elucidate the mechanisms of severity of rhinovirus-induced infections.
INTRODUCTION
It is now established that infections by rhinoviruses are important causes of asthma exacerbations (1) and lower respiratory tract disease (2). Rhinovirus-induced upper and lower respiratory tract infections have mostly been due to two of the three rhinovirus species, rhinovirus A (RV-A) and rhinovirus C (RV-C). Although the two species share similar virion structures (3), genomic organizations (4, 5), and diversities of genotypes (4–6), they present considerable sequence disparity and different abilities to be cultured in vitro. Furthermore, while most RV-A isolates use the endothelial and immune cell receptor ICAM-1, RV-C uses the cadherin-related family member 3 (CDHR3) receptor found on epithelial cells (7). The receptor usage might confer fundamental differences, especially since CDHR3 is constitutively expressed on bronchial epithelial cells and is downregulated in both asthma and rhinovirus infections (8), while ICAM-1 is poorly expressed by bronchial epithelium and is upregulated in asthma (9) and by some cytokines (i.e., tumor necrosis factor alpha [TNF-α]).
RV-A and -C have been found to circulate among children with similar prevalences (10–12). Furthermore, both species are important causes of asthma exacerbation and lower respiratory tract disease. However, there is evidence from pediatric samples from emergency departments for asthma exacerbations (13) and from longitudinal studies of children of sufficient age to have developed aeroallergy (2) that RV-C has a greater association with asthma exacerbations than RV-A. Nevertheless, genotyping of RV isolates from hospitalized young children admitted with other types of acute respiratory disease has shown conflicting results for the comparative clinical importance of each species (5).
Studies of the serum IgG antibody titers to the VP1 capsid protein of rhinoviruses have demonstrated a striking difference between the immune recognition levels of the two species. While the antibodies that bound the RV-C antigen were almost entirely, or often completely, cross-reactive with RV-A, there were high titers of anti-RV-A antibodies that did not cross-react with RV-C or other enteroviruses (14, 15). This pattern was found in both healthy and asthmatic subjects, including asthmatic children admitted to the hospital following a recent RV-C infection (15). It was proposed that the lack of antibodies specific for RV-C might result from an overall poor immune response, perhaps due to an evolved immunological “stealth mechanism” of the virus or from an “original antigenic sin” phenomenon, where the serological specificity is modulated by prior responses to a cross-reacting virus, namely, RV-A. Therefore, the aim of this study was to ascertain if T-cell responses specific for RV-A and RV-C could be identified and further compared by epitope mapping using synthetic peptides to target both species. We identified immunodominant T-cell epitopes in the VP1 capsid protein that were representative of each species and stimulated proliferative responses of similar magnitudes for both RV-A and -C. Furthermore, there was no association between the magnitude of the RV-C-specific T-cell response and the presence of antibodies specific for RV-C, suggesting dissociation of humoral from T-cell responses during a rhinovirus infection.
MATERIALS AND METHODS
Donors.
Blood and saliva samples were collected from 20 healthy donors (9 males and 11 females) aged 22 to 60 years (mean age, 33 years) from the general population of Perth (Western Australia) with no evidence of current respiratory illness. Peripheral blood mononuclear cells (PBMCs) and plasma were isolated from blood samples by density gradient Lymphoprep (Nycomed, Norway) and used for the T-cell proliferation experiments and for the antibody-binding assays, respectively. Genomic DNA was extracted from the saliva of all 20 donors for the human leukocyte antigen (HLA) typing. PBMCs of three donors that had positive proliferative responses (stimulation indexes [SI] higher than 2) to at least 3 out of the 5 selected immunodominant peptides for each RV genotype were selected as representative samples for identification of the responding T-cell subset assays. The study was approved by the Princess Margaret Hospital Human Ethics Committee, and written informed consent was obtained from each donor.
HLA typing.
All 20 donors were typed for HLA class I and II molecules at the Institute for Immunology and Infectious Diseases (IIID), an American Society for Histocompatibility and Immunogenetics (ASHI)-accredited center (Murdoch University, Perth, Western Australia). Briefly, genomic DNA was extracted from saliva utilizing an Oragene DNA kit (OG-250; DNA Genotek, Ontario, Canada) at a final concentration of 50 ng/μl and amplified by PCR using barcoded primers for HLA loci from HLA-A, -B, and -C (class I) and HLA-DRB1, -DQ, and -DP (class II). The barcoded samples were then pooled, and a TruSeq library was prepared for sequencing on the MiSeq sequencer (Illumina). The data were analyzed by separating out the barcoded samples and using algorithms to identify the alleles with in-house proprietary software. The algorithms exclude reads with ambiguous calls, align and trim the reads to exons, calculate the exon consensus, and match to a reference library so the HLA alleles can be called for each sample.
Rhinovirus peptides and proteins.
The VP1 protein was chosen as a target for this study, as it is the largest and most surface-exposed capsid protein that is known to elicit very high antibody titers that would require T-cell help (14, 15). This structural protein is critically involved in virus-cell attachment (16) and has a prime function in cellular infection. The phylogenetic relationship of VP1 between rhinovirus genotypes is also well characterized for interpreting our results (17, 18). VP1 has also been shown to elicit antibody levels in the sera of RV-infected patients higher than those directed against the VP2 and VP3 proteins, indicating that VP1 is more immunogenic (19).
Fifty-seven synthetic peptides of RV-A, genotype RV-34 (GenBank/DDBJ accession no. FJ445189.1) and 53 synthetic peptides of RV-C, genotype C3, prototype QPM (20) (GenBank/DDBJ accession no. EF186077) were purchased from Mimotopes (Victoria, Australia) as a PepSet. The peptides were 15 amino acids long, overlapping by 10 amino acids, and covered the entire VP1 capsid proteins of both genotypes. The size and overlapping nature of the peptides were selected based on their capacity to bind both the small major histocompatibility complex class I (MHC-I) pocket and the larger MHC-II groove, potentially eliciting CD4+ and CD8+ responses (21). The peptides tested were not designed based on previously described regions or prediction tools, which minimized the chances of losing important epitopes due to the wrong position of a peptide cut or that have been overlooked by the in silico analysis. The peptides were used individually in the T-cell proliferation assay and later in two pools containing the immunodominant peptides (pool RV-A and pool RV-C) for the responding T-cell subset experiments. Irrelevant 15-mer peptides representing regions of PhoMal, from the deep sea vent thermophilic bacterium Pyrococcus horikoshii (European Nucleotide Archive accession number BAA29275), were synthesized in the same PepSet plate with the RV peptides and used to control for potentially nonspecific T-cell proliferation caused by a synthetic peptide.
Entire VP1 capsid proteins of the same two RV-A and -C genotypes tested in the T-cell proliferation assay (A34 and C3) were produced in our laboratory as fusion polypeptides with glutathione S-transferase (GST) at the N terminus and a hexahistidine tag on the C terminus and expressed as recombinant proteins in Escherichia coli, as previously described (14). VP1 proteins were purified by glutathione-agarose affinity chromatography (Sigma-Aldrich, St. Louis, MO) and high-resolution size exclusion chromatography (GE Healthcare, Uppsala, Sweden). Circular dichroism analysis showed similar contents of secondary structure between the VP1 protein and that calculated for the content of VP1 in the virion, as was also evident from its high-avidity binding. Entire VP1 proteins were used in the total- and specific-antibody-binding assays.
T-cell proliferation assay.
Blood was collected from each of the 20 donors and immediately diluted with an equal volume of RPMI (Gibco/Invitrogen, Grand Island, NY) containing 1% preservative-free heparin. The blood was processed within an hour of collection, and PBMCs were isolated by density gradient centrifugation (Lymphoprep, Nycomed, Norway). Plasma from each donor was also aliquoted and stored at −20°C for the antibody-binding assays. Following three consecutive washes with RPMI, fresh PBMCs were resuspended in AIM-V serum-free culture medium (Life Technologies) supplemented with 50 μM 2-mercaptoethanol (Gibco, Invitrogen). PBMCs were seeded at 2 × 10⁵ cells per well in a 96-well round-bottom microtiter plate (Nunc). Individual RV-A and RV-C peptides (15 μM) were added to triplicate wells, and phytohemagglutinin (PHA) (Sigma, St. Louis, MO) and purified protein derivative (PPD) (Sigma-Aldrich), both at 10 μg/ml, were also included in triplicate, while negative controls contained only medium. Positive- and negative-control wells were included in each plate in order to control for variations. The plates were incubated at 37°C in a humidified 5% CO2 atmosphere, and the cell cultures were then pulsed on day 6 with [3H]thymidine (PerkinElmer; 0.01 mCi/ml) and incubated for the following 18 h under the same atmosphere conditions. On day 7, cells were harvested using filter mats (PerkinElmer), and T-cell proliferation was assessed by [3H]thymidine incorporation using a β-scintillation counter (Wallac 1450; PerkinElmer). This time point was found to be optimal based on time course experiments that showed proliferation could not be detected prior to day 4 and was optimal at day 7.
The selection of the immunodominant peptides was based on analysis of the reactive scores (RS) (with modifications from reference 22). The RS for each individual peptide was calculated based on (i) the proliferative capacity and magnitude of the T-cell response, given by the sum of the SI of positive donors (parameter A), and (ii) the percentage of positive donors, defined as when the mean SI of the triplicate wells from each donor was higher than 2 (parameter B). The SI was calculated as follows: SI = cpm of stimulated wells/cpm of unstimulated wells, where cpm is the counts per minute of cells marked with [3H]thymidine from our thymidine incorporation assay. The RS was calculated as a product of the multiplication of the two above-mentioned parameters (A × B).
Identification of the activated/proliferating RV-specific T-cell subset.
Blood samples from 3 representative donors (donors 1, 10, and 14) who were positive for the majority (at least three out of five) of individual immunodominant peptides of RV-A and RV-C were collected, and PBMCs were isolated as described above. Identification of the responding T-cell subset was done by defining the activated (HLA-DR+) and proliferating (dimly stained, CellTrace Violet dyedim) CD4+/CD8+ cells in response to the pooled RV immunodominant peptides. Pools A and C contained 5 peptides each, comprising the immunodominant peptides that were identified as a result of our T-cell proliferation assay.
PBMCs at 107/ml were labeled with a CellTrace Violet cell proliferation kit (Invitrogen Molecular Probes, OR, USA) at 5 μM for 5 min in phosphate-buffered saline (PBS) at room temperature. Unbound dye was washed out with PBS supplemented with 5% heat-inactivated fetal calf serum (HI-FCS) (SAFC, Brooklyn, Australia) for three consecutive washes. Fluorescent CellTrace-labeled PBMCs were seeded at 2 × 10⁵ per well in a 96-well U-bottom plate under the same culture conditions described above and stimulated in sextuplicate with selected immunodominant peptides combined into 2 pools (pool A and pool C) at 15 μM per peptide. Staphylococcal enterotoxin B (SEB) (Sigma-Aldrich) at 2.5 μg/ml final concentration was used as a positive control, and the negative controls contained only medium. A pool of the irrelevant peptides PhoMal1 to PhoMal5 (5 μM per peptide; 5 peptides in total) was used to control for nonspecific proliferation potentially due to a synthetic peptide. T-cell proliferation was assessed 7 days later by CellTrace labeling. In addition, cells were colabeled with fluorochrome-conjugated human specific antibodies against the lineage markers CD3 (allophycocyanin [APC]-H7, clone SK7), CD4 (fluorescein isothiocyanate [FITC], clone RPA-T4), and CD8 (phycoerythrin [PE]-Cy7, clone RPA-T8) and the T-cell activation marker HLA-DR (PE-CF594, clone G46-6) in order to determine the activated (HLA-DR+) and proliferating (CellTracedim) cell subsets in response to the peptide pools. CD19/CD20 (peridinin chlorophyll protein [PerCP]-Cy5.5, clones SJ25C1 and L27, respectively) and a LIVE/DEAD viability kit (Invitrogen) were used to exclude B cells and nonviable cells, respectively (all from Becton Dickinson Pharmingen, NJ, USA).
Briefly, after the 7-day incubation period, the six replicated wells were pooled and washed once to remove the culture medium. Pooled PBMCs were resuspended in PBS and stained with LIVE/DEAD dye (1:20,000) according to the manufacturer's instructions. After incubation for 10 min, the stained cells were washed twice in PBS containing 1% bovine serum albumin (BSA) and 0.1% sodium azide (fluorescence-activated cell sorter [FACS] buffer) to remove excess dye. The PBMCs were then stained with the antibody cocktail for 30 min at 4°C. Unbound antibodies were washed out, and the cells were fixed using stabilizing fixative (Becton Dickinson Pharmingen, NJ, USA). Samples were read with an LSRFortessa (BD Biosciences) and FACS Diva software (BD Biosciences). For each stimulation condition, at least 250,000 total events were acquired, and data analysis was performed using FlowJo X version 10.0.7r2 (Tree Star). After gating on lymphocytes, singlet cells, live cells, CD3+ cells, CD4+/CD8+ cells, and CellTracedim and HLA-DR+ cells, the numbers of activated (HLA-DR+) and proliferating (CellTracedim) cell subsets were recorded for each condition. Approximately 100,000 CD3+ cells were obtained per stimulation condition, after exclusion of doublets and nonviable cells. The antigen-specific response, given by the T-cell proliferation, was calculated as follows: SI (CellTrace) = percentage of CellTracedim cells among a pooled set of six peptide-stimulated wells/percentage of CellTracedim cells among a pool of six unstimulated control wells. Activated T cells were defined as follows: SI (HLA-DR+) = percentage of HLA-DR+ cells among a pooled set of six peptide-stimulated wells/percentage of HLA-DR+ cells among a pool of six unstimulated control wells.
Intra- and interspecies analysis of amino acid sequences from the VP1 capsid proteins of rhinoviruses A and C.
One phylogenetic tree each for RV-A and RV-C was generated by the neighbor-joining method and contained all the described genotypes for each species found in GenBank/DDBJ and the NIAID Virus Pathogen Database and Analysis Resource (ViPR) database (23), respectively. The 20 most representative genotypes (i.e., the genotypes falling far from each other and covering the entire tree length) were selected as species representative for the intraspecies analysis. The interspecies analysis utilized the 5 most representative genotypes within each species.
The GenBank/DDBJ access numbers for RV-A are as follows: RV-A12, JF781511; RV-A19, JQ747746; RV-A21, JN837693; RV-A23, JN621244; RV-A33, JN815250; RV-A34, FJ445189.1; RV-A40, JX074051; RV-A43, JN815237; RV-A44, JN815252; RV-A47, JN837692; RV-A53, JN798587; RV-A55, JQ837718; RV-A58, JX025558; RV-A60, JN798590; RV-A61, JN798560; RV-A65, JQ245966; RV-A66, JN621246; RV-A67, JN621245; RV-A68, JN798578; RV-A89, JQ837719; RV-A103, JQ747749. For RV-C, the genotypes are RV-C02, JX025557; RV-C03, EF186077; RV-C04, JF781509; RV-C05, JN837691; RV-C06, JN990702; RV-C07, JX025556; RV-C08, JQ245973; RV-C15, JN837688; RV-C17, JQ837720; RV-C22, JN621242; RV-C25, JN837685; RV-C26, JX193796; RV-C28, JN798569; RV-C32, JQ994498; RV-C36, JN541267; RV-C40, JF781505; RV-C41, JN798565; RV-C42, JQ994500; RV-C43, JN837687; RV-C45, JN837686; RV-C49, JN798568.
Antibody assay.
Total and species-specific antibody titers to RV-A (A34) and RV-C (C3) were measured in the plasma of all 20 donors using a dissociation-enhanced lanthanide fluorescence immunoassay (DELFIA; PerkinElmer). The details of the technique were described previously (14). Briefly, plasma was diluted (1:100) in blocking buffer (0.5% bovine serum albumin in 50 mM Tris-HCl, 0.9% NaCl, 0.05% sodium azide buffer with 0.01% Tween 20) and incubated overnight at 4°C with shaking. Then, 100 μl of the diluted plasma was added to a 96-well microtiter plate (Nunc, Roskilde, Denmark) containing wells previously coated with the VP1 proteins of RV-A34 and RV-C3. The plates were incubated for 2 h at room temperature with shaking. After 3 consecutive washes, 100 μl of biotinylated anti-human IgG1 (BD Pharmingen) diluted 1:2,000 in assay buffer (Wallac, Oy) was added to each well, and the plates were incubated for 2 h at room temperature with shaking. After another three washes, 100 μl europium-labeled streptavidin, diluted 1:1,000 in assay buffer, was added, and the plates were incubated for 30 min with shaking. The final washing step involved washing the plates 8 times before the addition of 100 μl enhancement solution. The plates were read using a Wallac Victor 3 plate reader (Wallac, Oy). A titration of reference sera with a known concentration of antibody binding to the VP1 antigens (in nanograms per milliliter) was included on every plate to construct a standard curve to determine the absolute concentration of antibody binding. Three negative-control sera were used as a negative control to determine nonspecific binding for each antigen and were included on every plate. The lower limit of detection for IgG1 binding was 500 ng/ml, and negative values were assigned 50% of the lower limit of detection (250 ng/ml).
Species-specific IgG1 antibody binding to RV-A and RV-C.
Immunoabsorption assays were conducted as described above, except that prior to starting, each plasma was preincubated in a lysate mixture of E. coli (1:250) producing the other two RV species to absorb out cross-reactive binding, as validated previously (14). Plasma from all the donors was also preabsorbed with the irrelevant antigen PspC, a surface protein of Streptococcus pneumoniae, in order to control for nonspecific inhibition.
RESULTS
Identification of RV-A and RV-C T-cell epitopes.
Based on the RS obtained for each individual peptide through the T-cell proliferation assay, two thresholds were defined as selection criteria for immunodominance: an RS of ≥1,250 and a percentage of positive donors of ≥40%. Five T-cell immunodominant peptides for each RV-A and RV-C genotype were identified (Fig. 1): RVA-23 (amino acid positions 111 to 125), RVA-24 (positions 116 to 130), RVA-25 (positions 121 to 135), RVA-48 (positions 236 to 250), and RVA-49 (positions 241 to 255), and RVC-7 (positions 31 to 45), RVC-16 (positions 76 to 90), RVC-32 (positions 158 to 172), RVC-40 (positions 196 to 210), and RVC-42 (positions 206 to 220). The RV-A immunodominant peptides overlapped and were focused in only two regions: A1 (positions 111 to 155) and A2 (positions 236 to 255) (Fig. 1). In contrast, the response to RV-C was broad, and the five immunodominant RV-C peptides were scattered throughout the protein in four distinct regions: C1 (positions 31 to 45), C2 (positions 76 to 90), C3 (positions 158 to 172), and C4 (positions 196 to 220) (Fig. 1).
FIG 1.

Identification of T-cell epitopes in the VP1 capsid protein of RV-A (A34) and RV-C (C3) through in vitro stimulation of PBMCs with overlapping synthetic peptides from 20 donors and analysis of T-cell proliferation using a [3H]thymidine incorporation assay. The horizontal lines represent the thresholds used as selection criteria for immunodominance (RS ≥ 1,250 and percent positive donors ≥ 40%). (A) Stimulatory capacities given by the sum of SI values of >2 for each individual peptide. (B) Percentage of positive donors (donors presenting mean SI of >2) for a given peptide. (C) RS given by the product of the stimulatory capacity (panel A) multiplied by the percentage of positive donors (panel B) showing 5 immunodominant peptides for each RV-A and RV-C genotype tested: RVA-23, RVA-24, RVA-25, RVA-48, and RVA-49 and RVC-7, RVC-16, RVC-32, RVC-40, and RVC-42. While the RV-A response is focused on only two regions of VP1 (A1 and A2), the RV-C response is broad, with epitopes scattered throughout the protein (C1, C2, C3, and C4 regions).
RV-A and RV-C T-cell epitopes as species representatives.
Sequence analysis was carried out to determine whether the selected peptides were specific for each species and representative of each species. First, to assess the specificity of the T-cell epitopes for each RV species, the immunodominant regions were analyzed in relation to their linear positions in the VP1 capsid protein of each genotype tested (Fig. 2). While the A1 and A2 regions are located in the central and C-terminal portions of VP1 of RV-A, the four RV-C immunodominant regions are dispersed throughout the protein in unrelated regions of A1 and A2. Next, the proliferative responses to the homologous regions (*) on the VP1 proteins of RV-A and RV-C were examined by comparing the RS of RV-A peptides to the RV-C immunodominant regions (C1*, C2*, C3*, and C4*) and those of the RV-C peptides to the RV-A immunodominant regions (A1* and A2*) (Table 1). Because the VP1 protein of RV-C3 is 12 amino acids shorter than the VP1 protein of RV-A34, mainly due to a major deletion around the C2 and A1* regions, the peptide numbers for RV-A and -C are not directly related. Figure 2 shows the amino acid positions and peptide numbers on the proteins of both RV-C and RV-A relative to the immunodominant A and C regions, following VP1 alignment of A34 and C3. The pairwise sequence identity between the epitopes and their interspecies homologues showed low to moderate identity and was lowest for the RV-C epitopes (Fig. 2): The pairs C1/C1*, C2/C2*, C3/C3*, and C4/C4* had 45%, 15%, 30%, and 30% identity, respectively, while A1 and A2 had 60% and 50% identity, respectively, with their RV-C counterparts. As the immunodominant regions were formed by a variable number of peptides (from a single peptide to three consecutive overlapping peptides), the RS for each region was normalized to an n of 1 (RS region = ΣRS of immunodominant peptides in the region/number peptides in each region) for comparison purposes. While the RV-A immunodominant regions A1 and A2 presented RS above 1,250, the corresponding RV-C regions, A1* and A2*, presented RS up to 14 times lower and as low as 10% donors positive for one peptide (RVC-21) in the A1* region (Table 1A). Similarly, all the RV-A regions corresponding to the RV-C immunodominant regions presented RS of less than half the RS threshold used as a criterion for immunodominance (Table 1B). Notably, the C1* homologue of RV-A was unable to stimulate T-cell proliferation in any of the donors in the cohort and presented an RS of zero. Given the distinct positions of the immunodominant A and C regions in the VP1 proteins of RV-A and RV-C and the low correlation of the magnitudes of response between immunodominant regions and the homologue regions in the VP1 protein of the other genotype, we conclude that the T-cell epitopes identified in this study are specific to each genotype tested.
FIG 2.

RV-A and RV-C immunodominant peptides as species-specific T-cell epitopes. Shown is alignment of the VP1 capsid proteins of RV-A34 and RV-C3. The two RV-A immunodominant regions A1 and A2 and the four RV-C immunodominant regions C1, C2, C3, and C4 are shaded in green and purple, respectively. The corresponding RV-A immunodominant regions A1* and A2* in VP1 of RV-C and the corresponding RV-C immunodominant regions C1*, C2*, C3*, and C4* in VP1 of RV-A are shaded in blue. Peptide numbers and amino acid positions are indicated. Identical amino acids within regions are marked in boldface, and the percentages of sequence identity between immunodominant regions and their homologues are shown in parentheses.
TABLE 1.
RV-A and RV-C immunodominant peptides as species-specific T-cell epitopesa
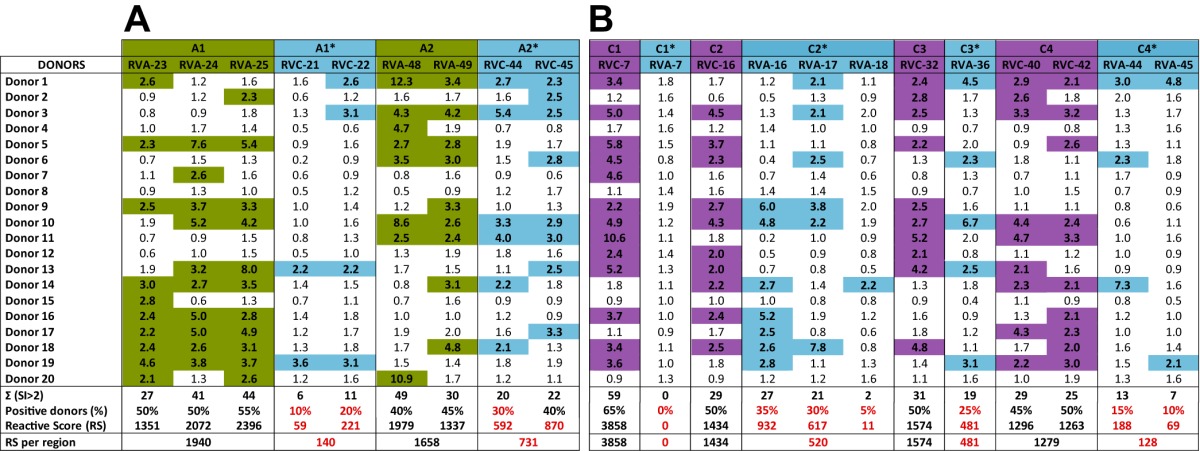
Shown are the stimulation indexes and the reactive scores of the RV-A (A) and RV-C (B) immunodominant peptides and corresponding peptides in the VP1 proteins of RV-C and RV-A. The RS of each region was normalized to the number of peptides (n = 1). SI of >2 are highlighted in green for RV-A, purple for RV-C, and blue for the relative homologous peptides. RS and percentages of positive donors below the selection threshold for immune dominance are highlighted in red.
Second, to examine if the T-cell epitopes were in regions that would be representative of all or most of the genotypes of each species, the intraspecies identity was analyzed by comparing the amino acid sequences of the immunodominant regions A1 and A2 of RV-A34 and C1, C2, C3, and C4 of RV-C3 to the same segments of the VP1 proteins from a representative sample of 20 genotypes of each species (Fig. 3) (the GenBank/DDBJ accession numbers are listed in Materials and Methods). The shaded areas indicate motifs that are fully conserved within the 20 genotypes analyzed for each species. The ClustalW identity matrix shows a high degree of amino acid identity among the 20 RV-C genotypes compared to RV-C3, ranging from 70 to 100% identity across the RV-C regions C1, C3, and C4, while C2 had a low degree of identity (50 to 95%). RV-A genotypes had high similarity scores in the A1 and A2 regions in relation to RV-A34, ranging from 85 to 100%. With the exception of C2, all the immunodominant RV-A and RV-C regions presented conserved motifs of 3 to up to 11 amino acids between the genotypes analyzed within each species. The conserved motifs seemed to be equally spread in the RV-A regions formed by more than one immunodominant peptide, while the RV-C region C4 presented a high degree of similarity among RV-C genotypes, particularly at the N-terminal end, where the first of the two overlapping peptides forming this region (RVC-40 and RVC-42) is located.
FIG 3.

Intraspecies analysis of the immunodominant T-cell epitopes of RV-A and RV-C. Shown is a comparison of the amino acid sequences of segments of the VP1 capsid proteins from A34 and C3 (top row) to a representative sample of 20 genotypes from each RV-A and RV-C species. (A) Immunodominant regions A1 (peptides RVA-23, -24, and -25) and A2 (peptides RVA-48 and -49). (B) Immunodominant regions C1 (RVC-7), C2 (RVC-16), C3 (RVC-32), and C4 (RVC-40 and -42). The shaded areas indicate motifs that are fully conserved between the genotypes tested. Alignment was by ClustalW, and the identity plot was generated in MacVector. GenBank/DDBJ access numbers are provided in Materials and Methods.
The alignment of the full-length VP1 proteins of RV-A34 and RV-C3 with a sample of five genotypes of each species provides insights into interspecies homologies and disparities (Fig. 4). The shaded areas indicate regions that are fully conserved across the 12 RV-A and RV-C genotypes analyzed. The 10 boxed regions indicate previously described motifs conserved among 101 RV-A and RV-B prototype strains (18), of which the six regions marked by red boxes indicate regions that had RV-C-specific amino acid substitutions (24). Interestingly, three of the four RV-C immunodominant regions (C1, C3, and C4) are located in regions presenting species-specific amino acid substitutions, and one (C2) is located in the region that had a major species C-specific amino acid deletion (Fig. 4).
FIG 4.

Interspecies analysis using ClustalW alignment of the VP1 capsid proteins of RV-A34 and RV-C3 to a sample of five RV-A and RV-C genotypes from each species. The shaded areas indicate amino acids that are fully conserved between the 12 RV-A and RV-C genotypes analyzed. The 10 boxed regions indicate motifs conserved across 101 RV-A and RV-B prototype strains (18). The red boxes indicate regions that underwent RV-C species-specific amino acid substitutions (24), which are highlighted in red. The RV-C and RV-A immunodominant regions C1, C2, C3, and C4 and A1 and A2 are indicated above and below each RV-C3 and RV-A34 sequence, respectively.
Magnitudes of RV-A and RV-C T-cell responses.
The magnitudes of T-cell proliferation between the species were compared by calculating the mean SI of the peptides belonging to each immunodominant region of each species (Fig. 5A) and also by comparing the mean SI of the combination of the peptides for all the immunodominant regions of RV-A and RV-C (Fig. 5B). No statistical difference was found when comparing the magnitudes of response, where rates of proliferation to RV-A and RV-C were comparable, with mean SI of 2.5 and 2.3, respectively.
FIG 5.

Magnitudes of T-cell responses against epitopes in the VP1 capsid protein of rhinoviruses A34 and C3. (A) Magnitudes of responses by immunodominant RV-A (A1 and A2) and -C (C1, C2, C3, and C4) regions, given by the SI of each donor per peptide in each region, showing no statistically significant differences in the magnitudes of responses between regions. (B) Comparison of the magnitudes of T-cell responses to RV-A and -C, given by the SI of peptides in all the immunodominant regions. Means with 95% confidence intervals are indicated. A P value of <0.05 was considered significant; ns, nonsignificant. All analyses were performed using GraphPad (La Jolla, CA, USA) Prism software.
Activated (HLA-DR+) and proliferating (CellTracedim) cell subsets (CD4+/CD8+) in response to immunodominant RV peptides.
For analysis of the proliferating T-cell subset, the immunodominant peptides were combined into two pools: pool A (RVA-23, RVA-24, RVA-25, RVA-48, and RVA-49) and pool C (RVC-7, RVC-16, RVC-32, RVC-40, and RVC-42), each at 15 μM final concentration, to stimulate PBMCs from 3 donors from our cohort that were previously positive for the selected individual peptides. The SI of activated (HLA-DR+) and proliferating (CellTracedim) cells indicate that CD4+ is the cell subset that predominantly proliferates in response to both RV-A and RV-C pools of peptides (Fig. 6). Although not statistically significant, the mean SI of the proliferating CD4+ subset, stimulated with the pool of RV-A and RV-C, was 2 times higher than that of the respective CD8+ subset. The specificity of the T-cell response is demonstrated by the lack of response to the control peptide antigen PhoMal.
FIG 6.

T-cell subset responding to pooled RV-A and -C peptides, defined by the activated T cells and proliferative capacity. A representative sample of 3 donors who were previously positive for individual immunodominant peptides is shown. The assay was conducted using RV-A34 and RV-C3 immunodominant peptides combined into two pools (15 μM per peptide; 5 peptides per pool). The bars represent means ± standard errors of the mean (SEM). (A) T-cell activation of CD4+ versus CD8+ subsets, given by CD4+HLA-DR+ and CD8+HLA-DR+. (B) Proliferation of T-cell subsets, given by CellTracedim. The pool of the irrelevant peptide antigen PhoMal was used as a control for nonspecific proliferation. The mean SI of the proliferating CD4+ subset, stimulated with the RV-A and RV-C pool, was 2 times higher than that of the corresponding CD8+ subset, although it was not statistically significant. No statistically significant differences were found within and between CD4+ and CD8+ subpopulations.
RV-A and RV-C total and specific IgG1 antibody titers.
Total and specific IgG1 antibody titers against both RV-A (A34) and RV-C (C3) full-length VP1 proteins were measured in the plasma of all 20 donors. All but one donor (95%) had antibody binding to the VP1 antigen of RV-A before the preabsorption phase (Fig. 7). Total IgG1 antibody binding to the RV-C antigen was significantly lower (P < 0.05), with only 65% binding. Cross-reactive antibody binding between RV-A and RV-C was removed by preabsorbing each plasma sample with a mixture of the other two RV species before repeating the antibody-binding assay. Specific antibody titers to RV-A were detected in 85% of the donors, while only 30% of the donors presented specific antibody binding to RV-C. The specific antibody titers were significantly lower for both RV-A and RV-C than the total antibody titers for the same RV genotype.
FIG 7.
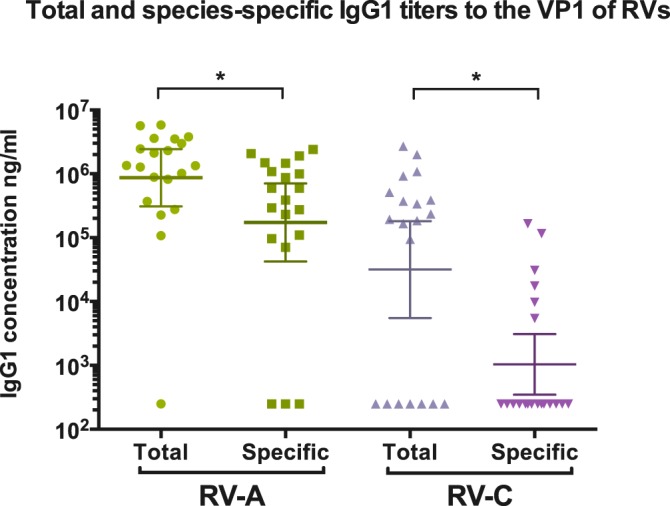
Total and species-specific IgG1 antibody titers to RV-A and RV-C VP1 antigens for the 20 donors. The geometric means and 95% confidence intervals are indicated. A titration of reference sera was included for the quantification of IgG1 binding, and a negative control was used to determine nonspecific binding. Species-specific measurements were conducted after preabsorption of plasma in a lysate mixture of E. coli producing the other two RV species. The limit of detection was 250 ng/ml. A P value of <0.05 (indicated by the asterisks) was considered significant. The analyses of total versus species-specific measurements were done using a paired Wilcoxon test. Analyses were performed using GraphPad (La Jolla, CA, USA) Prism software.
Total and specific antibody titers in relation to the number of immunodominant peptides recognized (IDPR) by each donor are summarized in Table 2. Of the PBMCs of the 20 donors tested, 90% and 80% were able to recognize and proliferate in response to at least 1 immunodominant peptide out of the 5 selected peptides for RV-A and -C, respectively (Table 2). There was no correlation between the levels of total and specific antibodies to the VP1 protein of either RV-A or RV-C and the proliferative response (peptide recognition) to RV peptides observed in this cohort (Spearman correlation > 0.05). For example, of the 12 donors whose PBMCs were able to recognize 3 out of 5 selected immunodominant RV-C3 peptides, 8 donors had no specific antibody titer to the VP1 capsid protein of RV-C3, and 4 of those donors also had no total RV-C3 antibodies to VP1. Regarding the levels of total and specific RV-A antibodies, of the 3 donors who had no RV-A34-specific antibody titers, 2 were able to recognize 4 or more RV-A immunodominant peptides (Table 2).
TABLE 2.
Dissociation of the antibody and T-cell responsesa
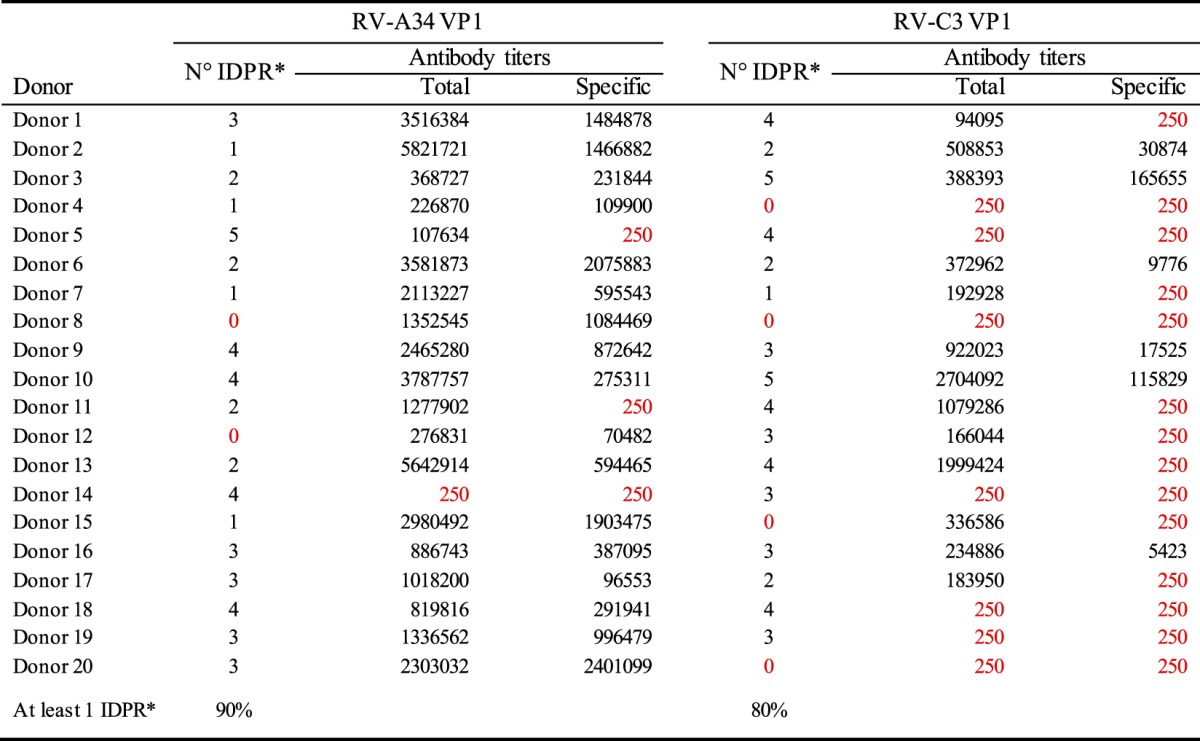
IDPR: Immunodominant peptides recognized.
RV-A34 and RV-C3 total and specific antibody titers are shown in relation to the number of IDPR. The limit of detection for antibody-binding titers was 250 ng/ml.
HLA typing.
HLA class I and II molecules have been typed for all 20 donors. CD4+ is the preferable T-cell subset to proliferate, via recognition of RV peptides through MHC-II molecules; therefore, we focused our analysis on HLA class II molecules. HLA-DQ and HLA-DR were targeted in this study for being the most polymorphic loci from the three HLA class II molecules (25).
In order to verify if the immunodominant regions are restricted to a specific HLA-DQ or HLA-DR haplotype, we evaluated the capacity of each HLA haplotype to recognize RV peptides through the proliferative response of PBMCs of donors expressing different HLA haplotypes. The donors had been divided into subgroups according to their HLA haplotypes. HLA haplotypes with a frequency equal to or higher than 3 in our cohort were analyzed as a subgroup; haplotypes that had a frequency of expression of less than 3 were combined into a group (others) and excluded from analysis. Because each subgroup had a variable number of donors, each subgroup was normalized to an n of 4. The RS was recalculated as described previously for each RV immunodominant peptide within each HLA-DQ and HLA-DR subgroup. All the donors in this cohort, independent of their HLA-DQ and -DR subtypes, responded well to the positive-control antigens PHA and PPD, and no significant differences were observed among the proliferative capacities of the different HLA haplotypes to the control antigens (results not shown). RS to individual RV peptides varied widely among HLA subgroups, and donors from different subgroups were able to recognize RV peptides located in different regions of the VP1 protein (results not shown).
Figure 8 shows the frequencies of distribution of HLA-DQ and HLA-DR in our cohort, together with a breakdown of the proliferative capacity by immunodominant region of RV-A and RV-C per HLA-DQ and HLA-DR subgroup. The intensities of the proliferative responses to VP1 regions varied among donors from HLA-DQ subgroups, although all DQ haplotypes were able to recognize all immunodominant regions of both RV-A and RV-C (Fig. 8B). In regard to HLA-DR, donors from subgroup DR1 failed to recognize the RV-C immunodominant region C3, while region C2 failed to induce a proliferative response in PBMCs of DR7 donors (Fig. 8B). Both A1 and A2 regions of RV-A were recognized by donors expressing all HLA-DR haplotypes in our cohort.
FIG 8.

Analysis of HLA associations. (A) Frequencies of distribution of HLA-DQ and HLA-DR in our cohort of 20 healthy donors. (B and C) Proliferative capacity was measured as the sum of the RS of 20 donors to RV-A and RV-C immunodominant peptides per region, according to HLA-DQ (B) and HLA-DR (C) subgroups. The number of donors in each HLA subgroup is indicated at the top of the y axis of each graph. As the numbers of donors in each HLA subgroup varied, all the subgroups were normalized to an n of 4 for comparison purposes. The arrows indicate regions that failed to induce a proliferative response in vitro. Percentages of responders (donors whose PBMCs proliferated in response to each peptide) are indicated above each bar.
DISCUSSION
T cells play a crucial role in antiviral immunity (26); however, our understanding of the nature and specificity of the T-cell response to RV is currently limited. Furthermore, all the studies on RV adaptive response are restricted to the RV-A and RV-B species (26–28). This is the first study to perform epitope mapping on the full-length VP1 capsid protein of an RV-A and RV-C genotype and the first to evaluate the T-cell response to a genotype of species C. We identified regions in the VP1 proteins of both RV-A and RV-C that are immunodominant and capable of promoting effective CD4+ proliferation in vitro. Furthermore, the intraspecies representative epitopes identified allowed a comparison of the magnitudes of T-cell proliferation between RV-A and RV-C and are useful tools for the study of T-cell responses to the different RV species. We demonstrated that in vitro stimulation of PBMCs from healthy donors utilizing synthetic peptides specific to and representative of each RV-A and RV-C species results in comparable magnitudes of T-cell-specific proliferation, even in donors who did not have specific antibody titers to RV-C. Our results indicate a dissociation of the species-specific antibody response from the T-cell response to rhinoviruses.
Despite their overall lack of amino acid sequence identity, rhinoviruses A and C share four motifs in the VP1 capsid protein that are highly conserved across all three rhinovirus species (18, 24) and other enteroviruses (17) (Fig. 4, black boxed regions). Therefore, synthetic peptides targeted to these regions would have the potential to promote a broad T-cell response against most enteroviruses. However, our results have shown that the RV-A peptides (RVA-9 to -11, RVA-13 and -14, RVA-29 and -30, and RVA-38 to -40) and the RV-C peptides (RVC-9 to -11, RVC-13 and -14, RVC-25 and -26, and RVC-35 and -36) located in the four conserved motifs all presented low immunogenicity, shown by their low reactive scores. The most plausible reason is that well-conserved segments are known to have low immunogenicity, as these regions are not under selective pressure (29). Our study demonstrates that RV-A and -C T-cell epitopes are located in very distinct regions of the VP1 protein that are unique for each species.
VP1 alignment of all RV species has shown that genotypes belonging to species C present amino acid substitutions in 6 of the 10 conserved motifs among all RV species (24) (Fig. 4, red boxed regions). Furthermore, species C presents major amino acid deletions, especially in the center of VP1, which shortened the protein by 21 residues compared to VP1 of species A (29). Of the 4 immunodominant RV-C regions identified in this study, three (C1, C3, and C4) are located in regions presenting species-specific amino acid substitution and one (C2) is located in the VP1 region that had major species C-specific amino acid deletions. Our findings on RV-C-specific T-cell epitopes provide experimental evidence that corroborates the predictions made on the basis of bioinformatics tools (29), which suggested that RV-Cs have new, unique epitopes that are well conserved within species C (29).
The RV-A immunodominant regions A1 and A2, which are conserved within the RV-A species, also share great amino acid sequence similarity with RV-B and other enteroviruses (17, 18). Previous studies in animal models have identified the same two regions as immunodominant in another RV-A genotype (A1A) (27). Given the overlapping nature of the peptides in A1 and the increased RS observed from RVA-23 to RVA-25, it is likely that peptide RVA-25 contains the full epitope or possibly multiple epitopes. The C-terminal region of the VP1 capsid protein of RV-A, where the immunodominant region A2 is located, is known to contain part of the ICAM-1 attachment site in RVs belonging to the major receptor group, and peptides targeted to this region have been able to elicit high antibody titers in an animal model (19, 30) and to promote cross-protection among other RV-A and -B serotypes (27).
The motif PRPPR in the C-terminal region of A2 is conserved in both RV-A and -C species, but it is unlikely to confer an immunodominant epitope, as the RV-C peptide RVC-46 also contains this motif, and it has a low RS (Fig. 1). Therefore, the A2 epitope is likely to contain the motif KAKH, which, although conserved for species A, has an amino acid substitution in C, where A is replaced by P. As the RV-C peptides that contain the motif KPKH have relatively low RS compared to their RV-A counterparts, we hypothesize that the amino acid substitution is located in an important binding pocket, which would accommodate the 4 side chain residues (31). The same can be observed for the RV-C immunodominant region C1, where two species-specific amino acid substitutions drastically change the immunogenicity of the peptide (Table 1, compare the RS of peptide RVC-7 and its counterpart, RVA-7).
Dissociation of the antibody response from the T-cell response.
Based on a comparison of specific antibody titers to each of the three rhinovirus species, it has been suggested that the increased severity of RV-C infection in young asthmatic children could be the result of a less efficient immune response to species C (15). One possible explanation suggested for the impaired RV-C-specific humoral response was a phenomenon known as original antigenic sin, which was first described for influenza viruses (32) and then extended to rhinoviruses (14). According to this theory, preceding responses to RV-A could dictate the specificity of the immune response and shift the antibody repertoire toward RV-A and away from RV-C. Our findings on the specific T-cell response to RV-C3 rule out the idea of impaired immune response to species C and reinforce the suggestion of the original antigenic sin-like response as an explanation for the low specific RV-C antibody levels and possible increased clinical importance of species C.
HLA associations.
Three (donors 4, 15, and 20) out of the four nonresponders for the RV-C immunodominant regions failed to recognize any of the 53 RV-C peptides tested (results not shown). Two of them (donors 4 and 15) presented an HLA-DRB1*8 haplotype. In addition to these two donors, the DRB1*08 subgroup had one other donor (donor 5) who was a high RV-C responder. We hypothesize that DRB1*08 could work as an inhibitory allele that, when present, would result in a suppressive immune response (33). Similarly, in donors expressing them, the DRB1*1 and DRB1*7 haplotypes, which failed to recognize the RV-C immunodominant regions C3 and C2, respectively, could be acting as inhibitory alleles, resulting in low recognition of RV-C-specific epitopes.
Due to the low number of donors in our cohort, the heterogeneity of HLA haplotypes is not fully represented. Furthermore, the limited number of donors in each HLA group does not allow sufficient power of analysis of the responses associated with the different HLA haplotypes. Nevertheless, based on the results presented in Fig. 8, there appears to be immune recognition of RV-A and RV-C epitopes by diverse HLA haplotypes, and therefore, HLA-restricted recognition does not appear to account for the genome-wide association study (GWAS) associations previously described (34, 35). The low association between HLA class II haplotypes and epitope recognition has been previously reported for house dust mite allergens in relation to the HLA-DQ haplotype (36).
Peptide vaccine.
Currently, the majority of vaccines against viral infections are targeted to either inactivated or live-attenuated viruses. In both scenarios, the induced immune response is generally strain specific, due to viral hypervariability. Peptide-based vaccines present many advantages: peptides are easily produced in large amounts in a cost-effective manner; are safer than vaccines that use live-attenuated viruses, which often cause symptoms of infection; and do not require viral growth, which presents a major advantage, especially for the rhinovirus C species that cannot be easily propagated in vitro. This technology is currently being used in the development of new vaccines, such as papillomavirus vaccine (37), influenza virus vaccine (38), and vaccines against common allergens (39).
Here, we identified immunodominant peptides that are representatives of each RV-A and -C species. Rhinovirus represents a significant clinical target, and although there are more than 150 currently described RV genotypes, the use of a peptide cocktail containing multiple species-specific peptides that are tightly conserved within RV species could help overcome the challenge of promoting an effective broad-spectrum response to the majority of the RV genotypes (19, 40). While a vaccine targeted to T-cell stimulation might not prevent reinfection, as suggested for the preventive-type vaccine candidates targeted to neutralizing antibodies, it does have the potential to work as a therapeutic vaccine, increasing the efficiency of viral clearance and affecting the course of infection, which would result in less inflammation and consequently fewer immune-related diseases, such as asthma exacerbation.
ACKNOWLEDGMENTS
We acknowledge the donors in this study.
C. M. Gaido was supported by an International Postgraduate Research Scholarship (IPRS)/Doctorate by Research from the University of Western Australia.
Funding Statement
This work was supported by a Telethon Kids Institute seed grant. The funder had no role in study design, data collection and interpretation, or the decision to submit the work for publication.
REFERENCES
- 1.Khetsuriani N, Lu X, Teague WG, Kazerouni N, Anderson LJ, Erdman DD. 2008. Novel human rhinoviruses and exacerbation of asthma in children. Emerg Infect Dis 14:1793–1796. doi: 10.3201/eid1411.080386. [DOI] [PMC free article] [PubMed] [Google Scholar]
- 2.Mak RK, Tse LY, Lam WY, Wong GW, Chan PK, Leung TF. 2011. Clinical spectrum of human rhinovirus infections in hospitalized Hong Kong children. Pediatr Infect Dis J 30:749–753. doi: 10.1097/INF.0b013e31821b8c71. [DOI] [PubMed] [Google Scholar]
- 3.Hao W, Bernard K, Patel N, Ulbrandt N, Feng H, Svabek C, Wilson S, Stracener C, Wang K, Suzich J, Blair W, Zhu Q. 2012. Infection and propagation of human rhinovirus C in human airway epithelial cells. J Virol 86:13524–13532. doi: 10.1128/JVI.02094-12. [DOI] [PMC free article] [PubMed] [Google Scholar]
- 4.Rathe JA, Liu X, Tallon LJ, Gern JE, Liggett SB. 2010. Full-genome sequence and analysis of a novel human rhinovirus strain within a divergent HRV-A clade. Arch Virol 155:83–87. doi: 10.1007/s00705-009-0549-8. [DOI] [PMC free article] [PubMed] [Google Scholar]
- 5.Miller EK, Mackay IM. 2013. From sneeze to wheeze: what we know about rhinovirus Cs. J Clin Virol 57:291–299. doi: 10.1016/j.jcv.2013.04.015. [DOI] [PubMed] [Google Scholar]
- 6.McIntyre CL, McWilliam Leitch EC, Savolainen-Kopra C, Hovi T, Simmonds P. 2010. Analysis of genetic diversity and sites of recombination in human rhinovirus species C. J Virol 84:10297–10310. doi: 10.1128/JVI.00962-10. [DOI] [PMC free article] [PubMed] [Google Scholar]
- 7.Bochkov YA, Watters K, Ashraf S, Griggs TF, Devries MK, Jackson DJ, Palmenberg AC, Gern JE. 2015. Cadherin-related family member 3, a childhood asthma susceptibility gene product, mediates rhinovirus C binding and replication. Proc Natl Acad Sci U S A 112:5485–5490. doi: 10.1073/pnas.1421178112. [DOI] [PMC free article] [PubMed] [Google Scholar]
- 8.Bai J, Smock SL, Jackson GR Jr, MacIsaac KD, Huang Y, Mankus C, Oldach J, Roberts B, Ma YL, Klappenbach JA, Crackower MA, Alves SE, Hayden PJ. 2015. Phenotypic responses of differentiated asthmatic human airway epithelial cultures to rhinovirus. PLoS One 10:e0118286. doi: 10.1371/journal.pone.0118286. [DOI] [PMC free article] [PubMed] [Google Scholar]
- 9.Vignola AM, Campbell AM, Chanez P, Bousquet J, Paul-Lacoste P, Michel FB, Godard P. 1993. HLA-DR and ICAM-1 expression on bronchial epithelial cells in asthma and chronic bronchitis. Am Rev Respir Dis 148:689–694. doi: 10.1164/ajrccm/148.3.689. [DOI] [PubMed] [Google Scholar]
- 10.Mackay IM, Lambert SB, Faux CE, Arden KE, Nissen MD, Sloots TP, Nolan TM. 2013. Community-wide, contemporaneous circulation of a broad spectrum of human rhinoviruses in healthy Australian preschool-aged children during a 12-month period. J Infect Dis 207:1433–1441. doi: 10.1093/infdis/jis476. [DOI] [PMC free article] [PubMed] [Google Scholar]
- 11.Principi N, Zampiero A, Gambino M, Scala A, Senatore L, Lelii M, Ascolese B, Pelucchi C, Esposito S. 2015. Prospective evaluation of rhinovirus infection in healthy young children. J Clin Virol 66:83–89. doi: 10.1016/j.jcv.2015.03.013. [DOI] [PubMed] [Google Scholar]
- 12.Chen WJ, Arnold JC, Fairchok MP, Danaher PJ, McDonough EA, Blair PJ, Garcia J, Halsey ES, Schofield C, Ottolini M, Mor D, Ridore M, Burgess TH, Millar EV. 2015. Epidemiologic, clinical, and virologic characteristics of human rhinovirus infection among otherwise healthy children and adults: rhinovirus among adults and children. J Clin Virol 64:74–82. doi: 10.1016/j.jcv.2015.01.007. [DOI] [PMC free article] [PubMed] [Google Scholar]
- 13.Bizzintino J, Lee WM, Laing IA, Vang F, Pappas T, Zhang G, Martin AC, Khoo SK, Cox DW, Geelhoed GC, McMinn PC, Goldblatt J, Gern JE, Le Souef PN. 2011. Association between human rhinovirus C and severity of acute asthma in children. Eur Respir J 37:1037–1042. doi: 10.1183/09031936.00092410. [DOI] [PMC free article] [PubMed] [Google Scholar]
- 14.Iwasaki J, Smith WA, Stone SR, Thomas WR, Hales BJ. 2013. Species-specific and cross-Reactive IgG1 antibody binding to viral capsid protein 1 (VP1) antigens of human rhinovirus species A, B and C. PLoS One 8:e70552. doi: 10.1371/journal.pone.0070552. [DOI] [PMC free article] [PubMed] [Google Scholar]
- 15.Iwasaki J, Smith WA, Khoo SK, Bizzintino J, Zhang G, Cox DW, Laing IA, Le Souef PN, Thomas WR, Hales BJ. 2014. Comparison of rhinovirus antibody titers in children with asthma exacerbations and species-specific rhinovirus infection. J Allergy Clin Immunol 134:25–32. doi: 10.1016/j.jaci.2014.03.014. [DOI] [PubMed] [Google Scholar]
- 16.Rossmann MG, Arnold E, Erickson JW, Frankenberger EA, Griffith JP, Hecht HJ, Johnson JE, Kamer G, Luo M, Mosser AG, Rueckert RR, Sherry B, Vriend G. 1985. Structure of a human common cold virus and functional relationship to other picornaviruses. Nature 317:145–153. doi: 10.1038/317145a0. [DOI] [PubMed] [Google Scholar]
- 17.Laine P, Savolainen C, Blomqvist S, Hovi T. 2005. Phylogenetic analysis of human rhinovirus capsid protein VP1 and 2A protease coding sequences confirms shared genus-like relationships with human enteroviruses. J Gen Virol 86:697–706. doi: 10.1099/vir.0.80445-0. [DOI] [PubMed] [Google Scholar]
- 18.Laine P, Blomqvist S, Savolainen C, Andries K, Hovi T. 2006. Alignment of capsid protein VP1 sequences of all human rhinovirus prototype strains: conserved motifs and functional domains. J Gen Virol 87:129–138. doi: 10.1099/vir.0.81137-0. [DOI] [PubMed] [Google Scholar]
- 19.Edlmayr J, Niespodziana K, Popow-Kraupp T, Krzyzanek V, Focke-Tejkl M, Blaas D, Grote M, Valenta R. 2011. Antibodies induced with recombinant VP1 from human rhinovirus exhibit cross-neutralisation. Eur Respir J 37:44–52. doi: 10.1183/09031936.00149109. [DOI] [PubMed] [Google Scholar]
- 20.McErlean P, Shackelton LA, Lambert SB, Nissen MD, Sloots TP, Mackay IM. 2007. Characterisation of a newly identified human rhinovirus, HRV-QPM, discovered in infants with bronchiolitis. J Clin Virol 39:67–75. doi: 10.1016/j.jcv.2007.03.012. [DOI] [PMC free article] [PubMed] [Google Scholar]
- 21.Hoffmeister B, Kiecker F, Tesfa L, Volk HD, Picker LJ, Kern F. 2003. Mapping T cell epitopes by flow cytometry. Methods 29:270–281. doi: 10.1016/S1046-2023(02)00349-3. [DOI] [PubMed] [Google Scholar]
- 22.Jelcic I, Aly L, Binder TM, Jelcic I, Bofill-Mas S, Planas R, Demina V, Eiermann TH, Weber T, Girones R, Sospedra M, Martin R. 2013. T cell epitope mapping of JC polyoma virus-encoded proteome reveals reduced T cell responses in HLA-DRB1*04:01+ donors. J Virol 87:3393–3408. doi: 10.1128/JVI.02803-12. [DOI] [PMC free article] [PubMed] [Google Scholar]
- 23.Pickett BE, Sadat EL, Zhang Y, Noronha JM, Squires RB, Hunt V, Liu M, Kumar S, Zaremba S, Gu Z, Zhou L, Larson CN, Dietrich J, Klem EB, Scheuermann RH. 2012. ViPR: an open bioinformatics database and analysis resource for virology research. Nucleic Acids Res 40:D593–D598. doi: 10.1093/nar/gkr859. [DOI] [PMC free article] [PubMed] [Google Scholar]
- 24.Lau SK, Yip CC, Tsoi HW, Lee RA, So LY, Lau YL, Chan KH, Woo PC, Yuen KY. 2007. Clinical features and complete genome characterization of a distinct human rhinovirus (HRV) genetic cluster, probably representing a previously undetected HRV species, HRV-C, associated with acute respiratory illness in children. J Clin Microbiol 45:3655–3664. doi: 10.1128/JCM.01254-07. [DOI] [PMC free article] [PubMed] [Google Scholar]
- 25.Sidney J, Steen A, Moore C, Ngo S, Chung J, Peters B, Sette A. 2010. Five HLA-DP molecules frequently expressed in the worldwide human population share a common HLA supertypic binding specificity. J Immunol 184:2492–2503. doi: 10.4049/jimmunol.0903655. [DOI] [PMC free article] [PubMed] [Google Scholar]
- 26.Gern JE, Dick EC, Kelly EA, Vrtis R, Klein B. 1997. Rhinovirus-specific T cells recognize both shared and serotype-restricted viral epitopes. J Infect Dis 175:1108–1114. doi: 10.1086/516449. [DOI] [PubMed] [Google Scholar]
- 27.Hastings GZ, Francis MJ, Rowlands DJ, Chain BM. 1993. Epitope analysis of the T cell response to a complex antigen: proliferative responses to human rhinovirus capsids. Eur J Immunol 23:2300–2305. doi: 10.1002/eji.1830230937. [DOI] [PubMed] [Google Scholar]
- 28.Hastings GZ, Rowlands DJ, Francis MJ. 1991. Proliferative responses of T cells primed against human rhinovirus to other rhinovirus serotypes. J Gen Virol 72:2947–2952. doi: 10.1099/0022-1317-72-12-2947. [DOI] [PubMed] [Google Scholar]
- 29.Basta HA, Sgro JY, Palmenberg AC. 2014. Modeling of the human rhinovirus C capsid suggests a novel topography with insights on receptor preference and immunogenicity. Virology 448:176–184. doi: 10.1016/j.virol.2013.10.006. [DOI] [PMC free article] [PubMed] [Google Scholar]
- 30.Niespodziana K, Napora K, Cabauatan C, Focke-Tejkl M, Keller W, Niederberger V, Tsolia M, Christodoulou I, Papadopoulos NG, Valenta R. 2012. Misdirected antibody responses against an N-terminal epitope on human rhinovirus VP1 as explanation for recurrent RV infections. FASEB J 26:1001–1008. doi: 10.1096/fj.11-193557. [DOI] [PubMed] [Google Scholar]
- 31.Wang P, Sidney J, Dow C, Mothe B, Sette A, Peters B. 2008. A systematic assessment of MHC class II peptide binding predictions and evaluation of a consensus approach. PLoS Comput Biol 4:e1000048. doi: 10.1371/journal.pcbi.1000048. [DOI] [PMC free article] [PubMed] [Google Scholar]
- 32.Kim JH, Skountzou I, Compans R, Jacob J. 2009. Original antigenic sin responses to influenza viruses. J Immunol 183:3294–3301. doi: 10.4049/jimmunol.0900398. [DOI] [PMC free article] [PubMed] [Google Scholar]
- 33.Gregersen JW, Kranc KR, Ke X, Svendsen P, Madsen LS, Thomsen AR, Cardon LR, Bell JI, Fugger L. 2006. Functional epistasis on a common MHC haplotype associated with multiple sclerosis. Nature 443:574–577. [DOI] [PubMed] [Google Scholar]
- 34.Moffatt MF, Gut IG, Demenais F, Strachan DP, Bouzigon E, Heath S, von Mutius E, Farrall M, Lathrop M, Cookson WO. 2010. A large-scale, consortium-based genomewide association study of asthma. N Engl J Med 363:1211–1221. doi: 10.1056/NEJMoa0906312. [DOI] [PMC free article] [PubMed] [Google Scholar]
- 35.Lasky-Su J, Himes BE, Raby BA, Klanderman BJ, Sylvia JS, Lange C, Melen E, Martinez FD, Israel E, Gauderman J, Gilliland F, Sleiman P, Hakonarson H, Celedon JC, Soto-Quiros M, Avila L, Lima JJ, Irvin CG, Peters SP, Boushey H, Chinchilli VM, Mauger D, Tantisira K, Weiss ST. 2012. HLA-DQ strikes again: genome-wide association study further confirms HLA-DQ in the diagnosis of asthma among adults. Clin Exp Allergy 42:1724–1733. doi: 10.1111/cea.12000. [DOI] [PMC free article] [PubMed] [Google Scholar]
- 36.O'Brien RM, Thomas WR, Nicholson I, Lamb JR, Tait BD. 1995. An immunogenetic analysis of the T-cell recognition of the major house dust mite allergen Der p 2: identification of high- and low-responder HLA-DQ alleles and localization of T-cell epitopes. Immunology 86:176–182. [PMC free article] [PubMed] [Google Scholar]
- 37.Kim KS, Park SA, Ko KN, Yi S, Cho YJ. 2014. Current status of human papillomavirus vaccines. Clin Exp Vaccine Res 3:168–175. doi: 10.7774/cevr.2014.3.2.168. [DOI] [PMC free article] [PubMed] [Google Scholar]
- 38.Wilkinson TM, Li CK, Chui CS, Huang AK, Perkins M, Liebner JC, Lambkin-Williams R, Gilbert A, Oxford J, Nicholas B, Staples KJ, Dong T, Douek DC, McMichael AJ, Xu XN. 2012. Preexisting influenza-specific CD4+ T cells correlate with disease protection against influenza challenge in humans. Nat Med 18:274–280. doi: 10.1038/nm.2612. [DOI] [PubMed] [Google Scholar]
- 39.Kwon SS, Kim NS, Yoo TJ. 2005. Vaccination with DNA encoding human T-cell epitopes suppresses Der p induced allergic responses in mice. J Asthma 42:119–125. doi: 10.1081/JAS-51312. [DOI] [PubMed] [Google Scholar]
- 40.Tan AC, La Gruta NL, Zeng W, Jackson DC. 2011. Precursor frequency and competition dictate the HLA-A2-restricted CD8+ T cell responses to influenza A infection and vaccination in HLA-A2.1 transgenic mice. J Immunol 187:1895–1902. doi: 10.4049/jimmunol.1100664. [DOI] [PubMed] [Google Scholar]