

Abstract
Atherosclerosis is a multifactorial disease that preferentially develops in specific regions in the arterial tree. This characteristic is mainly attributed to the unique pattern of hemodynamic shear stress in vivo. High laminar shear stress (LS) found in straight lumen exerts athero-protective effects. Low or oscillatory shear stress (OS) present in regions of lesser curvature and arterial bifurcations predisposes arterial intima to atherosclerosis. Shear stress-regulated endothelial function plays an important role in the process of atherosclerosis. Most in vitro research studies focusing on the molecular mechanisms of endothelial function are performed in endothelial cells (ECs) under cultured static (ST) condition. Some findings, however, are not recapitulated in subsequent translational studies, mostly likely due to the missing biomechanical milieu. Here, we profiled the whole transcriptome of primary human coronary arterial endothelial cells (HCAECs) under different shear stress conditions with RNA sequencing. Among 16,313 well-expressed genes, we detected 8,177 that were differentially expressed in OS vs. LS conditions and 9,369 in ST vs. LS conditions. Notably, only 1,618 were differentially expressed in OS vs. ST conditions. Hierarchical clustering of ECs demonstrated a strong similarity between ECs under OS and ST conditions at the transcriptome level. Subsequent pairwise heat mapping and principal component analysis gave further weight to the similarity. At the individual gene level, expressional analysis of representative well-known genes as well as novel genes showed a comparable amount at mRNA and protein levels in ECs under ST and OS conditions. In conclusion, the present work compared the whole transcriptome of HCAECs under different shear stress conditions at the transcriptome level as well as at the individual gene level. We found that cultured ECs are significantly different from those under LS conditions. Thus using cells under ST conditions is unlikely to elucidate endothelial physiology. Given the revealed high similarities of the endothelial transcriptome under OS and ST conditions, it may be helpful to understand the underlying mechanisms of OS-induced endothelial dysfunction from static cultured endothelial studies.
Keywords: endothelial cells, RNA-seq, shear stress, transcriptome
endothelial cells (ECs) are constantly exposed to hemodynamic shear stress, which is the frictional force generated by blood flow. Alteration in the magnitude and direction of shear stress predominantly determines the mechanotransduction-mediated endothelial functional phenotype (7, 34). High laminar shear stress (LS) (≥10 dyn/cm2) presented in straight unbranched vascular lumen is commonly denoted as athero-protective shear stress. LS fine-tunes endothelial “quiescent” tone (35) by inhibiting adhesion molecule expression (2), suppressing potent vasoconstrictor endothelin-1 (25), inducing proliferation inhibitor p21 (1), as well as preventing endothelial cell apoptosis (13), thereby maintaining vascular and endothelial homeostasis. ECs under LS exert strong vasoprotective effect through increased nitric oxide production by endothelial nitric oxide synthase (eNOS) (24, 33) in a Krüppel-like factor 2 (KLF2)-dependent manner (11, 12). In contrast, low or oscillatory shear stress (OS) (0∼ ± 5 dyn/cm2) found in areas of disturbed flow, such as arterial bifurcations and lesser curvature of aortic arch, is well documented as an atherosclerosis-prone force (8, 9). Animal studies focusing on the aorta (15, 31) and carotid arteries (4) provide solid evidence that OS predisposes vascular intima to atherogenesis. Human ultrasonographic imaging further demonstrates an inverse correlation between carotid artery thickness and local shear stress magnitude (18). This determinant role of shear stress in the geometrical distribution of atherosclerosis has led to intense research interest in determining the underlying pathogenic mechanisms (3).
Efforts have been made to survey the changes in shear force-mediated gene expression by a DNA microarray approach. Such studies have shown distinctive gene expression patterns between ECs under LS and OS conditions (5, 29), LS and static (ST) condition (6, 11), or LS, OS, and ST conditions together (17). The results indicate a strong phenotypic plasticity of ECs in response to shear stress. However, microarray studies have identified only a small portion of gene expression changes in response to different shear stress conditions, which is unlikely to provide a complete profile of the full transcriptome since microarray probes or probe sets are mainly based on previous mapped genes (28). In addition, microarrays fail to detect novel unannotated transcripts and, in particular, a large number of noncoding RNAs (26) within a transcriptomic pool.
Given that the endothelial layer is constantly exposed to hemodynamic shear stress once the circulation system develops (21), the ST condition is the least reminiscent of hemodynamic milieu in vivo. Despite this, a tremendous amount of EC research has been conducted under this condition, which may not be translatable to subsequent in vivo studies because of the missing biomechanical milieu (14). Here, we use RNA sequencing (RNA-seq) (37) to profile the whole transcriptome of primary human coronary arterial ECs (HCAECs) under LS (15 dyn/cm2), OS (0∼ ± 5 dyn/cm2), and ST conditions. We sought to survey the transcriptomic difference under different shear stress conditions.
MATERIAL AND METHODS
EC culture.
HCAECs were obtained from Cell Applications (San Diego, CA) at passage 2 and cultured in MesoEndo cell growth medium or endothelial cell basal medium (Cell Applications). The MesoEndo growth medium contains 5% fetal bovine serum, 10 ng/ml human epidermal growth factor, and 6 ng/ml basic fibroblast growth factor. Cells were incubated at 37°C in a standard cell culture incubator. HCAECs were used at passage 6 in the following studies.
Shear stress studies.
A detailed protocol has been described previously (32). Briefly, HCAECs monolayers at confluence in 100 mm tissue culture dishes were exposed to arterial levels of unidirectional LS (15 dyn/cm2), bidirectional OS at 1 Hz cycle (0∼ ± 5 dyn/cm2) by rotating a Teflon cone (0.5° cone angle) with a stepping motor (Servo Motor) and a computer program (DC Motor), and ST cultured conditions for 24 h (n = 4 for each condition).
RNA isolation and RNA-seq library preparation.
After being exposed to LS, OS, and ST for 24 h, ECs were harvested by scraping, and RNA was isolated and purified with the RNeasy mini kit and subjected to on-column RNase-free DNase treatment according to product protocol (Qiagen). Total RNA from 12 samples was then assessed for quality using the BioAnalyzer (Agilent, Santa Clara, CA). Double-stranded cDNA was generated from 100–150 ng of total RNA by selective priming and prepared for the final library. Samples with RNA integrity numbers of 8 or greater were prepared using the EnCore Complete RNA Seq Library System (NuGen). Final libraries were checked for quality as well as quantity by the BioAnalyzer DNA 1000 (Agilent). Quantitative PCR (qPCR) was performed to quantify the library using a KAPA kit (Kapa Biosystems) for Illumina sequencing platforms. Twelve samples were then clustered on the cBot and sequenced on a 50-cycle single end on a HiSeq2000 (Illumina) to generate 50 bp paired-end reads, using TruSeq SBS v3 reagents (Illumina) according to manufacturer's protocols.
RNA-seq data analysis and qPCR validation.
RNA-seq fastq files were aligned to the human genome primary assembly (GRCh38) using the Subread package (23). Read counts on each gene were determined by featureCounts function in the Subread package using GeneCode human GTF file version 23 (http://www.gencodegenes.org/). Differential expression analysis between endothelial cells under different types of shear stress was performed using the limma package with the voom transformation (30). P values were adjusted by default Benjamini-Hochberg procedure. We required at least four samples have normalized read counts of ≥ 1 fpm (one read count per million aligned reads) to include a gene in the differential expression analysis and other downstream analyses.
Collected RNA was reverse-transcribed into cDNA pool with SuperScript III RT-PCR kit (Invitrogen). Target RNAs expression was determined by a qPCR System (Bio-Rad) using iQ SYBR Green Supermix (Bio-Rad). The gene expression was normalized against the internal control, 18S rRNA. All the primer sequences are shown in Table 1.
Table 1.
Sequence of primers used for quantitative PCR quantification
| Gene | Species | Forward | Reverse |
|---|---|---|---|
| KLF2 | human | 5′-AGCCTTCGGTCTCTTCGAC-3′ | 5′-GCGAACTCTTGGTGTAGGTCTT-3′ |
| NOS3 | human | 5′-ATGGATGAGTATGACGTGGTGT-3′ | 5′-ATGCTGTTGAAGCGGATCTTAT-3′ |
| ID1 | human | 5′-GCAGGTAAACGTGCTGCTCTAC-3′ | 5′-AGTTCAGCTCCAACTGAAGGTC-3′ |
| KLF11 | human | 5′-CTGTCTCTGACTCTGGGGATGT-3′ | 5′-TGGAATCTGTTACTTGGGGAGA-3′ |
| LMO7 | human | 5′-AAGACTGCGTTACCCTTCAATC-3′ | 5′-TGGACTTACTCCCATTCTCACC-3′ |
| TEK | human | 5′-CCCTCCTCCAAGAGGTCTAAAT-3′ | 5′-GTACTGCTCCCTGGGATGTAAG-3′ |
| HYAL2 | human | 5′-ACTGGCAGGACAAAGATGTGTA-3′ | 5′-GAAAGAGGTAGAAGCCCCAGAG-3′ |
| SERPINE2 | human | 5′-AATCCTATCAAGTGCCAATGCT-3′ | 5′-CTGTCTATGGTCTTGGTGCTGA-3′ |
| C10orf10 | human | 5′-ATAGACAGATGGACAGCAGCAA-3′ | 5′-GGAGGTGCGAGTAGAGTGTTCT-3′ |
| CXCR4 | human | 5′-AAGGCAGTCCATGTCATCTACA-3′ | 5′-GCAAAGATGAAGTCGGGAATAG-3′ |
| ANGPT2 | human | 5′-AAACGCGGAAGTTAACTGATGT-3′ | 5′-TGATGTGCTTGTCTTCCATAGC-3′ |
| FABP4 | human | 5′-AGAAGTAGGAGTGGGCTTTGC-3′ | 5′-CCCATCTAAGGTTATGGTGCTC-3′ |
| LXN | human | 5′-GGTGAACTGCACAGCTGAAGTA-3′ | 5′-GAGCGTCATTTCTGGAGATACA-3′ |
| EFNA1 | human | 5′-ACTGTACCTGGTGGAGCATGAG-3′ | 5′-GCCTGAGGACTGTGAGAGATGT-3′ |
| CCL14 | human | 5′-ACCAAGACTGAATCCTCCTCAC-3′ | 5′-CCCTTTTGGTGATGAAGACAAT-3′ |
| VCAM1 | human | 5′-AAAAGCGGAGACAGGAGACA-3′ | 5′-AGCACGAGAAGCTCAGGAGA-3′ |
| 18S | human | 5′-GGAAGGGCACCACCAGGAGT-3′ | 5′-TGCAGCCCCGGACATCTAAG-3′ |
Cell extracts and Western blotting.
Whole cells were lysed with Pierce RIPA buffer (Thermo Scientific) supplemented with a protease inhibitor cocktail (Roche Applied Science). Briefly, 30 μg of protein samples were loaded per lane on a SDS-PAGE gel, underwent gel electrophoresis, and were transferred to a 0.2 μm nitrocellulose membrane (Bio-Rad). Membranes were blocked in 5% nonfat milk in Tris-buffered saline plus Tween 20 (TBST) and incubated with anti-β-actin, anti-ID1, anti-FABP4, anti-EFNA1, anti-LMO7, anti-KLF2 (Santa Cruz Biotechnology), anti-HYAL2, anti-CCL14 (ThermoFisher Scientific), anti-NOS3 (Cell Signaling Technology), anti-SERPINE2, anti-LXN, anti-ANGPT2, anti-TEK (R&D Systems), anti-KLF11 (Novus Biologicals) antibodies at 4°C overnight. After being washed in TBST, membranes were incubated with a diluted (1:10,000) IRDye-conjugated secondary antibody (Li-Cor Biotechnology) for 1 h at room temperature. Immunoblots were scanned, and the intensity of the protein bands was quantified using Image Studio software (Li-Cor).
Statistical analysis.
Statistical analyses of biological experiments among three groups were performed by ordinary one-way ANOVA with Bonferroni post hoc test. A P < 0.05 was considered statistically significant. Data are presented as means ± SE.
RESULTS
Extensive regulation of the endothelial transcriptome by shear stress.
Among 16,313 genes with at least one read count per million (≥1 fpm), more than half of the genes in ECs under OS or ST condition were differentially expressed compared with those under LS (8,177 for OS vs. LS and 9,369 for ST vs. LS) at the false discovery rate ≤ 0.05 threshold. On the other hand, only 1,618 of the genes were differentially expressed between ECs under ST and OS at the same threshold (all genes are shown in Supplementary Table S1).1 On the basis of gene types, we divided them into five groups, protein-coding genes, pseudogenes, antisense genes, genes for long intervening noncoding RNAs (lincRNAs), and others (Fig. 1A).
Fig. 1.
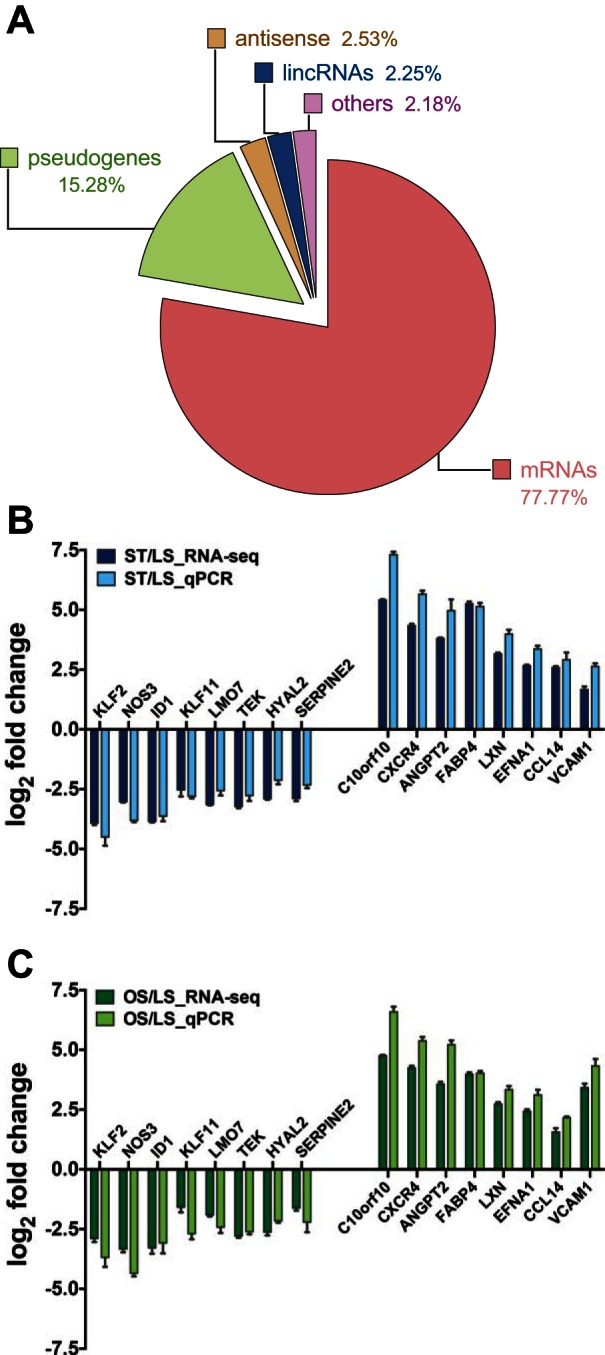
Summary of RNA-seq detected transcripts and quantitative real-time PCR (qPCR) confirmation. A: a pie chart showing the distribution of all detected genes as messenger RNAs (mRNAs), pseudogenes, antisense, long intervening noncoding RNAs (lincRNAs), and others. qPCR confirmation of representative genes detected by RNA-seq under static conditions (ST, B) and oscillatory sheer stress (OS, C) including Krüppel-like factor 2 (KLF2), nitric oxide synthase 3 (NOS3), inhibitor of DNA binding 1 (ID1), KLF11, LIM domain 7 (LMO7), TEK tyrosine kinase (TEK), hyaluronoglucosaminidase 2 (HYAL2), serpin peptidase inhibitor member 2 (SERPINE2), chromosome 10 open reading frame 10 (C10orf10), C-X-C chemokine receptor type 4 (CXCR4), angiopoietin-2 (ANGPT2), fatty acid binding protein 4 (FABP4), latexin (LXN), Ephrin-A1 (EFNA1), chemokine (C-C motif) ligand 14 (CCL14), vascular cell adhesion molecule 1 (VCAM1) (n = 4, respectively).
qPCR confirmation of RNA-seq results.
For qPCR confirmation, we selected a few well-known shear-sensitive genes, including KLF2, nitric oxide synthase 3 (NOS3), hyaluronoglucosaminidase 2 (HYAL2), C-X-C chemokine receptor type 4 (CXCR4), angiopoietin-2 (ANGPT2), fatty acid binding protein 4 (FABP4), vascular cell adhesion molecule 1 (VCAM1), inhibitor of DNA binding 1 (ID1), and some novel shear-sensitive ones, such as KLF11, LIM domain 7 (LMO7), TEK tyrosine kinase (TEK), serpin peptidase inhibitor member 2 (SERPINE2), chromosome 10 open reading frame 10 (C10orf10), latexin (LXN), Ephrin-A1 (EFNA1), and chemokine (C-C motif) ligand 14 (CCL14) to demonstrate the expression level from the same samples detected by qPCR. The expression of selected genes was further confirmed by additional independent experiments (data not shown). The qPCR data show a comparable fold change of gene expression level in ECs under ST (Fig. 1B) and OS (Fig. 1C) conditions compared with those under LS conditions.
Transcriptome analysis reveals the similarity between ECs under OS and ST conditions.
One salient observation from our RNA-seq data is the high similarity of gene expression profiles for ECs under OS and ST. For differentially expressed genes listed from OS vs. LS and ST vs. LS, a total of 7,220 genes (88.3% in OS vs. LS; 77.1% in ST vs. LS) overlapped. We further examined these genes according to their gene types. Numbers of genes that were differentially up- or downregulated in ECs under ST and OS are shown in proportional Venn diagrams in each group (Fig. 2, A–E). A large proportion of genes in each category overlapped in ECs under OS and ST conditions. A comparison of the qPCR results of the same genes in Fig. 1, B and C, further confirms the gene expression resemblance in ECs under ST and OS conditions (Fig. 2F).
Fig. 2.

A comparison of differentially expressed transcripts under ST and OS. Proportional Venn diagrams of differentially expressed transcripts under OS and ST. Numbers of mRNAs (A), pseudogenes (B), antisense transcripts (C), lincRNAs (D), and others (E) that were differentially expressed in endothelial cels (ECs) under OS and ST conditions compared with laminar sheer stress (LS) conditions. The overlap of 2 circles in each category represents common genes under OS and ST conditions. F: comparison of qPCR results of same genes under ST and OS in Fig. 1, B and C (n = 4, respectively).
In addition, we also examined gene expression profile similarity at individual sample levels. Hierarchical clustering analysis demonstrated a strong similarity between OS and ST samples (Fig. 3A), which was further confirmed by pairwise similarity heat map (Fig. 3B). In principal component analysis, ST and OS samples were completely separated from LS samples, and the shorter distance between ST and OS samples indicates the higher similarity between ST and OS (Fig. 3C).
Fig. 3.

Gene expression profile shows a strong similarity between endothelial transcriptome under ST and OS conditions. A: hierarchical clustering profile reveals detailed relationships between all samples under ST, OS, and LS conditions. The vertical distance reflects the similarity between samples. B: heat map of all 12 samples using Euclidean distance as a measure parameter. C: principal component analysis of gene expression profiles from each sample under ST, OS, and LS demonstrates the major components (Dim 1 and 2) of the variance to separate samples. Dim 1 and Dim 2 account for 47.5% and 10.61% of the total variance, respectively.
Immunoblotting shows comparable protein level in ECs under OS and ST conditions.
In addition to the comparable expression of these representative genes at the transcript level (Fig. 2F), we examined their protein levels in ECs under ST, OS, and LS conditions. We managed to immunoblot KLF2, NOS3, ID1, KLF11, LMO7, TEK, HYAL2, SERPINE2, ANGPT2, LXN, FABP4, EFNA1, and CCL14 under ST, OS, and LS conditions (Fig. 4A) with the quantification of band intensity (Fig. 4B). Genes under either ST or OS conditions showed significant up-/downregulation compared with those under LS conditions. Expectedly, there is no significance at the protein level of these genes in ECs under OS and ST conditions.
Fig. 4.

Protein expression level of representative shear-sensitive genes in ECs under ST, OS, and LS conditions. A: representative Western blots show the protein level of KLF2, NOS3, ID1, KLF11, LMO7, TEK, HYAL2, SERPINE2, ANGPT2, LXN, FABP4, EFNA1, and CCL14 (β-actin as loading control) in human coronary arterial endothelial cells (HCAECs) under ST, OS, and LS conditions for 24 h. B: the band intensity was quantitatively analyzed and normalized against the loading control, β-actin, and is shown in fold change (ST/LS or OS/LS). Data are from 3 independent experiments and presented as means ± SE.
DISCUSSION
We profiled the whole endothelial transcriptome by RNA-seq under different shear stress conditions. Our data demonstrate that the endothelial transcriptomic profile under LS conditions profoundly differs from those under either ST or OS conditions. High transcriptomic similarities were found in ECs under ST and OS conditions. Chen et al. (6) suggest that results obtained in ECs under LS conditions should be the reference given the biomechanical milieu in vivo, thus the absence of shear stress may be a pathological situation, suggesting that ECs under ST may deviate from normal. García-Cardeña et al. (17) first described there being many fewer differentially expressed genes in OS vs. ST than LS vs. ST conditions. However, due to limitations of the DNA microarray method, it was unlikely to distinguish the whole endothelial transcriptomes under different shear stress conditions. From our RNA-seq data, we found that 52.8% of differentially expressed genes in HCAECs under ST vs. OS conditions were in the same change direction compared with LS conditions. For example, there was a 2.5-fold upregulation of VCAM1 expression in ST vs. LS conditions and an approximately fourfold upregulation in OS vs. LS conditions, which accounts for a 1.5-fold difference between ST and OS conditions (Fig. 2F). Functional studies have demonstrated that there is greater human monocyte binding to ECs under either OS or ST compared with LS conditions (2, 20). Notably, there is no significant difference in the number of binding monocytes to ECs under ST and OS conditions (20), indicating that ECs under ST may be more pathologically relevant.
ECs in culture are different from those in vivo (10). The absence of hormonal and biomechanical stimuli are the two major forces (22). While the hormonal environment can be compensated for by introducing growth factors into the culture medium, the lack of biomechanical stimulation makes ECs in culture phenotypically different from those in vivo (16, 19). In an effort to address the impact of biomechanical stimulation, we used a cone-plate system to simulate shear stress in vivo and sought to survey the shear stress-induced transcriptomic change in ECs. Primary HCAECs at a relatively early passage were used for shear stress experiments to minimize the culture-induced adaptation.
In the present work, we exposed HCAECs to different shear stress conditions for 24 h. Previous studies have revealed that ECs under prolonged shear stress exhibit a gene expression profile that is distinct from those under short-term shear stress exposure (11), indicating an important role of temporal factors in shear stress studies. Here, we obtained the endothelial transcriptomic profile at one single time point, which is unlikely to demonstrate the transcriptome of ECs under transient or prolonged shear stress conditions. It will be very interesting to survey the dynamic changes of the endothelial transcriptome at different time points and investigate the role of temporal factors in shear stress-induced modulation.
In terms of individual genes, the key endothelial transcription factor KLF2, which is one of the master transcription factors in inflammation, thrombosis, and vasodilation (11, 24), was significantly downregulated in ECs under ST and OS (Fig. 1, B and C). In addition, eNOS, encoded by NOS3, was dramatically downregulated in both conditions as well. Considering its pivotal role in the conversion of l-arginine to nitric oxide, which leads to vascular relaxation and maintains vascular homeostasis, it follows that ECs in conventional static culture may be associated with a strong dysfunctional phenotype. LncRNA metastasis-associated lung adenocarcinoma transcript 1 (MALAT1) has emerged as a key regulator in endothelial function. Michalik et al. (27) showed a promigratory but antiproliferative endothelial phenotype by silencing MALAT1 in vitro. In addition, MALAT1 has been indicated in the control of cell cycle regulators (36). Our RNA-seq data reveal that MALAT1 is profoundly upregulated by LS, whereas there was no significant difference in ECs under OS and ST conditions. These findings further illustrate the similarity of endothelial transcriptome under OS and ST from a functional lncRNA's perspective.
In conclusion, this study focusing on the endothelial transcriptomic profiles under different shear stress conditions provides solid evidence that cultured ECs are significantly different from those under LS condition. The RNA-seq data suggest that it is unlikely to elucidate the endothelial physiology using ECs under ST conditions. Given the high similarities of the endothelial transcriptome under OS and ST conditions revealed by the present work, it may be helpful to understand the underlying mechanisms of OS-induced endothelial dysfunction from studies in cultured ECs.
GRANTS
This work was supported, in whole or in part, by National Heart, Lung, and Blood Institute Grants HL-068878 and HL-105114 (to Y. E. Chen).
DISCLOSURES
No conflicts of interest, financial or otherwise, are declared by the author(s).
AUTHOR CONTRIBUTIONS
C.Q., H.J., Y.E.C., and J.Z. conception and design of research; C.Q., I.J., and J.Z. performed experiments; C.Q. and F.M. analyzed data; C.Q. and F.M. interpreted results of experiments; C.Q. and F.M. prepared figures; C.Q. and F.M. drafted manuscript; C.Q., F.M., H.J., Y.E.C., and J.Z. edited and revised manuscript; Y.E.C. and J.Z. approved final version of manuscript.
Supplementary Material
ACKNOWLEDGMENTS
We thank Drs. Adam Lauver and Jie Xu for critically reading the manuscript. We thank Dr. Jianrong Yang for advice in bioinformatic analysis.
Footnotes
The online version of this article contains supplemental material.
REFERENCES
- 1.Akimoto S, Mitsumata M, Sasaguri T, Yoshida Y. Laminar shear stress inhibits vascular endothelial cell proliferation by inducing cyclin-dependent kinase inhibitor p21(Sdi1/Cip1/Waf1). Circ Res 86: 185–190, 2000. [DOI] [PubMed] [Google Scholar]
- 2.Ando J, Tsuboi H, Korenaga R, Takada Y, Toyama-Sorimachi N, Miyasaka M, Kamiya A. Shear stress inhibits adhesion of cultured mouse endothelial cells to lymphocytes by downregulating VCAM-1 expression. Am J Physiol Cell Physiol 267: C679–C687, 1994. [DOI] [PubMed] [Google Scholar]
- 3.Asakura T, Karino T. Flow patterns and spatial distribution of atherosclerotic lesions in human coronary arteries. Circ Res 66: 1045–1066, 1990. [DOI] [PubMed] [Google Scholar]
- 4.Beere PA, Glagov S, Zarins CK. Experimental atherosclerosis at the carotid bifurcation of the cynomolgus monkey. Localization, compensatory enlargement, and the sparing effect of lowered heart rate. Arterioscler Thromb 12: 1245–1253, 1992. [DOI] [PubMed] [Google Scholar]
- 5.Brooks AR, Lelkes PI, Rubanyi GM. Gene expression profiling of human aortic endothelial cells exposed to disturbed flow and steady laminar flow. Physiol Genomics 9: 27–41, 2002. [DOI] [PubMed] [Google Scholar]
- 6.Chen BP, Li YS, Zhao Y, Chen KD, Li S, Lao J, Yuan S, Shyy JY, Chien S. DNA microarray analysis of gene expression in endothelial cells in response to 24-h shear stress. Physiol Genomics 7: 55–63, 2001. [DOI] [PubMed] [Google Scholar]
- 7.Chien S. Mechanotransduction and endothelial cell homeostasis: the wisdom of the cell. Am J Physiol Heart Circ Physiol 292: H1209–H1224, 2007. [DOI] [PubMed] [Google Scholar]
- 8.Chien S. Effects of disturbed flow on endothelial cells. Ann Biomed Eng 36: 554–562, 2008. [DOI] [PMC free article] [PubMed] [Google Scholar]
- 9.Chiu JJ, Chien S. Effects of disturbed flow on vascular endothelium: pathophysiological basis and clinical perspectives. Physiol Rev 91: 327–387, 2011. [DOI] [PMC free article] [PubMed] [Google Scholar]
- 10.Cines DB, Pollak ES, Buck CA, Loscalzo J, Zimmerman GA, McEver RP, Pober JS, Wick TM, Konkle BA, Schwartz BS, Barnathan ES, McCrae KR, Hug BA, Schmidt AM, Stern DM. Endothelial cells in physiology and in the pathophysiology of vascular disorders. Blood 91: 3527–3561, 1998. [PubMed] [Google Scholar]
- 11.Dekker RJ, van Soest S, Fontijn RD, Salamanca S, de Groot PG, VanBavel E, Pannekoek H, Horrevoets AJG. Prolonged fluid shear stress induces a distinct set of endothelial cell genes, most specifically lung Krüppel-like factor (KLF2). Blood 100: 1689–1698, 2002. [DOI] [PubMed] [Google Scholar]
- 12.Dekker RJ, Van Thienen JV, Rohlena J, de Jager SC, Elderkamp YW, Seppen J, de Vries CJM, Biessen EAL, van Berkel TJC, Pannekoek H, Horrevoets AJG. Endothelial KLF2 links local arterial shear stress levels to the expression of vascular tone-regulating genes. Am J Pathol 167: 609–618, 2005. [DOI] [PMC free article] [PubMed] [Google Scholar]
- 13.Dimmeler S, Haendeler J, Rippmann V, Nehls M, Zeiher AM. Shear stress inhibits apoptosis of human endothelial cells. FEBS Lett 399: 71–74, 1996. [DOI] [PubMed] [Google Scholar]
- 14.Freedman LP, Cockburn IM, Simcoe TS. The economics of reproducibility in preclinical research. PLoS Biol 13: e1002165, 2015. [DOI] [PMC free article] [PubMed] [Google Scholar]
- 15.Fukushima T, Karino T, Goldsmith HL. Disturbances of flow through transparent dog aortic arch. Heart Vessels 1: 24–28, 1985. [DOI] [PubMed] [Google Scholar]
- 16.Galbraith CG, Skalak R, Chien S. Shear stress induces spatial reorganization of the endothelial cell cytoskeleton. Cell Motil Cytoskelet 40: 317–330, 1998. [DOI] [PubMed] [Google Scholar]
- 17.García-Cardeña G, Comander J, Anderson KR, Blackman BR, Gimbrone MA. Biomechanical activation of vascular endothelium as a determinant of its functional phenotype. Proc Natl Acad Sci USA 98: 4478–4485, 2001. [DOI] [PMC free article] [PubMed] [Google Scholar]
- 18.Gnasso A, Carallo C, Irace C, Spagnuolo V, De Novara G, Mattioli PL, Pujia A. Association between intima-media thickness and wall shear stress in common carotid arteries in healthy male subjects. Circulation 94: 3257–3262, 1996. [DOI] [PubMed] [Google Scholar]
- 19.Go YM, Boo YC, Park H, Maland MC, Patel R, Pritchard KA, Fujio Y, Walsh K, Darley-Usmar V, Jo H. Protein kinase B/Akt activates c-Jun NH2-terminal kinase by increasing NO production in response to shear stress. J Appl Physiol 91: 1574–1581, 2001. [DOI] [PubMed] [Google Scholar]
- 20.Honda HM, Hsiai T, Wortham CM, Chen M, Lin H, Navab M, Demer LL. A complex flow pattern of low shear stress and flow reversal promotes monocyte binding to endothelial cells. Atherosclerosis 158: 385–390, 2001. [DOI] [PubMed] [Google Scholar]
- 21.Hove JR, Köster RW, Forouhar AS, Acevedo-Bolton G, Fraser SE, Gharib M. Intracardiac fluid forces are an essential epigenetic factor for embryonic cardiogenesis. Nature 421: 172–177, 2003. [DOI] [PubMed] [Google Scholar]
- 22.Li YSJ, Haga JH, Chien S. Molecular basis of the effects of shear stress on vascular endothelial cells. J Biomech 38: 1949–1971, 2005. [DOI] [PubMed] [Google Scholar]
- 23.Liao Y, Smyth GK, Shi W. The Subread aligner: fast, accurate and scalable read mapping by seed-and-vote. Nucleic Acids Res 41: e108, 2013. [DOI] [PMC free article] [PubMed] [Google Scholar]
- 24.Lin Z, Kumar A, SenBanerjee S, Staniszewski K, Parmar K, Vaughan DE, Gimbrone MA, Balasubramanian V, García-Cardeña G, Jain MK. Kruppel-like factor 2 (KLF2) regulates endothelial thrombotic function. Circ Res 96: e48–e57, 2005. [DOI] [PubMed] [Google Scholar]
- 25.Malek AM, Greene AL, Izumo S. Regulation of endothelin 1 gene by fluid shear stress is transcriptionally mediated and independent of protein kinase C and cAMP. Proc Natl Acad Sci USA 90: 5999–6003, 1993. [DOI] [PMC free article] [PubMed] [Google Scholar]
- 26.Mercer TR, Dinger ME, Mattick JS. Long non-coding RNAs: insights into functions. Nat Rev Genet 10: 155–159, 2009. [DOI] [PubMed] [Google Scholar]
- 27.Michalik KM, You X, Manavski Y, Doddaballapur A, Zornig M, Braun T, John D, Ponomareva Y, Chen W, Uchida S, Boon RA, Dimmeler S. Long noncoding RNA MALAT1 regulates endothelial cell function and vessel growth. Circ Res 114: 1389–1397, 2014. [DOI] [PubMed] [Google Scholar]
- 28.Mortazavi A, Williams BA, McCue K, Schaeffer L, Wold B. Mapping and quantifying mammalian transcriptomes by RNA-Seq. Nat Meth 5: 621–628, 2008. [DOI] [PubMed] [Google Scholar]
- 29.Ni CW, Qiu H, Rezvan A, Kwon K, Nam D, Son DJ, Visvader JE, Jo H. Discovery of novel mechanosensitive genes in vivo using mouse carotid artery endothelium exposed to disturbed flow. Blood 116: e66–e73, 2010. [DOI] [PMC free article] [PubMed] [Google Scholar]
- 30.Ritchie ME, Phipson B, Wu D, Hu Y, Law CW, Shi W, Smyth GK. limma powers differential expression analyses for RNA-sequencing and microarray studies. Nucleic Acids Res 43: e47, 2015. [DOI] [PMC free article] [PubMed] [Google Scholar]
- 31.Sawchuk AP, Unthank JL, Davis TE, Dalsing MC. A prospective, in vivo study of the relationship between blood flow hemodynamics and atherosclerosis in a hyperlipidemic swine model. J Vasc Surg 19: 58–63, 1994. [DOI] [PubMed] [Google Scholar]
- 32.Takai J, Santu A, Zheng H, Koh SD, Ohta M, Filimban LM, Lemaître V, Teraoka R, Jo H, Miura H. Laminar shear stress upregulates endothelial Ca2-activated K+ channels KCa2.3 and KCa31 via a Ca2/calmodulin-dependent protein kinase kinase/Akt/p300 cascade. Am J Physiol Heart Circ Physiol 305: H484–H493, 2013. [DOI] [PMC free article] [PubMed] [Google Scholar]
- 33.Topper JN, Cai J, Falb D, Gimbrone MA. Identification of vascular endothelial genes differentially responsive to fluid mechanical stimuli: cyclooxygenase-2, manganese superoxide dismutase, and endothelial cell nitric oxide synthase are selectively up-regulated by steady laminar shear stress. Proc Natl Acad Sci USA 93: 10417–10422, 1996. [DOI] [PMC free article] [PubMed] [Google Scholar]
- 34.Topper JN, Gimbrone MA. Blood flow and vascular gene expression: fluid shear stress as a modulator of endothelial phenotype. Mol Med Today 5: 40–46, 1999. [DOI] [PubMed] [Google Scholar]
- 35.Traub O, Berk BC. Laminar shear stress: mechanisms by which endothelial cells transduce an atheroprotective force. Arterioscler Thromb Vasc Biol 18: 677–685, 1998. [DOI] [PubMed] [Google Scholar]
- 36.Tripathi V, Shen Z, Chakraborty A, Giri S, Freier SM, Wu X, Zhang Y, Gorospe M, Prasanth SG, Lal A, Prasanth KV. Long noncoding RNA MALAT1 controls cell cycle progression by regulating the expression of oncogenic transcription factor B-MYB. PLoS Genet 9: e1003368, 2013. [DOI] [PMC free article] [PubMed] [Google Scholar]
- 37.Wang Z, Gerstein M, Snyder M. RNA-Seq: a revolutionary tool for transcriptomics. Nat Rev Genet 10: 57–63, 2009. [DOI] [PMC free article] [PubMed] [Google Scholar]
Associated Data
This section collects any data citations, data availability statements, or supplementary materials included in this article.