Abstract
RNA secondary structure prediction is widely used to analyze RNA sequences. In an RNA partition function calculation, free energy nearest neighbor parameters are used in a dynamic programming algorithm to estimate statistical properties of the secondary structure ensemble. Previously, partition functions have largely been used to estimate the probability that a given pair of nucleotides form a base pair, the conditional stacking probability, the accessibility to binding of a continuous stretch of nucleotides, or a representative sample of RNA structures. Here it is demonstrated that an RNA partition function can also be used to calculate the exact probability of formation of hairpin loops, internal loops, bulge loops, or multibranch loops at a given position. This calculation can also be used to estimate the probability of formation of specific helices. Benchmarking on a set of RNA sequences with known secondary structures indicated that loops that were calculated to be more probable were more likely to be present in the known structure than less probable loops. Furthermore, highly probable loops are more likely to be in the known structure than the set of loops predicted in the lowest free energy structures.
Keywords: RNA secondary structure, partition function, RNA folding thermodynamics, coaxial stacking, stochastic sampling
INTRODUCTION
RNA, like other biopolymers, folds into distinct structures that are crucial for function. Structured RNAs have numerous functions in a cell, including catalyzing the elongation of the amino acid chain in protein synthesis by rRNA (Noller et al. 1992; Ban et al. 2000), catalyzing pre-mRNA splicing by self-splicing introns (Kruger et al. 1982; Fica et al. 2013), regulating gene expression by siRNA (Fire et al. 1998), and regulating gene expression in response to ligands using riboswitches (Nahvi et al. 2002; Winkler et al. 2004; Serganov and Nudler 2013). RNA secondary structure, defined as the set of A-T, C-G, and G-U canonical pairs in an RNA structure, is a resolution that has proven useful for studying RNA. Secondary structures have been used to find functional RNA in genomes (Macke et al. 2001; Klein and Eddy 2003; Torarinsson et al. 2006; Uzilov et al. 2006; Yao et al. 2006; Nawrocki et al. 2009; Gorodkin et al. 2010; Gruber et al. 2010; Fu et al. 2015), to find regions of an RNA that are accessible for binding by siRNAs (Heale et al. 2005; Lu and Mathews 2007; Tafer et al. 2008), and for designing RNAs with desired structures or functions (Hofacker et al. 1994; Zadeh et al. 2010; Garcia-Martin et al. 2013; Lee et al. 2014). Secondary structure prediction can also be used to search for motifs of interest, such as binding sites for small molecules (Velagapudi et al. 2014) or proteins (Re et al. 2014). For example, Velagapudi et al. (2014) identified potential RNA drug targets by searching for natural RNAs with structures that contain motifs that were expected to bind small molecules.
Secondary structure can be computationally predicted. The most popular structure prediction algorithms, implemented in Mfold/UNAFold (Zuker 2003), the ViennaRNA Package (Lorenz et al. 2011), and RNAstructure (Reuter and Mathews 2010; Bellaousov et al. 2013), use a nearest neighbor model that can estimate the Gibbs free energy of folding for an RNA molecule. A search using dynamic programming can find the structure with the lowest (i.e., most negative) free energy, which is the most probable structure at equilibrium (Nussinov and Jacobson 1980; Zuker and Stiegler 1981). In one benchmark, 61.2% of pairs in predicted structures are present in accepted structures, and 68.9% of accepted pairs are in the predicted structure (Bellaousov and Mathews 2010), which is sufficient accuracy to develop testable hypotheses about the structure. Incorporation of sequence comparison information by using multiple homologous sequences (Seetin and Mathews 2012; Schirmer et al. 2014) or information from experimental data (Deigan et al. 2009; Cordero et al. 2012; Sloma and Mathews 2015) into the structure prediction results in excellent accuracy, with up to 90% of predicted pairs being correct.
While studies of the minimum free energy structure have proven useful, many functional RNAs, such as mRNA, are probably not frozen in a single minimum free energy structure; rather, they exist in ensembles of secondary structures. Further, in many functional RNAs, the secondary structure changes as part of the function. One example of this is riboswitches, in which presence of a ligand causes a secondary structure change to modulate transcription, translation, or splicing (Serganov and Nudler 2013). Accurate estimates of RNA switching could also be highly useful in synthetic biology applications, where circuits can be made entirely of RNA, which serves as both a messenger and an effector (Davidson and Ellington 2007).
Another calculation, the partition function, accounts for the statistical properties of the secondary structure ensemble. The partition function allows the calculation of base-pairing probabilities for each pair of nucleotides in the molecule, and also the probability that each nucleotide is unpaired. In effect, this allows all possible secondary structures to be considered simultaneously with their exact weighting in the Boltzmann ensemble. This is useful for estimating confidence in predicted base pairs (Mathews 2004), predicting accessibility to base-pairing of an RNA sequence (Lu and Mathews 2007; Tafer et al. 2008), and stochastically sampling from the equilibrium ensemble of structures (Ding and Lawrence 2003). Further work extended the partition function to calculate the probability of base pair stacks instead of individual base pairs (Bompfunewerer et al. 2008).
This work develops a new method to use an RNA partition function to calculate the probability of hairpin loops, internal loops, bulge loops, and multibranch loops in an RNA structure, as well as the probability of base pair stacks and helices of any length. Calculating the probability of a hairpin loop, internal loop, or helix is analogous to calculating the probability of a base pair in that the calculation uses intermediate values saved from the dynamic programming tables used in the partition function calculation, and therefore requires no additional computation. Calculating the probability of a multibranch loop requires additional computation because the equilibrium constant for a multibranch loop is not tabulated in the energy model and must be calculated. In this work, an algorithm is presented to calculate the equilibrium constant for a multibranch loop using dynamic programming. This algorithm has complexity O(P + U), where P is the number of helices in the multibranch loop and U is the number of unpaired nucleotides.
It is important to note that, although a loop or helix contains multiple pairs, its probability is distinct from the probabilities of the constituent pairs and unpaired nucleotides. This is because base pair formation probabilities are not independent events. Knowledge of the presence of a base pair at one position affects the conditional probability of other pairs in the ensemble. In the loop probability calculation, loop or helix formation is treated as a single event. Like the pair probabilities, these loop probabilities are the sum of the probabilities of all of the structures that contain the loop in the ensemble of all structures. This gives the probability of only a single loop; joint probabilities for non-mutually exclusive loops would require additional computation.
Using this method, loop and helix probabilities were calculated for a set of RNAs with known secondary structures. As shown in Results, below, loops and helices with high probability were more likely to be found in the true structure, and this method was more accurate at finding loops than minimum free energy structure prediction.
RESULTS
Calculation of loop and helix probabilities from the partition function was implemented in a stand-alone program, ProbScan, which has been incorporated into the RNAstructure software package. ProbScan runs in two modes: search mode and calculation mode. In search mode, the program takes a nucleotide sequence, identifies all of the possible loops or helices of a user-specified type (i.e., hairpin loops, bulge loops, internal loops, or helices of a specified length), and calculates the probability of each. The output is a list of loops, specified by the position of their closing base pairs, and a corresponding probability. Search is not implemented for multibranch loops because the large space of possible multibranch loops makes the computational expense of this calculation prohibitive. In calculation mode, the program takes a list of closing base pairs and either an RNA sequence or the output of a partition function calculation. ProbScan identifies the type of loop that these pairs describe, performs the probability calculation for this loop, and outputs its probability. Source code and executable binaries are provided at http://rna.urmc.rochester.edu as part of the RNAstructure package (Reuter and Mathews 2010). Additionally, the website provides a C++ class and Python scripting interface for convenient incorporation of loop probability calculations into other software.
Benchmarking the exact calculation of loop probabilities
To assess the accuracy of loop probability estimates, loops with predicted probability above specific thresholds were compared against accepted RNA secondary structures. A set of 3847 RNA sequences with known secondary structures was used as a benchmarking data set (see Materials and Methods, below, for a description of the benchmarking data set). The set includes small subunit ribosomal RNA (22 sequences), large subunit ribosomal RNA (six sequences), 5S ribosomal RNA (1283 sequences), group I self-splicing introns (98 sequences), signal recognition particle RNA (928 sequences), RNase P (454 sequences), tRNA (557 sequences), tmRNA (462 sequences), and telomerase RNA (37 sequences). The probability of all possible hairpin loops and all internal or bulge loops in the test set with 30 or fewer unpaired nucleotides was tabulated, and loops whose calculated probability were above a probability threshold were compared to the known structure. The limit on bulge/internal loop size was used because secondary structure prediction software typically disallows internal loops larger than 30 unpaired nucleotides (Zuker 1989; Reuter and Mathews 2010; Lorenz et al. 2011).
A predicted loop was scored as correct if the loop precisely matched a loop present in the accepted structure. That is, the closing pairs must be identical between the predicted and accepted structures, and all nucleotides that are unpaired in the predicted loop must also be unpaired in the accepted loop. Single-nucleotide bulges that are part of a run of identical nucleotides can migrate position, as shown by optical melting experiments and NMR (Woodson and Crothers 1987; Znosko et al. 2002; Mathews et al. 2004). Therefore, these single-nucleotide bulge loops were excluded from the benchmark because they cannot be precisely localized. In the database of known structures, there were 2255 loops of this type that were excluded, out of a total of 6477 single-nucleotide bulges.
Because the space of all possible multibranch loops is too large to be explicitly enumerated, candidate multibranch loops were found by enumerating all low free energy structures within RT (at 37°C, taken as 0.6 kcal/mol) of the minimum free energy structure (Wuchty et al. 1999). This energy increment is small enough that these loops are expected to be well populated at equilibrium. Probabilities were calculated for this set of multibranch loops and compared to the true structure.
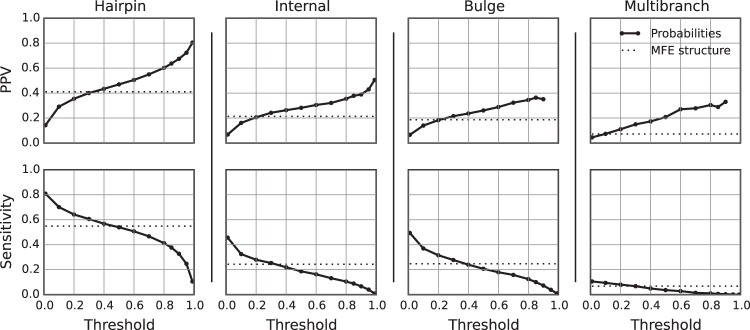
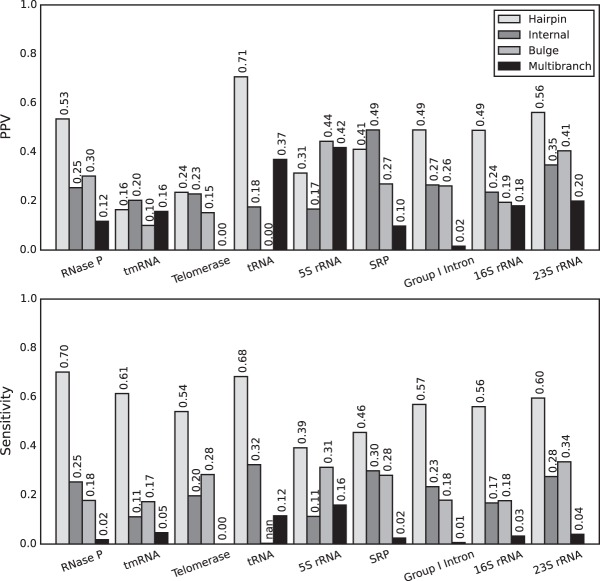
The results of the benchmark were quantified in terms of the positive predictive value (PPV), which is the fraction of predicted loops that are present in the accepted structure, and the sensitivity, which is the fraction of accepted loops that were predicted (Supplemental Table S1). Families can have a large difference in the number of accepted loops. Therefore, sensitivity and PPV were reported as a mean for each family to avoid the introduction of bias by families with a large number of loops. Furthermore, the average by family provides an expectation of performance on new families with unknown structure. Hairpin loops, internal loops, and bulge loops that were estimated to be highly probable were more likely to be present in the true structure, i.e., they had higher average PPVs (Fig. 1). A large fraction of loops in the accepted structures was predicted with low probability, resulting in an excellent sensitivity at low probability thresholds, although the sensitivity rapidly decreases as the threshold becomes more stringent. Substantial variation in the quality of loop prediction was observed across families of RNA sequences (Fig. 2), which is unsurprising because pair prediction accuracy likewise varies between families of sequences (Mathews et al. 1999, 2004; Lorenz et al. 2011).
FIGURE 1.
Accuracy of loop probability estimation using the exact calculation. The probabilities of all possible hairpin loops (far left), internal loops (middle left), and bulge loops (middle right), and all multibranch loops found in low free energy structures (far right) were calculated. Loops with probabilities greater than the specified threshold were compared to the true structure. In each panel, the PPV (top plot) and sensitivity (bottom plot) are plotted as a function of threshold value. The dotted line in each plot gives the PPV or sensitivity of a minimum free energy structure prediction, i.e., the accuracy of loops that are present in the predicted minimum free energy structure.
FIGURE 2.
Variation in the accuracy of the probability calculation by family of structured RNA. For each family, PPV (top) and sensitivity (bottom) are shown for loops with calculated probabilities >40%. The 40% threshold is chosen arbitrarily, and variation is similar at other thresholds (Supplemental Table S1).
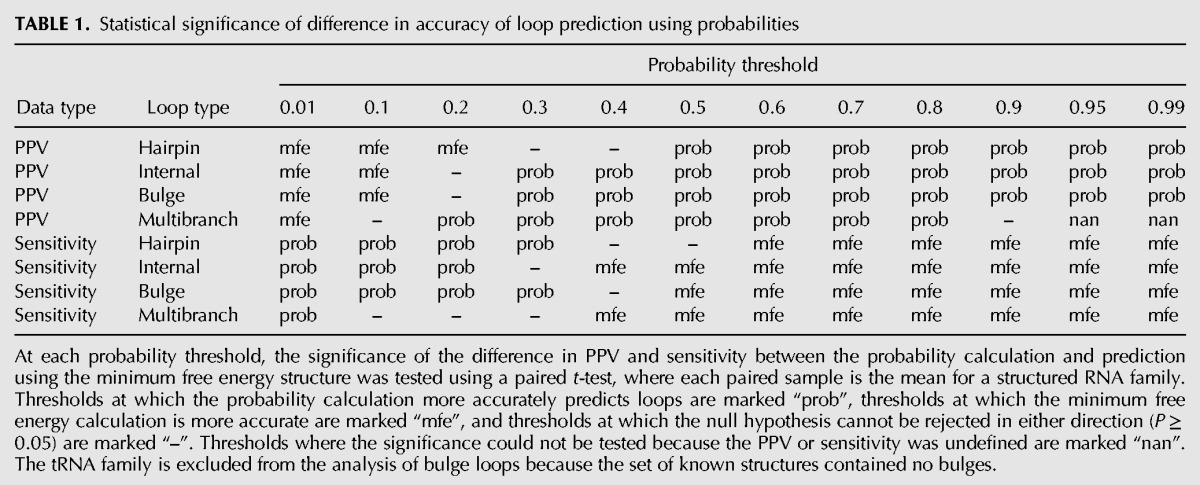
As a control, loops found in the predicted minimum free energy (MFE) structure of each RNA sequence were compared to the known structure (Fig. 1). The statistical significance in the difference between prediction of loops using thresholded loop probabilities as opposed to using the minimum free energy structure was tested using a paired, two-tailed t-test, where each paired sample was the PPV or sensitivity for a family of sequences. For all loop types, setting the PPV at a sufficiently high threshold, or the sensitivity at a sufficiently low threshold, results in a significant improvement over MFE prediction. Notably, for all of the loop types, a probability threshold can be chosen such that the sensitivity is not significantly different than for MFE prediction, but the PPV is higher, and for bulge loops, thresholds can be chosen such that both the PPV and the sensitivity are higher (Table 1).
TABLE 1.
Statistical significance of difference in accuracy of loop prediction using probabilities
Estimation of loop probabilities by stochastic sampling
Stochastic sampling (Ding and Lawrence 2003) provides another method to estimate the probability of loops in the secondary structure. Stochastically sampled structures are drawn from the ensemble of possible structures with probability equal to their weight in the ensemble. Therefore, the frequency that a particular loop appears in the sample approximates its probability in the ensemble.
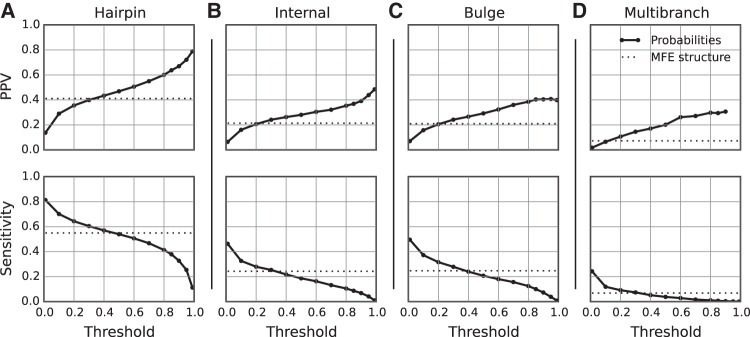
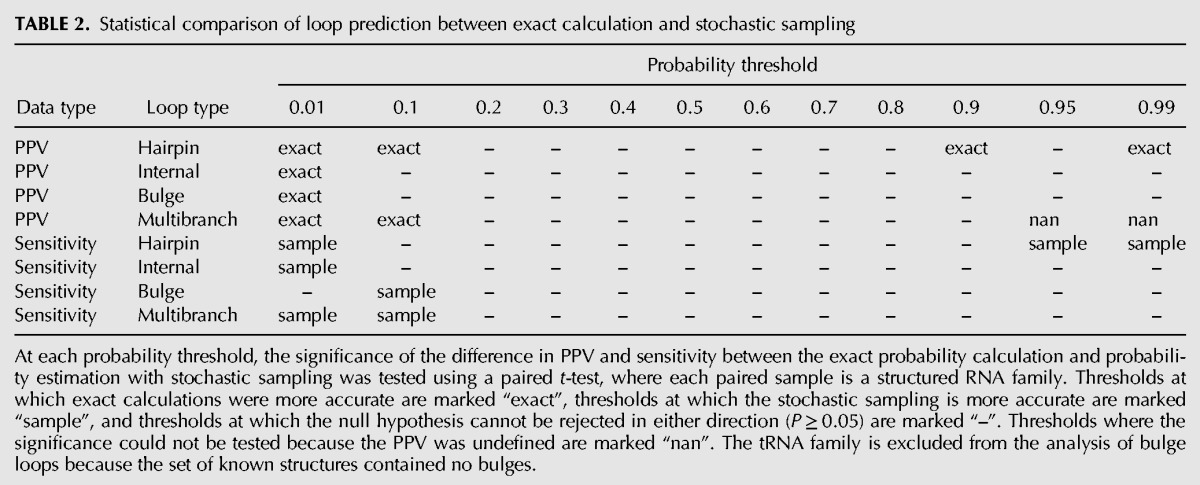
Loop probabilities were calculated from stochastic samples of 1000 structures for each sequence in the benchmarking data set, and compared to the accepted structures in the same manner as the exact probability calculation (Supplemental Table S2). The resulting plots of PPV and sensitivity against predicted probability are nearly identical to those from the exact calculation (Fig. 3). In general, the PPV for the exact calculation is slightly higher and the sensitivity for the exact calculation is slightly lower at low threshold probabilities, 0.1 or lower. The absolute differences in PPV and sensitivity, however, are small (<5%), and a paired, two-tailed t-test across families at each threshold probability revealed only a few statistically significant differences (Table 2).
FIGURE 3.
Accuracy of loop probability estimation using stochastic sampling. The frequencies of hairpin loops (A), internal loops (B), bulge loops (C), and multibranch loops (D) found in 1000 structures provided probability estimates, and loops with probabilities greater than a specified threshold were compared to the known structure. Here, the PPV (top) and sensitivity (bottom) are plotted as a function of threshold value. The dotted line in each plot gives the PPV or sensitivity of a minimum free energy structure prediction.
TABLE 2.
Statistical comparison of loop prediction between exact calculation and stochastic sampling
Estimation of helix probabilities
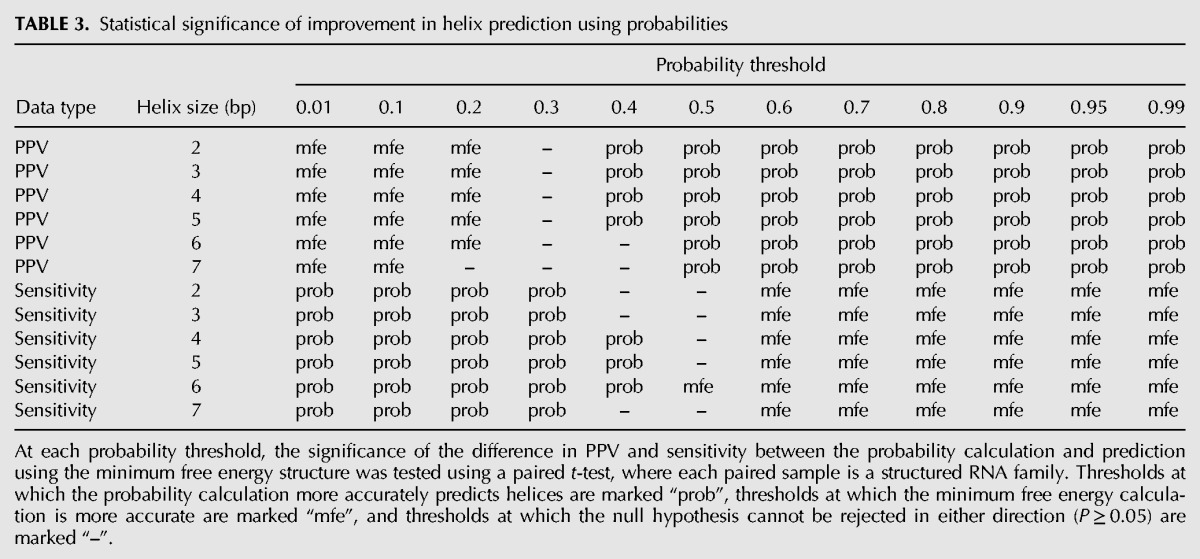
The probability of helix formation can be calculated in a similar manner to the probability of internal loop formation. In this calculation, the probability of a helix is the probability of having a helix of at least the specified length, i.e., the helix might continue in either direction and these longer helices contribute to the probability that is calculated. Probabilities of all possible helices containing up to 7 bp were calculated for the sequences in the benchmarking data set, and loops with probabilities greater than a threshold value were compared to the true structure (Fig. 4). The limit of 7 bp was chosen because not all families contained structures with helices longer than 7 bp. Like the loop probabilities, highly probable helices were more likely to be in the true structure. For some helix lengths, there existed thresholds where both the sensitivity and PPV were significantly improved compared to the minimum free energy calculation (Table 3).
FIGURE 4.
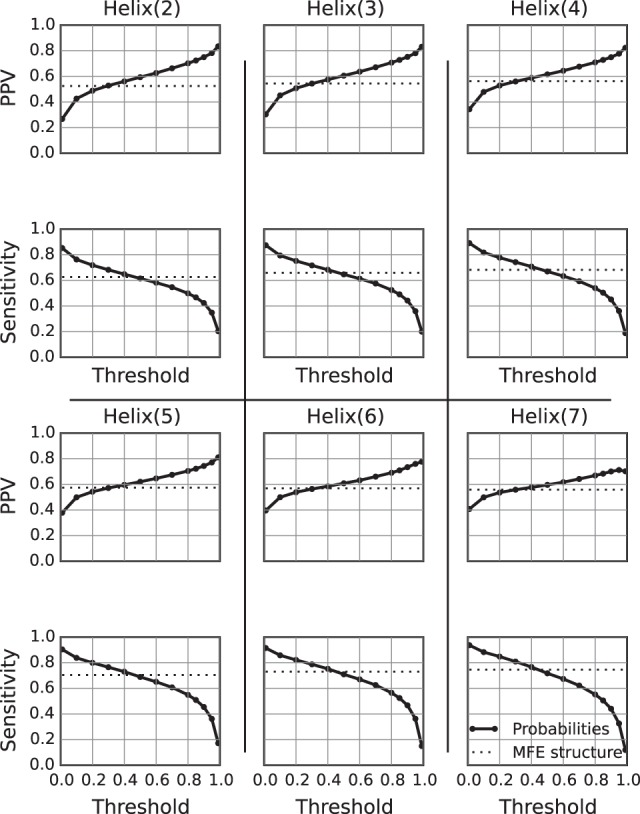
Accuracy of helix probability estimation. The probabilities of all possible helices containing 2–7 bp were calculated. Helices with probabilities greater than some threshold were compared to the true structure. Here, the PPV (top) and sensitivity (bottom) are plotted against threshold values at each length. The dotted line in each plot gives the PPV or sensitivity of a minimum free energy structure prediction.
TABLE 3.
Statistical significance of improvement in helix prediction using probabilities
Testing coaxial stacking nearest neighbor parameters
The nearest neighbor energy model includes parameters for coaxial stacking in multibranch loops (Walter et al. 1994; Kim et al. 1996; Mathews et al. 2004). Partition function calculations that consider coaxial stacking take approximately fourfold more computer time (Mathews 2004) than those that do not consider coaxial stacking, but coaxial stacking provides only a modest improvement in the accuracy of predicted minimum free energy structures (Mathews et al. 2004; Lorenz et al. 2011). To test whether the coaxial stacking parameters improve the prediction of multibranch loop probabilities, multibranch loop probability calculations were also benchmarked without the coaxial stacking terms in the nearest neighbor rules (Fig. 5; Supplemental Table S3). Partition function calculations were performed without the use of the coaxial stacking nearest neighbor parameters, and loop probabilities were likewise calculated without coaxial stacking. The candidate multibranch loops for the benchmark were found by enumerating low-energy structures without including coaxial stacking in the energy model. Including coaxial stacking resulted in higher sensitivity for all thresholds and higher PPV for thresholds greater than 0.6. Given the size of the benchmark, the accuracy improvement was not statistically significant for either sensitivity or PPV at any threshold tested.
FIGURE 5.
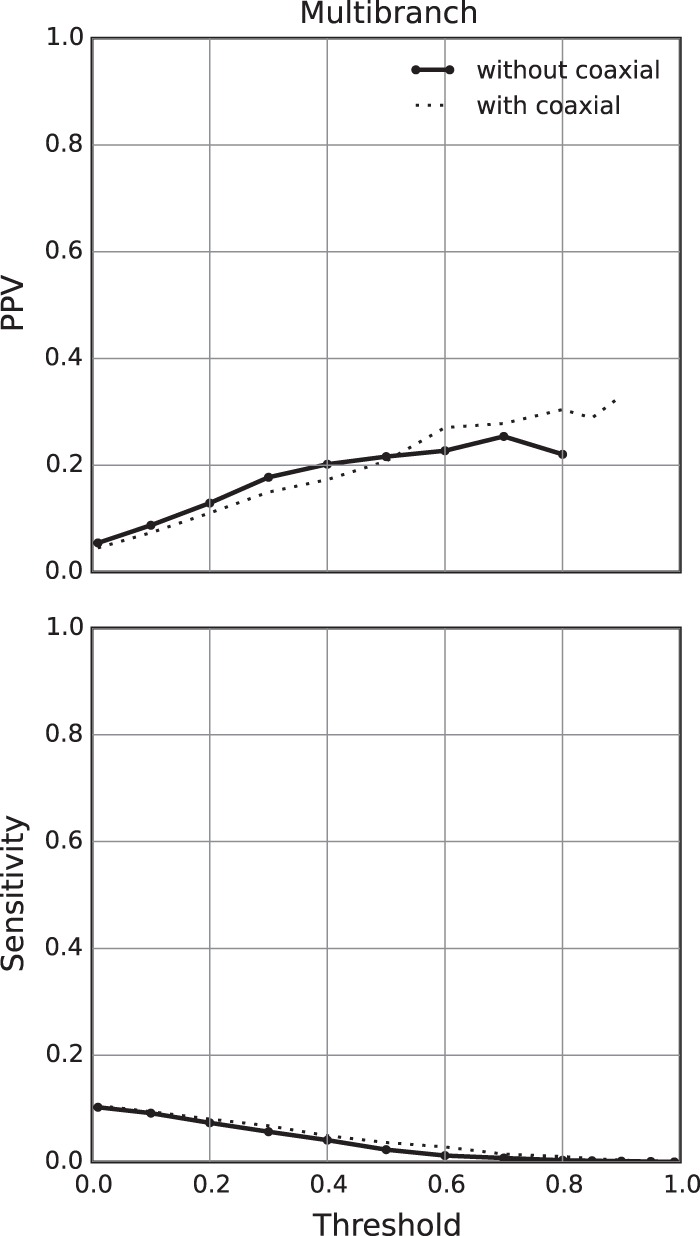
Accuracy of multibranch loop prediction without the use of coaxial stacking nearest neighbor parameters. The probabilities of all multibranch loops found in low free energy structures were calculated with the use of coaxial stacking nearest neighbor parameters, and loops with probabilities greater than the threshold were compared to the true structure. Here, the PPV (top) and sensitivity (bottom) are plotted against threshold value. The dotted line in each plot gives the PPV or sensitivity of a minimum free energy structure prediction without coaxial stacking parameters.
DISCUSSION
In this work, a method was presented to calculate exact probabilities for hairpin loops, internal loops, multibranch loops, and helices in an RNA secondary structure, using the data from previous calculations of partition functions. In general, loops with higher probabilities are more likely to be present in the true structure. The predictions have limitations, however. Inspection of the predicted loops for a small subunit ribosomal RNA revealed that many of the high-probability loops that were not in the true structure were near pseudoknotted regions (data not shown). This makes sense because the partition function calculation used here does not consider pseudoknotted structures, so prediction of pseudoknotted regions is expected to be inaccurate. Other loops were closed by base pairs one nucleotide away from the real closing pair, which could reflect inaccuracies in the nearest neighbor parameters, the effect of tertiary structure, or imprecision in the accepted structure, inferred by comparative analysis. It is also possible that some apparent inaccuracies in the loop probabilities reflect the real secondary structure ensemble, where a loop that is not present in the accepted structure (and is therefore scored as an incorrect prediction) may actually exist some fraction of the time.
Loop probabilities can also be closely approximated by stochastic sampling. These methods have the same asymptotic complexity of O(N3) in time, where N is the sequence length, although the stochastic sampling approach is faster by a constant factor when the probabilities of unknown loops are desired because the partition function calculation for exterior fragments, which takes roughly half the computation time, does not need to be performed. The stochastic sampling approach has the additional advantage that it can find probable multibranch loops without the use of another structure calculation to find candidates. In contrast, the exact calculation can query the probability for a loop at a specific position in constant time when the position of the desired loop is known (e.g., annotation of predicted structures), if the partition function has already been calculated. Both methods are fast in practice on actual sequences.
This calculation is useful for annotating predicted structures, as with base-pairing probabilities. Figure 6 shows an example structure prediction, with annotation. Annotation with predicted base-pairing probabilities is currently used to identify pairs that are more likely to be correctly predicted than average (Mathews 2004), and annotation with loop probabilities could provide further information to evaluate predictions. The structure drawing program from RNAstructure (Reuter and Mathews 2010), draw, was extended to color-annotate predicted structures according to loop and helix probabilities.
FIGURE 6.
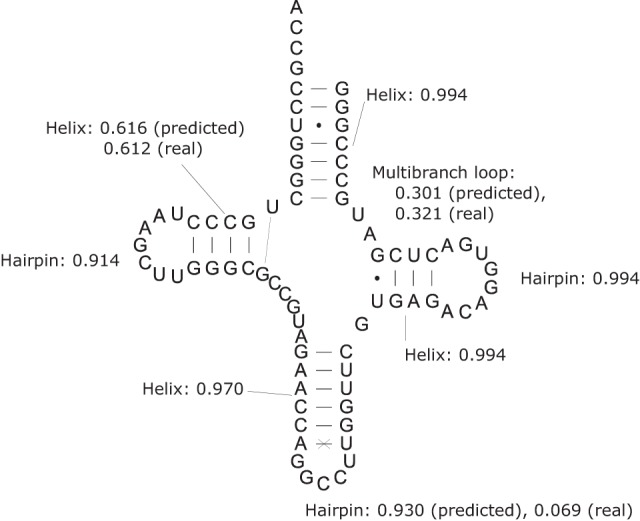
The predicted minimum free energy structure of tRNA-arginine from Haloferax volcanii (Sprinzl et al. 1998), annotated with predicted probabilities for the loops and helices. An x across a base pair indicates an incorrectly predicted base pair, and the dashed line represents a true pair that is not in the predicted structure. Note that in the central multibranch loop, which is incorrectly predicted in the MFE structure, the calculated probability of the true loop is higher than that of the incorrectly predicted loop. In the structure calculations, modified nucleotides that cannot fit in A-form helices were forced to be unpaired (Mathews et al. 1999).
An important application of this method is the search for structural motifs in the sequence of natural RNAs, such as the search for loops that are known to bind to a small molecule. The Inforna approach identifies small molecules that will bind target RNAs (Velagapudi et al. 2014), and has been used to find pre-miRNAs that can be targeted with small molecules. It predicts minimum free energy structures and then looks for small molecules that will potentially bind the loops in the minimum free energy structure. The probabilistic method described here could replace the use of the minimum free energy structure prediction in these searches. Because the loop probability calculation can find more of the true loops than the minimum free energy structure (higher sensitivity), or more reliably identify loops in the true structure (higher PPV), loop probabilities would provide a more flexible and robust method for motif search. This might be especially true if the RNAs being searched have more complicated secondary structures than the simple hairpin stem–loop structure of a pre-miRNA.
Interestingly, coaxial stacking parameters did not significantly improve the probability calculation for multibranch loops in this benchmark. It is important to note, however, that the coaxial stacking parameters might still improve multibranch loop prediction in spite of this lack of statistical significance, as the PPV for multibranch loops with high calculated probabilities (>0.8) was excellent (PPV >0.6). For each probability threshold greater than 0.8, there is at least one RNA family for which no multibranch loops were predicted, and for a threshold of 0.99, multibranch loops were predicted for no families when coaxial stacking parameters are not used (Supplemental Table S3). As a result, the PPV for the multibranch loop prediction without coaxial stacking is undefined for these families, and the overall significance of the difference between multibranch loop predictions with and without coaxial stacking parameters cannot be assessed at these thresholds.
MATERIALS AND METHODS
Pair probability calculation
The RNA partition function Q is given by
where s is a structure from the set, S, of possible pseudoknot-free secondary structures, R is the universal gas constant, and T is the absolute temperature (McCaskill 1990). In the dynamic programming calculation of the partition function in RNAstructure, which was previously described (Mathews 2004), intermediate values of Q are calculated for subsequences and held in N × N upper triangular matrices, where N is the length of the full sequence. In this calculation, the Vinterior and Vexterior tables are used from the partition function calculation. Vinterior(i,j) holds the partition function for the subsequence from i to j where i and j are required to form a base pair. Vexterior(i,j) holds the partition function for nucleotides from 1 to i and j to N, where i and j are required to pair. The probability for a base pair between nucleotides i and j is therefore given by
Loop probability calculation
The probability calculation for a loop extends naturally from the probability of a pair. A diagram of each calculation is shown in Figure 7. The probability for a hairpin loop closed by nucleotides at i and j is given by
where the hairpin loop equilibrium constant, Khairpin(i,j), is tabulated with nearest neighbor parameters (Turner and Mathews 2009).
FIGURE 7.
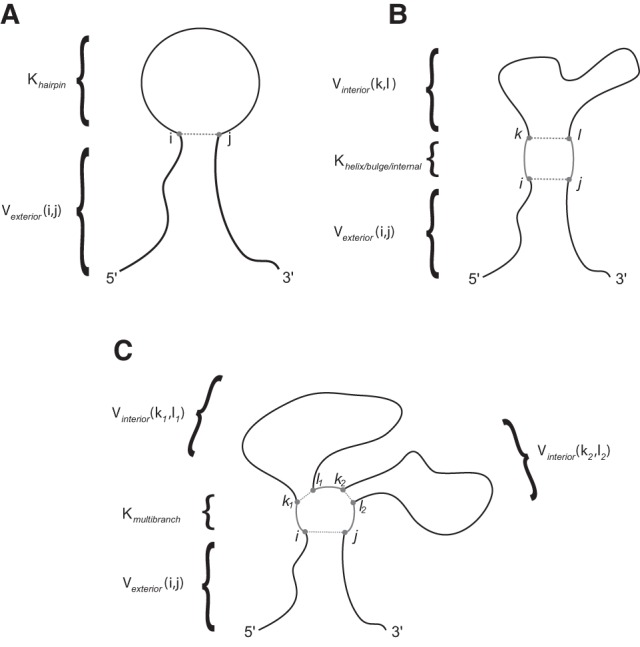
A diagram depicting the loop probability calculation for (A) hairpin loops; (B) helices, bulges, and internal loops; and (C) multibranch loops. For the region of the RNA containing the loop or helix, shown in gray, the structure is known, and there is an equilibrium constant K for the region in the nearest neighbor parameters. For the regions with unknown structure, shown in black, the partition function for the region can be found in the V table from the partition function calculation. The known region is “frozen in place” while the rest of the structure varies, so all secondary structures containing the loop or helix are implicitly accounted for.
The probability for an internal loop, bulge loop, or helix closed by pairs i,j and k,l, where i < k < l < j, is given by
The equilibrium constant for an internal loop or bulge loop is tabulated from the nearest neighbor parameters (Turner and Mathews 2009). The equilibrium constant for a helix is given by the product of the equilibrium constants for each base pair stack in the helix (and is tabulated directly for the case of a helix containing 2 bp, and therefore the helix contains a single stack). The helix probability calculated in this way is therefore the joint probability of its constituent stacks, and it does not distinguish whether there are any further, adjacent stacks. The helix probability, therefore, includes the probability that the helix is part of another, longer helix.
The probability for a multibranch loop is similar to the internal loop but there are multiple interior fragments. For a w-way junction closed on the exterior by i, j and on the interior by a set m of pairs k, l, the probability is
The equilibrium constant for the multibranch loop, Kmulti, can be calculated by summing the equilibrium constants of all configurations of coaxial stacks, terminal mismatches, and dangling ends (Tyagi and Mathews 2007). For the calculations without coaxial stacking, only the parameters for dangling ends and terminal mismatches are used. An algorithm is presented below to calculate this number efficiently.
A dynamic programming algorithm to calculate the equilibrium constant of a multibranch loop
Consider a multibranch loop M composed of N′ elements, e1…N′, where an element is either an unpaired nucleotide or a base pair closing a helix. Element e1 represents the closing base pair of the multibranch loop, i.e., the pair of the most 5′ and 3′ nucleotides in the loop. The equilibrium constant, KM, is calculated from the sum of the equilibrium constants for each possible arrangement of dangling ends, terminal mismatches, and coaxial stacks. The space of possible configurations is large, but the sum of the contribution of each state can be calculated without actually enumerating all of the configurations by storing intermediate results, representing the sums of equilibrium constants for interactions that can occur in a particular subsequence in a set of arrays, here denoted A. This calculation is performed as follows.
Let Ai′ be a one-dimensional array of length N′ where Ai′ (j′) denotes the sum of possible nearest neighbor contributions of the elements in the fragment of the multibranch loop from ei′ to ei′+j′, inclusive. The multibranch loop is “circularized” such that ei′ is the same element as ei′+N′. Multiple arrays are used because it is necessary to consider interactions across the “ends” of the multibranch loop, such as an unpaired nucleotide at position N making a 5′ dangle on a helix at position 1. Four Ai′ arrays are used, A1, A2, A3, and A4. These each have the same length but different start and end positions, to account for the phases in which elements can interact to stabilize the multibranch loop. They represent the sequences of elements from 1 to N′, 2 to N′ + 1, 3 to N′ + 2, and 4 to N′ + 3, respectively. Four phases are necessary because the largest interaction that can occur, a mismatch-mediated coaxial stack containing two helices and two unpaired nucleotides, contains four elements. A can be filled using the recurrence equations:
if the element at position i + j is an unpaired nucleotide:
Otherwise, i.e., the element at i′ + j′ is a base pair:
Each array Ai is filled starting with j′ = 1 up to N′. Here, K3′ dangle(e1,e2) is the equilibrium constant for an unpaired nucleotide at e2 dangling on a helix at e1, or 0 if e1 is an unpaired nucleotide or e2 is a helix. K5′ dangle(e1,e2) is the equilibrium constant for an unpaired nucleotide at e1 dangling on a helix at e2, or 0 if e1 is a helix or e2 is an unpaired nucleotide. Kterminal stack(e1,e2,e3) is the equilibrium constant for a terminal stack where unpaired nucleotides at e2 and e3 both stack on a helix at e1, or 0 if e1 is not a helix or e2 and e3 are not unpaired nucleotides. Kflush coaxial(e1,e2) is the equilibrium constant for a coaxial stack between helices at e1 and e2, or 0 if e1 or e2 is an unpaired nucleotide. Kmismatch coaxial(e1,e2,e3,e4) is the equilibrium constant for helices at e1 and e2 forming a coaxial stack mediated by a mismatch between unpaired nucleotides at e3 and e4, or 0 if either e1 or e2 are unpaired nucleotides or e3 or e4 are helices.
Once A is filled, the full equilibrium constant is given by
This final calculation accounts for the interactions that can occur between the two “ends” of a multibranch loop. The possible interactions are limited because the first element of the multibranch loop is the closing base pair. All equilibrium constants used are tabulated in the nearest neighbor parameters. The time and memory performance of the calculation is linear in the number of elements in the multibranch loop.
Structure calculations
All structure calculations were performed using RNAstructure 5.7 (Reuter and Mathews 2010), using the default settings on all programs except as otherwise noted. The Fold program was used to generate minimum free energy structures. The AllSub program was used to exhaustively enumerate low free energy structures (Wuchty et al. 1999; Duan et al. 2006). The stochastic program was used to perform stochastic sampling (Ding and Lawrence 2003). The new ProbScan program was used to calculate loop and helix probabilities.
Database of test structures
A database containing 10 families of reference structures determined by comparative sequence analysis was assembled for use in benchmarking secondary structure prediction. This database includes small subunit ribosomal RNA (Gutell 1994), large subunit ribosomal RNA (Gutell et al. 1993; Schnare et al. 1996), 5S ribosomal RNA (Szymanski et al. 1998; Daub et al. 2008), Group I self-splicing introns (Waring and Davies 1984; Damberger and Gutell 1994), RNase P RNA (Brown 1998), signal recognition particle RNA (Larsen et al. 1998), tRNA (Sprinzl et al. 1998), and tmRNA (Zwieb and Wower 2000).
This database is an expansion and update of a database of structures assembled previously for benchmarking secondary structure prediction (Mathews et al. 1999; Bellaousov and Mathews 2010). Many structures have been revised, and many new structures have become available. Structures were obtained as follows: Structures of small and large subunit ribosomal RNAs and group I introns were obtained from RNA STRAND v2.0 (Andronescu et al. 2008). Structures of 5S ribosomal RNAs were obtained from the 2005 update of the 5S ribosomal RNA Database (Szymanski et al. 1998). Vertebrate telomerase RNA secondary structure alignments were obtained from the Rfam 9.1 database (Griffiths-Jones et al. 2003, 2005; Daub et al. 2008; Gardner et al. 2009). tmRNA secondary structures were obtained from the tmRDB database (Zwieb et al. 2003). Structures with unknown nucleotides were omitted from the full list of structures in each database. Small and large subunit rRNA sequences were divided into domains of ≤700 nt as previously reported (Mathews et al. 1999). Where possible, every structure in the database where the whole sequence was known was used for testing. For the small and large subunit ribosomal RNAs, where manual curation was necessary to break the structures into domains, structures were chosen to maximize taxonomic diversity (Mathews et al. 1999).
RNA molecules from different species sometimes share an exact sequence, resulting in redundancy within the sequence databases. Redundant sequences were not removed from the benchmarking data set, so the group I intron, RNAse P, SRP, tmRNA, and tRNA data sets contain a small number of duplicate sequences, in line with what appears in nature. The database of 3847 sequences contains 3483 unique sequences, 311 of which appear more than once. No single sequence is highly prevalent within a family. The most prevalent sequence is a tmRNA that appears 12 times, making up 2.6% of the sequences in the tmRNA family.
Supplemental Table S4 provides the accession numbers of each sequence in its source database, and the full data set is available by request from the authors.
Quantifying benchmark performance
A prediction of a loop was counted as correct if it exactly matched the accepted structure. That is, every base pair closing the predicted loop precisely matched a base pair in the accepted structure, and every unpaired nucleotide in the predicted loop was unpaired in the accepted structure. To quantify the accuracy of the benchmark, sensitivity and positive predictive value (PPV) were reported, where
and
Intuitively, the sensitivity is the fraction of correct loops that was predicted, and the PPV is the fraction of predicted loops that was correct.
Statistics and significance of benchmark results
Overall mean values were calculated as means across RNA families, i.e., each family contributed equally to the mean performance. Within families, means were taken across all loops of the specified type. The statistical significance of benchmark results was determined using a paired, two-tailed t-test. The type I error rate, α, was set at 0.05. All of the predicted loops for an entire family of RNA from the benchmark database were treated as a single sample for the purpose of the test. If any family predicted no loops with probability above the threshold, the PPV for that family was undefined, so the test could not be performed. All families contained every type of loop, except for tRNAs, which had no bulge loops. Therefore, tRNAs were excluded from the analysis of bulge loop sensitivity.
SUPPLEMENTAL MATERIAL
Supplemental material is available for this article.
Supplementary Material
ACKNOWLEDGMENTS
This work was supported by National Institutes of Health grant R01 GM076485 to D.H.M. M.F.S. was additionally supported by National Institutes of Health grant T32 GM068411.
Footnotes
Article published online ahead of print. Article and publication date are at http://www.rnajournal.org/cgi/doi/10.1261/rna.053694.115.
REFERENCES
- Andronescu M, Bereg V, Hoos HH, Condon A. 2008. RNA STRAND: the RNA secondary structure and statistical analysis database. BMC Bioinformatics 9: 340. [DOI] [PMC free article] [PubMed] [Google Scholar]
- Ban N, Nissen P, Hansen J, Moore PB, Steitz TA. 2000. The complete atomic structure of the large ribosomal subunit at 2.4 Å resolution. Science 289: 905–920. [DOI] [PubMed] [Google Scholar]
- Bellaousov S, Mathews DH. 2010. ProbKnot: fast prediction of RNA secondary structure including pseudoknots. RNA 16: 1870–1880. [DOI] [PMC free article] [PubMed] [Google Scholar]
- Bellaousov S, Reuter JS, Seetin MG, Mathews DH. 2013. RNAstructure: web servers for RNA secondary structure prediction and analysis. Nucleic Acids Res 41: W471–W474. [DOI] [PMC free article] [PubMed] [Google Scholar]
- Bompfunewerer AF, Backofen R, Bernhart SH, Hertel J, Hofacker IL, Stadler PF, Will S. 2008. Variations on RNA folding and alignment: lessons from Benasque. J Math Biol 56: 129–144. [DOI] [PubMed] [Google Scholar]
- Brown JW. 1998. The ribonuclease P database. Nucleic Acids Res 26: 351–352. [DOI] [PMC free article] [PubMed] [Google Scholar]
- Cordero P, Kladwang W, VanLang CC, Das R. 2012. Quantitative dimethyl sulfate mapping for automated RNA secondary structure inference. Biochemistry 51: 7037–7039. [DOI] [PMC free article] [PubMed] [Google Scholar]
- Damberger SH, Gutell RR. 1994. A comparative database of group I intron structures. Nucleic Acids Res 22: 3508–3510. [DOI] [PMC free article] [PubMed] [Google Scholar]
- Daub J, Gardner PP, Tate J, Ramskold D, Manske M, Scott WG, Weinberg Z, Griffiths-Jones S, Bateman A. 2008. The RNA WikiProject: community annotation of RNA families. RNA 14: 2462–2464. [DOI] [PMC free article] [PubMed] [Google Scholar]
- Davidson EA, Ellington AD. 2007. Synthetic RNA circuits. Nat Chem Biol 3: 23–28. [DOI] [PubMed] [Google Scholar]
- Deigan KE, Li TW, Mathews DH, Weeks KM. 2009. Accurate SHAPE-directed RNA structure determination. Proc Natl Acad Sci 106: 97–102. [DOI] [PMC free article] [PubMed] [Google Scholar]
- Ding Y, Lawrence CE. 2003. A statistical sampling algorithm for RNA secondary structure prediction. Nucleic Acids Res 31: 7280–7301. [DOI] [PMC free article] [PubMed] [Google Scholar]
- Duan S, Mathews DH, Turner DH. 2006. Interpreting oligonucleotide microarray data to determine RNA secondary structure: application to the 3′ end of Bombyx mori R2 RNA. Biochemistry 45: 9819–9832. [DOI] [PubMed] [Google Scholar]
- Fica SM, Tuttle N, Novak T, Li NS, Lu J, Koodathingal P, Dai Q, Staley JP, Piccirilli JA. 2013. RNA catalyses nuclear pre-mRNA splicing. Nature 503: 229–234. [DOI] [PMC free article] [PubMed] [Google Scholar]
- Fire A, Xu S, Montgomery MK, Kostas SA, Driver SE, Mello CC. 1998. Potent and specific genetic interference by double-stranded RNA in Caenorhabditis elegans. Nature 391: 806–811. [DOI] [PubMed] [Google Scholar]
- Fu Y, Xu ZZ, Lu ZJ, Zhao S, Mathews DH. 2015. Discovery of novel ncRNA sequences in multiple genome alignments on the basis of conserved and stable secondary structures. PLoS One 10: e0130200. [DOI] [PMC free article] [PubMed] [Google Scholar]
- Garcia-Martin JA, Clote P, Dotu I. 2013. RNAiFOLD: a constraint programming algorithm for RNA inverse folding and molecular design. J Bioinform Comput Biol 11: 1350001. [DOI] [PubMed] [Google Scholar]
- Gardner PP, Daub J, Tate JG, Nawrocki EP, Kolbe DL, Lindgreen S, Wilkinson AC, Finn RD, Griffiths-Jones S, Eddy SR, et al. 2009. Rfam: updates to the RNA families database. Nucleic Acids Res 37: D136–D140. [DOI] [PMC free article] [PubMed] [Google Scholar]
- Gorodkin J, Hofacker IL, Torarinsson E, Yao Z, Havgaard JH, Ruzzo WL. 2010. De novo prediction of structured RNAs from genomic sequences. Trends Biotechnol 28: 9–19. [DOI] [PMC free article] [PubMed] [Google Scholar]
- Griffiths-Jones S, Bateman A, Marshall M, Khanna A, Eddy SR. 2003. Rfam: an RNA family database. Nucleic Acids Res 31: 439–441. [DOI] [PMC free article] [PubMed] [Google Scholar]
- Griffiths-Jones S, Moxon S, Marshall M, Khanna A, Eddy SR, Bateman A. 2005. Rfam: annotating non-coding RNAs in complete genomes. Nucleic Acids Res 33: D121–D124. [DOI] [PMC free article] [PubMed] [Google Scholar]
- Gruber AR, Findeiss S, Washietl S, Hofacker IL, Stadler PF. 2010. RNAz 2.0: improved noncoding RNA detection. Pac Symp Biocomput 15: 69–79. [PubMed] [Google Scholar]
- Gutell RR. 1994. Collection of small subunit (16S- and 16S-like) ribosomal RNA structures. Nucleic Acids Res 22: 3502–3507. [DOI] [PMC free article] [PubMed] [Google Scholar]
- Gutell RR, Gray MW, Schnare MN. 1993. A compilation of large subunit (23S- and 23S-like) ribosomal RNA structures. Nucleic Acids Res 21: 3055–3074. [DOI] [PMC free article] [PubMed] [Google Scholar]
- Heale BS, Soifer HS, Bowers C, Rossi JJ. 2005. siRNA target site secondary structure predictions using local stable substructures. Nucleic Acids Res 33: e30. [DOI] [PMC free article] [PubMed] [Google Scholar]
- Hofacker IL, Fontana W, Stadler PF, Bonhoeffer LS, Tacker M, Schuster P. 1994. Fast folding and comparison of RNA secondary structures. Monatsh Chem 125: 167–168. [Google Scholar]
- Kim J, Walter AE, Turner DH. 1996. Thermodynamics of coaxially stacked helices with GA and CC mismatches. Biochemistry 35: 13753–13761. [DOI] [PubMed] [Google Scholar]
- Klein RJ, Eddy SR. 2003. RSEARCH: finding homologs of single structures RNA sequences. BMC Bioinformatics 4: 44. [DOI] [PMC free article] [PubMed] [Google Scholar]
- Kruger K, Grabowski PJ, Zaug AJ, Sands J, Gottschling DE, Cech TR. 1982. Self-splicing RNA: autoexcision and autocyclization of the ribosomal RNA intervening sequence of tetrahymena. Cell 31: 147–157. [DOI] [PubMed] [Google Scholar]
- Larsen N, Samuelsson T, Zwieb C. 1998. The signal recognition particle database (SRPDB). Nucleic Acids Res 26: 177–178. [DOI] [PMC free article] [PubMed] [Google Scholar]
- Lee J, Kladwang W, Lee M, Cantu D, Azizyan M, Kim H, Limpaecher A, Yoon S, Treuille A, Das R. 2014. RNA design rules from a massive open laboratory. Proc Natl Acad Sci 111: 2122–2127. [DOI] [PMC free article] [PubMed] [Google Scholar]
- Lorenz R, Bernhart SH, Honer Zu Siederdissen C, Tafer H, Flamm C, Stadler PF, Hofacker IL. 2011. ViennaRNA Package 2.0. Algorithms Mol Biol 6: 26. [DOI] [PMC free article] [PubMed] [Google Scholar]
- Lu ZJ, Mathews DH. 2007. Efficient siRNA selection using hybridization thermodynamics. Nucleic Acids Res 36: 640–647. [DOI] [PMC free article] [PubMed] [Google Scholar]
- Macke T, Ecker D, Gutell R, Gautheret D, Case DA, Sampath R. 2001. RNAMotif: a new RNA secondary structure definition and discovery algorithm. Nucleic Acids Res 29: 4724–4735. [DOI] [PMC free article] [PubMed] [Google Scholar]
- Mathews DH. 2004. Using an RNA secondary structure partition function to determine confidence in base pairs predicted by free energy minimization. RNA 10: 1178–1190. [DOI] [PMC free article] [PubMed] [Google Scholar]
- Mathews DH, Sabina J, Zuker M, Turner DH. 1999. Expanded sequence dependence of thermodynamic parameters provides improved prediction of RNA secondary structure. J Mol Biol 288: 911–940. [DOI] [PubMed] [Google Scholar]
- Mathews DH, Disney MD, Childs JL, Schroeder SJ, Zuker M, Turner DH. 2004. Incorporating chemical modification constraints into a dynamic programming algorithm for prediction of RNA secondary structure. Proc Natl Acad Sci 101: 7287–7292. [DOI] [PMC free article] [PubMed] [Google Scholar]
- McCaskill JS. 1990. The equilibrium partition function and base pair probabilities for RNA secondary structure. Biopolymers 29: 1105–1119. [DOI] [PubMed] [Google Scholar]
- Nahvi A, Sudarsan N, Ebert MS, Zou X, Brown KL, Breaker RR. 2002. Genetic control by a metabolite binding mRNA. Chem Biol 9: 1043. [DOI] [PubMed] [Google Scholar]
- Nawrocki EP, Kolbe DL, Eddy SR. 2009. Infernal 1.0: inference of RNA alignments. Bioinformatics 25: 1335–1337. [DOI] [PMC free article] [PubMed] [Google Scholar]
- Noller HF, Hoffarth V, Zimniak L. 1992. Unusual resistance of peptidyl transferase to protein extraction procedures. Science 256: 1416–1419. [DOI] [PubMed] [Google Scholar]
- Nussinov R, Jacobson AB. 1980. Fast algorithm for predicting the secondary structure of single-stranded RNA. Proc Natl Acad Sci 77: 6309–6313. [DOI] [PMC free article] [PubMed] [Google Scholar]
- Re A, Joshi T, Kulberkyte E, Morris Q, Workman CT. 2014. RNA-protein interactions: an overview. Methods Mol Biol 1097: 491–521. [DOI] [PubMed] [Google Scholar]
- Reuter JS, Mathews DH. 2010. RNAstructure: software for RNA secondary structure prediction and analysis. BMC Bioinformatics 11: 129. [DOI] [PMC free article] [PubMed] [Google Scholar]
- Schirmer S, Ponty Y, Giegerich R. 2014. Introduction to RNA secondary structure comparison. Methods Mol Biol 1097: 247–273. [DOI] [PubMed] [Google Scholar]
- Schnare MN, Damberger SH, Gray MW, Gutell RR. 1996. Comprehensive comparison of structural characteristics in eukaryotic cytoplasmic large subunit (23S-like) ribosomal RNA. J Mol Biol 256: 701–719. [DOI] [PubMed] [Google Scholar]
- Seetin MG, Mathews DH. 2012. RNA structure prediction: an overview of methods. Methods Mol Biol 905: 99–122. [DOI] [PubMed] [Google Scholar]
- Serganov A, Nudler E. 2013. A decade of riboswitches. Cell 152: 17–24. [DOI] [PMC free article] [PubMed] [Google Scholar]
- Sloma MF, Mathews DH. 2015. Improving RNA secondary structure prediction with structure mapping data. Methods Enzymol 553: 91–114. [DOI] [PubMed] [Google Scholar]
- Sprinzl M, Horn C, Brown M, Ioudovitch A, Steinberg S. 1998. Compilation of tRNA sequences and sequences of tRNA genes. Nucleic Acids Res 26: 148–153. [DOI] [PMC free article] [PubMed] [Google Scholar]
- Szymanski M, Specht T, Barciszewska MZ, Barciszewski J, Erdmann VA. 1998. 5S rRNA data bank. Nucleic Acids Res 26: 156–159. [DOI] [PMC free article] [PubMed] [Google Scholar]
- Tafer H, Ameres SL, Obernosterer G, Gebeshuber CA, Schroeder R, Martinez J, Hofacker IL. 2008. The impact of target site accessibility on the design of effective siRNAs. Nat Biotechnol 26: 578–583. [DOI] [PubMed] [Google Scholar]
- Torarinsson E, Sawera M, Havgaard JH, Fredholm M, Gorodkin J. 2006. Thousands of corresponding human and mouse genomic regions unalignable in primary sequence contain common RNA structure. Genome Res 16: 885–889. [DOI] [PMC free article] [PubMed] [Google Scholar]
- Turner DH, Mathews DH. 2009. NNDB: the nearest neighbor parameter database for predicting stability of nucleic acid secondary structure. Nucleic Acids Res 38: D280–D282. [DOI] [PMC free article] [PubMed] [Google Scholar]
- Tyagi R, Mathews DH. 2007. Predicting helical coaxial stacking in RNA multibranch loops. RNA 13: 939–951. [DOI] [PMC free article] [PubMed] [Google Scholar]
- Uzilov AV, Keegan JM, Mathews DH. 2006. Detection of non-coding RNAs on the basis of predicted secondary structure formation free energy change. BMC Bioinformatics 7: 173. [DOI] [PMC free article] [PubMed] [Google Scholar]
- Velagapudi SP, Gallo SM, Disney MD. 2014. Sequence-based design of bioactive small molecules that target precursor microRNAs. Nat Chem Biol 10: 291–297. [DOI] [PMC free article] [PubMed] [Google Scholar]
- Walter AE, Turner DH, Kim J, Lyttle MH, Müller P, Mathews DH, Zuker M. 1994. Coaxial stacking of helixes enhances binding of oligoribonucleotides and improves predictions of RNA folding. Proc Natl Acad Sci 91: 9218–9222. [DOI] [PMC free article] [PubMed] [Google Scholar]
- Waring RB, Davies RW. 1984. Assessment of a model for intron RNA secondary structure relevant to RNA self-splicing—a review. Gene 28: 277–291. [DOI] [PubMed] [Google Scholar]
- Winkler WC, Nahvi A, Roth A, Collins JA, Breaker RR. 2004. Control of gene expression by a natural metabolite-responsive ribozyme. Nature 428: 281–286. [DOI] [PubMed] [Google Scholar]
- Woodson SA, Crothers DM. 1987. Proton nuclear magnetic resonance studies on bulge-containing DNA oligonucleotides from a mutational hot-spot sequence. Biochemistry 26: 904–912. [DOI] [PubMed] [Google Scholar]
- Wuchty S, Fontana W, Hofacker IL, Schuster P. 1999. Complete suboptimal folding of RNA and the stability of secondary structures. Biopolymers 49: 145–165. [DOI] [PubMed] [Google Scholar]
- Yao Z, Weinberg Z, Ruzzo WL. 2006. CMfinder—a covariance model based RNA motif finding algorithm. Bioinformatics 22: 445–452. [DOI] [PubMed] [Google Scholar]
- Zadeh JN, Steenberg CD, Bois JS, Wolfe BR, Pierce MB, Khan AR, Dirks RM, Pierce NA. 2010. NUPACK: analysis and design of nucleic acid systems. J Comput Chem 32: 170–173. [DOI] [PubMed] [Google Scholar]
- Znosko BM, Silvestri SB, Volkman H, Boswell B, Serra MJ. 2002. Thermodynamic parameters for an expanded nearest-neighbor model for the formation of RNA duplexes with single nucleotide bulges. Biochemistry 41: 10406–10417. [DOI] [PubMed] [Google Scholar]
- Zuker M. 1989. On finding all suboptimal foldings of an RNA molecule. Science 244: 48–52. [DOI] [PubMed] [Google Scholar]
- Zuker M. 2003. Mfold web server for nucleic acid folding and hybridization prediction. Nucleic Acids Res 31: 3406–3415. [DOI] [PMC free article] [PubMed] [Google Scholar]
- Zuker M, Stiegler P. 1981. Optimal computer folding of large RNA sequences using thermodynamics and auxiliary information. Nucleic Acids Res 9: 133–148. [DOI] [PMC free article] [PubMed] [Google Scholar]
- Zwieb C, Wower J. 2000. tmRDB (tmRNA database). Nucleic Acids Res 28: 169–170. [DOI] [PMC free article] [PubMed] [Google Scholar]
- Zwieb C, Gorodkin J, Knudsen B, Burks J, Wower J. 2003. tmRDB (tmRNA database). Nucleic Acids Res 31: 446–447. [DOI] [PMC free article] [PubMed] [Google Scholar]
Associated Data
This section collects any data citations, data availability statements, or supplementary materials included in this article.


