Abstract
Metal complexation reactions can be used effectively as sensors to measure concentrations of phosphate and phosphate analogs. Recently, a method was described for the detection of phosphate or ATP in aqueous solution based on the displacement by these ligands of pyrocatechol violet (PV) from a putative 2:1 (Yb3+)2PV complex. We have not been able to reproduce this stoichiometry and report this work in order to correct the coordination chemistry upon which sensor applications are based. In our work, colorimetric and spectrophotometric detection of phosphate was confirmed qualitatively (blue PV + Yb3+; yellow + Pi); however, the sequence of visual changes on the titration of PV with 2 equiv. of Yb3+ and back titration with ATP as described previously could not be reproduced. In contrast to the linear response to Pi that was reported previously, the absorbance response at 443 or 623 nm was found to be sigmoidal using the recommended 2:1 Yb3+:PV solution (100 µM:50 µM, pH 7, HEPES). Furthermore, both continuous variation titration and molar ratio analysis (Job plot) experiments are consistent with 1:1, not 2:1, YbPV complex stoichiometry at pH 7 in HEPES buffer, indicating that the deviation from linearity is produced by excess Yb3+. Indeed, using a 1:1 Yb3+:PV ratio produces a linear response in ΔAbs at 443 or 623 nm on back titration with analyte (phosphate or ATP). In addition, speciation analysis of the Yb–ATP system demonstrates that a 1:1 complex containing Yb3+ and ATP predominates in solution at µM metal ion and ATP concentrations. Paramagnetic1H NMR spectroscopy directly establishes the formation of Yb3+–solute complexes in dilute aqueous solution. The 1:1 YbPV complex can be used for the colorimetric measurement of phosphate and ATP concentrations from ~2 µM.
Keywords: Phosphate sensing, ATP sensing, Ytterbium, Pyrocatechol violet, Coordination chemistry
Introduction
Phosphates and nucleotides are key metabolites in biology and play a central role in biology and medicine [1, 2]. Since phosphates per se contain no inherent near-UV–vis chromophore, they present a challenge to the development of sensitive and practical methods for detection. Approaches to this problem have included electrochemical [3], conductive [4], refractive index [5–7] and fluorescence [8, 9] detection, but have been limited by poor sensitivity and selectivity. Methods based on chemical derivatization may complicate the analytical procedure [9–11], but when combined with indirect detection they offer the most promising strategy for the development of sensitive and specific analytical methods for this class of compounds [4, 12–15]. Importantly, the strong chelating properties of phosphates, including nucleotides, for particular metal ions can be exploited in detection assays. Various approaches for detecting phosphates and derivatives utilizing selective coordination chemistry have been described [16–22].
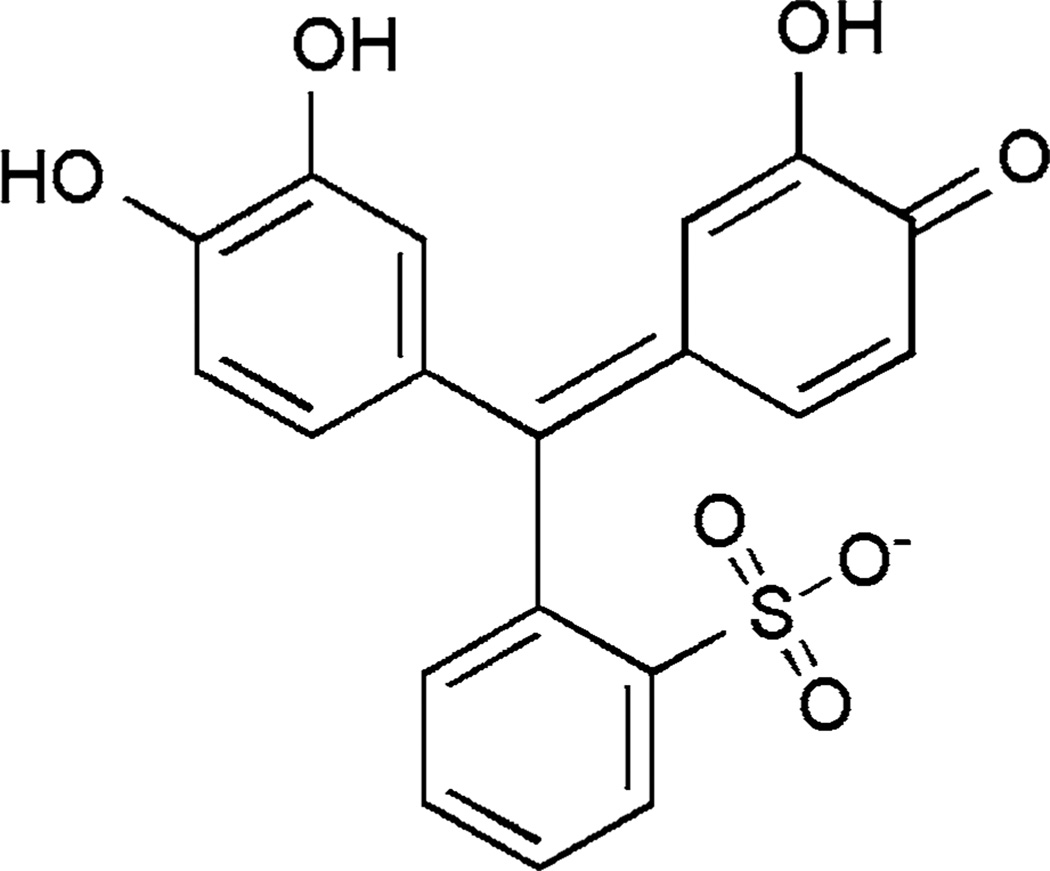
Recently, Yin et al. [23–25] reported the indirect detection of HPO42− and ATP using an ytterbium (Yb3+)–pyrocatechol violet (PV) complex (see Fig. 1 for the structure of PV). These works reported the formation of a blue putative Yb2PV complex in neutral aqueous solution, which, in the presence of added HPO42− and ATP, undergoes ligand exchange [23–25], releasing the free PV dye (which is yellow). The exchange reaction was conveniently monitored by UV–visible spectroscopy, observing the disappearance of the Yb3+–PV complex (623 nm) or the release of the free PV at 423 nm [23].
Fig. 1.
Structure of the pyrocatechol violet (PV) monoanion, the predominant species at pH 7.0
The chelating properties of phosphates and nucleotides can lead to the formation of more than one kind of metal complex in solution depending on the pH and other specific conditions [26–30]. Specifically, Yb3+ has been reported to form several complexes with phosphate and ATP [28]. Given the limitations on the solubility of the Yb3+–Pi system, which impedes analysis by potentiometry, less information is available on this system. However, the Yb3+ and ATP system has received more attention [26, 28, 30–32] in studies ranging from spectrophotometric analysis at µM concentrations [30] to studies at much higher concentrations using alternative techniques such as potentiometry [28], electron spin echo [31] and NMR spectroscopy [32]. Not surprisingly, Yb3+ complexes with ATP display both 1:1 and 1:2 stoichiometries. The 1:1 complexes are generally the major complexes at low (µM) concentrations and at high metal-to-ligand ratios (excess metal ion) [26, 30]. The 1:2 complexes predominate at higher concentrations (mM) and at low metal to ligand ratios (excess ligand) [27, 28]. At intermediate concentrations, both 1:1 and 1:2 complexes are observed [28]. Some X-ray structures have been reported for the Yb3+–Pi system [33–36]. For example, one report describes a 1:1 complex with metal coordinated to eight O atoms forming two orthogonal interpenetrating tetrahedral geometries [34]. However, the relevance of this structure to the complex in solution is uncertain. There are no structures in the crystal database for Yb3+–ATP complexes.
We were originally interested in exploring the applicability of the Yb3+–PV sensor to the detection of phosphorus-containing compounds. However, we were unable to quantitatively reproduce the original observations of Yin et al. with phosphate or ATP, prompting us to reinvestigate the underlying complexation chemistry. Here we report on findings indicating that their assumed Yb3+–PV complex stoichiometry, which is fundamental to the accurate application of this system to phosphate and ATP determination, is incorrect.
Materials and methods
Solid pyrocatechol violet (Sigma–Aldrich, St. Louis, MO, USA, and Alfa Aesar, Karlsruhe, Germany), ytterbium(III) chloride hexahydrate (99.998%, Sigma–Aldrich), and ytterbium(III) oxide (99.998%, REacton®, Alfa Aesar) were used to prepare the 10 mM stock solutions. The UV–vis spectra were acquired at ambient temperature on a PerkinElmer (Waltham, MA, USA) Lambda 25 spectrophotometer employed in a dual beam mode using 10 mM HEPES buffer as a blank. Water purified with the E-pure system from Barnstead (Dubuque, IA, USA; up to 17.8 MΩ cm−1) was used throughout. The NMR studies were carried out using paramagnetic parameters, as reported previously [37]. Specifically, the1H NMR studies were carried out using a short acquisition time (0.05 s) and large sweep widths. The31P NMR studies were carried out using an acquisition time of 0.1 s.
Stock solutions
PV was dissolved in deionized water. The resulting solution was transferred to the volumetric flask and diluted with water. The PV stock solution was standardized at pH 5.3 in 10 mM acetate buffer solution, based on a molar absorbance value of 14,000 M−1 cm−1 at 445 nm [38]. Concentrations calculated based on weight were within 3–5% of those obtained by molar absorbance. The stock solution was prepared fresh before each analysis. This solution was found to be stable for several days.
The Yb3+ stock solution was prepared from either YbCl3·6H2O or Yb2O3 with identical results. YbCl3·6H2O was dissolved in deionized water, while Yb2O3 was dissolved in conc. HCl with stirring and under heating, and slowly evaporated until a neutral vapor reaction was obtained. The resulting solution was transferred to the volumetric flask and diluted with water. The Yb3+ stock solution was standardized by EDTA titration at pH 6.0 in acetate buffer using xylenol orange as a complexometric indicator [39]. Similar results were obtained using PV as a complexometric indicator. The Yb3+ solution was stable for weeks; solutions were used for up to two weeks after preparation. Substrate stock solutions (10 mM) were prepared in aqueous solution from the salts.
General procedure for UV–vis spectroscopic analysis sample preparation
Step 1: Blue YbPV complex samples Samples of 50 µM PV and 0–100 µM Yb3+ were prepared by adding aliquots of stock solutions of YbCl3 and PV to 5.0 mL of 10 mM HEPES buffer at pH 7.0. In a typical procedure, the YbCl3 stock was added to the buffer first, and the PV stock was added after shaking. The resulting solution was shaken for a minimum of 10 s, transferred to the quartz cuvette, and the UV–vis spectrum was recorded immediately.
Step 2: Measuring analyte concentrations Analyte (0–100 µM) was added directly to the freshly prepared YbPV solution. The development of the yellow color from the Yb–analyte complex is complete within 30 s. No significant changes were observed within the 15 min needed to make the measurement.
Results and discussion
Stability and ruggedness of the sensor system
Seeking to explain discrepancies between our results and those reported by Yin et al. for their putative Yb3+2–PV phosphate sensor, we first looked for inadvertent errors in the assays as carried out in our laboratory. Assay results obtained using the procedure described in “Materials and methods” are in fact reliably reproducible. After development, the sensor color is stable for at least 2 h, particularly if the PV is kept at a stoichiometry with the metal of 1:1 or less, although a precipitate can be observed after standing overnight. No differences were observed in spectroscopic signature in samples that had been purged and maintained under a blanket of argon. The data presented in Figs. 2, 3 and 4 were obtained in duplicate or triplicate and the error bars in most cases are covered by the plotted symbol. The assay was also carried out by several different operators, and using two different Yb3+ salts from two suppliers (“Materials and methods”) with identical results. Deviations from the procedures as described can introduce variability into the results, in particular during the preparation of the stock solution in HEPES buffer (pH 7.0), since both PV and Yb3+ solutions can change irreversibly over time. At pH 7, the PV solution changes color from red to yellow and finally to brown, indicating oxidation. Oxidation was previously reported to take place above pH 7.5 [40]; however, little or no oxidation was observed at pH 7.0 in HEPES buffer on the timescale of the experiment. The Yb3+ solution deposits precipitates of sparingly soluble ytterbium hydroxide after storage for about one week [41].
Fig. 2.
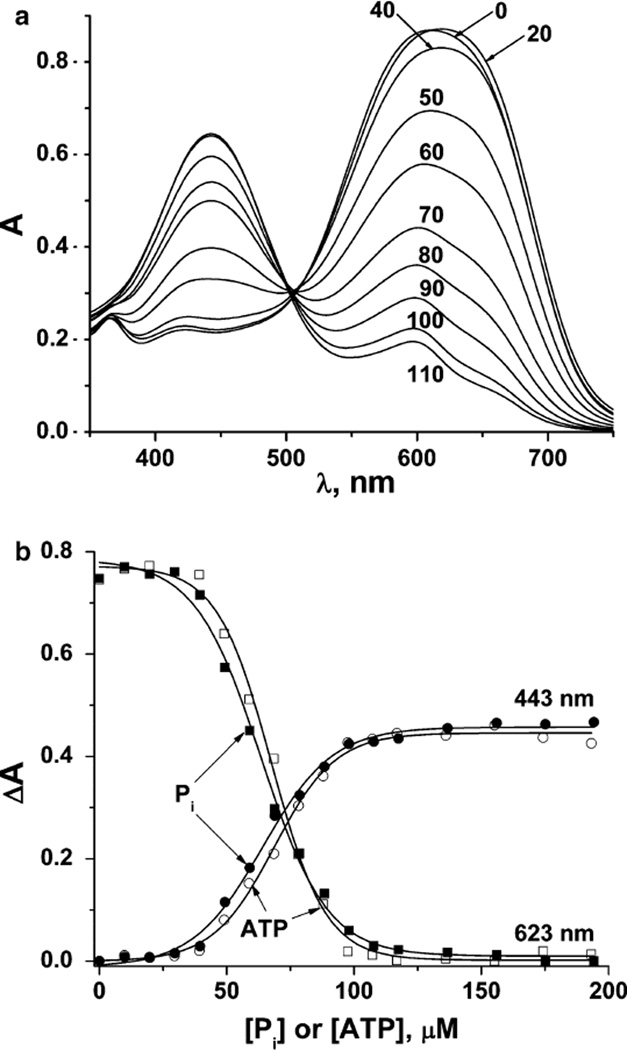
The absorbances of solutions with a 2:1 Yb3+:PV ratio (100 µM Yb3+ and 50 µM PV) in 10 mM HEPES buffer (pH 7.0) (a). The absorbance difference in the 100 µM Yb3+ and 50 µM PV solution in 10 mM HEPES buffer (pH 7.0) at two wavelengths (443 and 623 nm) upon phosphate (full symbols) and ATP (open symbols) addition (b)
Fig. 3.
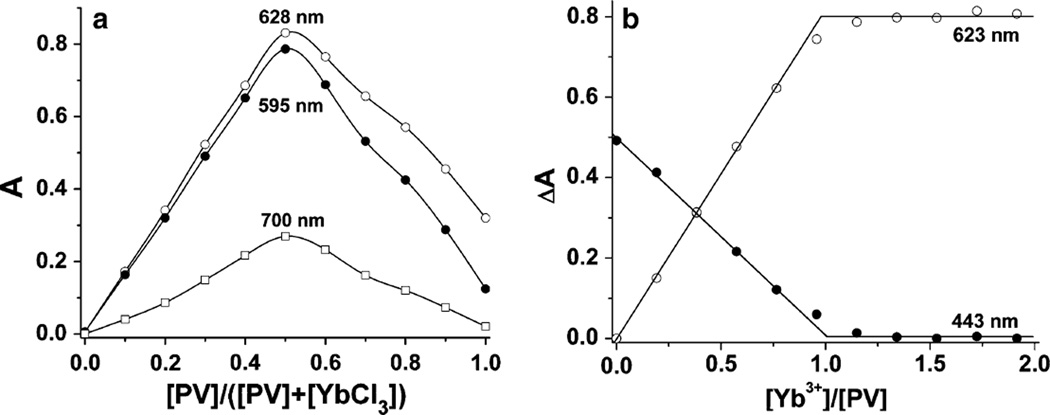
a Continuous variation plot at three representative wave-lengths for the Yb3+ and PV system in 10 mM HEPES buffer at pH 7.0. The total concentration of Yb3+ + PV is equal to 100 µM. Samples were prepared by adding the acidic stock solutions to the buffer. b Absorbance difference at 623 and 443 nm as a function of the [Yb3+]/[PV] molar ratio. The PV concentration was kept constant at 50 µM, and Yb3+ was varied from 0 to 100 µM
Fig. 4.
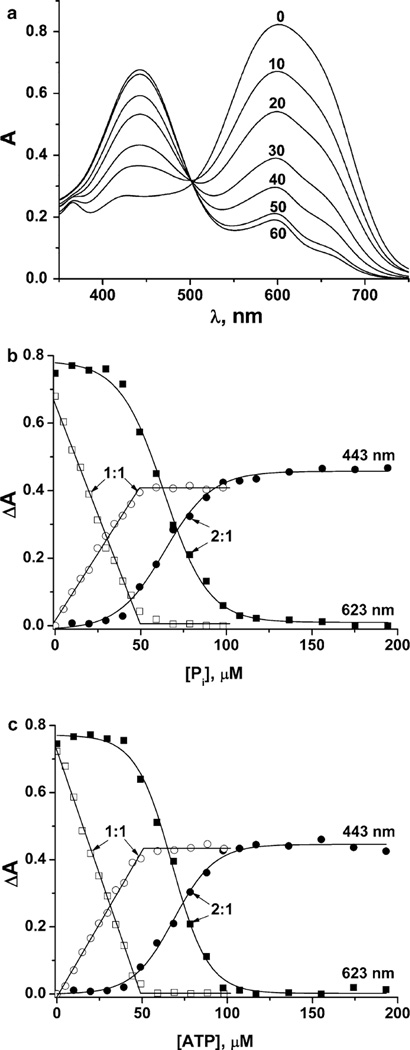
The absorbance of solutions with a 1:1 Yb3+:PV ratio (50 µM Yb3+ and 50 µM PV) in 10 mM HEPES buffer (pH 7.0) (a). The effect of the Yb3+:PV ratio in 10 mM HEPES buffer (pH 7.0) on the absorbance change at 443 nm (circles) and 623 nm (squares) from phosphate (b), and ATP (c) addition. Filled symbols correspond to the absorbance change with a 2:1 Yb3+:PV ratio (100 µM Yb3+ and 50 µM PV); open symbols to the absorbance change with a 1:1 Yb3+:PV ratio (50 µM Yb3+ and 50 µM PV)
When stock solutions of PV and YbCl3 were premixed before adding them to the buffer, the absorbance maximum of the resulting Yb3+–PV complex shifted from 614 to 638 nm. The selection of appropriate solution preparation and mixing times and analyte concentrations of the substrate is critical if the assay is to yield repeatable results. Thus, errors in the assay could be introduced unless consistent time protocols are used.
The procedures described here call for the preparation of solutions which, unless buffer is added to keep the added analyte volume constant, have at the most a 1.5–2% dilution factor. A 2% dilution is within the experimental error. Since the ratio of Yb3+ to PV (YbPV complex) is kept constant in all samples, the only variable is analyte concentration.
A few cautionary notes for the application of this method to the determination of phosphate and phosphorus-containing compounds are needed. First, the complexes that form between Yb3+ and phosphorus-containing compounds are very insoluble. If the assay is done at equilibrium conditions, the precipitation of the Yb3+–phosphorus compounds could shift the measurements using this method. This fact is one of the reasons why we recommend that the assay is carried out within a short time period (15 min) with the concentration ranges defined in this work. In our hands, results obtained during 15 min time periods are accurate, whereas measurements made when samples have been left for longer than 1 h may be less reliable. Presumably the kinetics of precipitation are relatively slow, so that this issue is less of a problem in practice.
One can observe interference in phosphorus compound determination when other metal ions are present. Specifically, we found problems with the assay when Zn2+, Cu2+ and Ca2+ were present at 20, 10 µM, and ≥10 mM, respectively. Although the total intracellular concentrations of Ca2+ (0.1 mM), Zn2+ (0.1 mM) and Cu2+ (10 µM) [42] imply that Zn2+ and Cu2+ should, in principle, interfere with assay, this may not actually happen, because the latter two metal ions are known to be strongly chelated in cells [42]. Thus, even when extracts of biological samples are used directly without prior dilution, Zn2+ and Cu2+ are strongly chelated by metalloproteins and other abundant small-molecule chelators. These complexes are likely to compete favorably with the PV molecule and little metal ion exchange takes place. The presence of Ca2+ is not likely to interfere with the assay because the concentration is less than that needed for interference. Overall, we conclude that the metal ion content in these samples is not likely to cause interference when assaying many biological samples.
However, the ability of Yb3+ to form coordination complexes with proteins and other biometabolites that naturally chelate Ca2+, Cu2+ and Zn2+ does limit the application of this assay. If Yb3+ displaces Ca2+, Cu2+ and Zn2+ from the proteins or other intracellular chelators, this Yb3+ will no longer interact with PV and will therefore skew the assay measurement. This effect is similar to the well-known transmetallation phenomenon observed for Gd-based MRI contrast agents [43]. Of the three potential problems with this assay, we view the latter to be the most serious, perhaps because this is less easily controlled. We recommend that a standard curve of added Pi should be tested before extensive use on biological samples.
Effect of phosphate and ATP on the Yb3+ and PV assembly in HEPES buffer at pH 7.0
The ability of the putative Yb2PV complex to act as a colorimetric sensor for phosphate was then reinvestigated using the conditions of Yin et al. [23–25]. The absorbances at 443 and 623 nm of a mixture of 100 µM Yb3+ and 50 µM PV in 10 mM HEPES, pH 7.0, were monitored as a function of phosphate concentration, resulting in the spectroscopic changes observed in Fig. 2a and in the changes in absorbance shown in Fig. 2b. We also observed a blue to yellow color change consistent with sequestration of Yb3+ from the relatively weak Yb–PV complex to form a more stable Yb3+–phosphate complex, with displacement of the PV dye. However, in surprising contrast to the linear response to phosphate reported previously [23–25], the absorbance difference versus phosphate concentration was found to be sigmoidal (Fig. 2b). The effect of ATP on the Yb2PV system was also measured, and the data is presented in the Supplementary material (Figs. S1, S2). As shown in Fig. 2b, this analyte also produced a sigmoidal curve rather than the linear response reported previously [23–25].
The small initial absorbance change upon the addition of phosphate to 20 µM suggests that free Yb3+ exists in this solution, complexing the added phosphate or ATP. When the total phosphate concentration increases from 20 to 120 µM, the UV–vis spectra change significantly, suggesting that free metal ions are increasingly unavailable and that the metal is now being displaced from the Yb–PV complex, resulting in the observed color transition from blue (Yb–PV complex) to yellow (PV). These observations are inconsistent with the results of Yin et al. [23–25] and prompted us to redetermine the Yb and PV complex stoichiometry.
The Yb3+ and PV complex stoichiometry is 1:1
We determined the Yb3+ and PV complex stoichiometry by both the continuous variation and the molar ratio methods [44]. The continuous variation studies of the Yb3+ and PV complex stoichiometry were carried out in 10 mM HEPES solution at pH 7.0. The total concentrations of both Yb3+ and PV were kept at 100 µM. In Fig. 3a, we display the absorbance as a function of PV mole fraction at three representative wavelengths. In all cases, the absorbance maximum is located at a mole fraction of 0.5. The 2:1 stoichiometry of a Yb2PV complex would require the absorbance maximum to occur at 0.33. Therefore, the simplest interpretation of this data is the formation of a 1:1 complex in 10 mM HEPES at pH 7.0.
Although alternative interpretations, including several complexes with stoichiometries that yield an average 1:1 stoichiometry are possible, such as the 2:2 complex, the most likely interpretation for the data presented is a 1:1 complex. The possibility that the complex is a ternary complex of Yb3+–PV–Pi is less likely. This conclusion was reached because the spectrophotometric signature of a sample of a 1:1 mixture of Yb3+–PV with equimolar Pi is nearly identical to the spectroscopic properties of a solution of uncomplexed PV.
The formation of the 1:1 complex formation was supported by studies using the molar ratio method, where the PV was kept constant and equal to 50 µM, and the Yb3+ was varied from 0 to 100 µM in the 10 mM HEPES buffer (pH 7.0). The only complex detected under these conditions was the 1:1 complex, since the transition from the line with the positive slope to the line with zero slope is observed at a 1:1 ratio of Yb3+ to PV (Fig. 3b). These results support the equilibrium shown in Eq. 1, but not that shown in Eq. 2, as the determinant process in sensor formation. (It was not possible to extend these studies using speciation titration methods due to the limited solubility of the YbPV.)
| (1) |
| (2) |
To eliminate the possibility that other factors such as adventitious metal ions could explain the discrepancy between our findings and those of Yin et al., we verified that doubly distilled water from a different source, the treatment of HEPES buffer solution with Chelex 100 ion exchange resin, or the use of starting materials from a different supplier did not change the results. We note that our conclusions are supported by some early work on a range of other Yb3+ complexes [45–48].
UV–vis absorption of the Yb3+–PV system upon the addition of phosphate and ATP
The question of whether the correct complex has a 1:1 or 2:1 stoichiometry is crucial to the quantitative analysis of phosphates using this system. If the complex formed is actually a 1:1 complex, but a ratio of 2:1 is used in 10 mM HEPES buffer at pH 7.0, then the solution will contain free, uncomplexed Yb3+. As we demonstrate here, added analyte will first coordinate to the free cation and nonlinearity in the titration will result. In Fig. 4a, we show the absorbance spectra observed for solutions containing a 1:1 Yb3+:PV ratio. The absorbance change at two wavelengths as a function of analyte concentration was calculated for both ratios (2:1 and 1:1 Yb:PV) and is shown in Fig. 4b, c. At a 2:1 ratio of Yb3+–PV, a nonlinear response of DA versus concentration is observed, in contrast to the linear plots obtained with the 1:1 ratio. For the 1:1 ratio, a small (10 µM) concentration of added analyte results in a proportional change in absorbance, indicating that the Yb3+ ions were initially bound to PV (Fig. 4a, phosphate as the added analyte). When all of the PV has been displaced from the YbPV complex, no further change in absorbance is observed, again consistent with 1:1, not a 2:1, Yb:PV stoichiometry (see Eqs. 3 and 4).
| (3) |
| (4) |
In Fig. 4c, we show the absorption change as a function of ATP concentration at ratios of both 1:1 and 1:2 Yb3+ to ATP (Fig. S1). As with Pi (Fig. S2), when the ratio of Yb3+–PV is 2:1, a nonlinear response of ΔA versus concentration is observed, in contrast to the linear plots obtained when the ratio is 1:1. For the 1:1 ratio, even a low concentration of added analyte (10 µM) results in a significant change in absorbance, suggesting that all of the Yb3+ ions are pre-bound to the PV, as shown in Fig. 4a, with phosphate as the added analyte. When all of the PV is displaced from the YbPV complex, no further change in absorbance is observed, which is again consistent with a 1:1 stoichiometry.
In the case of the Yb3+–ATP system, several reports of complexes forming in aqueous solutions exist [26, 28, 30]. The higher solubility of Yb3+–ATP complexes has made speciation studies of this system possible, which were carried out in 0.1 KCl [28]. These studies were carried out from pH 2 to 12 and involved a metal-to-ligand ratio from 1:1 to 1:5. Using formation constants derived from this work, we were able to predict speciation for 1:1 and 1:2 Yb3+:ATP ratios at 50 µM Yb3+ (Fig. S3). These speciation diagrams show that at submillimolar concentrations of metal and analyte, the predominant species in solution is mainly the 1:1 complex. However, as the concentration increases to 1 mM, much more of the 1:2 complex forms at 1:1 and 1:2 Yb3+:ATP. At 1 mM Yb3+ and 2 mM ATP, almost 80% of the Yb3+ exists as a 1:2 complex.
To verify that the conditions illustrated in the speciation diagram are practicable, we prepared equivalent solutions at various pH values and confirmed that indeed such solutions can be prepared without any precipitation over most of the pH range (Fig. S3).
In addition to the speciation constants recommended by Martell and coworkers [49], some previous work had reported hydrolysis constants for a few additional species [50]. These species are minor at pH 7, but their importance increases as the pH increases and the concentration decreases. We chose to use the constants recommended by Martell and coworkers [49], and hesitated to include these species in a study that was carried out without considering these species [28]. However, to evaluate how the presence of such species might impact our studies, we have carried out speciation calculations including these values [50], and these speciation diagrams are shown in Fig. S4. The speciation diagrams in Figures S3 and S4 show little difference at pH 7 at both low and high concentrations. However, at pH ≥ 8, the hydrolyzed Yb3+–ATP species is accompanied by soluble Yb3+ hydroxides. Thus, at these higher pH values, the Yb3+ would not be completely complexed and the assay would no longer be accurately reporting the phosphorus content. This problem is more significant at low concentrations and underlines the importance of maintaining the assay conditions at pH 7.0, as instructed in the “Materials and methods” section.
Potentiometric studies were attempted with the Yb3+–Pi system. Unfortunately, the low solubilities of these complexes preclude proper evaluation of the Pi system in order to compare them with studies reported previously for Yb3+–ATP, where formation constants were obtained from solubility data [51, 52]. However, the available information supports a 1:1 complex, in agreement with the results from our studies (Figs. 2, 4a).
1 H NMR studies of the Yb–PV complex system were attempted (data not shown). Given that Yb is paramagnetic, the presence of this ion effectively increases the relaxation times of all solution components, and line broadening would be anticipated for both free and coordinated PV [37]. The spectra obtained were so dramatically affected by the Yb3+ that most of the signals were broadened into the baseline, consistent with the coordination of the metal ion to the PV ligand.
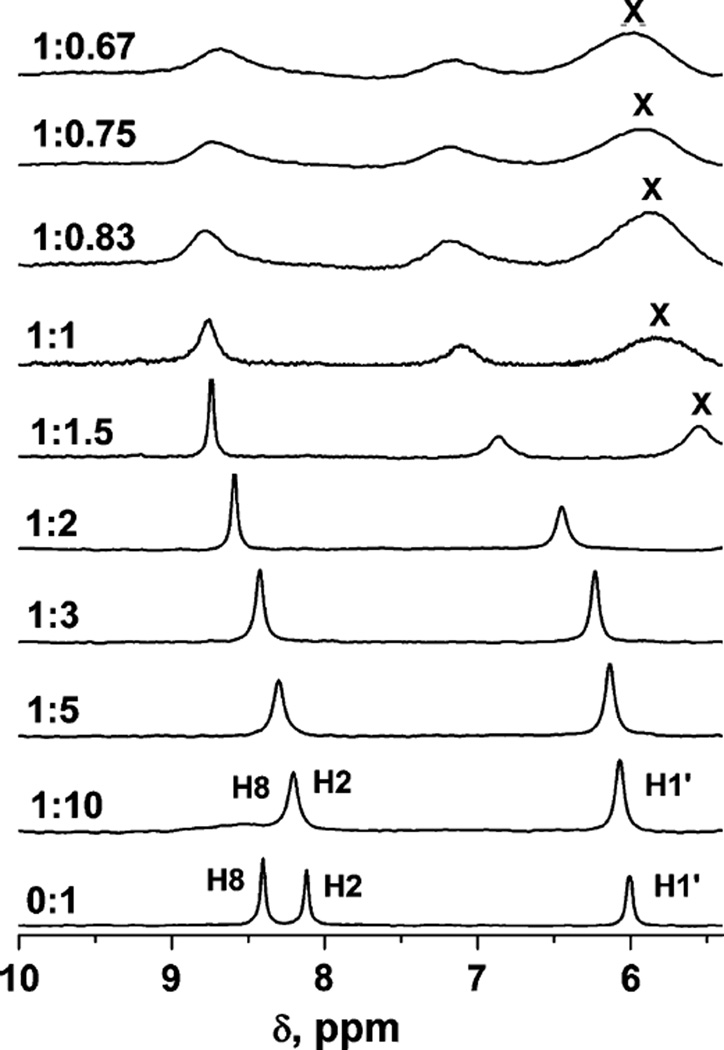
The complexation reaction of Yb3+ with ATP was also examined by1H and31P NMR. Complexation of Yb3+ by ATP has been detected previously using magnetic methods [32]. Yb3+ ion increases the linewidth of signals as a function of its distance from particular nuclei. This effect is apparent in the1H NMR spectra presented in Fig. 5. Of the three signals in the 6.5–10 ppm region observed for free ATP in the absence of Yb3+ (6.0, 8.1 and 8.4 ppm), the signal at 8.4 ppm broadens immediately into the baseline upon the addition of even a low ratio (1:10) of Yb3+ to ATP. This observation indicates that this aromatic ring proton (H8) is either adjacent to a nitrogen atom that is directly coordinated to the Yb3+, or else it is located near the paramagnetic center. (The former possibility was discounted by Svetlova et al. [28] considering the weak basicity of the purine nitrogen atoms). The other two signals broaden progressively as the ratio reaches 1:1 and are shifted downfield (Fig. 5). The variability in the line broadening of these signals supports the interpretation that the nitrogen atom is not directly coordinated to the Yb3+. At ratios higher than 1:1, the signals continue to broaden but the chemical shifts of the signals show little further change.
Fig. 5.
1H NMR spectra of 5 mM ATP solutions with various amounts of added Yb3+. The Yb3+ to ATP ratio is shown next to and to the left of the spectra. The solution pH values were between 6.9 and 7.1. Paramagnetic parameters were used to record these spectra (see “Materials and methods”). The1H assignments are indicated on the bottom spectrum. X marks an unassigned proton signal
Analogous studies were attempted using31P NMR spectroscopy; however, at the concentrations used to obtain the1H NMR spectra, the phosphate signals were excessively broadened (data not shown). Previously, higher concentrations of ATP were reported to exhibit31P NMR spectra at low metal to ATP ratios [32]. In summary, these NMR studies are consistent with the observation of a 1:1 complex between Yb3+ and ATP, in which the Yb3+ coordinates directly to the ATP in a multidentate manner involving the triphosphate groups.
Color changes and back titration of the Yb–PV systems with ATP
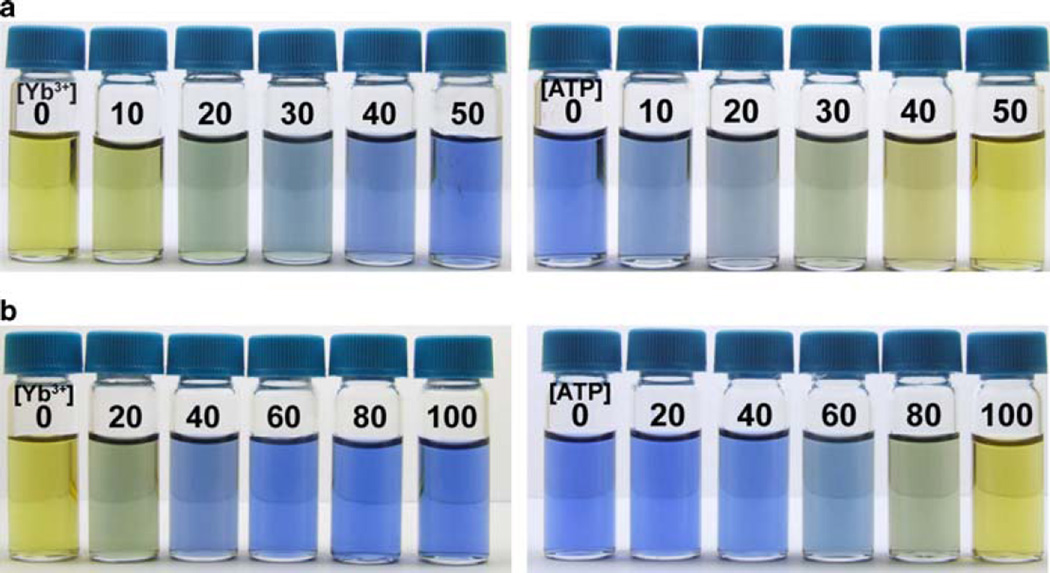
In light of the corrected sensor stoichiometry required by this work, we also reinvestigated the colorimetric response of the Yb3+–PV system assessed visually using the 2:1 [23–25] and 1:1 stoichiometries. Figure 6a shows the appearance of a series of solutions of PV (50 µM, pH 7, HEPES) containing increasing concentrations of Yb3+ (0–50 µM) using a 1:1 ratio of reagents. Back titration of the solution using ATP reverses the original (yellow to blue) color change. Figure 6b shows the corresponding series with [Yb3+] varied from 0 to 100 µM using the 2:1 ratio of reagents. The color transition from yellow to blue is almost completed at 40 µM Yb3+, and further addition of Yb3+ does not appreciably change the color of the solution. Back titration of this solution with ATP manifests a more gradual color transition compared to the equimolar sensor in Fig. 6a.1 These visual images of the color development in the assay support the idea that the sensor stoichiometry is 1:1 Yb:PV, not 2:1 as claimed previously [23–25].
Fig. 6.
a Visual assessment of color changes in PV (50 µM) solutions in HEPES (10 mM, pH 7.0) upon the addition of [Yb3+] = 0–50 µM and then [ATP] = 0–50 µM (top). b Corresponding series for [Yb3+] = 0–100 µM and [ATP] = 0–100 µM (bottom)
Conclusion
The stoichiometry of the Yb3+–PV coordination complex is critical for applications of this method to phosphate detection and sensing. The stoichiometry of the complex that forms between Yb3+ and PV in aqueous solution at pH 7.0 has been suggested to be either 1:1 [45–48] or 2:1 [23–25]. Our results demonstrate the Yb3+–PV complex stoichiometry to be 1:1. Based on the revised stoichiometry, we reinvestigated the colorimetric response of this sensor to added phosphates and ATP. The stoichiometries of the complexes that Yb3+ forms with phosphate and ATP were also investigated using indirect methods. Both of these compounds react with YbPV to form complexes with a predominant 1:1 stoichiometry at µM concentrations of metal and ligand, even though ATP is a multidentate ligand. The utilization of the correct Yb3+:PV stoichiometry is essential to obtain accurate phosphate derivative concentrations (0–50 µM) based on a linear response of the sensor complex Yb3+PV to the analyte.
Supplementary Material
Acknowledgments
Debbie C. Crans and Charles E. McKenna thank the National Institutes of Health for funding this work (Grant 1U19CA105010). We also thank Myron Goodman for stimulating discussions and providing the impetus for carrying out this work.
Footnotes
Electronic supplementary material
The online version of this article (doi:http://dx.doi.org/10.1007/s00775-008-0415-2) contains supplementary material, which is available to authorized users.
The photos illustrating the back titration with ATP in Fig. 6 do not compare to those reported previously [23]. It is curious that the details in the figure with the back titration reported previously in Fig. 2 of [23] show imperfections in the cuvettes and sample volumes consistent with an image reversal of samples shown in the initial titration.
Contributor Information
Ernestas Gaidamauskas, Department of Chemistry, Colorado State University, Fort Collins, CO 80523-1872, USA.
Kanokkarn Saejueng, Department of Chemistry, USC, Los Angeles, CA 90089-0744, USA.
Alvin A. Holder, Department of Chemistry, Colorado State University, Fort Collins, CO 80523-1872, USA
Subalita Bharuah, Department of Chemistry, Colorado State University, Fort Collins, CO 80523-1872, USA.
Boris A. Kashemirov, Department of Chemistry, USC, Los Angeles, CA 90089-0744, USA
Debbie C. Crans, Email: crans@lamar.colostate.edu, Department of Chemistry, Colorado State University, Fort Collins, CO 80523-1872, USA.
Charles E. McKenna, Email: mckenna@usc.edu, Department of Chemistry, USC, Los Angeles, CA 90089-0744, USA.
References
- 1.Blackburn GM, Eckstein F, Kent DE, Perree TD. Nucleos Nucleot Nucl. 1985;4:165–167. [Google Scholar]
- 2.Ma QF, Babbitt PC, Kenyon GL. J Am Chem Soc. 1988;110:4060–4061. [Google Scholar]
- 3.Usui T, Watanabe T, Higuchi S. J Chromatogr. 1992;584:213–220. doi: 10.1016/0378-4347(92)80578-e. [DOI] [PubMed] [Google Scholar]
- 4.Tsai EW, Ip DP, Brooks MA. J Chromatogr. 1992;596:217–224. doi: 10.1016/0021-9673(92)85010-q. [DOI] [PubMed] [Google Scholar]
- 5.Quitasol J, Krastins L. J Chromatogr. 1994;671:273–279. [Google Scholar]
- 6.Han MS, Yim DH. Bull Korean Chem Soc. 2004;25:1151–1155. [Google Scholar]
- 7.Han MS, Kim DH. Angew Chem Int Ed Engl. 2002;41:3809–3811. doi: 10.1002/1521-3773(20021018)41:20<3809::AID-ANIE3809>3.0.CO;2-N. [DOI] [PubMed] [Google Scholar]
- 8.Lovdahl MJ, Pietrzyk DJ. J Chromatogr A. 1999;850:143–152. doi: 10.1016/s0021-9673(99)00622-6. [DOI] [PubMed] [Google Scholar]
- 9.Peng SX, Dansereau SM. J Chromatogr A. 2001;914:105–110. doi: 10.1016/s0021-9673(00)01118-3. [DOI] [PubMed] [Google Scholar]
- 10.Daley-Yates PT, Gifford LA, Hoggarth CR. J Chromatogr. 1989;490:329–338. doi: 10.1016/s0378-4347(00)82791-7. [DOI] [PubMed] [Google Scholar]
- 11.Qin X-Z, Tsai EW, Sakuma T, Ip DP. J Chromatogr A. 1994;686:205–212. [Google Scholar]
- 12.Tsai EW, Chamberlin SD, Forsyth RJ, Bell C, Ip DP, Brooks MA. J Pharm Biomed Anal. 1994;12:983–991. doi: 10.1016/0731-7085(94)00047-6. [DOI] [PubMed] [Google Scholar]
- 13.Kline WF, Matuszewski BK, Bayne WF. J Chromatogr. 1990;534:139–149. doi: 10.1016/s0378-4347(00)82156-8. [DOI] [PubMed] [Google Scholar]
- 14.Kline WF, Matuszewski BK. J Chromatogr B. 1992;583:183–193. doi: 10.1016/0378-4347(92)80551-z. [DOI] [PubMed] [Google Scholar]
- 15.Sparidans RW, den Hartigh J. Pharm World Sci. 1999;21:1–10. doi: 10.1023/a:1008646810555. [DOI] [PubMed] [Google Scholar]
- 16.Palacios MA, Nishiyabu R, Marquez M, Anzenbacher P. J Am Chem Soc. 2007;129:7538–7544. doi: 10.1021/ja0704784. [DOI] [PubMed] [Google Scholar]
- 17.Callan JF, de Silva AP, Magri DC. Tetrahedron. 2005;61:8551–8588. [Google Scholar]
- 18.Pelleteret D, Fletcher NC, Doherty AP. Inorg Chem. 2007;46:4386–4388. doi: 10.1021/ic700452k. [DOI] [PubMed] [Google Scholar]
- 19.Chen ZF, Wang XY, Chen JW, Yang XL, Li YZ, Guo ZJ. New J Chem. 2007;31:357–362. [Google Scholar]
- 20.Ambrosi G, Dapporto P, Formica M, Fusi V, Giorgi L, Guerri A, Micheloni M, Paoli P, Pontellini R, Rossi P. Inorg Chem. 2006;45:304–314. doi: 10.1021/ic051304v. [DOI] [PubMed] [Google Scholar]
- 21.Ganesh V, Sanz MPC, Mareque-Rivas JC. Chem Commun. 2007:5010–5012. doi: 10.1039/b712857f. [DOI] [PubMed] [Google Scholar]
- 22.O’Neil EJ, Smith BD. Coord Chem Rev. 2006;250:3068–3080. [Google Scholar]
- 23.Yin CX, Gao F, Huo FJ, Yang P. Chem Commun. 2004:934–935. doi: 10.1039/b315965e. [DOI] [PubMed] [Google Scholar]
- 24.Yin CX, Huo FJ, Yang P. Sens Actuators B. 2005;109:291–299. [Google Scholar]
- 25.Yin CX, Huo FJ, Yang P. Anal Bioanal Chem. 2006;384:774–779. doi: 10.1007/s00216-005-0219-y. [DOI] [PubMed] [Google Scholar]
- 26.Morrison JF, Cleland WW. Biochemistry. 1983;22:5507–5513. [Google Scholar]
- 27.Eads CD, Mulqueen P, Dehorrocks W, Villafranca JJ. J Biol Chem. 1984;259:9379–9383. [PubMed] [Google Scholar]
- 28.Svetlova IE, Smirnova NS, Dobrynina NA, Martynenko LI, Evseev AM. Russ J Inorg Chem. 1988;33:643–645. [Google Scholar]
- 29.Smith RM, Martell AE, Chen Y. Pure Appl Chem. 1991;63:1015–1080. [Google Scholar]
- 30.Ohyoshi E, Jyodoi K, Kohata S. Nippon Kagaku Kaishi. 1993:468–470. [Google Scholar]
- 31.Shimizu T, Mims WB, Davis JL, Peisach J. Biochim Biophys Acta. 1983;757:29–39. [Google Scholar]
- 32.Tanswell P, Thornton JM, Korda V, Williams RJP. Eur J Biochem. 1975;57:135–145. doi: 10.1111/j.1432-1033.1975.tb02284.x. [DOI] [PubMed] [Google Scholar]
- 33.Hoppe U, Brow RK, Ilieva D, Jovari P, Hannon AC. J Non-Cryst Solids. 2005;351:3179–3190. [Google Scholar]
- 34.Milligan WO, Mullica DF, Beall GW, Boatner LA. Acta Crystallogr. 1983;C39:23–24. [Google Scholar]
- 35.Rghioui L, El Ammari L, Benarafa L, Wignacourt JP. Acta Crystallogr. 2002;C58:i90–i91. doi: 10.1107/s0108270102008107. [DOI] [PubMed] [Google Scholar]
- 36.Salmon R, Parent C, Vlasse M, Le Flem G. Mater Res Bull. 1979;14:85–89. [Google Scholar]
- 37.Crans DC, Yang LQ, Gaidamauskas E, Khan R, An WZ, Simonis U. ACS Symp Ser. 2003;858:304–326. [Google Scholar]
- 38.Hulanicki A, Glab S, Ackermann G. Pure Appl Chem. 1983;55:1137–1230. [Google Scholar]
- 39.Lyle SJ, Rahman M. Talanta. 1963;10:1177–1182. [Google Scholar]
- 40.Ueno K, Imamura T, Cheng KL. Handbook of organic analytical reagents. Boca Raton: CRC Press; 1992. pp. 47–56. [Google Scholar]
- 41.Torres J, Brusoni M, Peluffo F, Kremer C, Dominguez S, Mederos A, Kremer E. Inorg Chim Acta. 2005;358:3320–3328. [Google Scholar]
- 42.Finney LA, O’Halloran TV. Science. 2003;300:931–936. doi: 10.1126/science.1085049. [DOI] [PubMed] [Google Scholar]
- 43.Idee JM, Port M, Raynal I, Schaefer M, Le Greneur S, Corot C. Fundam Clin Pharmacol. 2006;20:563–576. doi: 10.1111/j.1472-8206.2006.00447.x. [DOI] [PubMed] [Google Scholar]
- 44.Skoog DA, West DM, Holler FJ, Crouch SR. Fundamentals of analytical chemistry. 8th. Belmont: Thomson Brooks/Cole; 2004. p. 805. [Google Scholar]
- 45.Akhmedli MK, Granovskaya PB. Azerb Khim Zh. 1965:105–108. [Google Scholar]
- 46.Babko AK, Akhmedli MK, Granovskaya PB. Ukr Khim Zh. 1966;32:879–885. [Google Scholar]
- 47.Kirillov AI, Shaulina LP, Churakova GN. Izv VUZ Khim Kh Tekh. 1981;24:1448–1450. [Google Scholar]
- 48.Takano T. Bunseki Kagaku. 1966;15:1087–1092. [Google Scholar]
- 49.Smith RM, Martell AE. NIST critically selected stability constants of metal complexes database, version 8.0. Gaithersburg: NIST; 2004. [Google Scholar]
- 50.Baes CF, Jr, Mesmer RE. The hydrolysis of cations. New York: Wiley; 1976. p. 137. [Google Scholar]
- 51.Firsching FH, Brune SN. J Chem Eng Data. 1991;36:93–95. [Google Scholar]
- 52.Byrne RH, Kim KH. Geochim Cosmochim Acta. 1993;57:519–526. [Google Scholar]
Associated Data
This section collects any data citations, data availability statements, or supplementary materials included in this article.


