Abstract
Iron depletion using iron chelating agents has been recognized as a promising anti-tumor therapeutic strategy. We herein report a novel theranostic agent for targeted iron chelation cancer therapy and near IR optical imaging. The theranostic agent was prepared via incorporation of a polyaminocarboxylated-based cytotoxic chelating agent (N-NE3TA) and a near IR fluorescent cyanine dye (Cy5.5) into a tumor targeting transferrin. The cytotoxic chelating agent was conjugated to transferrin (Tf), and the corresponding NE3TA-Tf conjugate was characterized and evaluated for anti-proliferative activity in HeLa, HT29, and PC3 cancer cells with elevated expression of transferrin receptor (TfR). The NE3TA-Tf conjugate displayed significant inhibitory activity against cancer cells (HeLa, HT29, and PC3). The near IR dye Cy5.5 was loaded into the NE3TA-Tf platform, and the cytotoxic and fluorescent transferrin conjugate (N-NE3TA-Tf-Cy5.5) was microscopically shown to enter the TfR over-expressing cancer cells. The theranostic conjugate (N-NE3TA-Tf-Cy5.5) has a potential application for dual use in targeted iron chelation cancer therapy and near IR fluorescence (NIRF) imaging.
Keywords: theranostic agent, anti-cancer therapy, near IR optical imaging, fluorescent probe, transferrin conjugate
Graphical abstract

Introduction
Depletion of cellular iron by iron sequestering agents has been proposed as an effective modality for treatment of cancers.1–3 The studies have shown that rapidly growing cancer cells have high demand of iron due to elevated expression of iron-regulatory and iron-dependent proteins such as transferrin receptor (TfR) and ribonucleotide reductase (RR) enzyme.1–3 DFO (desferoxamine) and Triapine (3-aminopyridine-2-carboxaldehyde thiosemi-carbazone) are iron chelating agents in clinical use.1–4 The known chelators DFO and Triapine have been shown to inhibit the RR enzyme overexpressed in cancer cells, and iron depletion was proposed as a mechanism for the inhibitory action of the antitumor agents on the cancer cells.1–5 DFO, a naturally-occurring siderophore, is the first iron chelator that was approved by the US FDA for the treatment of iron overload.1–4 The hexadentate DFO was shown to be highly selective in binding Fe(III) over Fe(II) or other biologically important metals and exhibit antiproliferative activity in cancer cells.3,4.6,7 Triapine is a thiosemicarbazone-based RR inhibitor, and anti-tumor therapeutic and iron depleting efficacy of the tridentate chelator was demonstrated in numerous preclinical and clinical trials.1,3,8,9
We previously reported that triazacyclononane-based polyaminocarboxylate chelate NE3TA (7-[2-[carboxymethyl)amino]ethyl]-1,4,7-triazacyclononane-1,4-diacetic acid) analogues exhibited significantly higher anti-proliferative activity against HeLa and colon cancer cells than the clinically available iron sequestering agent DFO.10–11
Development of multifunctional drugs that can allow for potent therapy and sensitive imaging of cancer is of significant interest. Theranostic agents containing both an imaging probe and a cytotoxic component have been evaluated for simultaneous therapy and imaging and staging of cancers.12–13 Theranostic agents incorporating a cytotoxic chemotherapeutic or radiotherapeutic agent and a magnetic resonance imaging (MRI), positron emission tomography (PET), or optical imaging probe have shown potential of the hybrid modality for therapy and imaging of various cancers.12–13
In our continued effort to develop multifunctional anti-cancer agents,10,11,14,15 we designed a tumor-targeting theranostic conjugate containing a bifunctional version of cytotoxic iron-chelating agent NE3TA (N-NE3TA, Figure 1), a near IR fluorescent cyanine dye (Cy5.5), and transferrin (Tf) (Figure 2). We hypothesized that the potential theranostic conjugate (N-NE3TA-Tf-Cy5.5) can be constructed without significantly compromising biological and chemical activity of each component in the conjugate. We selected transferrin (Tf) as a model tumor targeting vector for the present study. Many different types of cancer including HeLa, colon, and prostate cancers and colorectal liver metastases were reported to overproduce transferrin receptor (TfR).5,16–18 The iron binding protein transferrin (Tf) that can target TfR in the cells has been employed for selective delivery of antitumor drugs in cancer therapy.5,19–20 The theranostic NE3TA-based conjugate is expected to enter the cancers with elevated expression of TfR and provide simultaneous therapy and near IR fluorescent imaging and therapeutic monitoring of the cancers.
Figure 1.

Iron chelating anti-tumor agents in clinical and preclinical evaluation
Figure 2.
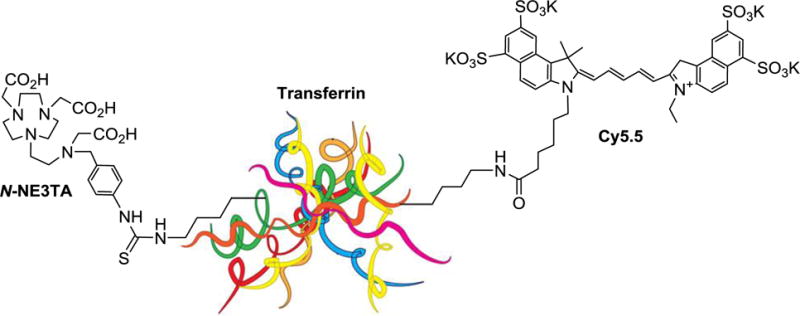
New theranostic N-NE3TA-transferrin-Cy5.5 conjugate for targeted cancer therapy and near IR optical imaging
We herein report preparation, characterization, and evaluation of the new theranostic agent (N-NE3TA-Tf-Cy5.5) for iron chelating antitumor therapy and near IR optical imaging. The iron chelating anti-tumor agent N-NE3TA was conjugated to Tf, and cytotoxicity of the corresponding N-NE3TA-Tf conjugate was evaluated using HeLa, HT29, and PC3 cells with elevated expression of TfR. The new theranostic conjugate (N-NE3TA-Tf-Cy5.5) was constructed by loading the near IR cyanine dye Cy5.5 to transferrin (Tf) and further evaluated for tumor uptake using the cancer cells.
Results and Discussion
Preparation of the new transferrin (Tf)-based conjugates N-NE3TA-Tf and N-NE3TA-Tf-Cy5.5 is outlined in Scheme 1. The nitro (NO2) group in the chelating agent N-NE3TA10 (Figure 1) was converted to the isothiocyanate (NCS) form for conjugation to a tumor targeting moiety as previously reported.21 The bifunctional chelating agent N-NE3TA-NCS (Scheme 1) was conjugated to transferrin (Tf) via reaction of the NCS group in N-NE3TA-NCS with the amino group of the lysine residues present in Tf.
Scheme 1.
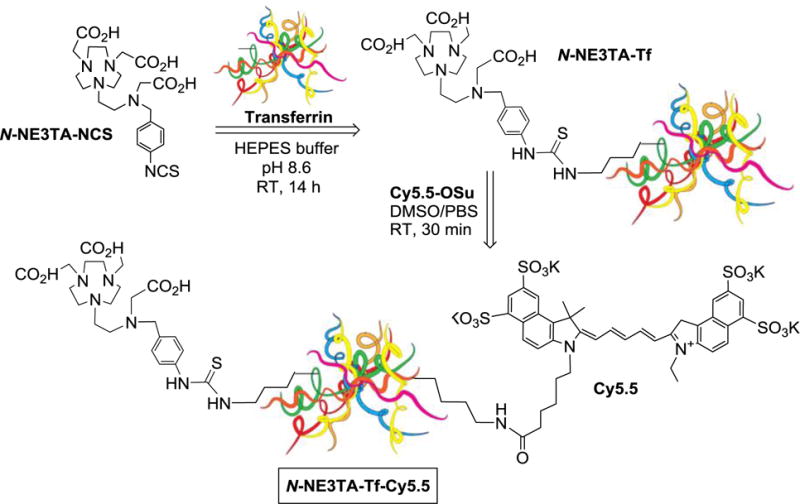
Construction of New Theranostic Agent (N-NE3TA-Tf-Cy5.5) for Near IR Optical Imaging and Therapy of Cancer
The concentration of Tf in the corresponding conjugate N-NE3TA-Tf was quantified by UV spectroscopic method.21 The number of ligand (N-NE3TA) linked to transferrin (L/P ratio = 2.0) was determined by Cu(II)-AAIII based UV-Vis spectrophotometric assay.21 The conjugate N-NE3TA-Tf was evaluated for anti-proliferative activity in the HeLa, HT29, and PC3 cell lines with elevated expression of TfR (Figure 3), and the cytotoxicity of N-NE3TA-Tf was compared to that of the parent chelate N-NE3TA. The known iron chelator DFO was used as a control.
Figure 3.
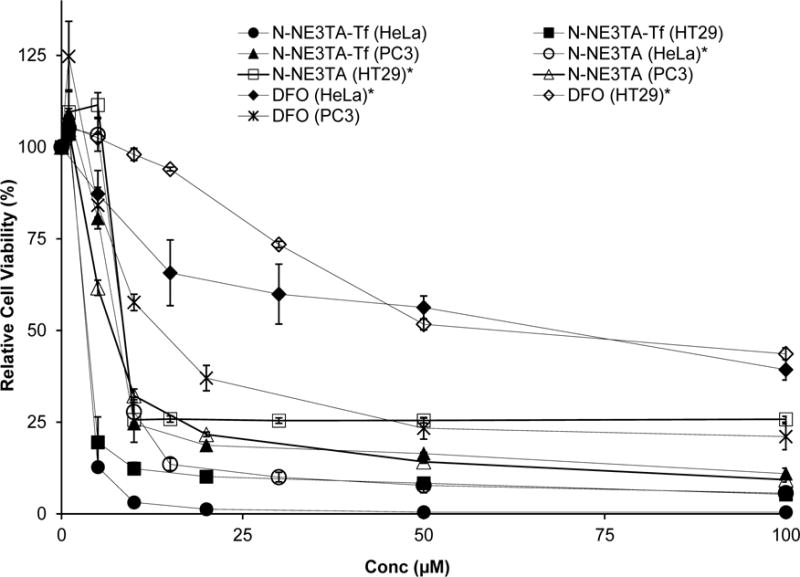
Effect of N-NE3TA-based anti-tumor agents and clinically available drug DFO on viability of HeLa, HT29, and PC3 cancer cells. Cell viability data (mean ± SD%) was measured in triplicate. The cell viability data of the known chelators DFO and N-NE3TA in HeLa and HT29 were cited for comparison.10
Among the cancer cells tested, HeLa cells were most sensitive to the cytotoxic effect of the N-NE3TA-Tf conjugate. When treated with the parent chelating agent N-NE3TA and the N-NE3TA-Tf conjugate at a low concentration (10 μM), almost all HeLa cells were destroyed (<3% viability). N-NE3TA-Tf (IC50 = 2.4 ± 0.2 μM) exhibited significantly more potent cytotoxic effect on HeLa cells than N-NE3TA (IC50 = 8.4 ± 0.4 μM)10 and DFO (IC50 = > 50 μM)10. The N-NE3TA-Tf conjugate (IC50 = 2.8 ± 0.1 μM) also displayed an increased cytotoxicity against the HT29 cells than N-NE3TA (IC50 = 6.8 ± 0.4 μM). Viability of HT29 cells treated with the N-NE3TA-Tf conjugate and N-NE3TA at concentration of 10 μM was 12 % and 26%, respectively. When compared to the HeLa and HT29 cells, an enhanced viability (25% and 33%, respectively) was observed with the PC3 cells treated with N-NE3TA-Tf and N-NE3TA at the same concentration (10 μM). The N-NE3TA-Tf conjugate (IC50 = 7.7 ± 0.7 μM) displayed similar inhibitory activity to the parent chelator N-NE3TA (IC50 = 7.2 ± 0.3 μM) in PC3 cancer cells. The N-NE3TA-Tf conjugate was shown to be significantly more effective in inhibiting the three cancer cell lines than the clinically available DFO. DFO was more cytotoxic against PC3 cells (IC50 = 15.8 ± 1.6 μM) than the HeLa and HT29 cells (IC50 = > 36 μM). Viability of PC3, HT29, and Hela cells treated with DFO (50 μM) was around 23%, 52%, and 56%, respectively. The increased cytotoxicity of the Tf conjugates relative to the parent chelator N-NE3TA seems to be ascribed to efficient binding of the Tf conjugates to TfR which is more evident in HeLa and HT29 cancer cells. The cycotoxicity data indicate that conjugation of the antitumor agent N-NE3TA to the delivery vector (Tf) made no negative impact on inhibitory activity of N-NE3TA. The parent chelator N-NE3TA was not cytotoxic against cancer cells saturated with Fe(II) or Fe(III) (Supporting Information). When HeLa cells were incubated with both N-NE3TA (50 μM) and iron (ferrous chloride or ferric citrate, 50 μM), very little antiproliferative activity was observed (>90% cell viability at 72 hr incubation). This underlines that the inhibitory activity of N-NE3TA in cancer cells is related to effective chelation of cellular iron.10,22
To visualize tumor uptake of the N-NE3TA-Tf conjugate, a near IR fluorescent cyanine dye Cy5.5 was introduced to the Tf conjugate. Cy5.5 N-hydroxysuccinimide (NHS) ester was reacted with the amino group of the lysine residues present in Tf of the N-NE3TA-Tf conjugate to provide N-NE3TA-Tf-Cy5.5. The fluorescent N-NE3TA-Tf conjugate was purified via dialysis and characterized by HPLC (Supporting Information) and UV-Vis and fluorescence spectroscopic analysis (Figure 4). The formation of N-NE3TA-Tf-Cy5.5 conjugate was evidenced by HPLC traces at around 7 min at 280 nm and 675 nm, respectively. The unbound Cy5.5 was shown to have the traces at 20 min and 27 min at 675 nm. Two significant absorption peaks at 630 nm and 678 nm along with the peak at 280 nm shown in UV-Vis spectrum indicate incorporation of Cy5.5 to N-NE3TA-Tf conjugate (Figure 4a). The maximum fluorescent emission of N-NE3TA-Cy5.5 conjugate was peaked at 695 nm (Figure 4b). The concentration of Cy5.5 and protein in the conjugate was determined by UV-Vis spectroscopic method.23 The ratio of dye to protein (D/P = 16.7) in the purified transferrin conjugates was determined by spectroscopic method based on absorbance of dye and protein at 675 nm and 280 nm.
Figure 4.
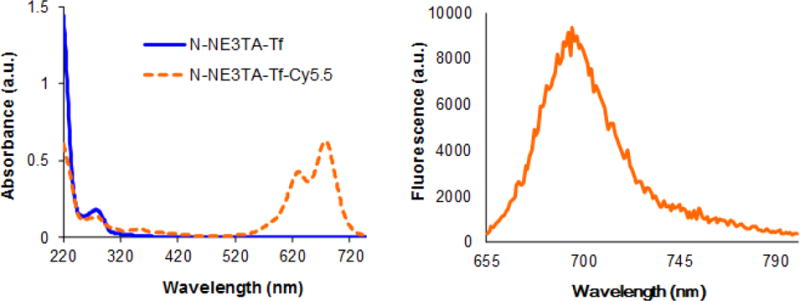
UV-Visible and Fluorescence Spectra of N-NE3TA-Tf and N-NE3TA-Tf-Cy5.5 conjugates
NIR Fluorescence and phase contrast images of HeLa, HT29 and PC3 cells incubated with N-NE3TA-Tf-Cy5.5 conjugate (50 μM) were obtained using a confocal microscope. The confocal microscopic images indicate that the NIR fluorescent Cy5.5 conjugate was taken up by HeLa, HT29 and PC3 cells (Figure 5), while control cells without the Cy5.5 dye showed no fluorescent signals (Supporting Information). The NIR fluorescence images confirm tumor localization of the transferrin conjugates, and biological activity of transferrin remained intact after conjugation of Tf with both N-NE3TA and Cy5.5. HeLa cells appears to take up more conjugates than PC3 and HT29, presumably due to higher binding affinity of the conjugate to the HeLa cells with elevated expression level of TfR. Nuclear localization of the Tf-Cy5.5 conjugate was observed by PC3 cells stained with Hoechst (blue). The transferrin conjugate was shown to produce fluorescence signal, mainly on the surface of PC3 cells, and no substantial nuclear uptake of the transferrin conjugate was observed (Figure 6). When PC3 cells with elevated TfR expression were incubated with N-NE3TA-Cy5.5 along with an excess amount of transferrin, uptake of the fluorescent conjugate into the PC3 cells was shown to be reduced (Supporting Information). The result of the blocking experiment suggests a TfR-meditated uptake of the conjugate into the PC3 cells. The N-NE3TA-Tf conjugate was further evaluated for anti-proliferative activity in the PC3 cells (Supporting Information). After a 72 h incubation, viability of the PC3 cells treated with the conjugate at concentration of 10 μM was 2.5%. The result indicates that the N-NE3TA-Tf-Cy5.5 conjugate remains cytotoxic against PC3 cells, and antitumor activity of N-NE3TA conjugated to Tf was not affected by labeling of the transferrin with the near IR dye.
Figure 5.
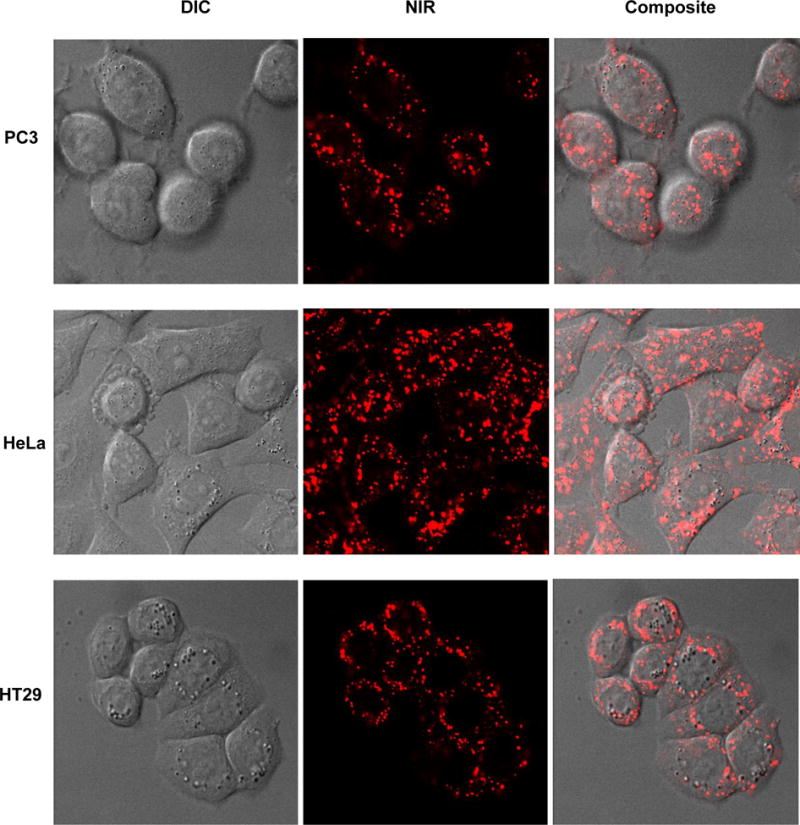
Phase contrast, near IR fluorescent, and composite images of live cancer cells (PC3, HeLa, and HT29) incubated with N-NE3TA-Tf-Cy5.5 conjugate (1.5 μM) for 3 hr at 37 °C.
Figure 6.
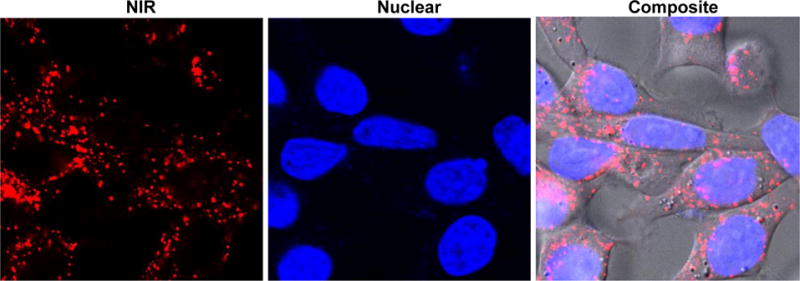
Nuclear and Near IR images of live PC3 cells incubated with N-NE3TA-Tf-Cy5.5. PC3 cells were incubated with the conjugate (1.5 μM) for 3 hr at 37 °C, washed with PBS, and incubated with Hoechst (1.6 μM) for 10 min.
Conclusion
A cytotoxic and near IR fluorescent transferrin conjugate (N-NE3TA-Tf-Cy5.5) was developed for potential theranostic use in targeted iron chelation cancer therapy and optical imaging. The transferrin conjugate N-NE3TA-Tf was evaluated for cytotoxicity in HeLa, HT29, and PC3 cancer cells. The cytotoxicity data indicated that conjugation of the potential iron-chelating agent N-NE3TA to transferrin was well tolerated without negative impact on the anti-proliferative activity of the parent chelator N-NE3TA. The N-NE3TA-Tf conjugate exhibited greater cytotoxicity in Hela and HT29 than the parent chelator N-NE3TA, while N-NE3TA-Tf has similar antitumor activity to N-NE3TA in PC3 cells. The near IR probe Cy5.5 was successfully incorporated into the N-NE3TA-Tf conjugate without sacrificing antitumor effect of the chelator. High accumulation of the targeted theranostic agent N-NE3TA-Tf-Cy5.5 in the cancer cells was evidenced by the microscopic observations. The encouraging in vitro data suggest the potential of N-NE3TA-Tf-Cy5.5 conjugate as a novel theranostic agent for treatment and detection of cancers.
Experimental Section
Instruments and methods
All absorbance measurements for the protein concentration and ligand protein ratio were obtained on an Agilent 8453 diode array UV-Vis spectrophotometer (Agilent, Santa Clara, CA) equipped with an 8-cell transport system (designed for 1-cm cells). Analytical HPLC was performed on Agilent 1200 (Agilent, Santa Clara, CA) equipped with a diode array detector (λ = 254, 280, and 675 nm) and themostat set at 35 °C. Arsenazo III (AAIII, 2,2-(1,8-dihydroxy-3,6-disulfonaphthylene-2,7-bisazo) bis-benzenearsonic acid), and copper atomic absorption standard solution, and diferric (holo) transferrin were purchased from Sigma-Aldrich (St. Louis, MO) and used as received. A stock solution of holo-transferrin was freshly prepared and stored at 4 °C. HEPES (N-(2-hydroethyl)-piperazine-N′-ethanesulfonic acid) buffer (50 mM HEPES, 150 mM NaCl, pH 8.6) was prepared and stored at 4 °C.
Conjugation of N-NE3TA-NCS to transferrin (Tf)
N-NE3TA in the form of isothiocyanate (N-NE3TA-NCS) was prepared as previously reported.21 Holo transferrin (29 mg) was dissolved in HEPES buffer (1 mL, 50 mM HEPES, 150 mM NaCl at pH 8.6). 10-fold molar excess of N-NE3TA-NCS was added to a sterilized test tube containing the resulting Tf solution. The resulting solution was gently agitated overnight at room temperature. The following day, this solution was placed on an Amicon C-50 membrane (50,000 MWCO) and spun down to reduce volume. PBS (3 × 2mL) was added to the remaining solution of the N-NE3TA-Tf conjugate, followed by centrifugation in order to remove unreacted ligand. The volume of purified Tf conjugate was brought to 550 μL for N-NE3TA-Tf using PBS. The protein concentration in the conjugate was determined (6.6 × 10⁻⁴ M, 27.4 mg, 94.5%) by measuring absorbance of the solution at 280 nm.
Spectroscopic Determination of Ligand to Protein (L/P) Ratio for Tf conjugate
All absorbance measurements were obtained on an Agilent 8453 diode array spectrophotometer equipped with a 8-cell transport system (designed for 1 cm cells). A stock solution of the Cu(II)-AAIII reagent in 0.15 M NH4OAc (pH 7.0) was prepared by adding an aliquot of a 15.5 × 10⁻³ M copper atomic absorption solution (to afford a 5 μM solution of copper) to a 10 μM solution of AAIII. This solution was stored in the dark to avoid degradation over time. A UV/Vis spectrometer was zeroed against well-dried blank 8 cuvettes with a window open from 190 nm to 1100 nm. A cuvette was filled with AAIII solution (2 mL), and the other seven cuvettes with the Cu(II)-AAIII (2 mL). Cu(II)-AAIII solution (50 μL) in the seven cuvettes was removed and discarded. Milli-Q water (50 μL) was added to the second cuvette, and one to five 10 μL additions of N-NE3TA were added to the five cuvettes to give a series of five different concentrations. The solutions in the third to the seventh cuvette were diluted to 2.0 mL by adding an aliquot of Milli-Q water. N-NE3TA-Tf (5.0 μL) was added to the eighth cuvette containing Cu(II)-AAIII reagent (1950 μL) and water (45 μL). After addition of Tf conjugate to the Cu(II)-AAIII solution, the resulting solution was equilibrated for 10 min. The absorbance of the resulting solution at 610 nm was monitored every 30 seconds over 6 min. The average of the absorbance of each solution was calculated, and the absorbance data from the Cu(II)-AAIII solutions containing six different concentrations were used to construct a calibration plot of A610nm versus [N-NE3TA] by the equation, Y = 0.0701−(1.567 × 10⁴)[N-NE3TA] (R2 = 0.997)/Y = 0.0665−(4.1818 × 10³)[N-NE3TA] (R2 = 0.993), wherein Y = A610nm. The concentration of N-NE3TA in the Tf conjugate was calculated (1.3 × 10⁻³ M). The L/P ratio of the N-NE3TA-Tf ([1.3 × 10⁻³ M]/[6.6 × 10−4 M]) was measured to be 2.0.
Preparation of N-NE3TA-Tf-Cy5.5 conjugate
N-NE3TA-Tf (3.0 mg, 39 nmol) in PBS was reacted with Cy5.5 (0.9 mg, 797 nmol) for 30 min at room temperature. The resulting solution was placed on a Centricon C-50 membrane and spun down to reduce volume. PBS (3 × 2 mL) was added to the remaining solution of the conjugate, followed by centrifugation in order to remove unreacted Cy5.5. The solution of the purified conjugate in PBS was diluted to 0.1 mL. The purified conjugate was characterized by analytical SE-HPLC (TSKgel G3000PW column, Tosoh Biosep) using the isocratic mobile phase (PBS, pH 7.4, 45 min, flow rate of 1 mL/min, λ = 280 and 675 nm). N-NE3TA-Tf-Cy5.5 conjugate (tR = ~7 min) was eluted earlier than unbound Cy5.5 (tR = ~14, 20, 28 min) at 675 nm.
UV-Vis and Fluorescence spectral characterization of N-NE3TA-Tf and N-NE3TA-Tf-Cy5.5 conjugate
A stock solution of N-NE3TA-Tf and N-NE3TA-Tf-Cy5.5 in PBS (pH 7.4) was prepared. UV-Vis spectra were recorded on an Agilent 8453 diode array spectrophotometer. UV–Vis measurements were carried out by adding 2 mL aliquot of the stock solution of N-NE3TA-Tf (1.60 μM) or N-NE3TA-Tf-Cy5.5 (0.2 μM) into a quartz cuvette. Fluorescence spectra were recorded on a Florolog 2 spectrofluorometer (SPEX industries, Inc. Edison, NJ) with excitation at 633 nm, bandwidth of 5 nm, data collection every 1 nm at 20 °C. The emission data were collected from 655 nm to 800 nm. The measurement of fluorescence was carried out by adding 1 mL aliquot of N-NE3TA-Tf-Cy5.5 (0.2 μM) into a quartz cuvette.
Spectroscopic Determination of Dye to Protein (D/P) Ratio for N-NE3TA-Tf-Cy5.5 conjugate
To measure concentrations of protein and Cy5.5 in the conjugate, a UV/Vis spectrometer was zeroed against a cuvette filled with 2.0 mL of PBS with a window open from 190 nm to 1100 nm. A 1 μL portion of PBS was removed and discarded, 1 μl of the conjugate solution was added, and absorbance at 280 nm and 675 nm was noted. Beer’s Law was used to calculate [HoloTf] in the conjugate using equation A = ɛbc, where A is absorbance at 280 nm, ɛ is extinction coefficient of transferrin (109,300 M−1cm−1), b is path length (1 cm), and c is concentration of the protein with dilution factor of 2000. Concentration of Cy5.5 in the conjugate was also obtained using Beer’s Law with molar absorptivity24 of 250,000 M−1cm−1 and dilution factor of 2000. Absorbance at 280 nm for the protein concentration was corrected (A280,actual = A280,observed − (A675 × 0.18)) due to the contribution of Cy5.5 to the absorbance at 280 nm.23 Concentration of Cy5.5 and Tf in N-NE3TA-Tf-Cy5.5 was determined to be 1.8 × 10⁻³ M, and the resulting dye to protein ratio (D/P) of 14.4 was obtained.
Cell culture
Human cervix cancer cell line Hela and human colon cancer cell line HT29 were kindly provided by Dr. Jialing Xiang (Illinois Institute of Technology, Chicago, IL) and Dr. Rajendra Metha (Illinois Institute of Technology Research Institute, Chicago, IL), respectively. The cancer cells were cultured in RPMI-1640 medium containing 10% fetal bovine serum (FBS) in a humidified atmosphere with 5% CO2 at 37 °C. Human prostate cancer cell line PC3 was obtained from ATCC and cultured under the same condition with HeLa and HT29 cancer cells.
Antiproliferative activity
Cells were seeded onto 96-well plate at density of 2,000 cells for Hela and PC3 cells and 5,000 cells for HT29 cells per well in complete medium (100 μL) and allowed to attach for 24 h. The medium was replaced with fresh medium (100 μL) containing a series of concentrations (1, 5, 10, 20, 40, 50 and 100 μM, based on concentration) of an anti-tumor agent. The cells were incubated for 72 h after which the medium was replaced with fresh medium (100 μL) prior to MTS assay.10 To measure cell proliferation, the Cell Titer 96 aqueous nonreactive cell proliferation assay (Promega Life Sciences, Madison, WI) was used according to the manufacturer’s instructions. Briefly, MTS (2 mg/mL) and PMS (0.92 mg/ml) were mixed in a ratio of 20:1. The MTS/PMS mixture (20 μL) was added into the complete medium (0.1 mL) in each well. The plate was incubated for 3 h at 37 °C. Optical absorbance at 490 nm was then recorded with an enzyme-linked immunosorbent assay (ELISA) microtiter plate reader (Biotek). Each experiment was performed in triplicate. Anti-proliferative activity of the test compounds was expressed as the fraction of optical absorbance of the treated cells relative to the untreated control cells. The data were plotted in GraphPad Prizm 3.0. Nonlinear regression analysis was used to determine IC50 values. IC50 of the compounds was expressed as the concentration of the drugs inhibiting cell growth by 50%.
Iron Saturation Experiment
HeLa cells were inoculated onto 96-well plates at a density of 2000 per well in 0.1 mL complete medium and incubated for 24 h. The aqueous solution (50 μM) of a chelator was prepared and mixed with stoichiometric amount of aqueous ferric citrate solution (50 μM) in complete medium, and the resulting mixture was then added into the triplicate plates. Control samples containing no ferric citrate were also tested. Plates were incubated at 37 °C in 5% CO2/95% air for 72 h. After the incubation, cells proliferation rates were evaluated by MTS assay.10
Fluorescent image of live cells
50,000 cells were plated in glass-bottom dishes (P35G-1.5–20-C, MatTek) and incubated with growth media (RPMI 1640 with 10% FBS) in a humidified atmosphere with 5% CO2 at 37 °C for 36 h. After incubation of the cells in glass-bottom dishes for 36 h, the media was replaced with growth media (1 mL). A solution of Cy5.5 conjugate in growth media was prepared by diluting 50 μg of Tf-N-NE3TA-Cy5.5 in growth media (1 mL), and the resulting solution of the conjugate was added to the dishes containing cells suspended in growth media (1 mL). The final concentration of N-NE3TA-Tf-Cy5.5 was 1.5 μM. The cells were incubated for 3 h. For the blocking experiment, 2 mg (9.5 mg/mL) of purified HoloTf in HEPES buffer was added to a dish containing N-NE3TA-Tf-Cy5.5 (1.5 μM) in growth media. The total volume of the resulting solution in a dish was 2 mL. Control cells were incubated with growth media (2 mL) containing no conjugate. At the end of the incubation time, cells were rinsed with room temperature PBS five times. For co-injection of Cy5.5 conjugate and Hoechst, a solution of Hoechst (3.2 μM, 1 mL) in growth media was added to the cells containing Cy5.5 that were washed with PBS and suspended in growth media (1 mL). The final concentration of Hoechst was 1.6 μM (2 mL). The cells were incubated for 10 min and were rinsed with room temperature PBS five times. After washing, cells were suspended in 30 mM HEPES in the growth media (2 mL) for microscopic observation under Leica SP5 II STED-CW Superresolution Laser Scanning Confocal Microscope with a filter set at 633 nm (excitation) and 670–786 nm (emission) for Cy5.5 and 300nm (excitation) and 400–480 nm (emission) for Hoechst.
Supplementary Material
Acknowledgments
This work was partly supported by the National Institutes of Health (R01 CA136695). We thank Dr. Wonhwa Cho (Department of Chemistry, University of Illinois at Chicago) for assistance in collecting fluorescence spectra using the fluorescence spectrometer in his research lab.
References
- 1.Buss JL, Torti FM, Torti SV. Curr Med Chem. 2003;10:1021–34. doi: 10.2174/0929867033457638. [DOI] [PubMed] [Google Scholar]
- 2.Kalinowski DS, Richardson DR. Pharmacol Rev. 2005;57:547–583. doi: 10.1124/pr.57.4.2. [DOI] [PubMed] [Google Scholar]
- 3.Birch N, Wang X, Chong H-S. Expert Opinion. 2006;16:1533–57. [Google Scholar]
- 4.Chaston TB, Lovejoy DB, Watts RN, Richardson DR. Clin Cancer Res. 2003;9:402–414. [PubMed] [Google Scholar]
- 5.Qian ZM, Li H, Sun H, Ho K. Phamacol Rev. 2002;54:561–587. doi: 10.1124/pr.54.4.561. [DOI] [PubMed] [Google Scholar]
- 6.Blatt J, Stitely S. Cancer Res. 1987;47:1749–50. [PubMed] [Google Scholar]
- 7.Estrov Z, Tawa A, Wang XH, Dube ID, Sulh H, Cohen A, Gelfand EW, Freedman MH. Blood. 1987;69:757–61. [PubMed] [Google Scholar]
- 8.Alvero AB, Chen W, Sartorelli AC, Schwartz P, Rutherford T, Mor G. J Soc Gynecol Investig. 2006;13:145–152. doi: 10.1016/j.jsgi.2005.11.004. [DOI] [PubMed] [Google Scholar]
- 9.Krishna G, Mao J, Almassian B, Lang W. Pharm Dev Technol. 1999;4:461. doi: 10.1080/10837459908984226. [DOI] [PubMed] [Google Scholar]
- 10.Chong H-S, Ma X, Lee H, Bui P, Song HA, Birch N. J Med Chem. 2008;51:2208–15. doi: 10.1021/jm701307j. [DOI] [PubMed] [Google Scholar]
- 11.Chong H-S, Song HA, Ma X, Lim SY, Sun X, Mhaske S. Chem Commun. 2009:3011. doi: 10.1039/b823000e. [DOI] [PubMed] [Google Scholar]
- 12.Lee DE, Koo H, Sun IC, Ryu JH, Kim K, Kwon IC. Chem Soc Rev. 2012;41:2656–72. doi: 10.1039/c2cs15261d. [DOI] [PubMed] [Google Scholar]
- 13.Kelkar SS, Reineke TM. Bioconjugate Chem. 2011;22:1879–1903. doi: 10.1021/bc200151q. [DOI] [PubMed] [Google Scholar]
- 14.Chong H-S, Brechbiel MW. J Org Chem. 2002;67:8072–8. doi: 10.1021/jo0204911. [DOI] [PubMed] [Google Scholar]
- 15.Chong H-S, Torti FM, Torti SZ, Brechbiel MW. J Med Chem. 2004;47:5230–4. doi: 10.1021/jm040076w. [DOI] [PubMed] [Google Scholar]
- 16.Ward JH, Kushner JP, Kaplangy J. J Biol Chem. 1982;251:10311–10323. [Google Scholar]
- 17.Keer HN, Kozlowski JM, Tsai YC, Lee C, McEwan RN, Grayhack JT. J Urol. 1990;143:381–385. doi: 10.1016/s0022-5347(17)39970-6. [DOI] [PubMed] [Google Scholar]
- 18.Brookes MJ, Hughes S, Turner FE, Reynolds G, Sharma N, Ismail T, Berx G, McKie AT, Hotchin N, Anderson GJ, Iqbal T, Tselepis C. Gut. 2006;55:1449–60. doi: 10.1136/gut.2006.094060. [DOI] [PMC free article] [PubMed] [Google Scholar]
- 19.Beyer U, Roth T, Schumacher P, Maier G, Unold A, Frahm AW, Fiebig HH, Unger C, Kratz F. J Med Chem. 1998;41:2701–2708. doi: 10.1021/jm9704661. [DOI] [PubMed] [Google Scholar]
- 20.Bellocq NC, Pun SH, Jensen GS, Davis ME. Bioconjugate Chem. 2003;14:1122–1132. doi: 10.1021/bc034125f. [DOI] [PubMed] [Google Scholar]
- 21.Kang CS, Wu N, Chen Y, Sun X, Bandara N, Liu D, Lewis MR, Rogers BE, Chong H-S. J Inorg Biochem. 2016;154:60–66. doi: 10.1016/j.jinorgbio.2015.10.012. [DOI] [PMC free article] [PubMed] [Google Scholar]
- 22.Torti SV, Torti FM, Whitman SP, Brechbiel MW, Park G, Planalp RP. Blood. 1998;92:1384–1389. [PubMed] [Google Scholar]
- 23.Hahn CD, Riener CK, Gruber HJ. Single Molecules. 2000;2:149–154. [Google Scholar]
- 24.Mujumdar RB, Ernst LA, Mujumdar SR, Lewis CJ, Waggoner SS. Bioconjugate Chem. 1993;4:105–111. doi: 10.1021/bc00020a001. [DOI] [PubMed] [Google Scholar]
Associated Data
This section collects any data citations, data availability statements, or supplementary materials included in this article.


