

Abstract
The present study investigates the possible mechanism(s) underlying GSH deficiency in the mouse spinal cord during the course of MOG35–55 peptide-induced experimental autoimmune encephalomyelitis (EAE), a commonly used animal model of multiple sclerosis. Using the classical enzymatic recycling method and a newly developed immunodot assay, we first demonstrated that total GSH levels (i.e. free GSH plus all its adducts) are reduced in EAE, suggesting an impaired synthesis. The decline in the levels of this essential antioxidant tripeptide in EAE coincides temporally and in magnitude with a reduction in the amount of γ-glutamylcysteine ligase (GCL), the rate-limiting enzyme in GSH synthesis. Other enzymes involved in GSH biosynthesis, whose genes also contain antioxidant-response elements, including glutathione synthetase (GSS), cystine/glutamate antiporter (xCT) and γ-glutamyl transpeptidase (γ-GT) are diminished in EAE as well. Low levels of GCL, GSS and γ-GT are the consequence of reduced mRNA expression, which correlates with diminished expression of the nuclear factor (erythroid-derived 2)-like 2 (Nrf2) in both the cytosol and nucleus. Interestingly, the low Nrf2 expression does not seem to be caused by increased degradation via Keap1-dependent or Keap1-independent mechanisms (such as glycogen synthetase kinase-3β activation), or by reduced levels of Nrf2 mRNA. This suggests that translation of this important transcription factor and/or other still unidentified post-translational processes are altered in EAE. These novel findings are central towards understanding how critical antioxidant and protective responses are lost in inflammatory demyelinating disorders.
Keywords: experimental autoimmune encephalomyelitis, glutathione synthesis, multiple sclerosis, Nrf2 expression, oxidative stress
Graphical Abstract
We show that the concentration of glutathione [GSH] is reduced in the spinal cord of mice with experimental autoimmune encephalomyelitis. Low [GSH] is likely due to diminished expression of various GSH synthesizing enzymes. These changes coincide with a decrease of Nrf2 (nuclear factor erythroid 2–related factor 2) protein levels, which does not seem to result from increased degradation. These findings are important for our understanding of how critical antioxidant and protective responses are lost during inflammatory demyelination.

Introduction
Multiple sclerosis (MS) is an inflammatory demyelinating disease of the human CNS and a major cause of neurological disability among young adults in North America and Europe (Trapp and Syts 2009). The pathological changes that contribute to neurological disability in MS include inflammation, demyelination, oligodendrocyte death and axonal degeneration (Kornek and Lassmann 1999). Experimental autoimmune encephalomyelitis (EAE) is a well-established animal model for CNS autoimmune disorders, recapitulating a number of clinical and pathological features of MS (Gold et al. 2000). There is a substantial amount of data indicating that oxidative stress plays a major role in the pathogenesis of both MS and EAE. Excessive production of reactive oxygen species, by activated microglia/macrophages and astrocytes as well as by dysfunctional mitochondria, leads to severe oxidative stress and contributes significantly to tissue damage (Gilgun-Sherki et al. 2004). A number of oxidized metabolites have been shown to be present in the CNS of EAE animals and antioxidant therapies are generally beneficial. We have previously shown that levels of GSH, the ubiquitous thiol tripeptide that acts alone or in concert with various enzymes to reduce a number of oxidants (Lu 2013), are significantly diminished in the CNS of EAE rats (Smerjac and Bizzozero 2008) and mice (Zheng and Bizzozero 2010, Dasgupta et al. 2013). Interestingly, the decline in the concentration of reduced GSH was not accompanied by an equal rise in the amount of glutathione disulfide (GSSG), but rather represents a reduction in the total amount of this tripeptide (Dasgupta et al. 2013). This indicates that decreased synthesis and/or increased degradation of GSH are responsible for its low levels in this disorder.
De novo synthesis of GSH from glutamate, cysteine and glycine involves the action of two ATP-dependent enzymes: γ-glutamylcysteine ligase (GCL) and GSH synthetase (GSS) (Lu 2013). GCL is the rate-controlling enzyme in the pathway and is made of a catalytic (GCLc) and a regulatory subunit. In addition, there are two other proteins whose activities contribute to total amount of GSH in the cell. The first is the cystine/glutamate antiporter (xCT), which mediates the exchange of extracellular L-cystine and intracellular glutamate across the plasma membrane of neural cells and thus provides cysteine for GSH synthesis (Bridges et al. 2012). The second is the γ-glutamyl transpeptidase (γ-GT), which is the only enzyme able to hydrolyze extracellular GSH, allowing the reutilization of its constituent amino acids (Garcion et al. 1999). The basal and inducible expression of GCL (Wild et al. 1999), GSS (Lee et al. 2005), xCT (Sasaki et al. 2002) and γ-GT (Zhang et al. 2006, Xu et al. 2014) is mediated by means of the antioxidant response element (ARE), a cis-acting enhancer sequence in the promoter region of a number of genes that are important for maintaining cellular redox homeostasis and for protecting against oxidative stress (Reddy 2008).
Nuclear factor (erythroid-derived 2)-like 2 (a.k.a. NFE2L2 or Nrf2) is recognized as the major transcription factor that regulates ARE-mediated gene expression. Under normal conditions, the level of Nrf2 in the cell is kept very low by its inhibitor Kelch-Like ECH-Associated Protein 1 (Keap1), which sequesters Nrf2 in the cytosol and facilitates its ubiquitination and proteasomal degradation (Itoh et al. 1999). However, under conditions of oxidative stress, this degradation is hindered and Nrf2 translocates to the nucleus where it forms a heterodimer with small masculoaponeurotic fibrosarcoma proteins (Kobayashi et al. 2004). This interaction in turn facilitates the binding of Nrf2 to the ARE of ~200 Nrf2-regulated genes (Kobayashi and Yamamoto 2006; Chorley et al. 2012), including those involved in GSH synthesis as indicated above. Indeed, Nrf2 knockout mice show decreased GCLc expression and low GSH levels, which enhances acetaminophen-induced liver injury (Chan et al. 2001). Furthermore, a decline in the transcriptional activity of Nrf2 has been found to cause age-related loss of GSH synthesis in liver (Suh et al. 2004).
This study investigates the possible mechanism(s) underlying GSH deficiency in the mouse spinal cord during the course of MOG35–55 peptide-induced EAE. The results show that GSH loss in EAE coincides temporally with a reduction in the amount of GCLc as well as reductions in GSS, xCT and γ-GT. Low levels of three of these enzymes are a consequence of reduced mRNA expression, which correlates with diminished concentration of Nrf2. Interestingly, the decline in Nrf2 expression does not seem to be caused by its increased degradation via Keap1-dependent or Keap-independent mechanisms, or by reduced levels of the Nrf2 transcript, suggesting that translation of this important transcription factor and/or other still unidentified post-translational processes may be altered in EAE.
Materials and Methods
Induction of experimental autoimmune encephalomyelitis
Housing and handling of the animals as well as the euthanasia procedure were in strict accordance with the NIH Guide for the Care and Use of Laboratory Animals, and approved by the Institutional Animal Care and Use Committee. Eight-week-old female C57BL/6 mice were purchased from Harlan Bioproducts (Indianapolis, IN) and housed in the UNM-animal resource facility. To induce EAE, animals received a subcutaneous injection into the lower back area of 200µl of MOG35–55 peptide (200µg) (21st Century Biochemicals; Marlborough, MA) in saline mixed with complete Freund's adjuvant (CFA) supplemented with 4 mg/ml of heat killed Mycobacterium tuberculosis H37Ra (Chondrex Inc; Redmond, WA). Control animals were given CFA without MOG peptide. Two-hours and 48h after EAE induction, all animals received an i.p. injection of 0.3 µg of pertussis toxin (List Biological Laboratories; Campbell, CA) in 100 µl of saline. Seven days after disease induction mice received a second immunization with MOG35–55 peptide in CFA. Animals were weighed and examined daily for the presence of neurological signs. At prescribed days post-immunization (dpi), EAE mice and CFA-injected controls were euthanized by decapitation. The spinal cord was removed and homogenized in PEN buffer (20 mM sodium phosphate, pH 7.5, 1 mM EDTA, and 0.1 mM neocuproine) containing 2 mM 4,5 dihydroxy-1,3 benzene disulfonic acid, 1 mM dithiothreitol (DTT), protease inhibitor cocktail 1 (RPI, Mount Prospect, IL) and phosphatase inhibitor cocktail 3 (RPI). DTT was omitted from the solutions when samples were prepared for the enzymatic determination of GSH. Protein homogenates were stored at −80°C until use. Protein concentration was assessed with the Bio-Rad DC™ protein assay (Bio-Rad Laboratories; Hercules, CA) using bovine serum albumin (BSA) as standard.
Enzymatic determination of total GSH
GSH levels were determined using the enzymatic recycling method (Shaik and Mehvar 2006). Briefly, proteins from spinal cord homogenates were precipitated with 1% sulfosalicylic acid and removed by centrifugation at 10,000g for 15min. Aliquots of the supernatant were then incubated with 0.4 U/ml glutathione reductase, 0.2 mM NADPH, and 0.2 mM 5,5’-dithiobis-(2-nitrobenzoic acid) in 1ml of 0.2 M sodium phosphate buffer pH 7.5 containing 5 mM EDTA. The rate of appearance of the thionitrobenzoate anion was measured spectrophotometrically at 412 nm. [GSH] was calculated by interpolation on a curve made with increasing concentrations of GSSG (0.1–10 nmol). The specificity of the assay was determined using several glutathione derivatives including glutathione cysteine disulfide (GSSC; Cayman; Ann Arbor, MI), S-lactoylglutathione (Sigma-Aldrich, St. Louis, MO), S-hexylglutathione (Sigma-Aldrich), and S-nitrosoglutathione (GSNO), which was synthesized as described previously (Romero and Bizzozero 2009).
Immunodot blot determination of total GSH-containing compounds
Aliquots of the total spinal cord homogenates (5µg protein) prepared in the presence of DTT were incubated with 0.15% w/v glutaraldehyde for 30 min at room temperature. Cross-linking reaction was stopped by the addition of 1 M Tris-HCl buffer pH 7.5. Samples were loaded onto nitrocellulose membranes using a 96-well dot blot apparatus (Topac; Cohasset, MA), and were developed in the same manner as regular western blots (see below) using an anti-GSH antibody (polyclonal; 1:20,000; EMD Millipore; Temecula, CA) as primary antibody. The ability of this assay to also detect GSH thioethers was proved using S- hexylglutathione cross-linked to BSA.
Western blot analysis of spinal cord proteins
Proteins (5 µg) from spinal cord homogenates were separated by sodium dodecyl sulfate (SDS)-polyacrylamide gel electrophoresis on 12% gels and blotted to polyvinylidene difluoride membranes. Blots were then incubated overnight at 4°C with antibodies against Nrf2 (polyclonal; 1:4,000; Thermo-Fisher Scientific; Waltham, MA), Keap1 (polyclonal; 1:2,000; Abcam; Cambridge, MA), cullin-3 (monoclonal; 1:2000; Sigma), xCT (polyclonal; 1:2000; Abcam), GSS (polyclonal; 1:1,000; Abcam), γ-GT (monoclonal; 1:2,000; Abcam), GCLc (polyclonal; 1:500; Abcam), GAPDH (monoclonal; 1:2,000; Santa Cruz Biotechnology; Santa Cruz, CA), GSK-3β (monoclonal; 1:2000; Cell Signaling; Danvers, MA), phospho-GSK-3β (S9) (monoclonal; 1:2000; Cell Signaling) and phospho-GSK-3β (Y216) (polyclonal; 1:2000; Abcam). Membranes were rinsed three times in phosphate-buffered saline solution containing 0.05% v/v Tween-20 and incubated for 2 h with horseradish peroxidase conjugated-conjugated anti-mouse antibody (1:2,000; Sigma-Aldrich) or anti-rabbit antibody (1:2,000; Sigma-Aldrich). Blots were developed by enhanced chemiluminescence (ECL) using the Western Lightning ECL™ kit from Perkin-Elmer (Boston, MA). Films were scanned in a Hewlett Packard Scanjet 4890 and the images were quantified using the NIH Image 1.63 imaging analysis program. Band intensities were normalized by the intensity of commassie brilliant blue (CBB) staining or by the amount of GAPDH in the corresponding lanes as indicated in the legend to the figures.
Separation of nuclear and cytoplasmic fractions
Preparation of the nuclear and cytoplasmic fractions was carried out using the nuclear extraction protocol developed by Thermo-Fisher Scientific. Briefly, small spinal cord sections were homogenized at 4°C in 0.5ml of hypotonic buffer solution (20mM Tris-HCl pH 7.5 containing 10mM NaCl, 3mM MgCl2, 1mM DTT, 1mM PMSF and 1× protease inhibitor cocktail) using a glass/teflon Dounce tissue homogenizer (20 up/down strokes). Suspensions were kept on ice for 15min, mixed with 25µl of 10% w/v Nonidet P-40, and centrifuged at 3,000 g for 10min. The supernatant (cytoplasmic fraction) was removed and the pellet (nuclear fraction) was solubilized in SDS-sample buffer. The amount of Nrf2 in both cell fractions was determined by western blot analysis as described above. The purity of each fraction was assessed with antibodies against the cytoplasmic marker GAPDH and the nuclear marker histone deacetylase 2 (HDAC2; monoclonal, 1:2000; Millipore).
Reverse transcription and qPCR
RNA was isolated from spinal cord sections via standard Trizol® (Invitrogen; Carlsbad, CA) extraction followed by ethanol precipitation. Starting with 20ng of purified RNA, cDNA was prepared using the SuperScript II First-Strand Synthesis system (Life Technologies; Carlsbad, CA) and quantified using Power SYBR Green PCR Master Mix (Life Technologies) with primers against selected targets made by Integrated DNA Technologies (Coralville, IA) (Table S1). Relative expression was determined using the comparative 2−ΔCt method (Livak and Schmittgen 2001) and levels were normalized to the geometric mean of 4 reference genes (Gapdh, Hprt1, Rplp0 and Rn18s) (Vandesompele et al. 2002)
Statistical Analysis
Results were analyzed for statistical significance with the unpaired Student’s t-test or with ANOVA utilizing GraphPad Prism® program (GraphPad Software Inc.; San Diego, CA).
Results
EAE in female C57BL/6 mice was induced by active immunization with MOG35–55 peptide as described under “Materials and Methods”. Symptoms were graded according to the following scale: 0, no symptoms; 1, tail weakness; 1.5, clumsy gait; 2, hind limb paresis; 2.5, partial hind limb dragging; 3, hind limb paralysis; 3.5, hind limb paralysis with fore limb paresis; 4, complete paralysis; and 5, moribund. In this EAE model, neurological symptoms as well as spinal cord pathology begin at 14 dpi (7 days after the boost with MOG peptide) and most animals remain ill (score 2.5–3.5) throughout the entire experimental period (60 dpi) (Fig. 1a). CFA-injected animals (i.e. controls), which were sacrificed at various dpi, did not exhibit any neurological sign or spinal cord damage. A total of 80 mice (35 control and 45 EAE animals) were used in this study.
Fig. 1.
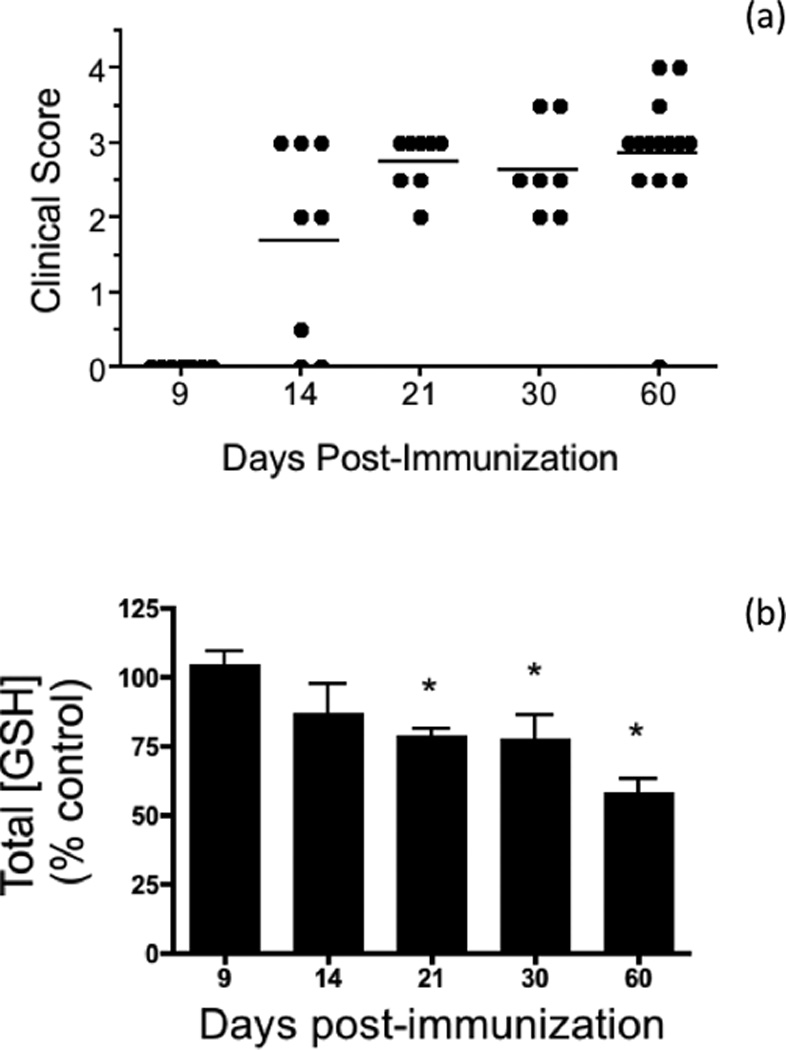
Spinal cord total GSH levels decrease during the course of EAE. (a) Clinical scores of the EAE animals used in this study. EAE was induced in C57BL/6 female mice by active immunization with MOG35–55 peptide in CFA as described under “Materials and Methods”. Animals were monitored daily for signs of clinical disease and scored as indicated in the text. Dots represent the final clinical score of each of the 45 EAE mice used in the study. (b) Relative levels of total GSH in the EAE spinal cord at different times post-immunization. Aliquots of spinal cord homogenates from control and EAE mice were used to determine total GSH levels as described in “Materials and Methods”. Values represent the mean ± SEM of 4–10 animals in each experimental group. Asterisks denote values that are statistically different (p<0.05) from their respective controls.
The total amount of GSH is decreased in EAE spinal cord
Levels of total glutathione in the spinal cord at different dpi were determined by the enzymatic recycling method, which measures free GSH and GSSG (Fig. S1). As shown in Fig. 1b, the amount of total GSH in EAE relative to control decreases steadily starting at 14 dpi and reaches a maximum at 60 dpi. These data indicate that the CNS of the affected animals is indeed subjected to considerable oxidative stress. Moreover, there is a strong negative correlation between GSH levels and clinical scores, suggesting a role of GSH depletion in the pathogenesis of the disease. It is important to note that GSH thioethers, GSH thioesters, GSNO, and GSH mixed disulfides are not measured with the above method (Fig. S1). While the concentration of these various GSH adducts in normal tissues is very low as compared to those of free GSH and GSSG, we thought of the possibility that this may not be the case in the diseased spinal cord. To address this issue, we measured the total amount of GSH-containing compounds in control and EAE spinal cords by dot blot analysis using anti-GSH antibodies (Fig. 2). This antibody reacts equally well with GSH and the thioether model compound S-hexyl glutathione (Fig. 2c). The ability of this assay to determine GSNO, GSSC, S-glutathionylated proteins, and GSH thioesters was not investigated since the samples were pretreated with the sulfhydryl reagent DTT, which converts all of these derivatives into free GSH (Bizzozero and Zheng 2009; Cheng et al. 2005; Bizzozero 1995). As depicted in Fig. 2a,b, EAE spinal cord at 21 dpi contains ~50% of total glutathione as compared to CFA-injected controls. Thus, it is fair to conclude that the amount of GSH plus other GSH-containing compounds, which may have formed as the result of oxidative, carbonyl and nitrosative stress, is significantly reduced in EAE and likely due to decreased biosynthesis of the tripeptide.
Fig. 2.
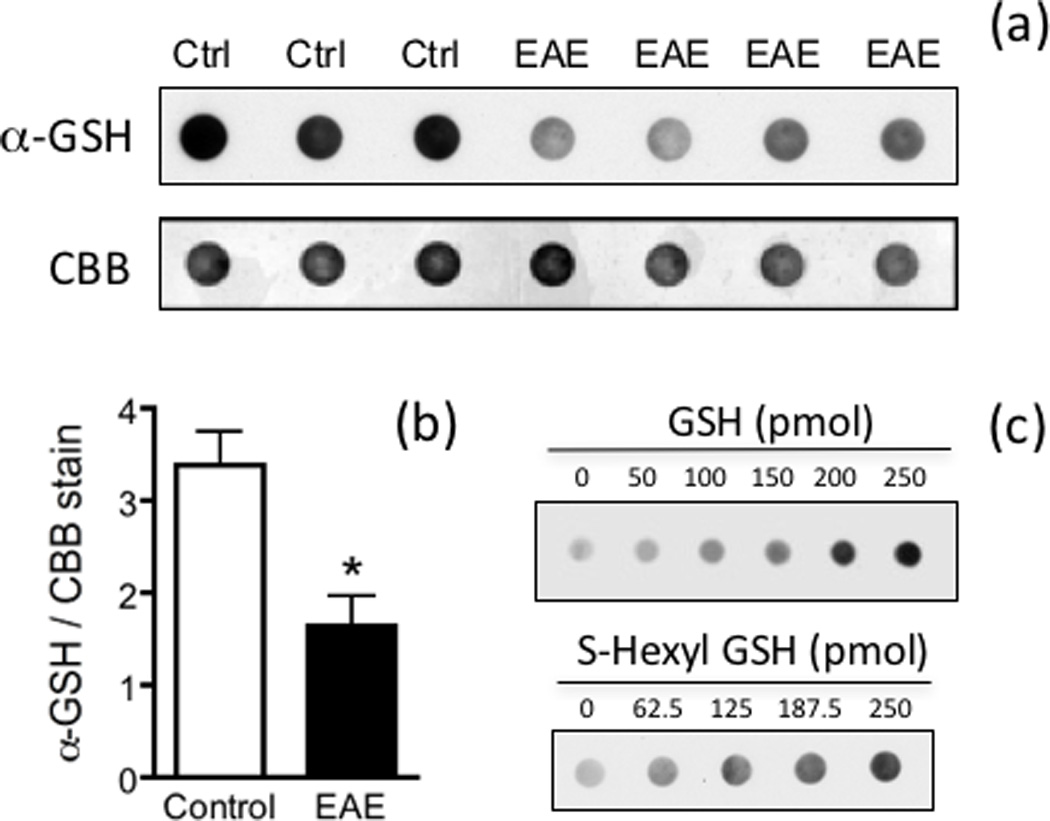
Immunodot blot analysis confirms the decline in the total amount of GSH in EAE. (a) Spinal cord protein homogenates from control and EAE mice at 21 dpi were treated with glutaraldehyde to cross-link glutathione derivatives to the proteins and were loaded on nitrocellulose membranes. Blots were developed with anti-GSH antibody as described in “Materials and Methods”. Membranes were also stained with coomassie brilliant blue (CBB) to assess the relative amount of protein. (b) The intensity of anti-GSH stained spots was divided by that of CBB. Values represent the mean ± SEM of 3 control and 4 EAE animals. Asterisk, statistically different (p<0.05) from control. (c) Increasing amounts of free GSH and S-hexyl GSH were cross-linked to 5µg of BSA, loaded on nitrocellulose membranes and developed with anti-GSH antibodies as above.
Levels of GSH-synthesizing enzymes are also reduced in EAE spinal cord
To gain insight into the cause(s) underlying reduced GSH levels in the spinal cord of EAE mice, the amount of GCLc and GSS were measured by western blot analysis and expressed relative to that of the housekeeping enzyme GAPDH (Fig. 3). Just like the concentration of total GSH, the amount of the rate-limiting enzyme GCLc diminishes progressively starting at 14 dpi, reaching the lowest levels between 30 dpi and 60 dpi (Fig. 3c). Mean values for GSS are also reduced but from 9 dpi onwards (Fig. 3d). It is worth noting that the intensity of GAPDH in the western blots relative to that of CBB stained lane in EAE is similar to those in controls (Fig. S2). Thus, the fall in the amount of GSH synthesizing enzymes relative to GAPDH is not due to an increase in the concentration of the latter during the course of the disease. The decline in the amount of these enzymes in EAE appears to be caused by decreased gene expression, since GCLc and GSS mRNA levels, as determined by qPCR, are also reduced (Fig. 3a,b). Similar results were found for γ-GT and xCT, the two enzymes responsible for providing cysteine for GSH synthesis. As shown in Fig. 4, there is a reduction in γ-GT and xCT protein levels in EAE (panels c, d). Representative western blots of these 2 enzymes as well as of GCLc and GSS are shown in Fig. S3. Relative γ-GT mRNA levels are diminished in EAE (panel a) while those of xCT increase from 9 dpi to 21 dpi and decline thereafter (panel b). As depicted in Fig. 5, gene expression of other enzymes involved in GSH metabolism in EAE at 21 dpi are either unchanged (GPx2, GSTP1 and GR) or reduced (GSTM1).
Fig. 3.
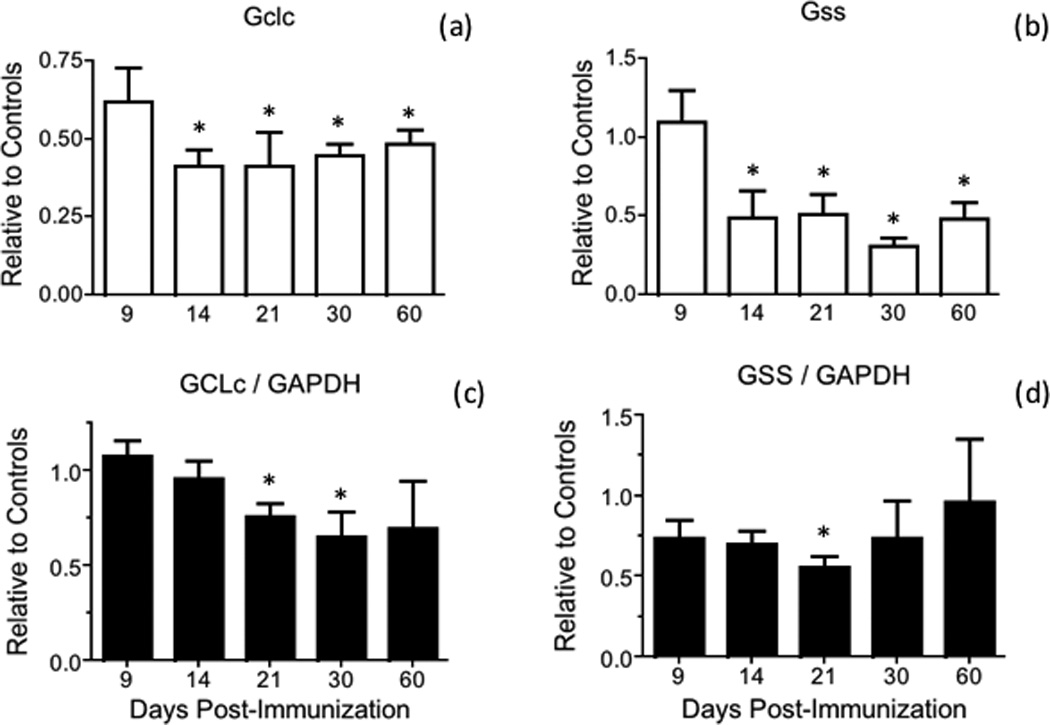
GCLc and GSS mRNA and protein levels are reduced during the course of EAE. (a, b) GCLc (Gclc) and GSS (Gss) mRNA levels in the spinal cord of control and EAE mice were determined by qPCR using the primers shown in Table S1 and are expressed relative to the geometric mean of 4 reference genes as described in “Materials and Methods”. Values represent the mean ± SEM of 3–8 animals per experimental group. (c, d) GCLc and GSS protein levels in the spinal cord of control and EAE mice were determined by western blot analysis as described under “Materials and Methods” and are expressed relative to those of GAPDH. Values represent the mean ± SEM of 3–7 animals per experimental group. Asterisks denote values that are statistically different (p<0.05) from their respective controls.
Fig. 4.
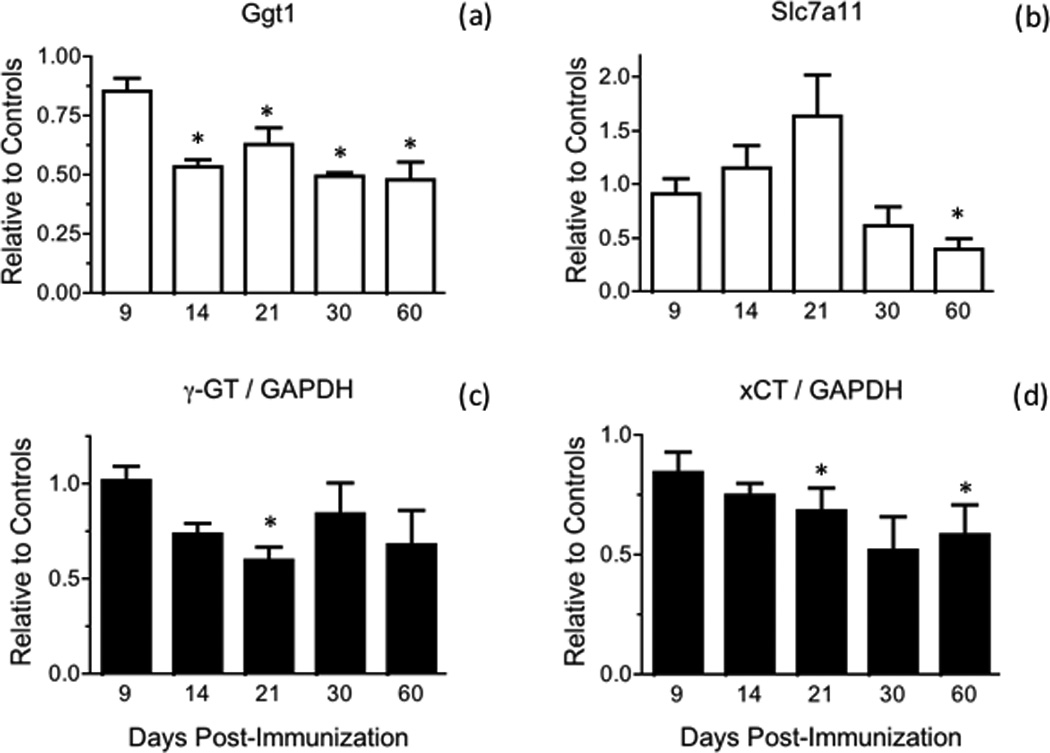
γ-GT and xCT mRNA and protein levels are diminished during the course of EAE. (a, b) γ-GT (Ggt1) and xCT (Slc7a11) mRNA levels in the spinal cord of control and EAE mice were determined by qPCR using the primers shown in Table S1 and are expressed relative to the geometric mean of 4 reference genes as described in “Materials and Methods”. Values represent the mean ± SEM of 3–8 animals per experimental group. (c, d) γ-GT and xCT protein levels in the spinal cord of control and EAE mice were determined by western blot analysis as described under “Materials and Methods” and are expressed relative to those of GAPDH. Values represent the mean ± SEM of 3–7 animals per experimental group. Asterisks denote values that are statistically different (p<0.05) from their respective controls.
Fig. 5.

mRNA levels of several enzymes involved in GSH metabolism not augmented in EAE. mRNA levels corresponding to GPx2 (Gpx2), GR (Gsr), GSTM1 (Gstm1) and GSTP1 (Gstp1) in the spinal cord of control and EAE mice at 21 dpi were determined by qPCR using the primers shown in Table S1 and are expressed relative to the geometric mean of 4 reference genes as described in “Materials and Methods”. Values represent the mean ± SEM of 3–4 animals per experimental group. Asterisk denotes the only value that is statistically different (p<0.05) from its respective control.
Failure to mount a strong antioxidant response in EAE is likely due to low Nrf2 levels
Since Nrf2 plays a central role in regulating GCLc and GSS gene transcription, we investigated whether its levels are adversely affected during the course of EAE (Fig. 6). Western blot assays showed that spinal cord Nrf2 levels decline in EAE relative to control mice (panel b). Reduction in Nrf2 protein expression is variable and ranges between 13% and 45% depending on the age. Interestingly, low Nrf2 protein levels in EAE are not due to a drop in the amount of Nrf2 mRNA, which instead slightly increases in the diseased tissue from 14 dpi to 30 dpi (panel a). This suggests that abnormal translational and/or post-translational processes are at play in EAE that reduce Nrf2 protein expression and function.
Fig. 6.
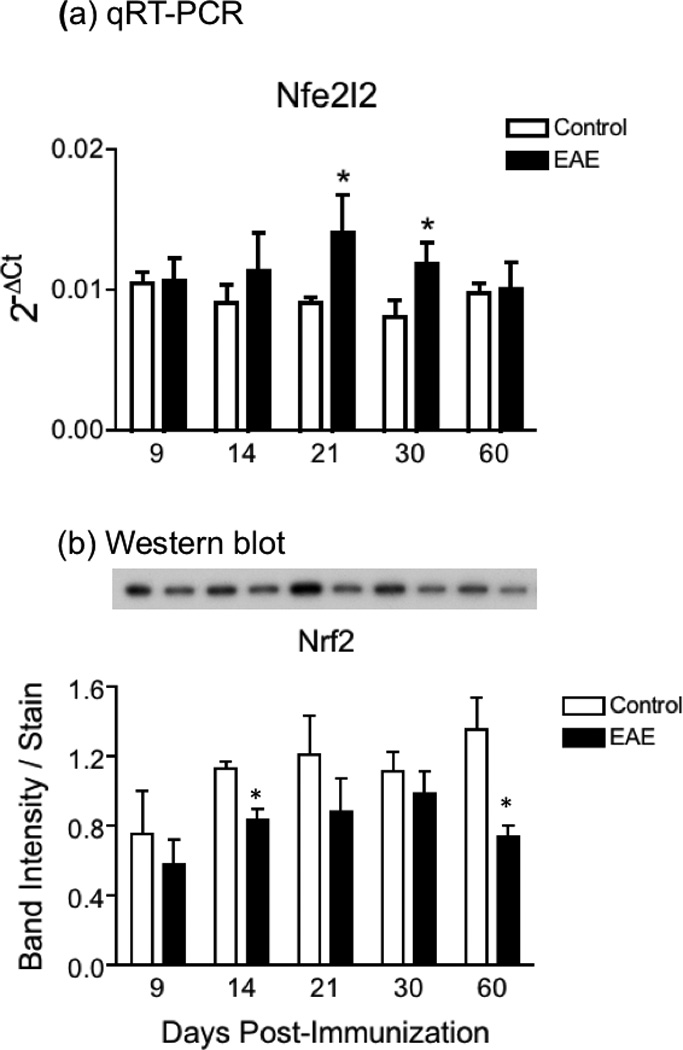
Increased Nrf2 mRNA expression and decreased Nrf2 protein levels in EAE. (a) Nrf2 mRNA levels in the spinal cord of control and EAE mice were determined by qPCR using the primers shown in Table S1 and are expressed relative to the geometric mean of 4 reference genes as described in “Materials and Methods”. Values represent the mean ± SEM of 4–8 animals per experimental group. (b) Nrf2 protein levels in the spinal cord of control and EAE mice were determined by western blot analysis as described under “Materials and Methods”, and were normalized by the amount of coomassie blue stain in the same gel lane. Values represent the mean ± SEM of 3–4 animals per experimental group. Asterisks denote values that are statistically different (p<0.05) from their respective controls. Inset panel shows a representative western blot.
Cell fractionation and analysis of nuclear and cytosolic extracts prepared from spinal cords of control and diseased mice at 21 dpi revealed that Nrf2 levels in the cytosol and nucleus are reduced in EAE by 39% and 90%, respectively (Fig. 7). These results indicate that there is not only less total Nrf2 in EAE spinal cord but also an impaired nuclear translocation of this transcription factor.
Fig. 7.
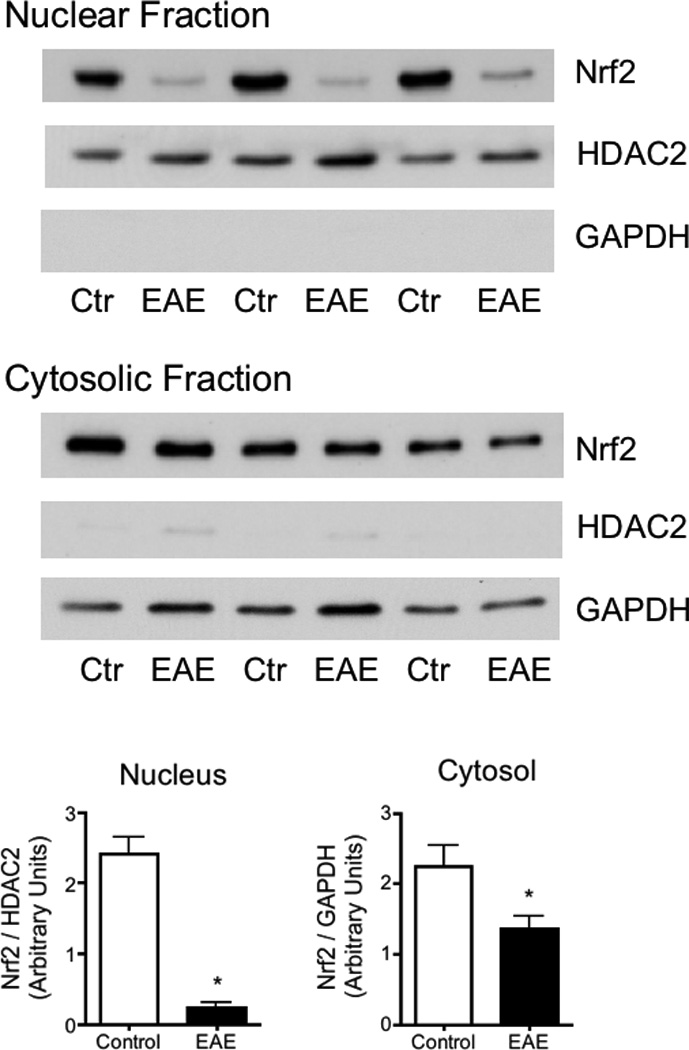
Nuclear Nrf2 levels are greatly diminished in EAE. Nuclear and cytosolic fractions from the spinal cord of control and EAE mice at 21dpi were prepared as described in “Materials and Methods”. Nrf2 levels in each fraction were determined by western blot analysis. Membranes were also probed for HDAC2 and GAPDH, which serve as nuclear and cytosolic markers, respectively. Values represent the mean ± SEM of 3 animals per experimental group. Asterisks denote values that are statistically different (p<0.05) from controls.
Reduced Nrf2 levels in EAE are not due to increased levels of Keap1 or Cullin-3
We next explored whether low levels of Nrf2 in EAE are caused by an increase in the amount of Keap1, which directs the transcription factor for proteasomal degradation (Itoh et al. 1999). As shown in Fig. 8a, Keap1 protein levels are unaffected during the course of the disease. We also investigated the possibility that cullin-3, a protein that brings together Keap1/Nrf2 complex and the ubiquitin ligase (E3) (Keum and Choi 2014), might be elevated in EAE. However, we found that the amount of cullin-3 at 21 dpi is significantly lower, not higher, in EAE than in control spinal cords (Fig. 8b).
Fig. 8.
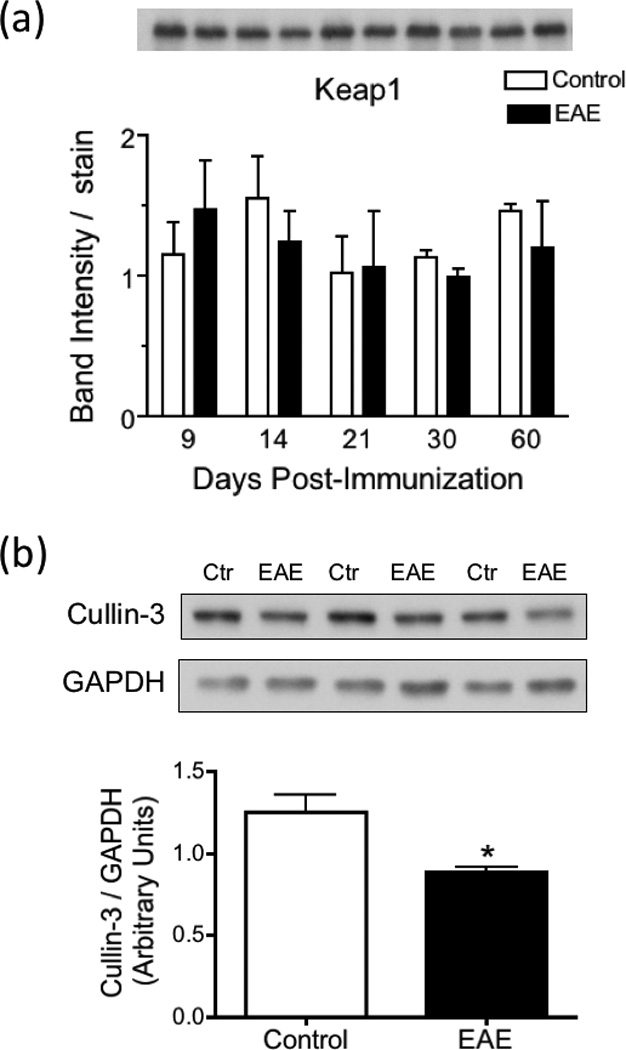
Keap1 levels are unaltered while the concentration of Cullin-3 is decreased in EAE. (a) Keap1 protein levels in the spinal cord of control and EAE mice were determined by western blot analysis as described under “Materials and Methods”, and were normalized by the amount of coomassie blue stain in the same gel lane. Values represent the mean ± SEM of 3 animals per experimental group. Inset panel shows a representative western blot. (b) Cullin-3 levels in the spinal cord of control and EAE mice at 21 dpi were determined by western blot analysis as described under “Materials and Methods” and are expressed relative to those of GAPDH. Values represent the mean ± SEM of 3 animals per group. Asterisks denote values that are statistically different (p<0.05) from control.
Low Nrf2 levels in EAE are not caused by increased GSK-3β activity
Glycogen synthetase kinase-3β (GSK-3β) has been shown to increase the degradation of Nrf2 by various mechanisms (Jain and Jaiswal 2007, Bryan et al. 2013). GSK-3β is inactivated by phosphorylation of serine-9 (S9) and activated by phosphorylation of tyrosine-216 (Y216). Thus, we used site-specific anti-phosphopeptide antibodies to assess whether GSK-3β activity is augmented in EAE. While levels of GSK-3β in the spinal cord of control and EAE mice at 21 dpi are similar (Fig. 9a,b), the amount of the active phospho-GSK-3β (Y216) is reduced by 51% in EAE (Fig. 9d). Furthermore, the amount of inactive phospho-GSK-3β (S9) does not change in EAE (Fig.9c). Together, these data strongly suggest that changes in Nrf2 levels in this disease are not the result of increased GSK-3β activity.
Fig. 9.
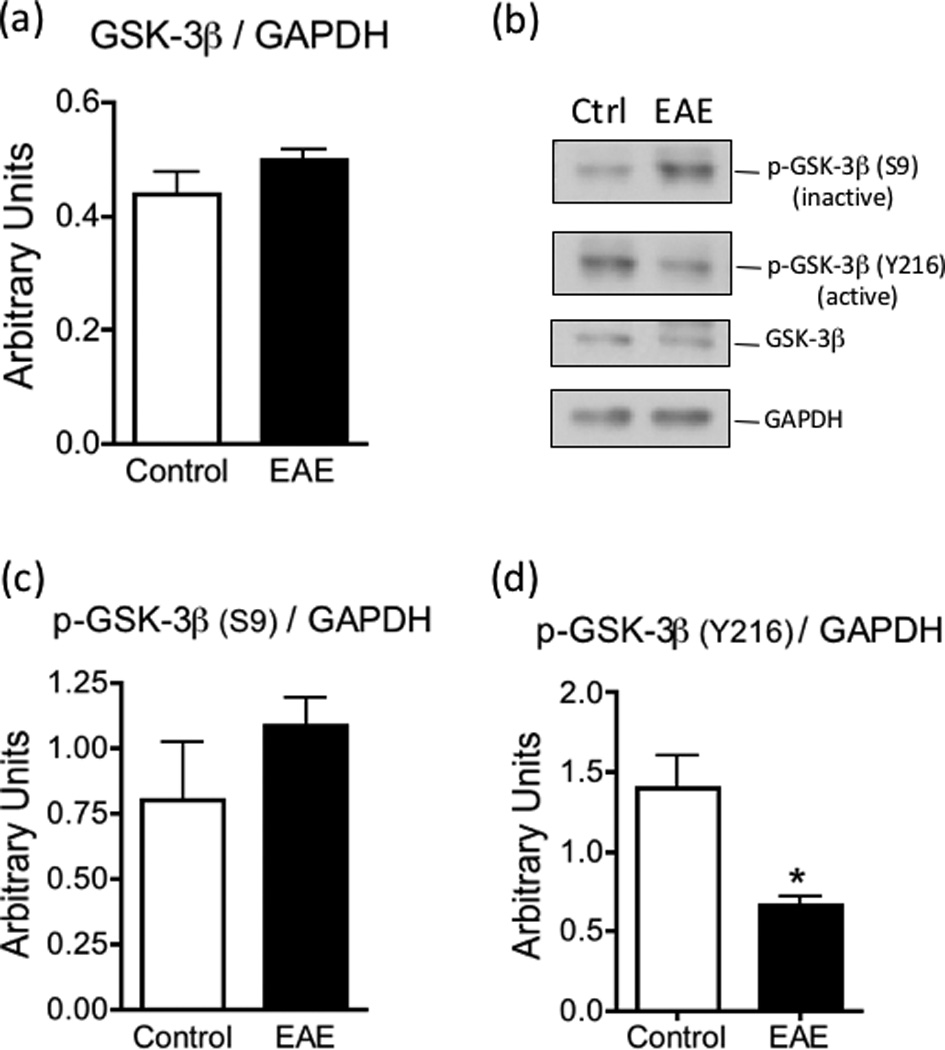
GSK-3β activity is reduced in EAE. The levels of GSK-3β (panel a), phospho-GSK-3β (S9) (panel c) and phospho-GSK-3β (Y216) (panel d) in the spinal cord of control and EAE mice at 21 dpi were determined by western blot analysis as described under “Materials and Methods” and were normalized by the amount of GAPDH same gel lane. Values represent the mean ± SEM of 3–4 animals per experimental group. Asterisk denotes the value that is statistically different (p<0.05) from the control. Panel b shows representative western blots.
Discussion
This study started by investigating the possible mechanism(s) underlying GSH reduction in EAE. The research focused on the spinal cord since this CNS region is affected in MS (Kearney et al. 2015) and in MOG35–55 peptide-induced EAE (Kuerten et al. 2007). We first demonstrated that the total amount of GSH is significantly reduced in EAE, a finding that was then confirmed with a novel immunodot technique developed for this study. This validation was important since the commonly used enzymatic recycling method measures GSH plus GSSG but not the various GSH adducts that may have formed in EAE. For instance, lipid peroxidation leads to the formation of various α,β-unsaturated aldehydes such as acrolein (Leung et al. 2011) and 4-hydroxynonenal (Dasgupta et al. 2013), which have been detected in the spinal cord of EAE mice and which can react with GSH forming the respective thioethers. Similarly, there is a substantial amount of nitrosative stress and protein S-nitrosylation in the EAE spinal cord (Bizzozero and Zheng 2009) and is very likely that the NO-donor GSNO may have formed (Romero and Bizzozero 2006). Moreover, S-glutathionylated proteins may be present in EAE as they can be also formed by reaction with GSNO (Mohr et al. 1999).
We next showed that the levels of the four enzymes that normally maintain high steady-state levels of GSH (GCL, GSS, xCT and γ-GT) are decreased in EAE. Moreover, the decline in the amount of the rate-limiting enzyme GCL in EAE correlates with that of GSH both temporally and in magnitude. While the reduction in GCL could account entirely for the fall in the amount of the antioxidant tripeptide, additional contributing factors cannot be completely ruled out. For example, it has been suggested that high glutamate levels in the extracellular milieu as a consequence of excitotoxicity could also contribute to reduced GSH synthesis (Schubert and Piasecki, 2001). Indeed, the uptake of cystine is lower in glutamate-treated than in untreated cultured neurons leading to severe oxidative stress (Murphy et al. 1989). However, to the best of our knowledge, there is no evidence of global and persistent glutamate excitotoxicity or that the extracellular concentration of cystine in the CNS is increased in EAE.
In this study we suggest that Nrf2 dysregulation is behind the low expression of GSH synthesizing enzymes in EAE. However, although the Nrf2-dependent ARE is considered to be the principal regulator of GCL and GSS expression, the 5’ promoter regions of these genes also contains multiple binding sites for other transcription factors including NF-κB, SP-1, activator protein-1 and -2, and metal response element (Suh et al. 2004). Moreover, decreased expression of other members of the cap’n’collar family of transcription factors that also respond to oxidative stress, such as nuclear factor erythroid 2 like 1 (Nrf1), nuclear factor erythroid 2 like 3 (Nrf3) and transcription factor 11, might also contribute to reduced mRNA levels of these enzymes (Bugno et al. 2015). The lack of a decrease in xCT mRNA expression in EAE was surprising since this gene is an Nrf2 target as well (Sasaki et al. 2002). Yet, a recent study in cultured astrocytes showed that xCT protein and mRNA expression are induced only when GSH levels decrease and not by oxidative stress per se (Seib et al. 2011). A similar situation probably occurs with GR, GPx2 and GSTP1, which are also Nrf2 targets and whose mRNA levels are unchanged in EAE.
The most important finding of this study is the discovery that Nrf2 protein levels are diminished in EAE. While the amount of Nrf2 is low in both the cytosolic and nuclear fraction, the decrease in the latter is incredibly large (~90%) suggesting that nuclear transport of this transcription factor is also affected. Nrf2 dysfunction indicates that the expression of many antioxidant and neuroprotective genes is severely affected in EAE and may have major pathophysiological consequences. Furthermore, since Nrf2 is known to antagonize NF-κB (Chen et al. 2006; Jin et al. 2008), Nrf2 deficiency can exacerbate the production of pro-inflammatory mediators. In this study we also found that the amount of Nrf2 mRNA was mildly elevated during the course of EAE, indicating that only translational and/or post-translational processes that control Nrf2 function are altered in this disease. A diagram depicting the post-translational mechanisms regulating Nrf2 expression is shown in Fig. S4. Under normal conditions the levels of the Nrf2 protein in the cell are kept very low by its inhibitor (Keap1), which sequesters Nrf2 in the cytosol and facilitates its ubiquitination and proteasomal degradation (Itoh et al. 1999). Herein, we have shown that the levels of Keap1 and the adaptor protein cullin-3 are not elevated in in EAE, suggesting that the major Nrf2 clearance mechanism is not activated. A number of proteins including the autophagy substrate p62 (Komatsu et al. 2010), phosphoglycerate mutase 5 (Lo and Hannink 2008), protein deglycase DJ-1 (Clements et al. 2006) and p53-regulated p21 (Chen et al. 2009) are known to interact with Keap1 and disrupt Nrf2/Keap1 binding resulting in a persistent activation of Nrf2. Therefore, we cannot not rule out the possibility that the levels of one or more of these proteins in EAE might be low, which could free up Keap1 to interact with Nrf2 and trigger its degradation. Besides the above proteins, Nrf2/Keap1 association can be directly regulated by phosphorylation of several serine/threonine residues in Nrf2 by p38 mitogen-activated protein kinase (Keum et al. 2006), which then promotes its association with Keap1 increasing Nrf2 degradation.
Recently, it has been shown that Nrf2 can also be removed by proteasomal degradation in a Keap1-independent manner (Bryan et al. 2013). Glycogen synthetase kinase-3β (GSK-3β) can phosphorylate Nrf2 in the Neh6 region (Rada et al. 2011), and this facilitates Nrf2 ubiquitination by adaptor protein β-TrCP, which associates with cullin-1 to form a complete E3 ubiquitin ligase. In addition, GSK-3β acts upstream of Fyn kinase in the regulation of nuclear export and degradation of Nrf2 (Jain and Jaiswal 2007). GSK-3β activity is inhibited by phosphorylation of serine 9 (Fang et al. 2000) and activated by phosphorylation of tyrosine 216 (Bhat et al. 2000). Here, we show that the amount of inactive phospho-GSK-3β (S9) slightly increases in EAE while that of active phospho-GSK-3β (Y216) greatly decreases, suggesting that this important kinase is not responsible for low Nrf2 levels. We are currently exploring various translational and other post-translational processes that may be altered in EAE and contribute to Nrf2 dysregulation. Ultimately, it will be important to determine whether inflammation or chronic oxidative stress is the major trigger for the impaired Nrf2 homeostasis in this demyelinating disorder. Interestingly, GCL mRNA levels decrease in astrocytes treated with LPS/IFN-γ, which would imply that pro-inflammatory cytokines cause Nrf2 dysfunction (Lin et al. 2011). In contrast, Nrf2 levels in cultured microglia rise significantly after LPS treatment (Terazawa et al. 2013), suggesting that inflammatory cues affect distinct cells differently. Thus, our next step will be to identify the CNS cells where Nrf2 dysregulation takes place. Nevertheless, the magnitude of Nrf2 impairment in the whole spinal cord of EAE mice and the profound decrease in GSH indicate that these pathological phenomena are widespread, affecting many cell types.
Nrf2 knockout mice are viable and grow normally but exhibit increased susceptibility to a broad range of chemicals and disease conditions that are linked to oxidative pathology (Ma 2013), demonstrating the importance of this transcription factor in the maintenance of cellular homeostasis. Deletion of the Nrf2 gene increases the sensitivity of mice to MOG peptide-induced autoimmune encephalomyelitis (EAE), the same experimental model of MS that was used in our study (Johnson et al. 2010). Furthermore, fumaric acid esters (mono- and dimethyl fumarate), which are known to activate the Nrf2 pathway, have been shown to ameliorate EAE (Linker et al. 2011) and to display remarkable efficacy in lowering relapse rates of relapsing-remitting MS (Fox et al. 2012, Lee et al. 2013, Gold et al. 2015). However, these effects seem to be due mostly to inhibition of peripheral immune cell-driven inflammation rather than to neuroprotection (Ruggieri et al. 2014) since it is unlikely that these drugs, after being hydrolyzed to fumaric acid in the small intestine, can cross the blood brain barrier (Palmer 2013). Indeed, fumaric acid esters are not effective at preventing demyelination and neuronal damage in a non-inflammatory demyelinating model (Moharregh-Khiabani et al. 2010). Thus, finding ways to activate Nrf2 in the CNS could have additional beneficial effects on EAE and MS during the progressive, neurodegenerative (non-inflammatory) stages of the disease for which there is currently no treatment.
Supplementary Material
Acknowledgments
This work was supported by PHHS grants NS082805 and IMSD GM060201 from the National Institutes of Health.
Abbreviations
- CFA
complete Freund’s adjuvant
- EAE
experimental autoimmune encephalomyelitis
- GAPDH
glyceraldehyde 3-phosphate dehydrogenase
- GSH
glutathione
- GCL
γ-glutamylcysteine ligase
- GPx2
glutathione peroxidase 2
- GR
glutathione reductase
- GSK-3β
glycogen synthetase kinase-3β
- GSS
glutathione synthetase
- GST
glutathione S-transferase
- γ-GT
γ-glutamyl transpeptidase
- HDAC2
histone deacetylase 2
- Keap1
Kelch-Like ECH-Associated Protein 1
- MOG
myelin oligodendrocyte glycoprotein
- MS
multiple sclerosis
- Nrf2
nuclear factor (erythroid-derived 2)-like 2
- qPCR
quantitative polymerase chain reaction
- xCT
cystine/glutamate antiporter.
Footnotes
Disclosure/Conflict of Interest
The authors have no conflict of interest.
References
- Bhat RV, Shanley J, Correll MP, Fieles WE, Keith RA, Scott CW, Lee CM. Regulation and localization of tyrosine 216 phosphorylation of glycogen synthetase kinase-3beta in cellular and animal models of neuronal degeneration. Proc. Natl. Acad. Sci. USA. 2000;97:11074–11079. doi: 10.1073/pnas.190297597. [DOI] [PMC free article] [PubMed] [Google Scholar]
- Bizzozero OA. Chemical analysis of acylation sites and species. Meth. Enzymol. 1995;250:361–379. doi: 10.1016/0076-6879(95)50085-5. [DOI] [PubMed] [Google Scholar]
- Bizzozero OA, Zheng J. Identification of major S-nitrosylated proteins in murine experimental autoimmune encephalomyelitis. J. Neurosci. Res. 2009;87:2281–2289. doi: 10.1002/jnr.22113. [DOI] [PMC free article] [PubMed] [Google Scholar]
- Bridges RJ, Natale NR, Patel SA. System xc − cystine/glutamate antiporter: an update on molecular pharmacology and roles within the CNS. Br. J. Pharmacol. 2012;165:20–34. doi: 10.1111/j.1476-5381.2011.01480.x. [DOI] [PMC free article] [PubMed] [Google Scholar]
- Bryan HK, Olayanju A, Goldring CE, Park BK. The Nrf2 defence pathway: Keap1-dependent and –independent mechanism of regulation. Biochem. Pharmacol. 2013;85:750–717. doi: 10.1016/j.bcp.2012.11.016. [DOI] [PubMed] [Google Scholar]
- Bugno M, Daniel M, Chepelev NL, Wilmore WG. Changing gears in Nrf1 research, from mechanisms of regulation to its role in disease and prevention. Biochim. Biophys. Acta. 2015;1849:1260–1276. doi: 10.1016/j.bbagrm.2015.08.001. [DOI] [PubMed] [Google Scholar]
- Chan K, Han XD, Kan YW. An important function of Nrf2 in combating oxidative stress: Detoxification of acetaminophen. Proc. Nat. Acad. Sci. USA. 2001;98:4611–4616. doi: 10.1073/pnas.081082098. [DOI] [PMC free article] [PubMed] [Google Scholar]
- Chen XL, Dodd G, Thomas S, Zhang X, Wasserman MA, Rovin BH, Kunsc C. Activation of Nrf2/ARE pathway protects endothelial cells from oxidant injury and inhibits inflammatory gene expression. Am. J. Physiol. Heart Circ. Physiol. 2006;290:1862–1870. doi: 10.1152/ajpheart.00651.2005. [DOI] [PubMed] [Google Scholar]
- Chen W, Sun Z, Wang XJ, Jiang T, Huang Z, Fang D, Zhang DD. Direct interaction between Nrf2 and p21(Cip1/WAF1) upregulates the Nrf2-mediated antioxidant response. Mol. Cell. 2009;34:663–673. doi: 10.1016/j.molcel.2009.04.029. [DOI] [PMC free article] [PubMed] [Google Scholar]
- Cheng G, Ikeda Y, Iuchi Y, Fujii J. Detection of S-glutathionylated proteins by glutathione S-transferase overlay. Arch. Biochim. Biophys. 2005;435:42–49. doi: 10.1016/j.abb.2004.12.016. [DOI] [PubMed] [Google Scholar]
- Chorley BN, Campbell MR, Wang X, Karaca M, Sambandan D, Bangura F, Xue P, Pi J, Kleeberger SR, Bell DA. Identification of novel NRF2-regulated genes by ChIP-Seq: influence on retinoid X receptor alpha. Nucleic Acids Res. 2012;40:7416–7429. doi: 10.1093/nar/gks409. [DOI] [PMC free article] [PubMed] [Google Scholar]
- Clements CM, McNally RS, Conti BJ, Mak TW, Ting JP. DJ-1, a cancer- and Parkinson’s disease–associated protein, stabilizes the antioxidant transcriptional master regulator Nrf2. Proc. Natl. Acad. Sci. USA. 2006;103:15091–15096. doi: 10.1073/pnas.0607260103. [DOI] [PMC free article] [PubMed] [Google Scholar]
- Dasgupta A, Zheng J, Perrone-Bizzozero NI, Bizzozero OA. Increased carbonylation, protein aggregation and apoptosis in the spinal cord of mice with experimental autoimmune encephalomyelitis. ASN Neuro. 2013;5(2):art:e00111. doi: 10.1042/AN20120088. [DOI] [PMC free article] [PubMed] [Google Scholar]
- Fang X, Yu SX, Lu Y, Bast RC, Woodgett JR, Mills GB. Phosphorylation and inactivation of glycogen synthetase kinase 3 by protein kinase A. Proc. Natl. Acad. Sci. USA. 2000;97:11960–11965. doi: 10.1073/pnas.220413597. [DOI] [PMC free article] [PubMed] [Google Scholar]
- Fox RJ, Miller DH, Phillips JT, Hutchinson M, Havrdova E, Kita M, Raghupathi K, Novas M, Sweetser MT, Viglietta V, Dawson KT. CONFIRM Study Investigators. Placebo-controlled phase 3 study of oral BG-12 or glatiramer in multiple sclerosis. N. Engl. J. Med. 2012;367:1087–1097. doi: 10.1056/NEJMoa1206328. [DOI] [PubMed] [Google Scholar]
- Garcion E, Sindji L, Leblondel G, Brachet P, Darcy F. 1,25-Dihydroxyvitamin D3 regulates the synthesis of γ-glutamyl transpeptidase and glutathione levels in rat primary astrocytes. J. Neurochem. 1999;73:859–866. doi: 10.1046/j.1471-4159.1999.0730859.x. [DOI] [PubMed] [Google Scholar]
- Gilgun-Sherki Y, Melamed E, Offen D. The role of oxidative stress in the pathogenesis of multiple sclerosis: the need for effective antioxidant therapy. J. Neurol. 2004;251:261–268. doi: 10.1007/s00415-004-0348-9. [DOI] [PubMed] [Google Scholar]
- Gold R, Hartung HP, Toyka KV. Animal models for autoimmune demyelinating disorders of the nervous system. Mol. Med. Today. 2000;6:88–91. doi: 10.1016/s1357-4310(99)01639-1. [DOI] [PubMed] [Google Scholar]
- Gold R, Giovannoni G, Phillips JT, Fox RJ, Zhang A, Meltzer L, Kurukulasuriya NC. Efficacy and safety of delayed-release dimethyl fumarate in patients newly diagnosed with relapsing-remitting multiple sclerosis (RRMS) Mult. Scler. 2015;21:57–66. doi: 10.1177/1352458514537013. [DOI] [PMC free article] [PubMed] [Google Scholar]
- Itoh K, Wakabayashi N, Katoh Y, Ishii T, Igarashi K, Engel JD, Yamamoto M. Keap1 represses nuclear activation of antioxidant responsive elements by Nrf2 through binding to the amino-terminal Neh2 domain. Genes Dev. 1999;13:76–86. doi: 10.1101/gad.13.1.76. [DOI] [PMC free article] [PubMed] [Google Scholar]
- Jain AK, Jaiswal AK. GSK-3β acts upstream of Fyn kinase in regulation of nuclear export and degradation of NF-E2 related factor 2. J. Biol. Chem. 2007;282:16502–16510. doi: 10.1074/jbc.M611336200. [DOI] [PubMed] [Google Scholar]
- Jin W, Wang H, Yan W, Xu L, Wang X, Zhao X, Yang X, Chen G, Ji Y. Disruption of Nrf2 enhances upregulation of nuclear factor-kappaB activity, proinflammatory cytokines, and intercellular adhesion molecule-1 in the brain after traumatic brain injury. Mediators Inflamm. 2008;2008:1–7. doi: 10.1155/2008/725174. [DOI] [PMC free article] [PubMed] [Google Scholar]
- Johnson DA, Amirahmadi S, Ward C, Fabry Z, Johnson JA. The absence of the pro-antioxidant transcription factor Nrf2 exacerbates experimental autoimmune encephalomyelitis. Toxicol. Sci. 2010;114:237–246. doi: 10.1093/toxsci/kfp274. [DOI] [PMC free article] [PubMed] [Google Scholar]
- Kearney H, Miller DH, Ciccarelli O. Spinal cord MRI on multiple sclerosis – diagnostic, prognostic and clinical value. Nat. Rev. Neurol. 2015;11:327–338. doi: 10.1038/nrneurol.2015.80. [DOI] [PubMed] [Google Scholar]
- Keum YS, Choi BY. Molecular and chemical regulation of the Keap1-Nrf2 signaling pathway. Molecules. 2014;19:10074–10089. doi: 10.3390/molecules190710074. [DOI] [PMC free article] [PubMed] [Google Scholar]
- Keum YS, Yu S, Chang PP, Yuan X, Kim JH, Xu C, Han J, Agarwal A, Kong AN. Mechanism of action of sulforaphane: inhibition of p38 mitogen-activated protein kinase isoforms contributing to the induction of antioxidant response element-mediated heme oxygenase-1 in human hepatoma HepG2 cells. Cancer Res. 2006;66:8804–8813. doi: 10.1158/0008-5472.CAN-05-3513. [DOI] [PubMed] [Google Scholar]
- Kobayashi M, Yamamoto M. Nrf2-Keap1 regulation of cellular defense mechanisms against electrophiles and reactive oxygen species. Adv. Enzyme Regul. 2006;46:113–140. doi: 10.1016/j.advenzreg.2006.01.007. [DOI] [PubMed] [Google Scholar]
- Kobayashi A, Kang MI, Okawa H, Ohtsuji M, Zenke Y, Chiba T, Igarashi K, Yamamoto M. Oxidative stress sensor Keap1 functions as an adaptor for Cul3-based E3 ligase to regulate proteasomal degradation of Nrf2. Mol. Cell Biol. 2004;24:7130–7139. doi: 10.1128/MCB.24.16.7130-7139.2004. [DOI] [PMC free article] [PubMed] [Google Scholar]
- Komatsu M, Kurokawa H, Waguri S, Taguchi K, Kobayashi A. The selective autophagy substrate p62 activates the stress responsive transcription factor Nrf2 through inactivation of Keap1. Nat. Cell Biol. 2010;12:213–223. doi: 10.1038/ncb2021. [DOI] [PubMed] [Google Scholar]
- Kornek B, Lassmann H. Axonal pathology in multiple sclerosis: a historical note. Brain Pathol. 1999;9:651–656. doi: 10.1111/j.1750-3639.1999.tb00547.x. [DOI] [PMC free article] [PubMed] [Google Scholar]
- Kuerten S, Kostova-Bales DA, Frenzel LP, Tigno JT, Tary-Lehmann M, Angelov DN, Lehmann PV. MP4- and MOG:35–55-induced EAE in C57BL/6 mice differentially targets brain, spinal cord and cerebellum. J. Neuroimmunol. 2007;189:31–40. doi: 10.1016/j.jneuroim.2007.06.016. [DOI] [PMC free article] [PubMed] [Google Scholar]
- Lee TD, Yang HP, Whang J, Lu SC. Cloning and characterization of the human glutathione synthetase 5′-flanking region. Biochem. J. 2005;390:521–528. doi: 10.1042/BJ20050439. [DOI] [PMC free article] [PubMed] [Google Scholar]
- Lee DH, Stangel M, Gold R, Linker RA. The fumaric acid ester BG-12: A new option in MS therapy. Expert Rev. Neurother. 2013;13:951–958. doi: 10.1586/14737175.2013.814958. [DOI] [PubMed] [Google Scholar]
- Leung G, Sun W, Zheng L, Brookes S, Tully M, Shi R. Anti-acrolein treatment improves behavioral outcome and alleviates myelin damage in experimental autoimmune encephalomyelitis mouse. Neurosci. 2011;173:150–155. doi: 10.1016/j.neuroscience.2010.11.018. [DOI] [PMC free article] [PubMed] [Google Scholar]
- Lin SX, Lisi L, Dello Russo C, Polak PE, Sharp A, Weinberg G, Kalinin S, Feinstein DL. The anti-inflammatory effects of dimethyl fumarate in astrocytes involve glutathione and haem oxygenase-1. ASN Neuro. 2011;3:e00055. doi: 10.1042/AN20100033. [DOI] [PMC free article] [PubMed] [Google Scholar]
- Linker RA, Lee DH, Ryan S, vanDam AM, Conrad R, Bista P, Zheng W, Hronowski X, Buko A, Chollate S, Ellrichmann G, Brück W, Dawson K, Goelz S, Wiese S, Scannevin RH, Lukashev M, Gold R. Fumaric acid esters exert neuroprotective effect in neuroinflammation via activation of the Nrf2 antioxidant pathway. Brain. 2011;134:678–692. doi: 10.1093/brain/awq386. [DOI] [PubMed] [Google Scholar]
- Livak KJ, Schmittgen TD. Analysis of relative gene expression data using real-time quantitative PCR and the 2(−Delta Delta C(T)) method. Methods. 2001;25:402–408. doi: 10.1006/meth.2001.1262. [DOI] [PubMed] [Google Scholar]
- Lo SC, Hannink M. PGAM5 tethers a ternary complex containing Keap1 and Nrf2 to mitochondria. Exp. Cell Res. 2008;314:1789–1803. doi: 10.1016/j.yexcr.2008.02.014. [DOI] [PMC free article] [PubMed] [Google Scholar]
- Lu SC. Glutathione synthesis. Biochem. Biophys. Acta. 2013;1830:3143–3253. doi: 10.1016/j.bbagen.2012.09.008. [DOI] [PMC free article] [PubMed] [Google Scholar]
- Ma Q. The role of Nrf2 in oxidative stress and toxicity. Annu. Rev. Pharmacol. Toxicol. 2013;53:401–426. doi: 10.1146/annurev-pharmtox-011112-140320. [DOI] [PMC free article] [PubMed] [Google Scholar]
- Moharregh-Khiabani D, Blank A, Skripuletz T, Miller E, Kotsiari A, Gudi V, Stangel M. Effects of fumaric acids on cuprizone induced central nervous system de- and remyelination in the mouse. PLoS ONE. 2010;5:e11769. doi: 10.1371/journal.pone.0011769. [DOI] [PMC free article] [PubMed] [Google Scholar]
- Mohr S, Hallak H, DeBoite A, Lapetina EG, Brüne B. Nitric oxide-induced S-glutathionylation and inactivation of glyceraldehyde-3-phosphate dehydrogenase. J. Biol. Chem. 1999;274:9427–9430. doi: 10.1074/jbc.274.14.9427. [DOI] [PubMed] [Google Scholar]
- Murphy TH, Miyamoto M, Sastre A, Schnaar RL, Coyle JT. Glutamate toxicity in a neuronal cell line involves inhibition of cystine transport leading to oxidative stress. Neuron. 1989;2:1547–1558. doi: 10.1016/0896-6273(89)90043-3. [DOI] [PubMed] [Google Scholar]
- Palmer AM. Multiple sclerosis and the blood-central nervous system barrier. Cardiovasc. Psych. Neurol. 2013;13:1–10. doi: 10.1155/2013/530356. [DOI] [PMC free article] [PubMed] [Google Scholar]
- Rada P, Rojo AI, Chowdhry S, McMahon M, Hayes JD, Cuadrado A. SCF/β-TrCP promotes glycogen synthase kinase 3–dependent degradation of the Nrf2 transcription factor in a Keap1-independent manner. Mol. Cell. Biol. 2011;31:1121–1133. doi: 10.1128/MCB.01204-10. [DOI] [PMC free article] [PubMed] [Google Scholar]
- Reddy SP. The antioxidant response element and oxidative stress modifiers in airway diseases. Curr. Mol. Med. 2008;8:376–383. doi: 10.2174/156652408785160925. [DOI] [PMC free article] [PubMed] [Google Scholar]
- Romero JM, Bizzozero OA. Extracellular S-nitrosoglutathione, but not S-nitrosocysteine or N2O3, mediates protein S-nitrosation in rat spinal cord slices. J. Neurochem. 2006;99:1299–1310. doi: 10.1111/j.1471-4159.2006.04180.x. [DOI] [PubMed] [Google Scholar]
- Romero JM, Bizzozero OA. Intracellular glutathione mediates the denitrosylation of protein nitrosothiols in the rat spinal cord. J. Neurosci. Res. 2009;87:701–709. doi: 10.1002/jnr.21897. [DOI] [PMC free article] [PubMed] [Google Scholar]
- Ruggieri S, Tortorella C, Gasperini C. Pharmacology and clinical efficacy of dimethyl fumarate (BG-12) for treatment of relapsing-remitting multiple sclerosis. Ther. Clin. Risk Manag. 2014;10:229–239. doi: 10.2147/TCRM.S53285. [DOI] [PMC free article] [PubMed] [Google Scholar]
- Sasaki H, Sato H, Kuriyama-Matsumura K, Sato K, Maebara K, Wang H, Tamba M, Itoh K, Yamamoto M, Bannai S. Electrophilic response element-mediated induction of the cystine/glutamate exchange transporter gene expression. J. Biol. Chem. 2002;277:44765–44771. doi: 10.1074/jbc.M208704200. [DOI] [PubMed] [Google Scholar]
- Schubert D, Piasecki D. Oxidative glutamate toxicity can be a component of the excitotoxicity cascade. J. Neurosci. 2001;21:7455–7462. doi: 10.1523/JNEUROSCI.21-19-07455.2001. [DOI] [PMC free article] [PubMed] [Google Scholar]
- Seib TM, Patel SA, Bridges RJ. Regulation of the system xc cysteine/glutamate exchanger by intracellular glutathione levels in rat astrocyte primary cultures. Glia. 2011;59:1387–1401. doi: 10.1002/glia.21176. [DOI] [PubMed] [Google Scholar]
- Shaik IH, Mehvar R. Rapid determination of reduced and oxidized glutathione levels using a new thiol-masking reagent and the enzymatic recycling method: application to the rat liver and bile samples. Anal. Bioanal. Chem. 2006;385:105–113. doi: 10.1007/s00216-006-0375-8. [DOI] [PMC free article] [PubMed] [Google Scholar]
- Smerjac SM, Bizzozero OA. Cytoskeletal protein carbonylation and degradation in experimental autoimmune encephalomyelitis. J. Neurochem. 2008;105:763–772. doi: 10.1111/j.1471-4159.2007.05178.x. [DOI] [PMC free article] [PubMed] [Google Scholar]
- Suh JH, Shenvi SV, Dixon BM, Liu H, Jaiswal AK, Liu RM, Hagen TM. Decline in transcriptional activity of Nrf2 causes age-related loss of glutathione synthesis, which is reversible with lipoic acid. Proc. Natl. Acad. Sci. USA. 2004;101:3381–3386. doi: 10.1073/pnas.0400282101. [DOI] [PMC free article] [PubMed] [Google Scholar]
- Terazawa R, Akimotob N, Katoa T, Itohc T, Fujita Y, Hamadae N, Deguchia T, Iinumaf M, Nodab M, Nozawag Y, Ito M. A kavalactone derivative inhibits lipopolysaccharide-stimulated iNOS induction and NO production through activation of Nrf2 signaling in BV2 microglial cells. Pharmacol. Res. 2013;71:34–43. doi: 10.1016/j.phrs.2013.02.002. [DOI] [PubMed] [Google Scholar]
- Trapp BD, Syts PK. Virtual hypoxia and chronic necrosis of demyelinated axons in multiple sclerosis. Lancet Neurol. 2009;8:280–291. doi: 10.1016/S1474-4422(09)70043-2. [DOI] [PubMed] [Google Scholar]
- Vandesompele J, De Preter K, Pattyn F, Poppe B, Van Roy N, De Paepe A, Speleman F. Accurate normalization of real-time quantitative RT-PCR data by geometric averaging of multiple internal control genes. Genome Biology. 2002;3:1–11. doi: 10.1186/gb-2002-3-7-research0034. [DOI] [PMC free article] [PubMed] [Google Scholar]
- Wild AC, Moinova HR, Mulcahy RT. Regulation of γ-glutamylcysteine synthetase subunit gene expression by the transcription factor Nrf2. J. Biol. Chem. 1999;274:33627–33636. doi: 10.1074/jbc.274.47.33627. [DOI] [PubMed] [Google Scholar]
- Xu J, Huang G, Zhang K, Sun J, Xu T, Li R, Tao H, Xu W. Nrf2 activation in astrocytes contributes to spinal cord ischemic tolerance induced by hyperbaric oxygen pre-conditioning. J. Neurotrauma. 2014;31:1343–1353. doi: 10.1089/neu.2013.3222. [DOI] [PMC free article] [PubMed] [Google Scholar]
- Zhang H, Liu H, Dickinson DA, Liu RM, Postlethwait EM, Laperche Y, Forman HJ. γ-Glutamyl transpeptidase is induced by 4-hydroxynonenal via EpRE/Nrf2 signaling in rat epithelial type II cells. Free Radic. Biol. Med. 2006;40:1281–1292. doi: 10.1016/j.freeradbiomed.2005.11.005. [DOI] [PMC free article] [PubMed] [Google Scholar]
- Zheng J, Bizzozero OA. Accumulation of protein carbonyls within cerebellar astrocytes in murine experimental autoimmune encephalomyelitis. J. Neurosci. Res. 2010;88:3376–3385. doi: 10.1002/jnr.22488. [DOI] [PMC free article] [PubMed] [Google Scholar]
Associated Data
This section collects any data citations, data availability statements, or supplementary materials included in this article.