

Abstract
Introduction
Collecting trial data in a medical environment is at present mostly performed manually and therefore time-consuming, prone to errors and often incomplete with the complex data considered. Faster and more accurate methods are needed to improve the data quality and to shorten data collection times where information is often scattered over multiple data sources. The purpose of this study is to investigate the possible benefit of modern data warehouse technology in the radiation oncology field.
Material and methods
In this study, a Computer Aided Theragnostics (CAT) data warehouse combined with automated tools for feature extraction was benchmarked against the regular manual data-collection processes. Two sets of clinical parameters were compiled for non-small cell lung cancer (NSCLC) and rectal cancer, using 27 patients per disease. Data collection times and inconsistencies were compared between the manual and the automated extraction method.
Results
The average time per case to collect the NSCLC data manually was 10.4 ± 2.1 min and 4.3 ± 1.1 min when using the automated method (p < 0.001). For rectal cancer, these times were 13.5 ± 4.1 and 6.8 ± 2.4 min, respectively (p < 0.001). In 3.2% of the data collected for NSCLC and 5.3% for rectal cancer, there was a discrepancy between the manual and automated method.
Conclusions
Aggregating multiple data sources in a data warehouse combined with tools for extraction of relevant parameters is beneficial for data collection times and offers the ability to improve data quality. The initial investments in digitizing the data are expected to be compensated due to the flexibility of the data analysis. Furthermore, successive investigations can easily select trial candidates and extract new parameters from the existing databases.
Keywords: Data warehouse, Clinical trials, Data quality, Efficiency
Collecting data in a medical environment for research purposes is time consuming, prone to errors and often incomplete when complex data, such as dosimetric data are concerned [1,2]. Faster and more accurate access to medical information is required to improve the data quality, shorten data-collection times and reduce cost. Furthermore, conducting trials in multiple centres and data-sharing are required in numerous research projects to validate trial results, enable the collection of larger datasets of trial patients with a rare disease or to conduct in silico trials [1,3–6]. Although the medical community has undertaken numerous efforts to digitize its patient and treatment documentation, data are still predominantly collected from paper charts. And when data are collected digitally, they are in most cases unstructured and distributed over multiple data sources.
With the growing number of diagnostic and therapeutic modalities comes an increasing demand for clinical trials to provide the evidence base for these new options and to provide guidance to healthcare providers. However, with only around 3% of the adult cancer patients included in clinical trials this is a very hard task [7–9]. The use of healthcare information systems based on multi-parametric electronic medical record databases (EMR) and data mining tools will greatly enhance clinical research in oncology and more specifically in radiation oncology and facilitate trials with easy patient selection and improved data quality.
Because data are often scattered and unstructured throughout a medical care organization, data warehouse technology is suitable to combine data sources, validate consistency and share data with other researchers [10–12]. It can integrate various information systems in the healthcare enterprise and offers the ability to have specific data structures/views for different investigations, which may deviate from the structure of the operational systems.
Benefits of data warehousing have been described on multiple levels, such as time-saving for users, improved quantity and quality of information, informed decision-making, improvement of business processes and ultimately support for the accomplishment of strategic business objectives [13]. Data warehousing is increasingly used in healthcare to provide the tools for decision making and individualizing disease management [14,15]. Furthermore, it is essential to facilitate the (translational) research that is needed to develop new treatment programmes and support clinical trials (i.e. with quality assurance programmes) [16–20].
To this end, we developed a research portal with an industrial partner to integrate the essential medical data sources and offer automated data extraction tools for research purposes. In this study, we test the performance of this portal with data mining tools against the manual collection process for clinical trials. Performance is measured in time expenses and data quality to target the hypothesis that these will decrease and improve, respectively, by the use of a data warehouse.
Methods and materials
The Computer Aided Theragnostics (CAT) research portal
Together with Siemens Knowledge Solutions (Malvern, PA, USA) we developed a Computer Aided Theragnostics (CAT) research portal. It extracts medical data from the connected systems via a synchronization manager (sync manager) and stores the data centrally in a data warehouse. The operational, patient-centric structure is converted into a disease-centric structure suitable for research. In our radiotherapy department, the sync manager extracts data from various sources: (1) the electronic medical record (EMR), which is either a structured or unstructured database, (2) the RT picture archiving communication system (PACS), consisting of diagnostic imaging and treatment DICOM RT data such as the treatment plans (RTPLAN), predicted 3D dose matrices (3D-RTDOSE), delineations (RTSTRUCT) and digitally reconstructed radiographs used for setup verification (RTIMAGE), and (3) the Record and Verify system (R&V) containing the actual delivered treatment parameters.
The CAT research portal currently has four core user functionalities (Fig. 1). The first module is the query builder, which is a tool for the visual creation and execution of queries as well as viewing the query results and exporting them in XML format. An integrated data-browser (second module) is available where individual cases can be reviewed. Thirdly, the system offers an electronic case report form (eCRF) module. This enables researchers to use the system for clinical trials. The module is built in such a way that case report forms can be pre-populated with data extracted from the clinical databases acquired during the sync procedure. The fourth module is a private data-store for researchers to upload parameters of interest not collected by either eCRFs or clinical systems.
Fig. 1.
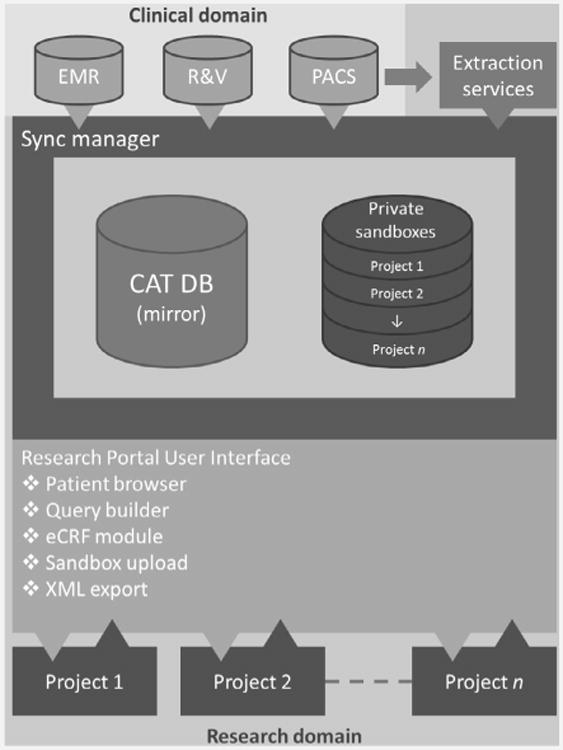
Schematic overview of the CAT data warehouse/research portal. The system synchronizes data from clinical data sources and custom services. It is also capable of collecting data for trials and data collected for other research purposes. For data export, several modules exist in the system and are easily accessible by web-technology (i.e. the patient browser, query builder and an electronic case report form XML export).
In addition to the EMR, PACS and R&V systems, our department designed custom-made, fully automated workflows in a framework called DIGITrans (http://www.mistir.info/?q=digitrans). DIGITrans offers a user interface and background services for data generation, extraction and transportation for both clinical and research purposes. During daily clinical practice, 2D dose-guided radiotherapy workflows are present [21], while for research users, workflows are defined to extract parameters from for instance dose–volume histograms (DVH) and store the results as DICOM-objects in the PACS system. These workflows are DICOM-driven and can convert, validate and transfer DICOM objects throughout the entire department and can easily be adapted to support new parameters or modalities. Parameters of interest are stored in a structured database. Currently, DVH parameters such as mean lung dose (MLD), structure volumes and different volume and dose parameters are stored in a separate structured database. A similar extraction is done from PET scans to derive and store standardized uptake values (SUV).
The current data management process
The current trial data management process in our institute is largely manual and when data are acquired electronically still the case report forms have to be filled in manually. Currently, a list of patients and the parameters that need to be collected is supplied to the data manager, who will then identify from which system or document the data need to be extracted. Next, the data are collected manually from each system or chart. The data are noted in an electronic document such as Microsoft Excel, Access or in an electronic case report form (eCRF). Data are collected using the Good Clinical Practice (GCP) guidelines as a reference [22,23].
Collection of some of the parameters mentioned requires domain and application specialists. For these parameters, the data managers do not collect data (e.g. DVH or SUV parameters, which require recalculation), but the collection is done separately by radiation technologists.
Experimental setup
Two hypothetical trials with representative sets of parameters were defined for non-small cell lung cancer (NSCLC) and rectal cancer (Table 1). Next, a comparison was made between the manual data collection process and the automatic data warehouse based method. The datasets were heterogeneous so that data had to be collected from the paper charts (manually) or EMR (automatically), the R&V system and XiO/TrueD (manually) or the PACS. For the measurements, the parameter sets were split into two groups; (1) the “lookup” group (chart/EMR and R&V) and (2) the “recalculation” group (XiO/TrueD and PACS).
Table 1.
Parameters collected for the NSCLC and rectal cancer groups. The last columns show which data were looked up where and from which source the data were recalculated.
| Parameter | NSCLC | Rectum | Source | Action | |
|---|---|---|---|---|---|
|
| |||||
| Manual | Automatic | ||||
| Gender | ✓ | ✓ | Chart | EMR | Looked up |
| WHO score | ✓ | ✓ | Chart | EMR | |
| TNM staging | ✓ | ✓ | Chart | EMR | |
| Chemo therapy | ✓ | ✓ | Chart | EMR | |
| Number of positive lymph nodes | ✓ | ✓ | Chart | EMR | |
| Tumour PA | ✓ | ✓ | Chart | EMR | |
| pCR | ✓ | Chart | EMR | ||
| Survival | ✓ | ✓ | Chart | EMR | |
| Total delivered dose | ✓ | ✓ | R&V | R&V | |
| Overall treatment time | ✓ | ✓ | R&V | R&V | |
| GTV volume | ✓ | ✓ | XiO | PACS | Recalculated |
| V5 | Lungsa | XiO | PACS | ||
| V20 | Lungs | XiO | PACS | ||
| V40 | Bladder | XiO | PACS | ||
| MLD | ✓b | XiO | PACS | ||
| SUV Max | Tumour | TrueD | PACS | ||
| SUV Mean | Tumour | TrueD | PACS | ||
V5 and V20 data for the lungs were calculated with both lungs minus the PTV.
MLD data for the lungs were calculated with both lungs minus the GTV.
The manual recalculation of DVH parameters was conducted with the treatment planning system (TPS) XiO (CMS Software, Elekta, XiO 4.34.02, St. Louis, MO), using the plans available on the TPS system. For the manual recalculation of SUV values we used the commercially available TrueD software (TrueD VC50, Siemens Medical, Erlangen, Germany). The PET images were re-imported and volumes of interest (VOIs) were created again to retrieve the SUV data.
For the automatic recalculated parameters, a query was defined once using the CAT research portal and the result was exported in XML format. From this query result, the original CT/PET images, structures and dose were sent from the PACS to the DIGITrans workflows to automatically extract the DVH and SUV data.
Furthermore, data quality was evaluated for all experiments by scoring discrepancies between both the CAT and current manual process. To decide which method was correct, each deviation was looked up again in its reference system or validated by another observer.
The primary end-point of the experiment was data collection time. For the sample size calculation, we hypothesized a difference of 3 min with a standard deviation of 3 min using a paired t-test. We wanted to achieve a power of 0.99 and an α = 0.01. Based on these assumptions, the sample size was determined at n = 27. The secondary end-point of data quality was evaluated by comparing the output from the CAT method against the first human observer. The output of the human observer was validated by a second human observer and inconsistencies were resolved by a third look-up. The third look-up was not taken into account in the data collection time measurements. After these comparisons between observers, a GCP compliant collected data-set was acquired and this set was also compared against the CAT method.
Results
In Fig. 2, the average data collection times for NSCLC (a) and rectum cancer (b) are shown for the manual versus the CAT groups. The figure shows the distinction between the data that were looked up (in the EMR and R&V) and recalculated (from PACS/TPS data). On average, the total collection time for the manual method for the individual NSCLC cases was 10.4 ± 2.1 min while for the CAT method this was 4.3 ± 1.1 min (p < 0.001). For rectal cancer, this was 13.5 ± 4.1 min for the manual collection and 6.8 ± 2.4 min for the CAT method (p < 0.001) (Table 2).
Fig. 2.

Average manual versus CAT collection times (in min) for the (a) NSCLC and (b) rectum cases. The parameters that were looked up in the EMR and R&V system are displayed in medium grey and labelled “Lookup”. In dark grey (labelled “Recalc.”), the parameters are shown that were recalculated. The error bars show the standard deviations. For the rectum cases, the collection times for SUV data only show the large variability in the contribution to the recalculated parameters (in light grey and labelled “SUV”).
Table 2.
Comparison of the total data collection times (mean ± SD in min) for the manual versus the CAT method.
| Tumour type | Manual (min) | CAT (min) | p-value |
|---|---|---|---|
| NSCLC | 10.4 ± 2.1 | 4.3 ± 1.2 | <0.001 |
| Rectum | 13.5 ± 4.1 | 6.9 ± 2.3 | <0.001 |
The main difference between the manual and automatic collection times for both the NSCLC and rectum cases was caused by the lookup parameters. The data warehouse offered one central interface where all parameters were present, while the manual method required the data managers to gather and analyse the paper charts.
For the NSCLC cases there was a difference between manual and automated collection times of the DVH parameters. This was caused by the fact that the V5 and V20 are not used in daily clinical practice and their DVHs needed to be recalculated in the TPS.
For the rectal cancer cases there was a difference compared to the NSCLC cases with respect to the collection time of recalculated parameters. This difference was mainly caused by the extraction of the SUVmean and SUVmax. In the manual method, VOIs needed to be re-drawn for all cases because the used system did not support import from structures or back-uped data. As can be seen in Fig. 2b (SUV data), the standard deviation is very large (± 3.0 min). This is due to the effect that in some cases the auto-segmentation delineated neighbouring organs such as the bladder and contours needed to be edited manually. To determine the data-quality, we compared the SUV parameters with the newly generated structure-set.
There was no difference found in the extraction of DVH parameters between both methods, however, the extraction took significantly longer when compared to the NSCLC extraction. This was because in daily clinical practice the bladder is normally not delineated and therefore not available for both methods and was delineated in the TPS. The time needed for the bladder delineation was taken into account for both methods and therefore there is no difference between both methods for this extraction.
Manual data collection was performed according to GCP guidelines. This means that data are collected by two observers and then validated. After validation between observers, we found that in the NSCLC set there was a mismatch between manually collected data and automatic in 3.2% of all different parameters collected. The mismatch before validation for NSCLC was 10.3%. Using the GCP collection process thus resolved 69% of the initial mismatches.
We found a particular bad concordance between observers for the manual collection of the overall treatment time in days. This was due to the fact that some observers erroneously recalculated the data while others looked it up in the R&V system. This interpretation difference explained most of the drop of mismatching data after validation. The remaining differences could be explained primarily by a mismatch between DVH parameters. We found that in most cases the DVH parameters that mismatched before validation were based on a different treatment plan than actually used for treatment or were calculated on a wrong volume. The V5 and V20 were defined using LungLeft+LungRight–PTV(s) volumes while the MLD had to be calculated on LungLeft+LungRight–GTV(s) volumes. Before validation, the V5 and V20 were in some cases extracted from the DVH from which the MLD is calculated. After the validation between observers, the remaining 3.2% mismatching parameters indicate the true mismatch between both methods. We found that in more than 90% of these cases the automatic method retrieved the correct data.
For the rectal cancer set we observed similar results. We observed data differences in 8.8% of all data collected. Again, we saw a bad concordance of the overall treatment time between the manual and automatic method. The other deviations were mainly found in the recalculation of SUV parameters. The cause for the deviation could be found in the implementation differences between the automated mining tool and the PET analysis software.
In the PET analysis software, a threshold is calculated by taking into account the signal-to-background ratio calculated as Threshold = 0.7813 * (SUVmaxTumour/SUVmeanBackground)−0.299. This threshold is then used to draw the contour on the PET and all the voxels with an SUV above the threshold are used to calculate the SUVmean. The automated method however uses the exported contour to calculate the mean SUV from all the voxels within the exported contour. Due to interpolation and inaccuracy of the contour the SUVmean of the automated method was lower than with the analysis software. This problem was compensated to search the contours for the background contours, calculate the threshold and use the threshold in the same way as the PET analysis tool. This explained 31% of the mismatches.
The remaining data inconsistencies were either human error(s), for example in one case we found a different total delivered dose, or were caused by erroneous DICOM objects.
Discussion
Our results show that using a data-warehouse shortens data-collection times significantly and can be of help to improve data quality because data in the CAT data warehouse are captured from all clinical reference systems and validated before storage in the warehouse. Especially the use of the in-house developed mining tools support easy extraction or recalculation of parameters of interest (e.g. V20, V5, SUVmean and SUVmax) and eliminates manual steps. However, as the results show with the extraction of the SUV parameters great care must be taken when using these kinds of tools in an automated way. It is very important to carefully validate and approve them before extensive research use.
The strength of the CAT data warehouse is that it can combine, validate and present data from distributed databases in a uniform way. Furthermore, the system is designed to have an external interface to share data among other institutes. Data are easily accessible for researchers via a web-interface with several extra options such as a patient browser and a query builder. Occasionally, expert knowledge is necessary to maintain the system, because of interoperability issues due to updates of source systems.
When looking at the manual data collection process we have found that there was a large inter-observer variability. This explains most of the data inconsistencies between the automated and manual collection methods. Strict guidelines such as GCP [22,23] are of great importance to ensure data quality. We found that the collection by two observers and the monitoring and validation are vital for data quality because it resolves conflicts between observers. From previous studies [24,25] it can be concluded that, by using intelligent free-text searching/mining and machine learning technique approaches to retrieve the data in a data warehouse, data can automatically be validated and true data values can be identified. Retrieving this data manually can introduce inconsistencies or missing data, which we have seen in some cases in this study. This is confirmed by Prokosch and Ganslandt [16] who mention in their second challenge that electronic data capture for trials provides significant benefits over manual collection. One other advantage is the possibility to include realtime patient outcome data, for instance by directly linking to a national registry or including properly captured patient-reported outcome [26,27].
Using the research portal for trial data collection with eCRFs using extracted data from local databases, could possibly be a better start of the data collection and even replace the first observer. The electronically captured data could then immediately be validated by the monitor. By using this approach the data collection time can be minimized. Although pre-population of data can induce data capturing problems as mentioned by Kush et al. [2] this can be solved by the requirement that the responsible eCRF reporter verifies all pre-populated data. This can be embedded in the user interface workflow. New technologies such as developed by Rao et al. [24] can be used to validate data at the synchronization process delivering high quality data to the user who only needs to validate the data for the clinical trial.
The CAT research portal is an institute-specific data warehouse that can also be used to share data in a privacy-preserving and semantic-interoperable manner using internationally accepted data exchange standards and ontologies such as described in an accompanying study [28,29], addressing the growing need for standardized data exchange between medical centres [1,3,12]. Richesson and Krischer [30] describe that there are currently overlaps, challenges and gaps in the standards developed for research and clinical purposes for data retrieval at a local scale and data sharing at a global scale. They conclude that data should be shared between research and clinics where possible but also that the clinical data will have gaps and that the importance of data standards for clinical research is underestimated. In one of a series of vision papers by the QUANTEC group, Deasy et al. [31] suggest that data-sharing and -pooling can raise the quantity as well as the quality of clinical data for data mining purposes. We strongly share this belief.
A data warehouse probably reduces cost for the research organization. As can be seen from the results from this study, data collection time can be reduced significantly. Although the fact that clinical trials usually run for several years the time spent for data collection can be reduced by more than 50%, which should translate into a cost reduction of data management. However, to set up and maintain systems like this will have financial implications. The initial installation is the most expensive part but can be spread over several projects in multiple years. The operational cost of a system is dependent on the organization's needs and is variable. For example, for typical projects datasets of several hundreds of patients are needed [32–35]. It was estimated in one of these studies that approximately 45 h of data management can be saved, based on a dataset of 400 patients, which is 6–7 min. per case. This is in concordance with our findings.
For the manual collection process, we measured the time to collect the actual data when the source data were available in the subsystems (i.e. the treatment plan was available in the TPS). However, in retrospective studies this might not be the case and data might have to be restored from back-ups or archives. This additional time has not been taken into account in this study because of the fact that the retrieval of data differs heavily for various backup-and-restore systems. Most often PACS data reside on disks, while the TPS data are archived on tape or slow disks. Therefore, including restoration of data would likely increase manual recalculation times significantly.
A further benefit of data warehousing is to be expected when considering research and trials in the field of Radiomics [36], for instance. This involves the high-throughput extraction of large amounts of image features from clinical images. These quantitative imaging features are increasingly used in treatment planning and for monitoring patient outcome [37,38]. Because this is a rapidly evolving research area, new features are added frequently. Therefore, a data warehouse with easily modified data extraction services is likely to be far more beneficial when compared to manual data collection.
Conclusions
Information technology solutions such as the CAT data warehouse improve clinical research for radiotherapy by reducing the time needed to collect necessary data and by improving the quality of the data collected.
Acknowledgments
We thank C. Overhof, R. Debougnoux, A. Claessens, J. van den Bogaard and B. Hanbeukers for their contribution. We thank Siemens for their financial and technical support received for this study. Furthermore, we acknowledge financial support from the CTMM framework (AIRFORCE project, n° 03O-103), EU 7th framework program (METOXIA, EURECA), euroCAT (IVA Interreg, www.eurocat.info), Radiomics (NIH, USA), EU IMI program (QuIC-ConCePT), NIH-QIN (Radiomics of NSCLC U01 CA143062) and the Dutch Cancer Society (KWF UM 2011-5020, KWF UM 2009-4454).
References
- 1.Klein A, Prokosch HU, Muller M, Ganslandt T. Experiences with an interoperable data acquisition platform for multi-centric research networks based on HL7 CDA. Methods Inf Med. 2007;46:580–5. doi: 10.1160/me9060. [DOI] [PubMed] [Google Scholar]
- 2.Kush R, Alschuler L, Ruggeri R, et al. Implementing single source: the STARBRITE proof-of-concept study. J Am Med Inform Assoc. 2007;14:662–73. doi: 10.1197/jamia.M2157. [DOI] [PMC free article] [PubMed] [Google Scholar]
- 3.Knaup P, Garde S, Merzweiler A, et al. Towards shared patient records: an architecture for using routine data for nationwide research. Int J Med Inform. 2006;75:191–200. doi: 10.1016/j.ijmedinf.2005.07.020. [DOI] [PubMed] [Google Scholar]
- 4.Roelofs E, Persoon L, Qamhiyeh S, et al. Design of and technical challenges involved in a framework for multicentric radiotherapy treatment planning studies. Radiother Oncol. 2010;97:567–71. doi: 10.1016/j.radonc.2010.08.009. [DOI] [PubMed] [Google Scholar]
- 5.Bosmans G, Buijsen J, Dekker A, et al. An “in silico” clinical trial comparing free breathing, slow and respiration correlated computed tomography in lung cancer patients. Radiother Oncol. 2006;81:73–80. doi: 10.1016/j.radonc.2006.08.009. [DOI] [PubMed] [Google Scholar]
- 6.Ollers M, Bosmans G, van Baardwijk A, et al. The integration of PET-CT scans from different hospitals into radiotherapy treatment planning. Radiother Oncol. 2008;87:142–6. doi: 10.1016/j.radonc.2007.12.025. [DOI] [PubMed] [Google Scholar]
- 7.Movsas B, Moughan J, Owen J, et al. Who enrolls onto clinical oncology trials? A radiation patterns of care study analysis. Int J Radiat Oncol Biol Phys. 2007;68:1145–50. doi: 10.1016/j.ijrobp.2007.01.051. [DOI] [PubMed] [Google Scholar]
- 8.Murthy VH, Krumholz HM, Gross CP. Participation in cancer clinical trials: race-, sex-, and age-based disparities. JAMA. 2004;291:2720–6. doi: 10.1001/jama.291.22.2720. [DOI] [PubMed] [Google Scholar]
- 9.Grand MM, O'Brien PC. Obstacles to participation in randomised cancer clinical trials: a systematic review of the literature. J Med Imaging Radiat Oncol. 2012;56:31–9. doi: 10.1111/j.1754-9485.2011.02337.x. [DOI] [PubMed] [Google Scholar]
- 10.Wisniewski MF, Kieszkowski P, Zagorski BM, Trick WE, Sommers M, Weinstein RA. Development of a clinical data warehouse for hospital infection control. J Am Med Inform Assoc. 2003;10:454–62. doi: 10.1197/jamia.M1299. [DOI] [PMC free article] [PubMed] [Google Scholar]
- 11.Weber DC, Poortmans PMP, Hurkmans CW, Aird E, Gulyban A, Fairchild A. Quality assurance for prospective EORTC radiation oncology trials: the challenges of advanced technology in a multicenter international setting. Radiother Oncol. 2011;100:150–6. doi: 10.1016/j.radonc.2011.05.073. [DOI] [PubMed] [Google Scholar]
- 12.El Fadly A, Rance B, Lucas N, et al. Integrating clinical research with the Healthcare Enterprise: from the RE-USE project to the EHR4CR platform. J Biomed Inform. 2011;44:S94–S102. doi: 10.1016/j.jbi.2011.07.007. [DOI] [PubMed] [Google Scholar]
- 13.Watson HJ, Goodhue DL, Wixom BH. The benefits of data warehousing: why some organizations realize exceptional payoffs. Inf Manage. 2002;39:491–502. [Google Scholar]
- 14.Schubart JR, Einbinder JS. Evaluation of a data warehouse in an academic health sciences center. Int J Med Inform. 2000;60:319–33. doi: 10.1016/s1386-5056(00)00126-x. [DOI] [PubMed] [Google Scholar]
- 15.Rubin DL, Desser TS. A data warehouse for integrating radiologic and pathologic data. J Am Coll Radiol. 2008;5:210–7. doi: 10.1016/j.jacr.2007.09.004. [DOI] [PubMed] [Google Scholar]
- 16.Prokosch HU, Ganslandt T. Perspectives for medical informatics. Reusing the electronic medical record for clinical research. Methods Inf Med. 2009;48:38–44. [PubMed] [Google Scholar]
- 17.Sarkar IN. Biomedical informatics and translational medicine. J Transl Med. 2010;8:22. doi: 10.1186/1479-5876-8-22. [DOI] [PMC free article] [PubMed] [Google Scholar]
- 18.Gaze MN, Boterberg T, Dieckmann K, et al. Development of an electronic database for quality assurance of radiotherapy in the International Society of Paediatric Oncology (Europe) high risk neuroblastoma study. Radiother Oncol. 2010;97:593–5. doi: 10.1016/j.radonc.2010.08.017. [DOI] [PubMed] [Google Scholar]
- 19.Fairchild A, Aird E, Fenton PA, et al. EORTC Radiation Oncology Group quality assurance platform: establishment of a digital central review facility. Radiother Oncol. 2012;103:279–86. doi: 10.1016/j.radonc.2012.04.015. [DOI] [PubMed] [Google Scholar]
- 20.Bekelman JE, Deye JA, Vikram B, et al. Redesigning radiotherapy quality assurance: opportunities to develop an efficient, evidence-based system to support clinical trials – report of the national cancer institute work group on radiotherapy quality assurance. Int J Radiat Oncol Biol Phys. 2012;83:782–90. doi: 10.1016/j.ijrobp.2011.12.080. [DOI] [PMC free article] [PubMed] [Google Scholar]
- 21.Nijsten SM, van Elmpt WJ, Mijnheer BJ, et al. Prediction of DVH parameter changes due to setup errors for breast cancer treatment based on 2D portal dosimetry. Med Phys. 2009;36:83–94. doi: 10.1118/1.3026660. [DOI] [PubMed] [Google Scholar]
- 22.Mathieu M. Good clinical practice: a question & answer reference guide. Parexel International Corporation; 2009. [Google Scholar]
- 23.Pieterse H. Richtsnoer voor Good Clinical Practice (CPMP/ICH/95) Heerhugowaard: Profess Medical Consultancy B.V; 2010. [Google Scholar]
- 24.Rao BR, Sandilya S, Niculescu R, Germond C, Goel A. Mining time-dependent patient outcomes from hospital patient records. Proc AMIA Symp. 2002;2002:632–6. [PMC free article] [PubMed] [Google Scholar]
- 25.Branson A, Hauer T, McClatchey R, Rogulin D, Shamdasani J. A data model for integrating heterogeneous medical data in the Health-e-Child project. Stud Health Technol Inform. 2008;138:13–23. [PubMed] [Google Scholar]
- 26.Wong K, Huang SH, O'Sullivan B, et al. Point-of-care outcome assessment in the cancer clinic: audit of data quality. Radiother Oncol. 2010;95:339–43. doi: 10.1016/j.radonc.2010.03.015. [DOI] [PubMed] [Google Scholar]
- 27.Ho KF, Farnell DJ, Routledge JA, et al. Comparison of patient-reported late treatment toxicity (LENT-SOMA) with quality of life (EORTC QLQ-C30 and QLQ-H&N35) assessment after head and neck radiotherapy. Radiother Oncol. 2010;97:270–5. doi: 10.1016/j.radonc.2010.01.017. [DOI] [PubMed] [Google Scholar]
- 28.Dekker A, Roelofs E, Meldolesi E, Valentini V, Lambin P. Ad-hoc data sharing infrastructure for radiotherapy research collaboration: a tool for multicentric clinical research. Radiother Oncol. 2011;99:S155–6. doi: 10.1016/j.radonc.2013.11.001. [DOI] [PMC free article] [PubMed] [Google Scholar]
- 29.Dekker A, Roelofs E, Meldolesi E, van Stiphout RGPM, Valentini V, Lambin P. International data-sharing for radiotherapy research: an open-source based infrastructure for multicentric clinical data mining. Radiother Oncol. doi: 10.1016/j.radonc.2013.11.001. submitted for publication. [DOI] [PMC free article] [PubMed] [Google Scholar]
- 30.Richesson RL, Krischer J. Data standards in clinical research: gaps, overlaps, challenges and future directions. J Am Med Inform Assoc. 2007;14:687–96. doi: 10.1197/jamia.M2470. [DOI] [PMC free article] [PubMed] [Google Scholar]
- 31.Deasy JO, Bentzen SM, Jackson A, et al. Improving normal tissue complication probability models: the need to adopt a “data-pooling” culture. Int J Radiat Oncol Biol Phys. 2010;76:S151–4. doi: 10.1016/j.ijrobp.2009.06.094. [DOI] [PMC free article] [PubMed] [Google Scholar]
- 32.Jayasurya K, Fung G, Yu S, et al. Comparison of Bayesian network and support vector machine models for two-year survival prediction in lung cancer patients treated with radiotherapy. Med Phys. 2010;37:1401–7. doi: 10.1118/1.3352709. [DOI] [PubMed] [Google Scholar]
- 33.Dehing-Oberije C, De Ruysscher D, van der Weide H, et al. Tumor volume combined with number of positive lymph node stations is a more important prognostic factor than TNM stage for survival of non-small-cell lung cancer patients treated with (chemo)radiotherapy. Int J Radiat Oncol Biol Phys. 2008;70:1039–44. doi: 10.1016/j.ijrobp.2007.07.2323. [DOI] [PubMed] [Google Scholar]
- 34.Dehing-Oberije C, Yu S, De Ruysscher D, et al. Development and external validation of prognostic model for 2-year survival of non-small-cell lung cancer patients treated with chemoradiotherapy. Int J Radiat Oncol Biol Phys. 2009;74:355–62. doi: 10.1016/j.ijrobp.2008.08.052. [DOI] [PubMed] [Google Scholar]
- 35.Dehing-Oberije C, De Ruysscher D, van Baardwijk A, Yu S, Rao B, Lambin P. The importance of patient characteristics for the prediction of radiation-induced lung toxicity. Radiother Oncol. 2009;91:421–6. doi: 10.1016/j.radonc.2008.12.002. [DOI] [PubMed] [Google Scholar]
- 36.Lambin P, Rios-Velazquez E, Leijenaar R, et al. Radiomics: extracting more information from medical images using advanced feature analysis. Eur J Cancer. 2012;48:441–6. doi: 10.1016/j.ejca.2011.11.036. [DOI] [PMC free article] [PubMed] [Google Scholar]
- 37.Vaidya M, Creach KM, Frye J, Dehdashti F, Bradley JD, El Naqa I. Combined PET/CT image characteristics for radiotherapy tumor response in lung cancer. Radiother Oncol. 2012;102:239–45. doi: 10.1016/j.radonc.2011.10.014. [DOI] [PubMed] [Google Scholar]
- 38.Thorwarth D, Alber M. Implementation of hypoxia imaging into treatment planning and delivery. Radiother Oncol. 2010;97:172–5. doi: 10.1016/j.radonc.2010.05.012. [DOI] [PubMed] [Google Scholar]