Abstract
In a scintillation detector, the light generated in the scintillator by a gamma interaction is converted to photoelectrons by a photodetector and produces a time-dependent waveform, the shape of which depends on the scintillator properties and the photodetector response. Several depth-of-interaction (DOI) encoding strategies have been developed that manipulate the scintillator’s temporal response along the crystal length and therefore require pulse shape discrimination techniques to differentiate waveform shapes. In this work, we demonstrate how maximum likelihood (ML) estimation methods can be applied to pulse shape discrimination to better estimate deposited energy, DOI and interaction time (for time-of-flight (TOF) PET) of a gamma ray in a scintillation detector. We developed likelihood models based on either the estimated detection times of individual photoelectrons or the number of photoelectrons in discrete time bins, and applied to two phosphor-coated crystals (LFS and LYSO) used in a previously developed TOF-DOI detector concept. Compared with conventional analytical methods, ML pulse shape discrimination improved DOI encoding by 27% for both crystals. Using the ML DOI estimate, we were able to counter depth-dependent changes in light collection inherent to long scintillator crystals and recover the energy resolution measured with fixed depth irradiation (~11.5% for both crystals). Lastly, we demonstrated how the Richardson-Lucy algorithm, an iterative, ML-based deconvolution technique, can be applied to the digitized waveforms to deconvolve the photodetector’s single photoelectron response and produce waveforms with a faster rising edge. After deconvolution and applying DOI and time-walk corrections, we demonstrated a 13% improvement in coincidence timing resolution (from 290 to 254 ps) with the LFS crystal and an 8% improvement (323 to 297 ps) with the LYSO crystal.
Index Terms: Depth-of-interaction (DOI), gamma ray detectors, maximum likelihood estimation, positron emission tomography (PET), pulse shape discrimination
I. Introduction
A typical gamma ray detector used in positron emission tomography (PET) or single photon emission computed tomography (SPECT) consists of a scintillator (a monolithic block or an array of individual crystals), coupled to one or more photodetectors to convert the scintillation light into an electrical signal. All of the available information related to the time, location and amount of energy deposited by the gamma interaction in the scintillator is encoded in the spatial and temporal properties of the detected scintillation photons. Various detector designs and algorithms have been implemented in order to estimate the position, time and energy of the gamma interaction from the photodetector pulse produced for each gamma interaction. Along with the physical detector construction, the choice of algorithm used to extract information has a strong impact on the overall detector performance, leading to the development of many estimation methods, both analytical and statistical.
Several gamma depth-of-interaction (DOI) estimation methods that manipulate the temporal properties of the detected scintillation photons (then converted into photoelectrons) have been developed [1]. Varying the scintillator rise or decay time along the length of the crystal can be achieved by pairing different scintillators (the phoswich concept) or by varying the dopant concentration along the length of the crystal, or by applying a phosphor coating to sections of the crystal surface [2]-[7]. These approaches usually require custom pulse shape discrimination techniques to provide optimal performance. These include rise time and decay time discrimination, dual charge integration (DCI), and constant fraction discrimination.
When coupling a scintillator to a photodetector, the photodetector output waveform is a result of temporally distributed photoelectrons (detected scintillation photons). Therefore, to make full use of the available information for pulse shape discrimination, the timing properties of individual photoelectrons should be used. However, analytical pulse shape discrimination techniques typically rely on curve fitting or discrete integration and do not exploit the quantized nature of the photodetector output to determine the underlying pulse shape. Maximum likelihood (ML) estimation methods making use of the individual photoelectrons and modelling the random Poisson nature of their detection times have the potential to provide better performance.
ML estimation has been shown to provide excellent position estimation of the gamma interaction in monolithic scintillators [8]-[11]. In these studies, the light distribution is sampled by many photodetectors and Poisson or Gaussian probability-based likelihood functions are used to estimate the gamma interaction position, based on the number of photoelectrons collected by each photodetector. These ML methods have been extended to estimate DOI in detectors where DOI information is contained in the light distribution [12]-[16].
One of the main goals of this work is to develop ML methods for pulse shape discrimination to estimate DOI with phosphor-coated scintillator crystals. Some of these methods are based on analogies between photoelectron counting for 3D gamma positioning (spatial domain) and the rate of photoelectron production in a photodetector (temporal domain). We also demonstrate methods to recover energy resolution degradation caused by DOI effects by correcting for depth-dependent light collection using our ML DOI estimate. Lastly, we show improved timing resolution through deconvolution techniques and accounting for depth-dependent changes in timing pick-off. An iterative deconvolution technique is investigated to deconvolve the photodetector’s contribution from the waveforms and produce a signal with a faster rising edge to improve the precision of estimating the gamma interaction time from the digitized waveforms.
II. Materials And Methods
A. Experiments
Two scintillator crystals with similar intrinsic optical properties were used in this study: Lutetium fine silicate (LFS, Zecotek Photonics Inc.) that has a decay time of 36 ns, and Lutetium yttrium oxyorthosilicate (LYSO, Crystal Photonics Inc,) that has a decay time of 41 ns. Both crystals had dimensions of 3 mm × 3 mm × 20 mm with mechanically polished surfaces and were coated on one lateral side (7 mm length from the top of the crystal), with a YAG:Ce phosphor compound which had a measured decay time of 58 ns [17]. The coating thickness was 100 μm.
Data were acquired with fast PMTs (R9800, Hamamatsu), in both head-on and side-on (fixed DOI) irradiation using a reference detector to select coincidence events and provide electronic collimation for side-on measurements [Fig. 1], [18]. For side-on irradiation, the test detector was translated laterally in 4 mm steps starting 2 mm from the top of the crystal. The test and reference detector waveforms were digitized at 5 GS/s with a 200 ns frame time. Coincidences were found online in the digitizer software and only valid coincident events were stored. Twenty-five thousand events were acquired in three separate head-on measurements for both crystals with a 320 kBq 68Ge point source. The crystal was recoupled to the PMT between each head-on measurement. For side-on measurements, 25k events were acquired at each of the five irradiation positions using a 530 kBq 22Na point source with a 0.25 mm diameter to minimize the irradiation beam width on the test detector.
Fig. 1.

DOI and waveform measurement setup (side-on configuration). For head-on measurements, the test detector (phosphor-coated crystal) was rotated 90° to face the reference crystal. Both PMTs were biased at -1200 V.
B. Signal Processing and DCI Pulse Shape Discrimination
Deposited energy (N photoelectrons) was estimated by integrating the waveform, s(t), for 175 ns after a threshold trigger [Fig. 2]. The waveforms were converted to units of “photoelectrons vs. time” using the single photoelectron charge (measured in Section III.F) so that the energy integral provides the number of photoelectrons contained in the waveform rather than charge. To remove events that underwent Compton scattering in the crystal and did not deposit 511 keV, a 430 – 600 keV energy window was applied to the events. Digital leading edge timing discrimination was used to compute timing pick-offs for both detectors with linear interpolation used to estimate waveform values between samples. Based on our previous work with phosphor-coated crystals, we used dual charge integration (DCI) with optimized parameters to analytically discriminate pulse shapes [2]. The DCI value for each event was found by integrating the waveform over two time windows and computing the ratio of the integrals. Each integration width was 100 ns and the second time window was delayed 50 ns from the first.
Fig. 2.
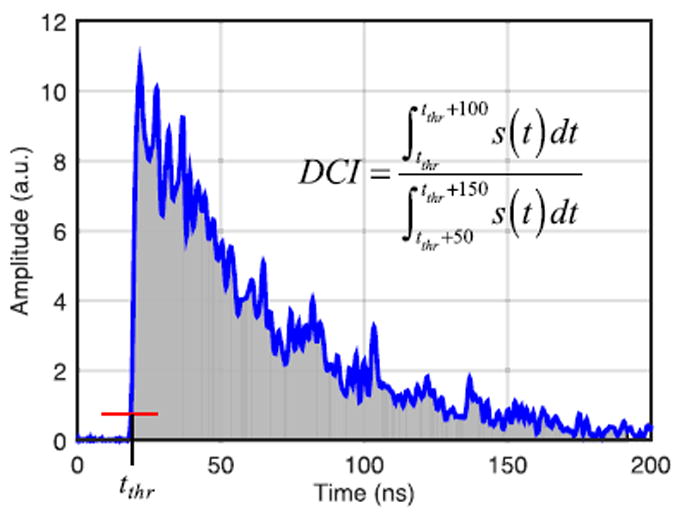
Sample PMT waveform. The grey area denotes energy estimation integral. The red line illustrates the leading edge threshold used to compute timing pick-off and tthr is the timing pick-off.
C. DOI Encoding Evaluation
A DOI classification algorithm similar to that described by Roncali et al. [19] was used to evaluate DOI encoding capabilities. The side-on data for each crystal were separated into two groups, one to train the classifier (training dataset) and the other to test DOI encoding (test dataset). The training dataset is used to compute reference values needed to associate pulse shape discrimination metrics with DOI. For example with DCI, the mean DCI value is computed for each DOI (side-on irradiation positions). Using the reference values, we assigned each test event to a DOI based on its pulse shape characteristics. For example, the DCI value of a test event was computed and the event is assigned the DOI corresponding to the most similar DCI reference value.
The true DOI values of the test events are known from the side-on irradiation positions, which allows us to quantitatively assess DOI encoding by computing the DOI positioning error: the average distance between an event’s true DOI and its estimated DOI. Five thousand events were used from each of the five side-on positions to train the classifier and 3000 events, separated into three groups each with 1000 events, were used from each side-on position in the test dataset.
III. Maximum Likelihood Methods
A. Timing Properties of Scintillation Light with Phosphor-Coated Crystals
The phosphor coating applied to a small area on the lateral sides of the scintillator crystal causes a fraction of the scintillation light to be absorbed by the phosphor, which re-emits the light with a longer characteristic time constant. For a description of DOI encoding with phosphor-coated crystals, please refer to our previous studies [2], [19]. Light impinging on the photodetector is a mixture of scintillation light and scintillation light that is converted and delayed by the phosphor, which modifies the subsequent generation times of photoelectrons by the photodetector. The temporal properties of the photoelectrons in response to a gamma event are described by a weighted sum of the probability distribution function (PDF) of the scintillator emission, h(t), and the PDF of the converted light. The PDF of the converted light is the convolution of h(t) with the PDF of the phosphor’s emission u(t) [19]:
| (1) |
where q is the weighting factor (between zero and one) describing the amount of light converted by the phosphor and varies monotonically with DOI. In this work, the scintillator h(t) and phosphor emission u(t) are approximated by single decaying exponentials. ρ(t,q) is normalized such that its sum over the energy integration time (175 ns) is equal to one. Since the overall light collection varies with DOI with phosphor-coated crystals, the probability of generating a photoelectron per unit time is ρ(t,q) multiplied by the mean number of photoelectrons for the given q (DOI): N̄(q)ρ(t,q). N̄(q) is the mean number of photoelectrons at a given DOI, or q, and is determined from the 511 keV photopeak positions using the side-on training datasets.
ρ(t,q) also includes other factors such as scintillator rise time, photon transit time and photodetector time jitter, however these secondary effects are only relevant on a scale of tens or hundreds of picoseconds and are considered negligible for pulse shape discrimination in the nanosecond range. That is, we assume the Poisson nature from the scintillation process dominates the randomness in photoelectron times. Under this assumption we can describe the number of collected photoelectrons using the following Poisson probability:
| (2) |
The probability is interpreted as the probability of detecting g photoelectrons in a given time interval if the mean is m. We derive two models for ML pulse shape discrimination from this Poisson probability: a continuous model using detection times of individual photoelectrons (Section III-B) and a discrete model based on counting the number of photoelectrons in discrete time bins (Section III-C).
B. Continuous ML Model Based on Individual Photoelectrons
Each photoelectron contains a quantum of timing information about the global pulse shape characteristics. Therefore, to make full use of the available information, the likelihood model for pulse shape discrimination should be based on all individual photoelectron times [20].
When t0 is the time of the gamma interaction, the mean expected number of photoelectrons, m, in the time interval t0 to t1, is given by:
| (3) |
We first compute the probability of detecting the first photoelectron at time t1, P(1,t1|m). This is the Poisson probability of zero photoelectrons occurring prior to t1 multiplied by the probability of exactly one photoelectron occurring in the infinitesimal time t1dt:
| (4) |
| (5) |
We can extend this formulation to the subsequent N photoelectrons in a scintillation event. Since detecting consecutive photoelectrons are independent Poisson processes, the probabilities of detecting individual photoelectrons can be multiplied together to form the cumulative probability of detecting N photoelectrons at N distinct times. This cumulative probability is used as the continuous likelihood function:
| (6) |
Since the integration limits (ti−1 to ti for i from 0 to N) are continuous and sequential, the exponential term of (6) can be reduced as follows:
| (7) |
If tN (the time of the Nth photoelectron) is approximately equal to the energy integration time (175 ns), the integral in (7) reduces to one since ρ(t,q) is normalized over this interval. The continuous likelihood function then reduces to:
| (8) |
For computational simplicity, we instead use the log likelihood function:
| (9) |
In implementation, we omit the constant term Nln(dt) in the log likelihood function. We do not omit the −N̄ (q) terms since the mean total number of photoelectrons, assumed to be the photopeak position at each DOI position, varies with DOI and is therefore not a constant.
We use three methods to estimate DOI from the continuous log likelihood function lnL: these are referred to as max q, empirical and log ratio methods [Fig. 3]. Since q varies with DOI, the DOI of a scintillation event can be indirectly estimated by maximizing (9) with respect to q in the max q method [Fig. 3(a)]. Determining DOI in this way requires prior knowledge of how q varies with DOI. This is achieved using the training dataset: for each event in the training dataset, the log likelihood function is maximized with respect to q and the mean of the maximizing q values is found at each DOI position. These mean values of q are used to generate PDFs for each DOI position using (1). For a test event, for which the DOI is to be estimated, the log likelihood function is maximized using the pre-computed PDFs vs. DOI and the DOI corresponding to the PDF that maximizes the function is assigned to the test event.
Fig. 3.

DOI estimation procedures using the continuous or discrete likelihood models.
In the empirical method, we compute an empirical temporal PDF for each DOI by averaging the training dataset waveforms [Fig. 3(b)]. This method makes no assumptions on the physics governing the photoelectron times. Prior to averaging, the waveforms were time-aligned according to their timing pick-off. The empirical temporal PDFs are normalized to one satisfying the normalization of (1). The test event is assigned a DOI corresponding to the empirical PDF that maximizes the log likelihood function.
The third maximization scheme we implemented (log ratio) relies on computing the log ratio statistic [Fig. 3(c)], [21]; the difference between the log likelihood functions evaluated for two classes or parameter values:
| (10) |
The resulting log ratio statistic gives a measure of similarity of the pulse shape to each class. In our case, we use the theoretical PDF and compute ln(L1) with a high value of q (q1) and compute ln(L2) with a low value of q (q2). The values for q1 and q2 are fixed for all DOIs. Using (9) in (10), the continuous log ratio statistic reduces to the following:
| (11) |
Since q1 and q2 are fixed, the terms outside the summation are constant for all events and therefore do not affect the DOI estimation. To estimate DOI with this method, the mean log ratio statistic is found at each DOI using the training dataset and these mean values are stored in a look-up table (LUT). The log ratio statistic is computed for a test event and the DOI corresponding to the mean log ratio value in the LUT that most closely matches the test event is assigned to the test event.
C. Discrete ML Model Based on Time Bins
An approximation of the continuous ML model can be made by histogramming the photoelectron times into discrete time bins instead of considering each photoelectron separately. We again start with the Poisson probability and compute the probability of counting gj photoelectrons in a given time bin j if the mean is mj:
| (12) |
Since the Poisson photoelectron counting probabilities for separate time bins are independent, we can form the likelihood function by taking the product of each time bin probability (13) and simplifying further by computing the discrete log likelihood (14):
| (13) |
| (14) |
| (15) |
where n is the number of time bins. In implementation, we omit the term –ln(gj!) as it is constant for each event.
Similar to the continuous likelihood model, we investigate three ML methods with the discrete model (max q, empirical and log ratio [Fig.3]). For the max q method [Fig. 3(a)], the dependence of the discrete log likelihood function on q is through mj, which can be related to ρ(t,q) by:
| (16) |
The mean value of q at each DOI was found by maximizing the log likelihood function with respect to q with the training dataset to obtain all mj. Using the set of mj computed at each DOI, the log likelihood function is maximized for a test event and the event is assigned the corresponding DOI.
We also empirically compute the mean number of photoelectrons in each time bin by integrating the photodetector waveform, s(t), over each time bin using the training dataset [Fig. 3(b)]:
| (17) |
Using the empirical mj values computed at each DOI, the discrete log likelihood function is maximized for a test event and the event is assigned the DOI corresponding to the set of mj that maximized the log likelihood.
Lastly, we estimate DOI using the log ratio statistic [Fig. 3(c)] given in (10) and reduces to the following using (14):
| (18) |
Using (15) and (16) in (18) and reducing yields:
| (19) |
where:
| (20) |
The terms outside the summation of (19) are again constant for each event and do not affect DOI estimation. DOI estimation with the discrete log ratio method is performed as described for the continuous log ratio method.
D. Obtaining Photoelectron Times
A crucial component of the continuous likelihood model is determining the individual photoelectron times, ti from the measured waveforms. The photodetector waveform is the superposition of consecutive single photoelectron responses temporally distributed following the scintillation pulse shape. We developed a method to approximate the photoelectron times based on the measured photodetector waveform. The cumulative integral of the waveform was computed for all time points and linear interpolation was used to estimate the time of each photoelectron [Fig. 4]. We refer to this method as the sum-interpolation method.
Fig. 4.

Cumulative sum of the sample waveform and illustration of the sum-interpolation method for estimating the generation time of the 1500th photoelectron.
To qualitatively assess the extracted photoelectron time accuracy, the sample waveform was compared with a matched waveform built by convolving the extracted photoelectron times with the Gaussian single photoelectron response (measured in Section III.F) [Fig. 5]. There is good agreement between the measured sample waveform and the matched waveform, however the matched waveform is a smoothed representation of the measured waveform.
Fig. 5.
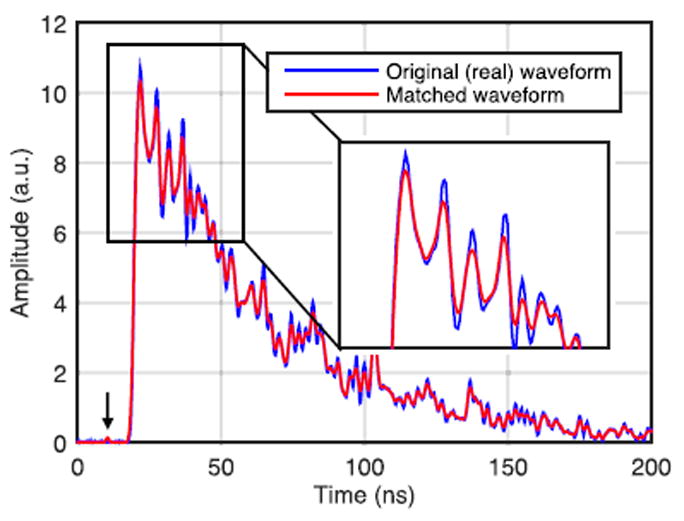
Original sample waveform (blue) and matched waveform (red) obtained using the sum-interpolation method.
The continuous log likelihood function (9) depends on the value chosen for t0. Since the true gamma interaction time is not known, we use the early photoelectron times to estimate t0. As the first few photoelectrons may be the result of noise or spurious generation of photoelectrons from the sum-interpolation method (see ~10 ns in Fig. 5), we discard the first four photoelectrons and t0 is assumed to be t5, the time of the fifth photoelectron. With the exception of spuriously generated early photoelectrons, the time difference between the first and fifth photoelectron is ~300 ps.
E. Deconvolution of the Single Photoelectron Response from the Photodetector Waveform
With an ideal single photoelectron response (i.e. a delta function), the individual photoelectron times can be exactly determined and would provide the ideal case for using the temporal distribution of photoelectrons for pulse shape discrimination. However, the finite width of the PMTs single photoelectron response influences the estimation of photoelectron times and is partially responsible for the smoothing of the matched waveform shown in Fig. 5. Therefore, it may be beneficial to deconvolve the single photoelectron response from the photodetector waveform prior to extracting photoelectron times.
A suitable deconvolution method is the Richardson-Lucy algorithm [22], [23]. This algorithm is commonly used to remove image blur arising from the imaging instrument’s point spread function (PSF); it assumes Poisson photon statistics and uses maximum likelihood to estimate the most probable image with a known point spread function (PSF), analogous to the ML-EM algorithm commonly encountered in PET image reconstruction. In our case, the observation s is the original photodetector waveform, and the PSF p is the single photoelectron response (measured in Section III-F) and d is the deconvolved waveform. The complete derivation of the iterative update equation is omitted here and presented only in its final form:
| (21) |
where ‘t’ is the iteration step, ‘*’ denotes the convolution operator and p̂ is the flipped PSF. The integral of p is assumed to normalized to one. The original waveform (i.e. before convolution) was used as the initial guess for d. The algorithm converged to its final solution after ~100 iterations and produces an estimate of the deconvolved waveform d.
We applied the sum-interpolation method to the deconvolved sample waveform to estimate photoelectron times and built a matched waveform by convolving the photoelectron times with the PMT single photoelectron response [Fig. 6]. There is considerably better agreement between the two waveforms compared with using the original waveform to estimate photoelectron times with the matched waveform producing a nearly exact copy of the measured waveform. This likely indicates more accurate estimation of photoelectron times which may be beneficial for ML DOI encoding with the continuous likelihood model.
Fig. 6.
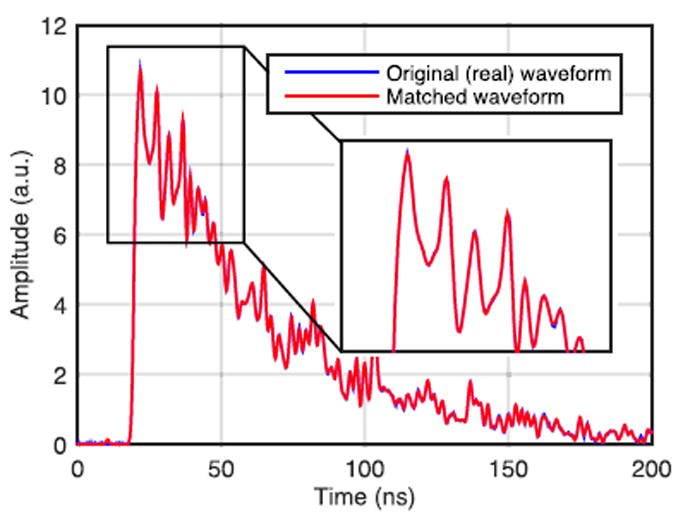
Original sample waveform (blue) and matched waveform (red) using the sum-interpolation method with the deconvolved waveform. The blue and red curves overlap almost completely.
Along with this, the deconvolved signal shows faster rise time and increased slope in the rising edge, which may be exploited for improved timing resolution [Fig. 7]. However, it is natural that this deconvolution algorithm also amplifies noise, which in turn may degrade the timing resolution.
Fig. 7.

Rising edge of the original PMT waveform (blue) and the deconvolved waveform (black).
F. Measurement of the Photodetector Single Photoelectron Response
To perform the deconvolution using (20) and to extract photoelectron statistics from the waveforms, the single photoelectron response of the photodetector should be measured through the charge collected and the pulse shape. The single photoelectron charge is used to convert the digitized waveforms into units of “photoelectrons vs. time” as described in Section II.B. The primary noise source in a PMT is thermal noise, which implies that one dark count corresponds to a single photoelectron. The PMT single photoelectron response can thus be approximated by measuring individual dark count pulses. With the PMT in a light tight enclosure, ~3000 dark counts were sampled at 20 GS/s using an oscilloscope, triggered at a threshold set just above electronic noise (~ 5% of single photoelectron pulse height). After baseline offset correction, the charge contained in each dark count was estimated by integrating the voltage trace and using Ohm’s law. The mean single photoelectron charge was found to be 0.12 +/− 0.04 pC, in good agreement with the theoretical single photoelectron charge of 0.1 pC given by the PMT gain multiplied by the electron charge. We applied a Gaussian fit to each digitized pulse to derive the single photoelectron pulse shape. The mean FWHM was 1.29 +/− 0.07 ns.
IV. Results
A. DOI Encoding
The DOI encoding results for all pulse shape discrimination methods are summarized in Fig. 8. Both crystals show very consistent improvements in DOI encoding with ML methods compared to DCI, while the LFS crystal demonstrates overall superior DOI encoding owing to its shorter decay time. This leads to more pronounced pulse shape differences as phosphor conversion increases. While all ML pulse shape discrimination methods showed considerable DOI encoding improvements, the best DOI encoding resulted from the continuous likelihood model with log ratio maximization, a ~27% improvement relative to DCI for both crystals.
Fig. 8.
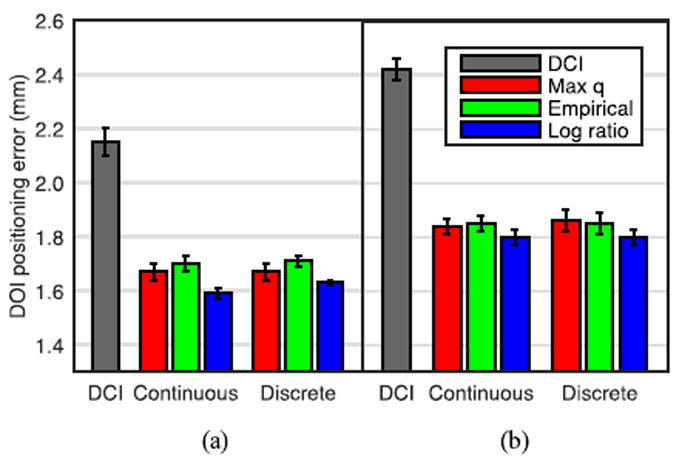
Comparison of DOI positioning error using DCI and ML pulse shape discrimination methods with (a) LFS crystal and (b) LYSO crystal. The improvement in DOI encoding with ML pulse shape discrimination vs. DCI were nearly identical for the LFS and LYSO crystals.
For ML estimation with the discrete likelihood model, the number and spacing of the time bins were optimized. We considered two cases for time bin allocation: linear and non-linear spacing. For the non-linear spacing, the width of the time bins were chosen such that on average, each bin contains approximately equal number of photoelectrons when q = 0.75 (approximately the median value over the five DOI positions from preliminary measurements). We computed DOI encoding over a range of 2 – 100 time bins [Fig. 9]. DOI error stabilized at ~16 time bins for all methods and there were no significant differences between linear and non-linear time bins. Therefore, linear bin spacing with 24 bins (~7 ns bin width) was used for all discrete DOI methods.
Fig. 9.
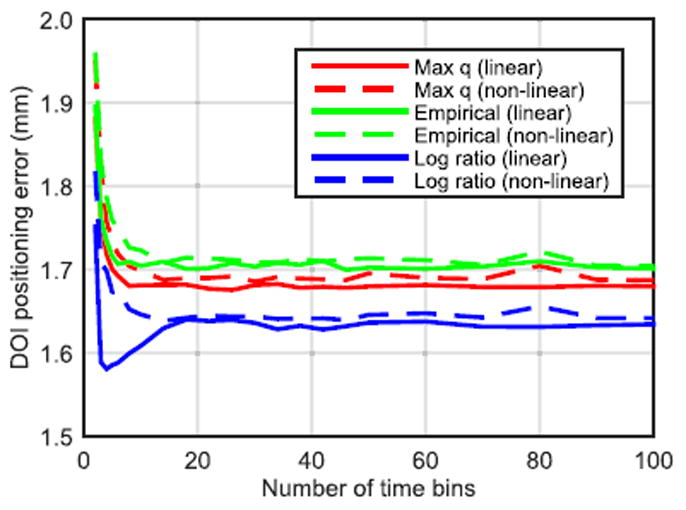
Effect of the number of time bins on DOI encoding using the discrete likelihood model. Solid lines are linearly spaced bins, dashed lines are nonlinearly spaced bins.
Lastly, the choice of q1 and q2 will impact the DOI encoding with log ratio methods. Using an exhaustive search over all possible values, we optimized the choice of the q1 and q2 by minimizing the DOI positioning error for both the continuous and discrete likelihood models. The final values for q1 and q2 were 0.4 and 0.95 for the continuous model and 0.3 and 0.75 for the discrete model. The same parameters were used for the LYSO dataset.
1) Effect of Deconvolution
Using the LFS crystal data, we found that deconvolving the single photoelectron response from the measured waveform did not impact the DOI encoding with the ML methods. Although extracting photoelectron times from the deconvolved waveform produces a closer match to the original (true) waveform, ML-based DOI encoding with the original and deconvolved waveforms were identical. This indicates that deconvolution does not improve the accuracy of estimating photoelectron times on a scale relevant to pulse shape discrimination with phosphor-coated crystals.
2) Effect of Single Photoelectron Charge Variations
All ML models presented are dependent on the single photoelectron charge, either for photoelectron counting (discrete model) or extracting photoelectron times (continuous model). We evaluated the effects of using an incorrect single photoelectron charge on DOI encoding using the LFS dataset. Varying the single photoelectron charge over a range of approximately +/-25% relative to our initial measurement (0.12 pC) for both the training and test data sets resulted in no effect on DOI encoding with the ML methods.
We also examined the effect of photoelectron charge drift (mimicking drift in the photodetector gain) on DOI encoding, as variations in the photoelectron charge between the training and test datasets may introduce bias in DOI positioning. We varied the single photoelectron charge value used for the test events while maintaining the measured single photoelectron charge for the reference data set and computed the resulting DOI encoding [Fig. 10]. The max q and empirical methods showed strong dependency on the photoelectron charge drift while the log ratio methods showed relatively weak dependence on the photoelectron charge drift.
Fig. 10.
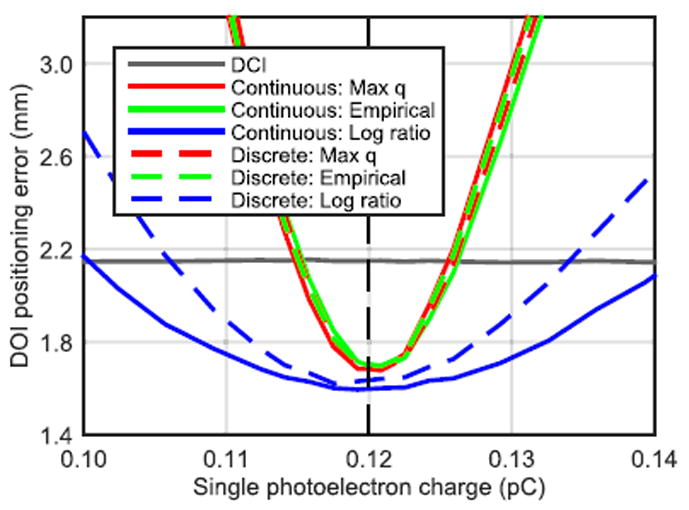
Impact of single photoelectron charge drift on DOI encoding. The vertical dashed line indicates the measured single photoelectron charge.
The continuous and discrete log likelihood functions used in the max q and empirical methods are proportional to N̄(q) and therefore, drift in single photoelectron charge introduced bias in the estimated DOIs. For example, if the single photoelectron charge drifts to a larger value, this will result in underestimating the total number of photoelectrons for the test events and hence bias the DOI positioning to DOIs nearer the phosphor-coated region (top of the crystal) since these DOIs have overall lower photopeak positions.
The effect of single photoelectron charge drift on DOI encoding with the log ratio methods is reduced since the dependence of the log ratio on N̄(q) is constant for all events. However, the log ratio statistics are still proportional to the total number of photoelectrons: the continuous log ratio statistic is calculated as a sum over N and therefore increased N results in a larger log ratio statistic (with the same underlying pulse shape), biasing the DOI estimate. Similarly, the discrete log ratio statistic is computed as a sum over gj, and therefore increasing gj results in a larger log ratio statistic.
In practice, gain drifts in the photodetectors are identified as part of routine quality control (drift of the photopeak). Therefore, depending on the time scale of gain drift (i.e. slow systematic changes or acute changes from temperature fluctuations), the ML DOI methods are unlikely to suffer from severely degraded accuracy since most gain drifts should be corrected.
3) Effect of Decay Time Variations
The ML models making use of the theoretical photoelectron PDF (i.e. max q and log ratio methods) are dependent on the decay times used for the scintillator and the phosphor. In our study, we were able to measure the decay times of the crystals before applying the phosphor coating, however this may not be feasible when building complete detector modules. To quantify the sensitivity of DOI encoding to variations in decay times, we varied both the LFS and YAG:Ce decay times over a +/- 4 ns range [Fig. 11]. Only minor changes in DOI encoding are introduced in this range of decay time variations. In general, all methods tend to favor over-estimating both the decay times, however the changes are small.
Fig. 11.
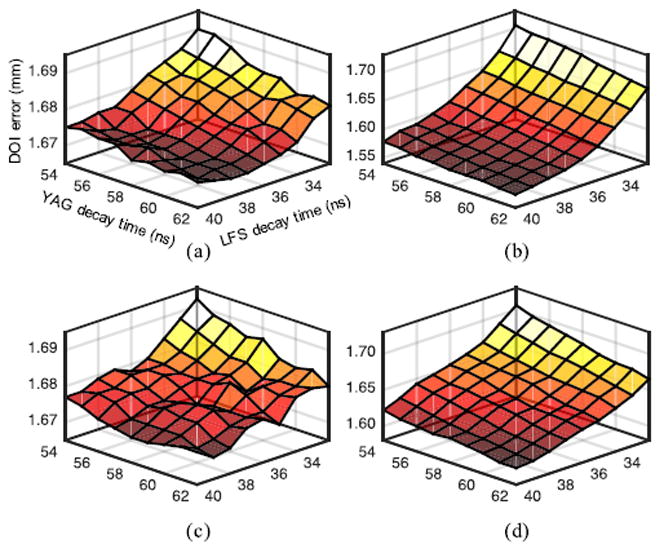
Effect of decay time variation on DOI encoding for (a) continuous max q, (b) continuous log ratio, (c) discrete max q and (d) discrete log ratio. Note the different z axis ranges for each panel. The axis labels are the same for each panel.
B. Energy Resolution
With long, narrow scintillator crystals, the light collection strongly depends on the DOI even with all crystal surfaces polished. This effect is further amplified with the use of phosphor-coated crystals (and many other DOI encoding methods) readout with PMTs as 1) light loss out of the crystal sides is increased due to the coating and 2) the PMT quantum efficiency is decreased for longer wavelengths characteristic of the phosphor emission (from ~25% to 10%). These effects lead to degraded energy resolution. However, if DOI is measured with sufficient precision, it is possible to use the measured relationship between DOI and photopeak position to correct for the DOI blurring and achieve a more accurate estimate of the deposited energy.
Using head-on irradiation data, the energy (number of photoelectrons) and DOI were estimated for each test event. We compared DOI estimation using the ML continuous log ratio and DCI methods to depth-correct the energy. Since the gamma DOI is not controlled with head-on irradiation, we estimated the DOI on a continuous range between 0 and 20 mm. Linear interpolation was used to estimate the trends of the 511 keV photopeak position and the log ratio statistic for all DOIs. We computed the ratio of the test event’s number of photoelectrons to the photopeak position at the estimated depth and assumed linearity to estimate the deposited energy.
Table I summarizes the uncorrected, DOI corrected and average side-on energy resolutions for both crystals. The continuous log ratio DOI estimate allows recovery of the average side-on energy resolution, a considerable improvement from the uncorrected head-on energy resolution.
TABLE I.
Energy Resolution
| LFS | LYSO | |
|---|---|---|
| Uncorrected | 13.4+-0.2 | 13.5+-0.2 |
| DOI corrected (ML) | 11.3+-0.2 | 11.3+-0.1 |
| DOI corrected (DCI) | 12.5+-0.1 | 12.7+-0.2 |
| Average side-on | 11.2 | 11.3 |
Energy resolution (%) obtained with head-on irradiation and after DOI correction.
C. Timing Resolution
We used the Richardson-Lucy deconvolution algorithm to deconvolve the photodetector’s single photoelectron response from the measured waveforms to improve timing resolution. As demonstrated previously, the deconvolved signal shows faster rise time and increased slope in the rising edge but with amplified noise so the impact on timing resolution is not clear.
We also used our DOI estimate to account for DOI dependent changes in timing pick-off. Variable DOI in long crystals causes differences in scintillation photon transit time, which biases the timing pick-off and degrades timing resolution. Along with this, pulse height differences lead to changes in the rising edge slope, which also biases the timing pick-off with leading edge discrimination, commonly referred to as time-walk. Therefore, we performed two separate correlations to correct for DOI and time-walk: first a linear correlation was applied between the continuous log ratio statistic and the timing data and the timing data were corrected according to the slope of the linear fit. The linear correlation between these DOI corrected timing data and their respective energy values (a surrogate measure of the rising edge slope) was found and the timing data were further corrected to compensate for time-walk.
Timing resolution was computed by applying a Gaussian fit to the histogram of the timing data. The contribution of the reference detector (220 ps FWHM) was subtracted in quadrature from the Gaussian fit FWHM and the expected coincidence timing resolution of two identical test detectors is reported.
We first investigated timing resolution vs. the maximum number of iterations used in the Richardson-Lucy algorithm with one LFS head-on dataset and found that timing resolution stabilized at ~75 iterations for both cases. Fig. 12 illustrates the impact of DOI and time-walk correction, as well as deconvolution on coincidence timing resolution for both crystals. The leading edge threshold was optimized separately for the deconvolved waveforms. Both crystals show significant improvements in timing resolution after deconvolution while DOI and time-walk correction only account for minor timing resolution improvements. The LFS crystal shows a slightly larger improvement (13%) compared to the LYSO crystal (8%).
Fig. 12.
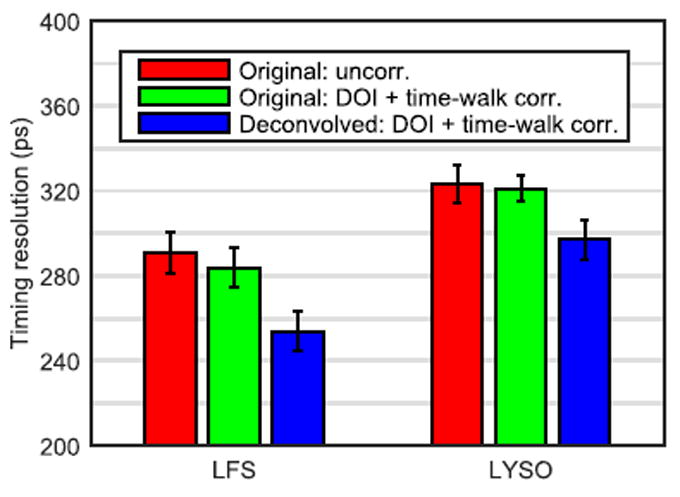
Comparison of coincidence timing resolution computed with the original waveforms (red), the original waveforms with DOI and time-walk correction (green) and the deconvolved waveforms with DOI and time-walk correction (blue).
V. Discussion
The aim of this work was to demonstrate how maximum likelihood methods can be used to provide a better estimate of deposited energy, DOI and interaction time from the digitized waveforms in a gamma ray detector based on phosphor-coated crystals suitable for PET. First, we developed several ML pulse shape discrimination methods that showed considerable improvement in DOI encoding compared to conventional pulse shape discrimination methods previously investigated with phosphor-coated crystals (DCI, decay time fitting).
The log ratio methods provided slightly superior DOI encoding compared to the direct log likelihood maximization methods. This is somewhat surprising as one may expect the methods involving log likelihood maximization to provide the best DOI encoding. However, the discrepancy can be explained by considering the effect of photoelectron charge drift on DOI encoding for each ML method. As described and demonstrated in Section IV-A(2), the log ratio methods are least susceptible to photoelectron charge drift and therefore, DOI encoding with these methods are least dependent on fluctuations in the total number of photoelectrons for different events. This can be used to explain differences in DOI encoding between the direct maximization methods and the log ratio methods: All events in the energy window were treated equally and therefore, since the max q and empirical methods show a strong dependency on photoelectron charge drift, their DOI estimates are more strongly influenced by the random total number of photoelectrons for each event as a result of the crystal’s energy resolution compared to the log ratio methods. To verify this hypothesis, DOI positioning error with the LFS crystal was recalculated with a narrower energy window of 480 – 550 keV in order to limit the influence of random total number of photoelectrons on ML DOI estimation (Table II). With the narrowed energy window, the max q methods produce the best DOI positioning while the log ratio methods show the poorest among all ML methods. DCI-based DOI encoding was not affected by the modified energy window. With the narrow energy window, continuous max q provided 42% improved DOI encoding from DCI.
In practice, the discrete likelihood model will likely be easier to implement in hardware and allow faster data processing than the continuous model since it only requires integrating the photodetector waveform over relatively coarse time intervals to count the number of photoelectrons in several time bins. This could be achieved with sampling rates of ~100 MS/s provided the ADC digitizes the integrated waveform value between clock cycles rather than the instantaneous waveform amplitude. The continuous likelihood model requires extracting the photoelectron times from the measured photodetector waveform; the ability to do so accurately strongly depends on the sampling rate. With coarse sampling, the estimated photoelectron times will be subject to interpolation between waveform samples and most of the high frequency information will be lost.
Along with this, all the terms in the likelihood equations containing reference parameters (e.g. N̄(q), ln(mj), etc) would be stored in memory so that only multiplication and summation are required to be implemented in front-end hardware, such as in FPGAs. Here again, the discrete method would allow faster data processing since the number of multiplication operations is equal to the number of time bins (24 in this study) instead of evaluating ln(ρ(t,q)) for each photoelectron (several thousand) in the continuous method. The maximization step required for the empirical and max q methods may also limit data processing speeds, however this will depend on the maximization strategy used. There would be no difference in computational speed between the max q and empirical methods as these methods only differ in the way the reference values are obtained. The log ratio methods have the advantage of not requiring a maximization operation, only a simple LUT search to estimate DOI. Therefore, we expect the discrete log ratio method to be easiest to implement and provide the fastest data processing. This technique may be implemented in the openPET (or similar) electronics [24] since this platform digitizes the waveforms at 80 MS/s leading to a minimum time bin width of 12.5 ns (equivalent to ~14 time bins in this study). These digital samples would be converted to the number of photoelectrons in each time bin and used to compute the log ratio value using (21). The LUT search step to determine DOI could then be performed either on or off-line. Based on these considerations, we expect only small differences in computational intensiveness between the discrete log ratio method and the DCI method.
We demonstrated that with DOI estimation provided by our ML methods, head-on energy resolution degradation caused by depth-dependent changes in light collection greatly reduced and that the DOI correction scheme recovered the average side-on energy resolution (11.3%). Prior to phosphor coating, the head-on energy resolutions of both crystals were ~12%.
Applying an ML-based algorithm to deconvolve the photodetector’s single photoelectron response from the waveforms provided a significant improvement in timing resolution for both crystals (13% and 8% improvement in coincidence timing resolution with the LFS and LYSO crystals, respectively). Deconvolution increased the slope of the waveform’s rising edge, resulting in a more precise timing pick-off for each waveform. Conversely, using our estimate of DOI to counter depth-dependent changes in timing pick-off and applying pulse height time-walk correction did not considerably improve timing resolution for either crystal. This can be explained with side-on measurements: With these polished crystals, we did not observe considerable changes in timing pick-off along the length of the crystal (i.e. < 80 ps end-to-end difference), therefore the intrinsic timing resolution of the scintillator dominates the overall timing resolution. To perform the deconvolution, the single photoelectron pulse shape should be known accurately to avoid artifacts in the deconvolved waveforms. Therefore, the single photoelectron pulse shape may need to be measured for each photodetector used if the variability in pulse shape is non-negligible.
The ML methods presented here are suitable for pulse shape discrimination beyond the use of phosphor-coated crystals. With minor modifications to the likelihood functions, these methods could be extended to other DOI encoding methods based on manipulating temporal properties of photoelectrons. Although the log ratio methods provided the best DOI encoding, these relied on prior knowledge of the underlying photoelectron temporal PDF, which may not be possible with other methods. However, the empirical methods made no assumptions about the PDF and can be readily applied to other detectors requiring pulse shape discrimination.
Further, the ML pulse shape discrimination methods are suitable to photodetectors aside from single channel PMTs. The ML theory made little assumption about the photodetector and could be easily applied to other photon counting detectors. However, the accuracy of any pulse shape discrimination method will depend on the shape of the single photoelectron response. A wider single photoelectron response leads to increased superposition of consecutive photoelectrons which serves to “smooth” the finest level of timing information available for pulse shape discrimination: the individual photoelectron times. Background or correlated noise was neglected in our ML models, which may not be so readily applicable to other detectors with higher noise (i.e. SiPMs). Typical SiPM pixels demonstrate higher dark count rate, optical cross-talk and delayed correlated noise and so noise terms may need to be added to the likelihood models.
Next, we will apply the ML pulse shape discrimination methods in a complete block detector with an array of phosphor-coated crystals and will include ML methods based on the number of photoelectrons in each photodetector to estimate the most probable crystal and depth of the gamma interaction. In this way, we will use ML methods to estimate all three coordinates of the photon interaction position in the scintillator array.
Acknowledgments
The authors thank Zecotek Photonics Inc. and Crystal Photonics Inc. for supplying the crystal samples and other members of the research group for valuable discussions related to this work.
This work was supported in part by NIH Grant R01 CA170874, by a UC Davis Research Investment in Science and Engineering grant, and by the Natural Sciences and Engineering Research Council of Canada.
Contributor Information
Eric Berg, Email: eberg@ucdavis.edu.
Emilie Roncali, Email: eroncali@ucdavis.edu.
Will Hutchcroft, Email: wahutchcroft@ucdavis.edu.
Jinyi Qi, Email: qi@ucdavis.edu.
Simon R. Cherry, Email: srcherry@ucdavis.edu.
References
- 1.Ito M, Hong SJ, Lee JS. Positron emission tomography (PET) detectors with depth-of- interaction (DOI) capability. Biomed Eng Lett. 2011;1:70–81. [Google Scholar]
- 2.Du H, Yang Y, Glodo J, Wu Y, Shah K, Cherry SR. Continuous depth-of-interaction encoding using phosphor-coated scintillators. Phys Med Biol. 2009;54:1757–1771. doi: 10.1088/0031-9155/54/6/023. [DOI] [PMC free article] [PubMed] [Google Scholar]
- 3.Inadama N, Murayama H, Omura T, Yamashita T, Yamamoto S, Ishibashi H, et al. A depth of interaction detector for PET with GSO crystals doped with different amounts of Ce. IEEE Trans Nucl Sci. 2002;49:629–633. [Google Scholar]
- 4.Karp JS, Daube-Witherspoon ME. Depth-of-interaction determination in NaI (Tl) and BGO scintillation crystals using a temperature gradient. Nucl Instrum Methods Phys Res A. 1987;260:509–517. [Google Scholar]
- 5.Schmall JP, Roncali E, Berg E, Viswanath V, Du J, Cherry SR. Timing properties of phosphor-coated polished LSO crystals. Phys Med Biol. 2014;59:N139. doi: 10.1088/0031-9155/59/15/N139. [DOI] [PubMed] [Google Scholar]
- 6.Schmand M, Eriksson L, Casey M, Andreaco M, Melcher C, Wienhard K, et al. Performance results of a new DOI detector block for a high resolution PET-LSO research tomograph HRRT. IEEE Trans Nucl Sci. 1998;45:3000–3006. [Google Scholar]
- 7.Wiener R, Surti S, Karp JS. DOI determination by rise time discrimination in single-ended readout for TOF PET imaging. IEEE Trans Nucl Sci. 2013;60:1478–1486. doi: 10.1109/tns.2013.2243166. [DOI] [PMC free article] [PubMed] [Google Scholar]
- 8.Barrett HH, Hunter WCJ, Miller BW, Moore SK, Chen Y, Furenlid LR. Maximum-likelihood methods for processing signals from gamma-ray detectors. IEEE Trans Nucl Sci. 2009;56:725–735. doi: 10.1109/tns.2009.2015308. [DOI] [PMC free article] [PubMed] [Google Scholar]
- 9.Gray RM, Macovski A. Maximum a posteriori estimation of position in scintillation cameras. IEEE Trans Nucl Sci. 1976;23:849–852. [Google Scholar]
- 10.Joung J, Miyaoka RS, Lewellen TK. cMiCE: a high resolution animal PET using continuous LSO with a statistics based positioning scheme. Nucl Instrum Methods Phys Res A. 2002;489:584–598. [Google Scholar]
- 11.Milster T, Selberg L, Barrett H, Easton R, Rossi G, Arendt J, et al. A modular scintillation camera for use in nuclear medicine. IEEE Trans Nucl Sci. 1984;31:578–580. [Google Scholar]
- 12.Gagnon D, Pouliot N, Laperriere L, Therrien M, Olivier P. Maximum likelihood positioning in the scintillation camera using depth of interaction. IEEE Trans Med Imag. 1993;12:101–107. doi: 10.1109/42.222673. [DOI] [PubMed] [Google Scholar]
- 13.Hunter WC, Barrett HH, Furenlid LR. Calibration method for ML estimation of 3D interaction position in a thick gamma-ray detector. IEEE Trans Nucl Sci. 2009;56:189–196. doi: 10.1109/TNS.2008.2010704. [DOI] [PMC free article] [PubMed] [Google Scholar]
- 14.Lee MS, Lee JS. Depth-of-interaction measurement in a single-layer crystal array with a single-ended readout using digital silicon photomultiplier. Phys Med Biol. 2015;60:6495–6514. doi: 10.1088/0031-9155/60/16/6495. [DOI] [PubMed] [Google Scholar]
- 15.Ling T, Lewellen T, Miyaoka R. Depth of interaction decoding of a continuous crystal detector module. Phys Med Biol. 2007;52:2213–2228. doi: 10.1088/0031-9155/52/8/012. [DOI] [PubMed] [Google Scholar]
- 16.Moore S, Hunter W, Furenlid L, Barrett H. Maximum-likelihood estimation of 3D event position in monolithic scintillation crystals: Experimental results. IEEE Nuclear Science Symp Conf Record. 2007:3691–3694. doi: 10.1109/NSSMIC.2007.4436923. [DOI] [PMC free article] [PubMed] [Google Scholar]
- 17.Roncali E, Viswanath V, Cherry SR. Design considerations for DOI-encoding PET detectors using phosphor-coated crystals. IEEE Trans Nucl Sci. 2014;61:67–73. [Google Scholar]
- 18.Yang Y, Dokhale PA, Silverman RW, Shah KS, McClish MA, Farrell R, et al. Depth of interaction resolution measurements for a high resolution PET detector using position sensitive avalanche photodiodes. Phys Med Biol. 2006;51:2131–2142. doi: 10.1088/0031-9155/51/9/001. [DOI] [PubMed] [Google Scholar]
- 19.Roncali E, Phipps JE, Marcu L, Cherry SR. Pulse shape discrimination and classification methods for continuous depth of interaction encoding PET detectors. Phys Med Biol. 2012;57:6571–6585. doi: 10.1088/0031-9155/57/20/6571. [DOI] [PMC free article] [PubMed] [Google Scholar]
- 20.Cleveland BT. The analysis of radioactive decay with a small number of counts by the method of maximum likelihood. Nucl Instrum Methods Phys Res A. 1983 Jan 9;214:451–458. [Google Scholar]
- 21.Lippincott W, Coakley KJ, Gastler D, Hime A, Kearns E, McKinsey D, et al. Scintillation time dependence and pulse shape discrimination in liquid argon. Phys Rev C. 2008;78:035801. [Google Scholar]
- 22.Lucy LB. An iterative technique for the rectification of observed distributions. Astron J. 1974;79:745–754. [Google Scholar]
- 23.Richardson WH. Bayesian-based iterative method of image restoration. JOSA. 1972;62:55–59. [Google Scholar]
- 24.Moses WW, Buckley S, Vu C, Peng Q, Pavlov N, Choong WS, Wu J, Jackson C. openPET: a flexible electronics system for radiotracer imaging. IEEE Trans Nucl Sci. 2010;57:2532–2537. doi: 10.1109/NSSMIC.2009.5401797. [DOI] [PMC free article] [PubMed] [Google Scholar]


