Abstract
Ribosome-associated factors must faithfully decode the limited information available in nascent polypeptides to direct them to their correct cellular fate1. It is unclear how the low complexity information exposed by the nascent chain suffices for accurate recognition by the many factors competing for the limited surface near the ribosomal exit site2,3. Questions remain even for the well-studied cotranslational targeting cycle to the endoplasmic reticulum (ER), involving recognition of linear hydrophobic Signal Sequences (SS) or Transmembrane Domains (TMD) by the Signal Recognition Particle (SRP)4,5. Intriguingly, SRP is in low abundance relative to the large number of ribosome nascent chain complexes (RNCs), yet it accurately selects those destined to the ER6. Despite their overlapping specificities, SRP and the cotranslational Hsp70 SSB display exquisite mutually exclusive selectivity in vivo for their cognate RNCs7,8. To understand cotranslational nascent chain recognition in vivo, we interrogated the cotranslational membrane targeting cycle using ribosome profiling (herein Ribo-seq)9 coupled with biochemical fractionation of ribosome populations. Unexpectedly, SRP preferentially binds secretory RNCs before targeting signals are translated. We show non-coding mRNA elements can promote this signal-independent SRP pre-recruitment. Our study defines the complex kinetic interplay between elongation and determinants in the polypeptide and mRNA modulating SRP-substrate selection and membrane targeting.
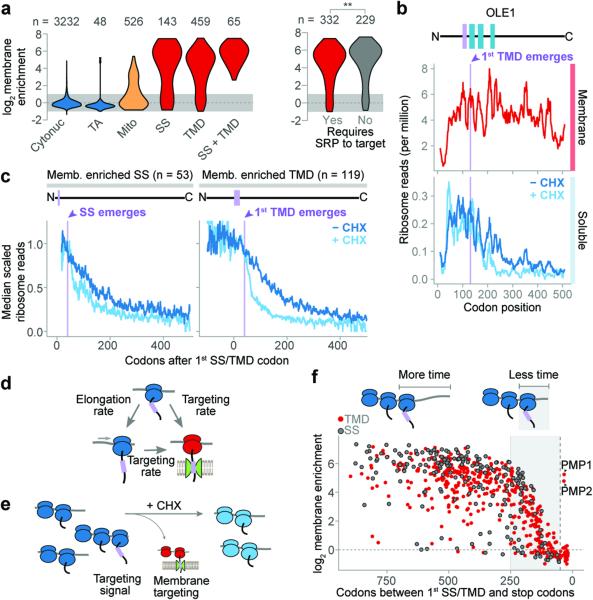
Secretory proteins are proposed to target to the ER membrane either co- or post-translationally for subsequent translocation10–12. Mechanistic models of ER targeting and the role of SRP derive primarily from cell-free systems using model proteins10,13, raising the question of how these pathways function in the cell. To investigate membrane targeting in vivo, we fractionated soluble and membrane-attached ribosomes from yeast cells, and then used Ribo-seq to compare the ribosome-protected mRNA footprints from polysomes obtained from both fractions (Extended Data Fig. 1a). We derived a cotranslational membrane enrichment score for each coding sequence (Methods, Extended Data Fig. 1b, Supplementary Table 1). Transcripts encoding cytosolic or nuclear proteins (herein cytonuclear) were preferentially translated on cytosolic ribosomes and not enriched on membrane polysomes (Fig. 1a). Tail-anchored (TA) proteins, whose single TMD at the carboxyl terminus is only revealed posttranslationally14, were also translated on cytosolic ribosomes. In contrast, many nuclear-encoded mitochondrial protein transcripts were enriched in the membrane-bound ribosome fraction, as expected15. Transcripts encoding ER-destined secretory proteins were highly enriched on membrane-bound ribosomes. Proteins containing a SS or TMD had comparable cotranslational membrane enrichment, conflicting with the notion that the targeting signal itself distinguishes which proteins are targeted co- or post-translationally to the ER11,12 (Fig. 1a).
Figure 1. Cotranslational membrane enrichment.
a, Distributions of the open reading frame (ORF) enrichment of ribosome-protected reads in the membrane fraction over the soluble fraction. ORFs were alternatively classified by expected SRP dependence11. **p ≤ 0.01, Wilcoxon rank-sum test. b, Ribosome-protected reads at each codon of an example transmembrane protein OLE1. Membrane topology is indicated above, with the first TMD in lavender. c, Metagene analysis of soluble fraction polysome-protected reads from transcripts that were at least 2-fold membrane enriched. ORFs were aligned at the targeting signal and scaled. d, Cotranslational membrane targeting is in competition with elongation. e, Elongation inhibitors provide additional time for polysomes exposing a targeting signal to localize to the membrane. f, Membrane enrichment was limited by the length of the reading frame remaining after the encoding of targeting signals. The vertical dashed line indicates 50 codons.
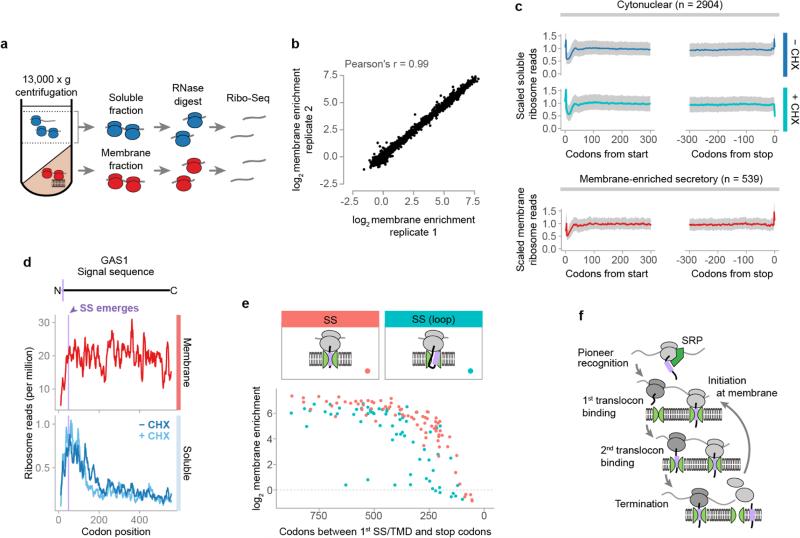
Ribosome profiling provides a snapshot of the abundance of ribosomes at each codon of each mRNA9, revealing the dynamics of translation on soluble versus membrane-bound ribosomes. For cytonuclear proteins, soluble ribosome-protected reads were distributed across the entire reading frame, consistent with complete translation in the cytosol (Extended Data Fig. 1c). For secretory proteins, both soluble and membrane-bound polysomes produced protected reads. Cytosolic translation represented only a small fraction of any given secretory transcript, and most of the secretory mRNA pool was membrane anchored. In the classical understanding of cotranslational targeting, secretory protein RNCs bind to the membrane only after exposing a targeting signal4. Thus, there should be fewer RNCs found on the membrane translating the portion of transcripts not yet targeted, i.e. at codon positions upstream of the first SS or TMD. However, the membrane-bound ribosome-protected reads were evenly distributed across the entire transcript (Fig. 1b and Extended Data Fig. 1c, d). This suggests that once targeted, secretory mRNAs remain associated to the ER and their translation initiates at the membrane. This is consistent with the observed proximity of secretory RNCs to the translocon before synthesis of the targeting signal16. The small fraction of secretory mRNA in cytoplasmic pre-targeted RNCs likely represents the pioneer round of targeting.
The positioning of soluble ribosomes along mRNA provides insight into how secretory transcripts are targeted to the membrane. The highest read density for these messages mapped 5′ of the region encoding the first SS or TMD; read density declined after the first targeting signal was exposed by the ribosome, as expected from cotranslational signal-dependent targeting of soluble RNCs to the membrane (Fig. 1b, c and Extended Data Fig. 1d). Surprisingly, the loss of reads after signal emergence was gradual, resulting in many RNCs that remained soluble for hundreds of residues after SS or TMD exposure. This result was inconsistent with the elongation attenuation activity proposed for SRP17,18 and suggests that elongation continues on cytosolic RNCs upon exposure of a targeting signal (see Supplementary Discussion).
The idea that there is a kinetic competition between continuing elongation in the cytosol and RNC targeting to the membrane makes two testable predictions (Fig 1d). First, pharmacologic inhibition of elongation with cycloheximide (CHX) should decouple these processes, enhancing targeting of translocation competent RNCs and promoting their depletion from the soluble fraction (Fig. 1e). Cells were subjected to a brief two-minute CHX incubation prior to Ribo-seq analysis of soluble and membrane-bound polysomes. Importantly, such brief incubation did not perturb non-secretory polysomes (Extended Data Fig. 1c). In contrast, CHX treatment drastically reduced the soluble secretory reads, but only after cytosolic RNCs exposed the first SS or TMD, i.e. 40 codons after its synthesis (Fig. 1b, c and Extended Data Fig. 1d).
The kinetic competition between targeting and elongation predicts that cotranslational membrane attachment is influenced by translation termination. In the absence of an elongation arrest, the probability of RNCs reaching the membrane cotranslationally will decrease as the first SS or TMD is found closer to the C-terminus (Fig. 1f and Extended Data Fig. 1e). Indeed, we observed a decline in the maximum membrane enrichment of secretory RNCs when the first targeting signal is near the C-terminus. Thus, secretory proteins with a late targeting signal, SS or TMD, must be targeted to the ER posttranslationally (Supplementary Discussion). Overall, our data suggest that cotranslational targeting to the ER in yeast is accomplished via a pioneer round of translation on soluble ribosomes that establishes a pool of ER-residing mRNA that initiate translation at the membrane (Extended Data Fig. 1f).
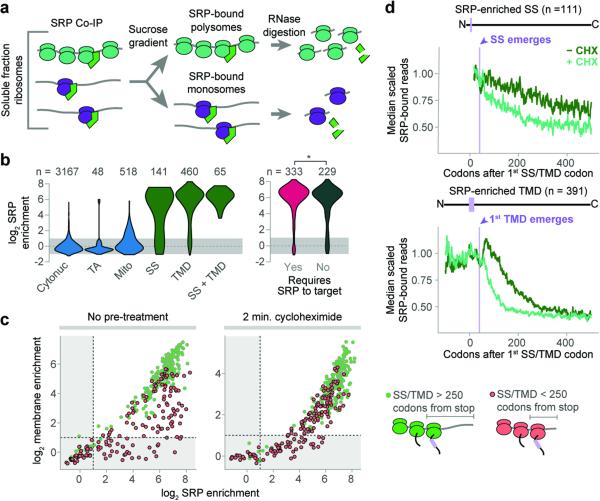
We next determined which RNCs are substrates of SRP in vivo. Immunoprecipitation of Srp72p from total soluble RNCs was followed by ribosome profiling of both SRP-associated polysomes and monosomes (Fig. 2a and Extended Data Fig. 2a). Few transcripts encoding cytonuclear or mitochondrial proteins were enriched on SRP, confirming its specificity towards ER-destined transcripts. Strikingly, SRP bound to all secretory RNCs that were cotranslationally targeted to the membrane, including SRP-dependent and SRP-independent proteins (Fig. 2b, c).
Figure 2. Cotranslational enrichment of SRP.
a, Srp72p-TAP was immunoprecipitated from the total soluble fraction. SRP-bound monosomes and polysomes were separated by sucrose gradient ultracentrifugation. b, Distributions of the ORF enrichment of ribosome-protected reads from SRP-bound soluble polysomes over the total soluble polysomes. ORFs were alternatively classified by expected SRP dependence11. *p ≤ 0.05, Wilcoxon rank-sum test. c, Cotranslational membrane-fraction enrichment compared to SRP enrichment. d, Metagene analysis of soluble SRP-bound polysome-protected reads from transcripts that are at least 2-fold SRP-enriched. ORFs were aligned at the targeting signal and scaled.
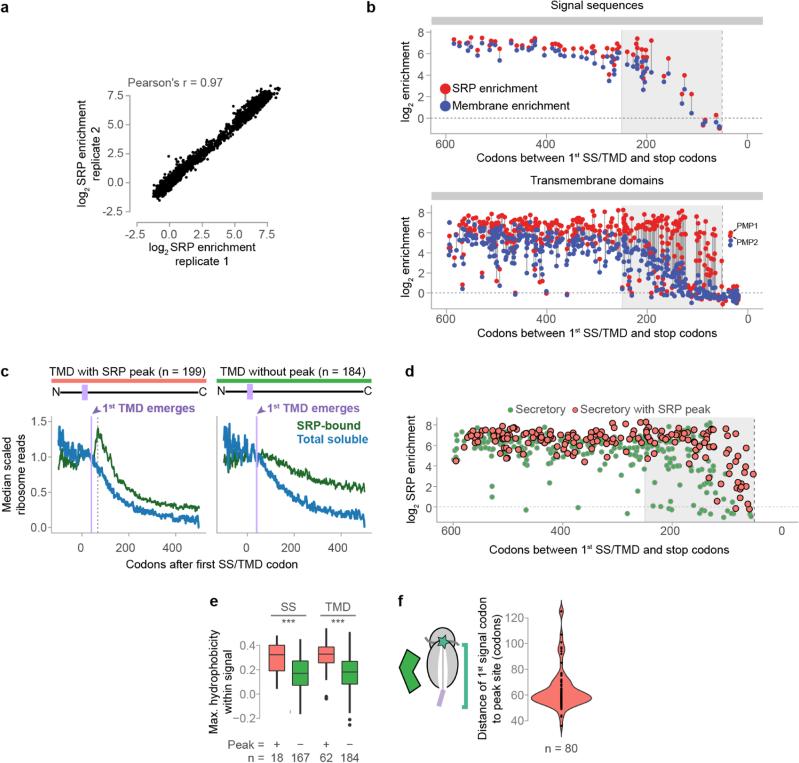
The number of ribosome-protected reads from soluble, SRP-bound transcripts diminished following ribosome exposure of the first SS or TMD, as expected from its targeting function (Fig. 2d). The loss was gradual and many SRP-RNCs remained soluble well after the targeting signal became fully exposed to the cytosol. This supports the notion that elongation proceeds on cytosolic ribosomes even after SRP binds, in contrast with the expected SRP-induced elongation arrest. Indeed, blocking elongation with CHX for 2 min prior to lysis caused a marked depletion in SRP-bound reads, but only for RNCs exposing their first targeting signal (Fig. 2d). In principle, the delayed targeting of soluble RNCs to the membrane after SS/TMD emergence could reflect a delay in SRP binding rather than a lack of elongation arrest. Comparing SRP and membrane enrichment to transcripts indicated this is not the case. RNCs encoding late targeting signals, i.e. near the C-terminus, still bound SRP but did not target to the ER membrane (Supplementary Discussion, Fig 2c, and Extended Data Fig. 2b–d). Addition of CHX allowed these late-signal RNCs to enrich at the membrane, indicating the RNC-SRP complexes are competent for ER- targeting. We conclude SRP binds the nascent chain quickly, and continued elongation causes termination of late signals prior to targeting.
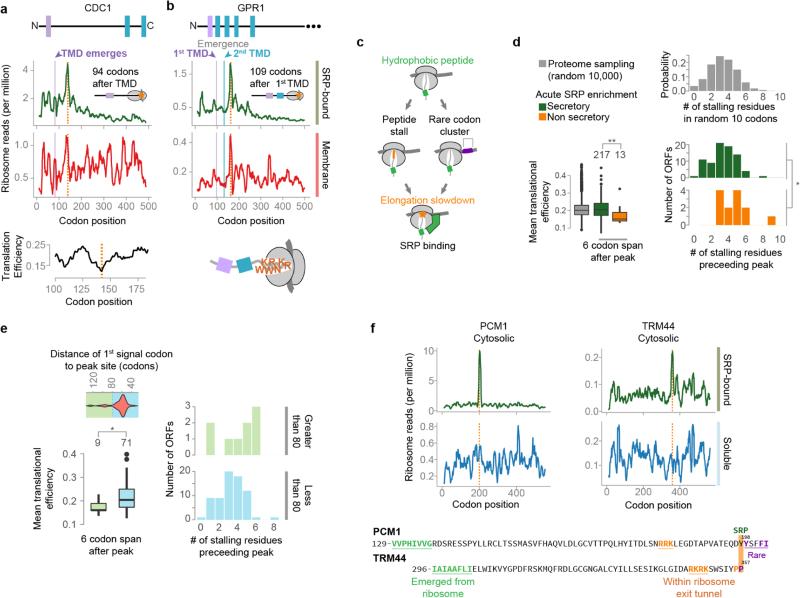
While elongation arrest is not a general consequence of SRP binding in vivo, recent work showed that a rare-codon directed slowdown of elongation facilitates SRP binding19. An intrinsic, non-SRP-dependent elongation slowdown should increase ribosome-protected reads at the same codon in both soluble SRP-bound polysomes and membrane-bound polysomes. Indeed, several transcripts presented such local increases in ribosome-protected reads at sites corresponding to exposure of a targeting signal on the ribosome (Extended Data Fig. 3a–c). Distinct elongation attenuation mechanisms observed at these sites included clusters of rare codons19 and stalling polypeptide elements, such as stretches of positively charged amino acids, or proline motifs, positioned within the exit tunnel20,21. While most secretory transcripts were not significantly enriched in these attenuator elements compared to the proteome (Extended Data Fig. 3d, e), the few non-secretory proteins that cotranslationally bound to SRP were enriched in elongation attenuation elements positioned at sites that exposed a near-cognate hydrophobic sequence for SRP-binding (Extended Data Fig. 3d, f). We speculate the presence of such elements enhances SRP recognition of the near-cognate hydrophobic tracts in these non-secretory proteins.
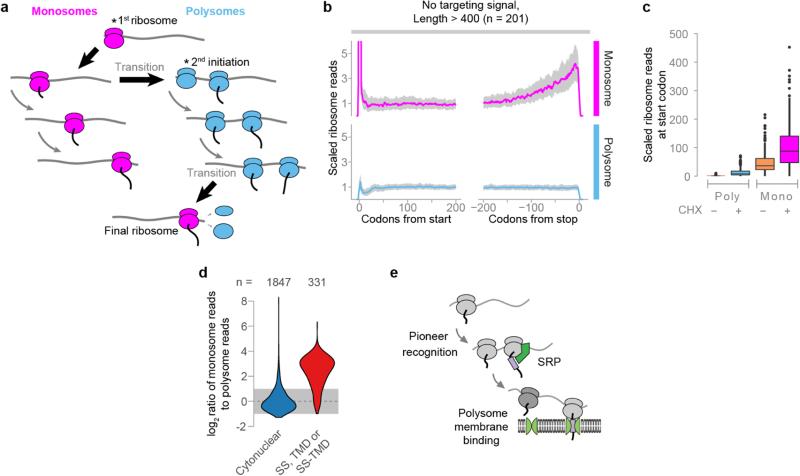
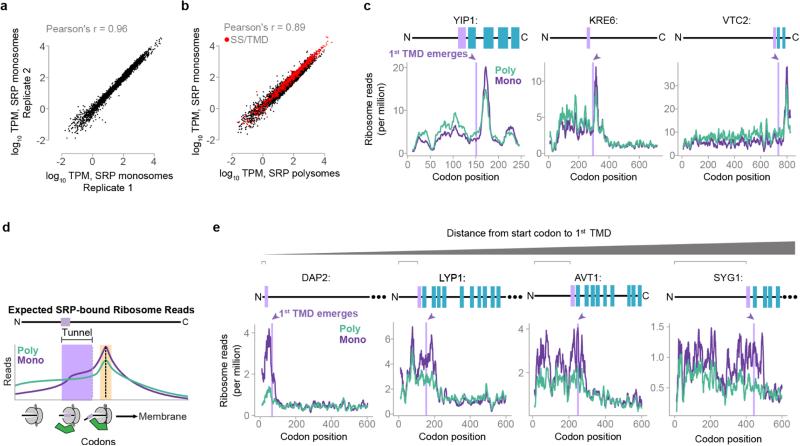
To understand the basis for the specificity of SRP in vivo, we next determined the initial point of SRP recruitment to ribosomes translating secretory proteins. Since polysomes require only a single SRP-bound ribosome to co-purify with Srp72p, additional strategies were necessary to identify mRNA footprints originated from a single SRP-bound ribosome. We developed a protocol using in vivo monosomes to identify the initial SRP binding event on RNCs (Fig. 2a). At any given time, a fraction of transcripts contain only a single actively translating ribosome (Extended Data Fig. 4a). Total soluble monosomes yield a similar distribution of protected reads compared to polysomes (Extended Data Fig. 4b–e and Supplementary Discussion). We separated soluble SRP-bound monosomes from SRP-bound polysomes and subjected both fractions to Ribo-seq analysis (Extended Data Fig. 5a–b). Of note, the monosomes were necessarily bound to SRP during the purification, and thus should reveal which codons are responsible for the initial SRP recruitment step.
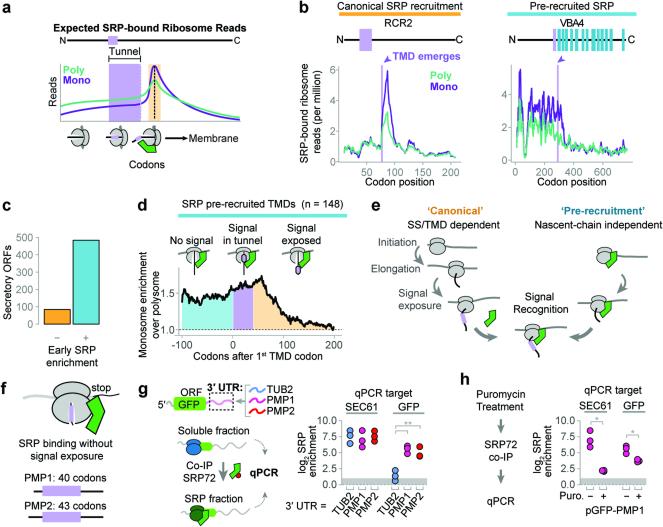
The canonical model that SRP recognizes the nascent chain after the targeting signal exits the ribosome4 (Fig. 3a) makes several predictions. First, there should be few monosome-protected reads relative to polysomes prior to the first SS/TMD emerging from the ribosome tunnel; second, ribosome footprints should increase beginning approximately 40 codons after the first codon in the targeting signal, and third, monosome reads should decrease after full exposure of the SS/TMD, as SRP-RNCs are delivered to the membrane. Indeed, these patterns were observed in a subset of secretory transcripts with significantly more hydrophobic signals (Fig. 3b, Extended Data Fig. 5c, 2e, f). SRP recruitment to these RNCs only occurred when the translated signals were fully exposed, and not while still in the exit tunnel22,23 (Extended Data Fig. 5d and Supplementary Discussion).
Figure 3. Distinct mechanisms of SRP recruitment.
a, Recruitment of SRP to RNCs is expected to increase ribosome-protected reads from SRP-bound monosomes when an SS or TMD is exposed to the cytosol (orange). b, Distributions of SRP-bound ribosome reads on representative transcripts from cycloheximide-treated cultures. Selected transcripts are RCR2, and VBA4. c, The majority of secretory proteins demonstrated SRP enrichment prior to signal exposure. d, Metagene plot of the median value of enrichment of SRP-bound monosomes over polysomes. Included transcripts encode TMDs at least 40 codons from the start codon. Shaded areas represent enrichment before the TMD is encoded (cyan), while the TMD is in the ribosome exit tunnel (lavender), and after the TMD is exposed (orange). e, Two mechanisms for SRP to select secretory mRNA. f, PMP1 and PMP2 were the only TA proteins that enriched SRP. g, The GFP ORF was fused to the indicated 3′ UTRs and expressed in vivo. Srp72p-TAP was immunoprecipitated from the total soluble fraction and RNAs were subject to qPCR. **p ≤ 0.01, n = 3 biological replicates, Welch's t-test. h, Puromycin treatment of lysate from yeast expressing GFP with the PMP1 3′ UTR was followed by SRP immunoprecipitation and qPCR. *p ≤ 0.05, n = 3 biological replicates, Welch's t-test.
Surprisingly, the majority of secretory transcripts did not conform to the predictions of the model (Fig. 3b, c and Extended Data Fig. 5e). Instead, ribosome footprints from most SRP-bound monosomes were abundant well before translation of the first targeting signal. For instance, the RNCs of DAP2 were enriched on SRP from the start codon. For membrane proteins, SRP enrichment could be observed up to hundreds of codons prior to translation of the first TMD (Fig. 3d and Extended Data Fig. 5e). Thus, the exquisite selectivity of SRP towards secretory transcripts occurs via RNCs that have not yet translated any SS or TMD. Of note, SRP-bound monosome reads did diminish upon full signal exposure by the ribosome. Thus, SRP is pre-recruited to secretory RNCs prior to synthesis of a SS or TMD, but only upon emergence and recognition of the targeting signal it can promote membrane targeting, presumably due to a conformational change in the RNC-SRP complex22,24. Our findings show that SRP stably and preferentially binds ribosomes translating secretory mRNAs in a manner independent from the sequence of the exposed nascent chain (Fig. 3e). Models where SRP scans all ribosomes with high affinity and rapid kinetics25 do not explain our findings, as discussed in Supplementary Discussion.
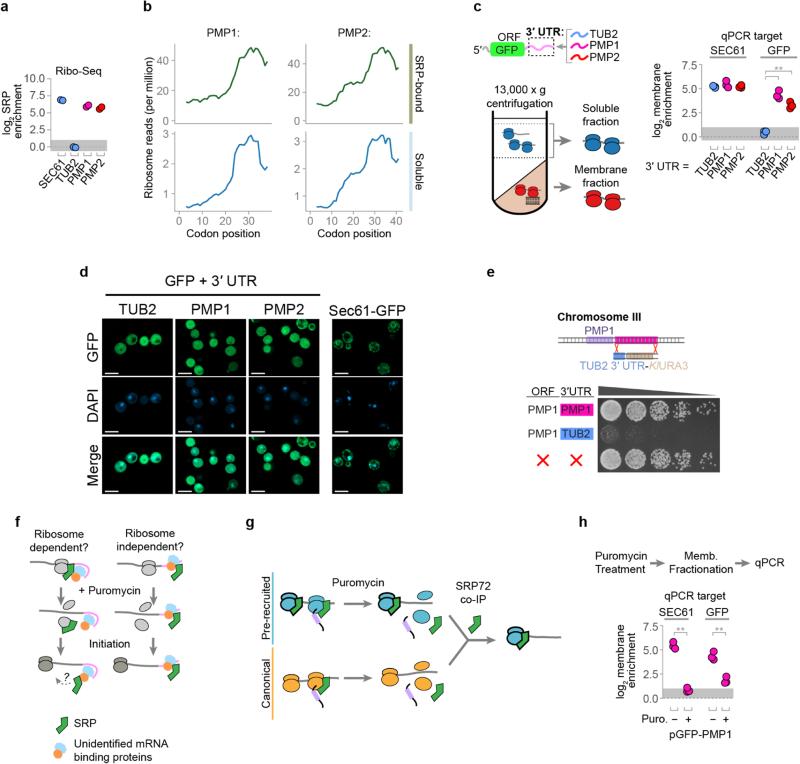
To begin to understand the determinants that confer specific recruitment of SRP without an exposed SS or TMD, we examined the most extreme cases of nascent chain independent SRP-recruitment. PMP1 and PMP2 encode two abundant, small membrane proteins of 40 and 42 amino acids, respectively. Even though the entire proteins are smaller than the length of the ribosomal tunnel, PMP1 and PMP2 RNCs bind to SRP throughout translation (Fig. 3f and Extended Data Fig. 6a, b).
We considered whether non-coding mRNA determinants could confer nascent-chain independent SRP recruitment. PMP1 and PMP2 contain long 3′ untranslated regions (UTR) implicated in membrane attachment26. We thus tested the effect of fusing the 3′ UTR of either PMP1 or PMP2 to the mRNA of cytosolic GFP lacking any targeting signal (Fig. 3g). The 3′ UTR of cytosolic protein TUB2 served as a control. Strikingly, the 3′ UTRs of either PMP1 or PMP2 conferred cotranslational SRP binding to the GFP transcripts, as well as membrane localization, while the 3′ UTR of TUB2 did not (Fig. 3g, Extended Data Fig. 6c). For all constructs, GFP protein was diffuse and cytosolic, indicating that the 3′ UTR alone is insufficient to promote substantial translocation of GFP into the ER (Extended Data Fig. 6d). Notably, the 3′ UTR of endogenous PMP1 is functionally important in vivo. Thus, replacing the 3′ UTR of the PMP1 gene with the 3′ UTR of TUB2 resulted in a growth defect more severe than complete deletion of the entire PMP1 gene (Extended Data Fig. 6e). Perhaps mislocalization of the TMD domain in the absence of the 3′ UTR is more toxic than loss of gene function.
Two non-exclusive models can account for SRP recruitment by the PMP1 and PMP2 3′ UTRs. First, SRP binds to the mRNA, either directly or through other RNA binding proteins. Alternatively, ribosomes translating PMP1 or PMP2 recruit SRP in a 3′ UTR-mediated manner (Extended Data Fig. 6f). To distinguish between these possibilities, a puromycin incubation was used to disrupt elongating27 ribosomes prior to fractionation and SRP immunoprecipitation. This treatment caused a significant reduction of the GFP-PMP1 mRNA that copurified with SRP (Fig. 3h). Thus, translating ribosomes promote SRP recruitment to the GFP-PMP1 transcript. Of note, puromycin also disrupted the SRP interaction with the SEC61 mRNA control. We thus next examined the general role of translation in SRP recruitment.
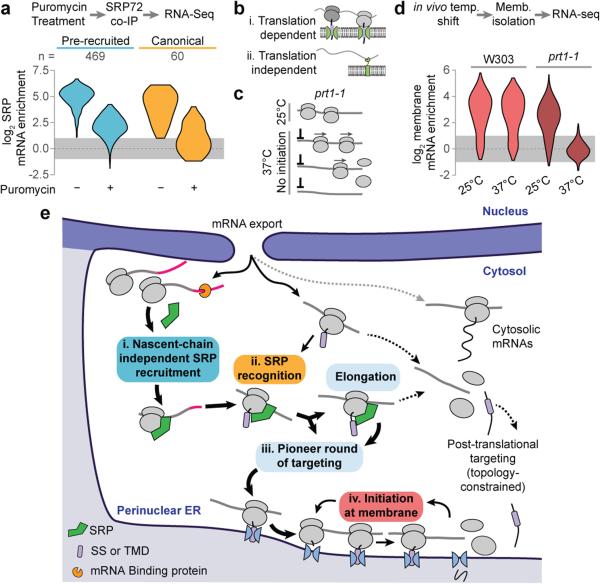
We assessed the global ribosome dependency of SRP binding to secretory transcripts using either puromycin or CHX incubations to respectively disrupt or stabilize elongating ribosomes. Srp72p-bound transcripts isolated from the soluble fraction were examined by RNA-seq (Fig. 4a). SRP association with all secretory mRNAs was sensitive to puromycin. Transcripts that only recruit SRP through a canonical nascent chain interaction were more dependent on elongating ribosomes. The reduced puromycin sensitivity observed for pre-enriched transcripts may arise from the inability of puromycin to disrupt initiating ribosomes27, which appear able to recruit SRP (Extended Data Fig. 6g).
Figure 4. Translation and the role of SRP.
a, Distributions of RNA-seq SRP enrichment scores from secretory protein transcripts (SS, TMD, SS-TMD, or TA), with or without puromycin treatment. Included ORFs have at least 2-fold SRP enrichment without puromycin. b, The prt1-1 allele prevents initiation at non-permissive temperatures. Translational run-off removes all ribosomes from transcripts. b, Transcripts are retained on the membrane though binding of the RNC to the translocon. It is also possible that mRNA binding proteins at the ER bind transcripts. c, Distributions of RNA-seq membrane enrichment scores of secretory protein transcripts (n = 584). d, After mRNA export, a pioneer round of targeting directs secretory transcripts to the ER membrane. SRP is specifically pre-recruited transcripts that will present a functional targeting signal. Upon emergence of an SS or TMD, SRP directs RNCs to the ER membrane. Once at the ER membrane, transcripts are retained over multiple rounds of translation.
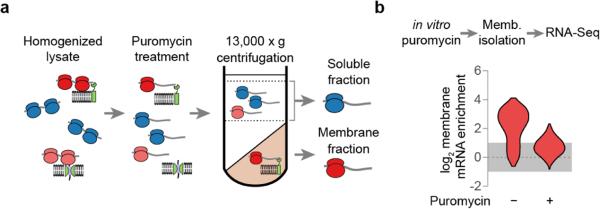
We next examined if the membrane association of secretory transcripts similarly depends on ongoing translation. In principle, ER-localized proteins could recruit secretory transcripts to the membrane in the absence of translation26,28 (Fig. 4b). Membrane and soluble mRNAs were fractionated in the presence and absence of puromycin treatment and subject to RNA-seq analysis (Extended Data Fig. 7). Disruption of translating ribosomes reduced membrane enrichment for all secretory protein transcripts, including those of PMP1 and PMP2. This result was confirmed using the GFP-PMP1 reporter (Extended Data Fig. 6h).
The translation-dependence of membrane association for secretory transcripts was further examined using a temperature sensitive allele of eIF3 subunit PRT1, prt1-1. Shifting cells to the non-permissive temperature precludes mRNA binding to the 40S subunit29 allowing elongating ribosomes to run off (Fig. 4c). After displacing ribosomes from the mRNA, soluble and membrane fractions were analyzed by RNA-seq. Strikingly, the only mRNAs that remained in the membrane fraction corresponded to mitochondrially-encoded proteins. The membrane enrichment of all ER-destined secretory transcripts was abolished in the absence of translation (Fig. 4d). Thus, translation is required for the observed association of mRNAs with membranes.
Our findings define the principles of cotranslational membrane targeting and the role of SRP in this process and provide a solution to the paradox of how SRP achieves exquisite specificity in vivo despite its low abundance, its substrate binding promiscuity, and despite the competition from abundant cytosolic chaperones30 that could potentially bind SS or TMDs. For most mRNAs, SRP does not need to rapidly scan translating ribosomes for binding of targeting sequences while ignoring near-cognate cytosolic hydrophobic sequences6. Instead, a number of mechanisms bias towards the correct SRP-RNC interactions (Fig. 4e). For most secretory mRNAs, SRP binds before targeting signals are synthesized, in a pioneer round of cytoplasmic translation. Pre-recruited SRP is thus poised to recognize the SS or TMD upon emergence of a targeting signal from the ribosome22 and facilitate membrane attachment. For a smaller fraction of clients with more hydrophobic targeting signals, SRP recruitment is initiated by binding RNCs that fully expose SS or TMD in the nascent chain. We do not observe an SRP-induced elongation arrest but some mRNAs have intrinsic elements attenuating elongation upon signal exposure. Since membrane targeting is in kinetic competition with continued elongation, posttranslational targeting dominates for proteins with a late targeting signal. Once at the membrane, secretory mRNAs remain bound through subsequent rounds of initiation and translocon engagement. These hydrophobic proteins will no longer compete with soluble proteins for cytosolic quality control components. Conversely, transcripts not captured in this first round of selection become more likely to encounter cytosolic chaperones. One important and surprising conclusion is that cotranslational events governing nascent polypeptide fate are not only guided by the nascent chain itself, but also rely on additional aspects of translation, such as mRNA itself and cellular organization. These findings illustrate the multi-layered nature of protein biogenesis fidelity.
METHODS
Yeast Strains
Ribosome profiling (Ribo-seq) and qPCR assays were performed using BY4741 SRP72-TAP::His3MX, obtained from OpenBioystems31. BY4741 SEC61-GFP::His3MX was obtained from Invitrogen32. Strain CY2522, containing the prt1-1 temperature sensitive allele33, was kindly provided by Elizabeth Craig. BY4741 PMP1Δ::kanMX4 was obtained from the yeast deletion library34.
Ribosome profiling
For each biological replicate, six 500 mL cultures of YPD were grown with shaking at 30°C to OD600nm = 0.8–1.0 and harvested one at a time by filtering through a 0.22 μm membrane. Cells were scraped off the filter in a single motion using a metal scoopula and then immersed in liquid nitrogen. When indicated, cycloheximide treatments were performed by adding the drug to the culture to 100 μg·mL−1 immediately before filtering. Filtration completed in approximately 2 minutes, and cells were scraped and immersed in liquid nitrogen within 3 seconds.
Lysis buffer comprised 50 mM potassium MOPS, pH 7.2, 275 mM potassium glutamate, 5 mM magnesium acetate, 1 mM DTT, 100 μg·mL−1 cycloheximide, and 20 U·mL−1 Superase•In (Ambion). Two 3 mL aliquots were supplemented with Complete Protease Inhibitor Cocktail, EDTA-free (Roche) and frozen dropwise in liquid nitrogen. One 3 mL aliquot of frozen lysis buffer was combined with cells from 1.5 L of culture in a 50 mL ball mill chamber chilled in liquid nitrogen (Retsch). Cells were pulverized for 1 minute at 20 hz in a MM-301 mixer mill. Pulverized cells from 3 L of culture were combined and thawed in a room temperature water bath. Lysates were immediately centrifuged in a Type 70.1 Ti rotor (Beckman) for 10 minutes at 12,000 rpm. The following were then added to the supernatant: Triton X-100 to 0.01%, heparin sulfate to 0.2 mg·mL−1, and PMSF to 1 mM. Heparin was added as an RNase inhibitor only after fractionation as it may dislodge ribosomes from the membrane35. A low concentration of Triton X-100 reduces bead clumping during immunoprecipitation, and prevents aggregation upon elution. A portion of the supernatant was retained as the total soluble fraction. Three mL of lysis buffer supplemented with Triton X-100 to 1% and heparin sulfate to 0.2 mg·mL−1 were added to the pellets. Pellets were resuspended using a glass dounce homogenizer fit to the internal diameter of the tube. Membrane extracts were centrifuged as before, and the detergent-extracted supernatant is recovered as the total membrane-bound fraction.
One milliliter of streptavidin-conjugated magnetic beads (Pierce) were saturated with biotinylated total rabbit IgG (Calbiochem). Beads were incubated with the total soluble fraction for 1 hour at 4°C. Beads were then washed three times with 1 mL of wash buffer, which consisted of lysis buffer supplemented with 0.2 mg·mL−1 heparin and 0.01% Triton X-100. Beads were then incubated with 100 μL wash buffer, 2 μL Superase•In and 3 μL AcTEV protease (Invitrogen) for 1 hour at room temperature. The first eluate was retained on ice, the digest was repeated, and the eluates combined, yielding the total SRP-bound fraction. The eluate was immediately quantified using A260nm, and the total soluble and membrane-bound fractions were diluted in wash buffer to equivalent concentrations in 200 μL. Samples were layered on a 7–47% sucrose gradient prepared in wash buffer omitting RNase inhibitors. Gradients were centrifuged in a SW 41 Ti rotor (Beckman) for 2.5 hours at 39,000 rpm, and fractionated using a UA-6 detector and Foxy Jr. fraction collector (ISCO). Five 1 mL fractions containing the polysomes were combined, as were two 1 mL fractions containing the monosomes. Samples were diluted to 6 mL in wash buffer without RNase inhibitors and centrifuged for 12 hours at 50,000 rpm in a Type 70.1 Ti rotor.
Ribosome pellets were resuspended in 250 μL of cutting buffer of 20 mM Tris, pH 7.5, 140 mM potassium chloride, 1.5 mM magnesium chloride, and 0.01% Triton X-100. Concentrations were typically 10–100 ng·μL−1 as measured by A260nm. Samples with greater concentration were diluted to 100 ng·μL−1 in 250 μL. Fifty units of RNase I (Ambion) were added to each sample, and digests proceeded for 1 hour at room temperature. Digests were stopped with the addition of 2 μL Superase•In, transferred to a MLA-130 centrifuge tube (Beckman) and underlaid with 750 μL of 35% sucrose in cutting buffer. Ribosomes were pelleted by centrifugation for 4.5 hours at 70,000 rpm. Total RNA was extracted from the pellets using a miRNeasy kit (Qiagen). Libraries were prepared as previously described36, quantified by qPCR (Kapa Biosciences), and sequenced using a HiSeq 2500 (Illumina).
RNA-seq
To test disruption of elongating ribosomes, yeast from one 500 mL culture of BY4741 SRP72-TAP::His3MX were lysed in ribosome profiling lysis buffer, which includes cycloheximide. Yeast from a second culture were lysed in buffer prepared without cycloheximide that was supplemented with 0.5 mM puromycin, 1 mM ATP, 1 mM GTP, 10 mM creatine phosphate and 40 μg/ml creatine kinase. Both lysates were incubated at room temperature for 10 minutes after thawing.
To test the effect of initiation in vivo, two 500 mL cultures of CY2522 (prt1-1) and two 500 mL cultures of W303 were grown with shaking at 25°C to OD600nm = 0.6. One culture of each strain was shifted to 37°C, and the four cultures were grown one additional hour followed by harvesting by fast filtration.
Samples of the total soluble, total membrane, and total SRP-bound fractions were prepared as described for ribosome profiling. RNA was extracted using the hot SDS-phenol-chloroform method, and mRNA was purified using oligo-dT beads according to the manufacturer's instructions (NEB). Eluted mRNA were then fragmented under alkaline conditions9, and fragments 35 nt to 50 nt were purified by PAGE. Libraries were constructed as for Ribo-seq and sequenced using a HiSeq 4000 (Illumina).
Data processing for enrichment scores
Adapter sequences were trimmed from sequencing reads using Cutadapt37. Two rounds of alignment are performed using Bowtie, and Tophat38,39. First, sequences are aligned against a library comprising mature ribosomal rRNA with Bowtie. Unaligned reads are retained and then aligned against S288C Release 64-1-1 (www.yeastgenome.org) using Tophat. Any read with more than one match was removed, and reads were assigned to ORFs and counted using the GenomicAlignments package in Bioconductor40,41. Dubious ORFs were omitted.
Identification of targeting signals and classification of ORFs
Different SS and TMD prediction programs vary in their output, and so we included only consistently predicted targeting signals in our analysis. Protein sequences were given to SignalP V342, Phobius43, Philius44, and TMHMM45. The following scheme was used for classification:
Mitochondrial
All mitochondrially-encoded proteins, and nuclear-encoded proteins that localized to this organelle in at least one of two fluorescence-based screens32,46.
Signal sequences (SSs)
SSs from non-mitochondrial proteins predicted by SignalP, Phobius and Philius that did not contain any TMDs predicted by Phobius or Philius. The first residue of the hydrophobic domain, as predicted by Phobius, was designated as the first signal residue. Predictions by TMHMM within the first 50 residues were ignored. SSs were defined as “looped” if they enriched on Ssh1p at least 90 codons after the first SS codon16. Every GPI-anchored protein (as previously annotated11) satisfies conditions for a SS, and were included. Some GPI-anchored proteins have predicted TMDs near the stop codon; these do not expose cotranslationally.
Transmembrane domains (TMD)
The first TMD of non-mitochondrial proteins were predicted by TMHMM, Phobius, and Philius within five amino acids for each pair of predictors (i.e., Philius versus Phobius, Philius versus TMHMM, Phobius versus TMHMM). The first signal location was designated as the average of the three predictions, rounded down. If the TMD was within the first 50 codons, predictions by SignalP are ignored. Phobius and Philius did not predict a cleavable SS.
Tail-anchored (TA)
First TMDs that begins within 50 amino acids of the stop codon were designated TA.
Signal sequences with transmembrane domains (SS-TMD)
SSs were predicted as above with at least one TMD predicted by both Phobius and Philius.
Cytonuclear
ORFs which had no predicted SS or TMD by SignalP, TMHMM, Phobius, or Philius, and which did not appear in the mitochondria. Since only fluorescence localization data was used to designate mitochondrial proteins, this set includes some true mitochondrial proteins.
Exceptions
All remaining sequences had a SS or TMD predicted by SignalP, Phobius, Philius, or TMHMM that was not predicted by the other programs. Because of ambiguity in type and location of the targeting signal, these proteins are excluded from our analysis. Other exceptions included proteins with predicted TMDs from position 50 or later, as well as a SignalP SS prediction but no Phobius or Philius SS. We considered this ambiguity in the prediction of a SS, and excluded these ORFs.
Enrichment analysis
Count-based sequencing assays report changes in a transcript's abundance as changes in its proportion of the total sequencing reads. Thus, when a subset of transcripts is enriched in a sample, the proportion of reads from all other transcripts decreases by a corresponding amount. Here, we assume that enrichment on the membrane or SRP represents active selection of certain transcripts, and the depletion of all others is passive. In other words, we assume that few transcripts will be specifically prevented from appearing in the membrane or SRP. The distributions of the ‘Cytonuclear’ sets in Fig. 1a and Fig. 2b, which skew towards enrichment, are consistent with this assumption. Thus, we expect the distribution of non-enriched transcripts to be similar to their overall expression or translation. This makes direct comparison of different enrichment scores (i.e. SRP enrichment vs membrane enrichment, under various drug treatments etc.) calculated from proportional abundance15,16,47 unintuitive, because a component of enrichment appears as depletion of non-enriched mRNA.
In current approaches for differential gene expression, most genes are assumed to have unaltered abundance, and library sizes are normalized by a robust estimator such as median ratio method48 and trimmed mean of M-values (TMM) 49. However, we expected changes for up to a third of ORFs. We used the TMM method of DESeq to derive library scale factors using reference ORFs, selected as those designated as “Cytonuclear”. We applied these scale factors to the counts for every ORF, and calculated enrichment as the ratio of scaled reads between sets. Biological replicates were scaled separately and then averaged. The robust nature of scale estimation allowed for extreme cases of the reference set to have high enrichment scores. Scores were only reported for ORFs that have at least 100 total reads between replicates in each of the compared samples9,47.
Fig. 2c included proteins designated as SS, TMD, and SS-TMD that have at least 100 reads in all four datasets, with the following exceptions: YEL050C, YLR077W, YML061C, YOL053W, and YPL132W, which were all observed on the surface on the mitochondria15 and had at least 4-fold membrane enrichment here. Membrane enrichment after cycloheximide treatment was determined using total ribosome-protected reads from the soluble and membrane fractions.
Mapping of ribosome protected reads to codons
Reads were mapped to codons using an alternate method. After filtering rRNA, reads were aligned to a Bowtie library comprising coding sequences, plus the stop codon and 21 nt flanking upstream and downstream. Using combined data from the SRP-pulldown and membrane polysome replicates, ORFs for which at least 20% of reads could map to a second ORF were removed, leaving a working set of 5441 genes. Footprints of 26–35 nt were processed separately for each length. The nucleotide that mapped to the center of each read (rounded down) was given a value of 1, and reads were summed at each nucleotide position. A metagene analysis was performed50 and for each footprint length, an integer offset was determined so that the characteristically large peak at the start codon was maximized at the second nucleotide position (i.e. aTg). Then, all reads of lengths were offset and combined. Nucleotide reads were summed for each codon.
Read distributions
For each sample, the total reads from elongating ribosomes were determined by adding counts from all codons excluding the first two and last two sense codons. Reads from biological replicates were summed to increase overall read depth, but owing to the high overall reproducibility all of our conclusions can be demonstrated by treating replicates separately. The reads at each codon position are then divided by this total and multiplied by one million to yield reads per million (RPM). Values at each codon are smoothed using an 11 residue rolling average. The positions of TMDs in topology diagrams were taken from the TMHMM prediction. We caution that predictors may differ in the number and position of subsequence TMDs. Positions of SS are the H-region predicted by Phobius. The point at which a SS or TMD begins to emerge is considered 40 codons after the first encoded residue of the signal.
For metagene plots, reads at each codon are smoothed using a 5 residue rolling average. ORFs are then aligned as indicated, and the median and interquartile ranges are calculated at each position. For each ORF in Fig. 1c and 2d, reads at each codon position are divided by the mean reads per codon within the range +20 to +40 after first signal codon. Included ORFs have at least 20 reads within this window in each dataset shown. The first 30 codons of each ORF are excluded to avoid the universally observed low-density region near the start codon.
Identification of SRP recruitment to the nascent chain
Increases in ribosome-protected reads in the soluble SRP-bound polysome dataset were observed for a subset of ORFs at codon positions coincident with the exposure of targeting signals. We developed a clustering scheme that sorted ORFs by the shape of the distribution of ribosome-protected reads specific to SRP-bound polysomes. The test set comprised 568 SS, TMD or SS-TMD proteins with at an average of at least 3 reads per codon in both soluble SRP-bound polysome and membrane-bound polysome sets. For each ORF, we first smooth read counts from each dataset with a leading 15-residue moving average window. We corrected for local features intrinsic to the sequence (i.e. appearing in all fractions) by dividing the smoothed SRP-bound polysome reads by the smoothed membrane-bound polysome reads at each codon; positions with fewer than 3 reads in either smoothed set were omitted. Peak codon positions were identified as the maximum value within 30–180 residues after the first predicted targeting signal codon. Each ORF was scaled by dividing the value at each codon position by the mean value over the range from 50 codons before to 200 codons after the peak. Codon positions outside this range are discarded. Scaled values are then used to generate an empirical cumulative distribution function (ECDF). The ECDF is sampled from 0.0–2.0 in 0.1 steps. The samplings from the ECDFs were used for agglomerative hierarchical clustering using a Euclidean distance function and Ward's minimum variance method51. The first split in the population distinguished ORFs having strong peaks from ORFs with weak or no peaks.
To analyze the distances between the first signal codon and the peak, peaks must be unambiguously assigned to the first targeting signal; otherwise the peak may be due to a later TMD. The distance to the peak was compared to the distance between the first TMD and the second (as determined by TMHMM) or the distance between the SS and the first TMD (as determined by Phobius). Peaks were considered unambiguous only if no more than 8 residues of the next TMD were translated. This value is the length of the shortest functional signal sequence in our set, controlling for any affect that an additional signal within the exit tunnel may have on SRP.
An alternate approach was used to determine codons with significant recruitment of SRP in mitochondrial transcripts and transcripts lacking an ER targeting signal. For every ORF, a count matrix was built with codon position as rows, and replicates of SRP-bound polysome ribosome-protected reads, total soluble polysome reads and total membrane polysome reads as columns. These matrices were individually input to DESeq248, and a linear model was fit using the presence or absence of SRP co-IP as the coefficient; in this application, codons were treated as ‘genes’. Reads at each codon were used for fitting local dispersion trends. Genes with at least one codon that had at least 3-fold enrichment with p < 0.001 were selected. We note that all six SRP subunits had local enrichment towards the C-terminus; since this may be cotranslational particle assembly, we omitted them from further analysis. Thirteen other genes were identified, and binding sites were assigned to the first significantly enriched codon preceding the position with maximum enrichment.
Quantification of early SRP enrichment
Secretory protein ORFs which were used in the analysis of SRP recruitment to the nascent chain (see previous section) were also tested for SRP pre-enrichment by comparing ribosome-protected reads from SRP-bound polysomes and monosomes from a cycloheximide-treated culture. The RPM values from codon 10 to the position of the first SS or TMD, plus 40, were added, and the monosome sum was divided by the polysome sum. The first 9 sense codons were omitted to avoid artifacts near the start of transcripts. Ratios of greater than 1 were designated pre-recruited.
The enrichment in Fig. 3d was determined by first smoothing SRP-bound monosome and polysome reads (in RPM) using an 11 codon window, and then dividing the monosome values by the polysome values.
GFP reporter constructs
Sequences of the of yeast TUB2 5′ UTR (300 nt preceding the start codon), the TUB2 3′ UTR (300 nt following the stop codon), the PMP1 3′ UTR (600 nt), and the PMP2 3′ UTR (500 nt) were PCR amplified from BY4741 genomic DNA with flanking overlaps to the M13 (−20) forward or M13 reverse sequences, and to the beginning or end of the sfGFP ORF sequence52. The sequence of sfGFP was amplified from a pET33b-derived expression vector kindly provided by William Clemons. Plasmids were assembled in a single reaction using Gibson assembly53 using the M13 (−20) forward and M13 reverse sequences to amplify pRS315. Plasmids were transformed into BY4741 SRP72-TAP::HIS3MX.
qPCR
For each biological replicate, 500 mL of synthetic complete media lacking leucine were inoculated with an overnight culture to OD600nm of 0.05. Cultures were grown at 30°C to OD600nm 0.8–1.0 and then harvested by fast filtration. Cells were lysed and fractionated, and SRP72 was immunoprecipitated as described for RNA-seq. Purified RNA were subjected to TURBO DNase digestion (Ambion). Concentrations were determined using A260nm, and 100 ng RNA were used to synthesize cDNA using iScript (Bio-Rad). qPCR was performed on a CFX-96 thermocycler using iTAQ Universal SYBR Green Supermix (Bio-Rad). ACT1 was used as a reference for each fraction from the same culture, and enrichments were determined as fold difference of mRNA in the membrane or SRP-bound fractions over the soluble fraction. Enrichment scores from three technical replicates of the qPCR step were averaged, and biological replicates are shown.
Statistical hypothesis testing
All analysis was performed using the R programming language (https://www.r-project.org). Statistical significance in comparing distributions of SRP or membrane enrichment scores from ribosome profiling (Fig. 1a and Fig. 2b), as well as in comparing hydrophobicity scores (Extended Data Fig. 2e), codon usage, or residue abundance (Extended Data Fig. 3d, e) was determined using two-sided Wilcoxon rank sum tests. This test assumes independence of observations and does not require a normal distribution. Enrichment distributions are multimodal and so mean and variance estimates are not provided. Significance of SRP or membrane enrichment from qPCR (Fig. 3g, h, and Extended Data Fig. 6c, h) was determined using a two-sided Welch's t-test on log-transformed enrichment values. This test assumes normal distributions but allows unequal variance. In all tests, the null hypothesis is the distributions of tested populations are equal.
Code availability
Scripts for data processing and analysis in R are available upon request.
Extended Data
Extended Data Figure 1. Cotranslational membrane enrichment.
a, Crude lysates were fractionated, and then polysomes were recovered by sucrose gradient ultracentrifugation and used for ribosome profiling. b, Enrichment of ribosome-protected mRNA reads in the membrane polysome fractions over the soluble polysome fractions from two biological replicates. Every dot represents one ORF. c, Metagene plots of soluble polysome ribosome-protected reads of transcripts encoding proteins lacking ER targeting signals (top), or of membrane-bound polysome protected reads of transcripts encoding secretory proteins that were at least 2-fold membrane-enriched (bottom). For each ORF, ribosome-protected reads at each position were scaled by dividing by the mean reads per codon of the ORF, excluding first two and last two sense codons. The median scaled reads at each position are plotted as a line, and the interquartile range is shaded in gray. d, Ribosome-protected reads at each codon of an example secreted protein, β-1,3-glucanosyltransferase (GAS1), a model SRP-independent protein12. Topology is indicated above, with the signal sequence in lavender. The position where the signal begins to emerge from the ribosome exit tunnel is indicated. e, The number of codons remaining after the encoding of the first residue of a SS, and the corresponding membrane enrichment per SS containing ORF. Signal sequences were divided between those that bind Ssh1p directly upon exposure and those that require a looped conformation (>90 codons after the first SS codon) 16. f, Transcripts remain at the membrane by subsequent translocon binding, thus the small soluble fraction comprises mRNA undergoing initial targeting.
Extended Data Figure 2. Cotranslational enrichment of SRP.
a, Enrichment of ribosome-protected mRNA reads in the soluble SRP-bound polysome fractions over the total soluble polysome fractions from two biological replicates. b, The number of codons remaining after encoding of first SS or TMD residue, and the corresponding SRP and membrane enrichment scores per ORF. Scores are determined from cultures harvested without added cycloheximide. Enrichment scores are indicated with filled dots, and the scores from the same transcript are linked with a gray line. The vertical dashed line indicates 50 codons, the boundary for TA proteins. Here, only SS that bind Ssh1p directly upon exposure from the RNC are shown. c, Secretory transcripts were classified into two groups based on the ribosome protected-read distributions from SRP-bound polysomes. Some displayed a pronounced increase of reads at positions coincident with to the initial exposure of and SS or TMD by the ribosome, while others did not. Shown here are metagene analysis plots of soluble polysome protected reads from the categorized TMD proteins. For each ORF, the reads at each codon position were divided by the mean reads per codon within the range +20 to +40 after first signal codon. The first 30 codons of each ORF are excluded to avoid the characteristic low-density region near the start codon. The lavender line indicates when the first TMD begins to emerge from the exit tunnel, and the dashed line indicates the position of the read peak. Notably, the total soluble polysome reads depleted in a similar manner for both classes, a read increase was not observed in the total soluble reads, and reads from the SRP-bound transcripts with a peak did not deplete faster than the total soluble reads. These features are consistent with a model where SRP is recruited at the peak site, and elongation then proceeds at the same rate. d, The number of codons remaining after encoding of first SS or TMD and corresponding SRP enrichment. Transcripts are classified by the presence or absence of a read increase following signal exposure, as in c. Note that for SRP-enriched transcripts with signals closest to the terminus (<100 codons), evidence of direct binding between SRP and the nascent chain was always observed. SRP can therefore bind late transmembrane domains immediately after they become exposed by the ribosome. e, Maximum hydrophobicity across targeting signals using an 8-residue averaging window. Only signals with peaks that could be unambiguously attributed to a targeting signal were included. Hydrophobicity was determined by attributing the biological hydrophobicity score to each encoded amino acid54. ***p ≤ 0.001, Wilcoxon rank-sum test. f, Distribution of the distance between the first codon of a targeting signal and the position of the downstream read increase. Only transcripts wherein the increase can be unambiguously attributed to a specific targeting signal were included.
Extended Data Figure 3. Elongation pausing and local SRP recruitment.
a, b, Local increases of ribosome-protected reads from membrane-bound polysomes, indicated with orange lines, were coincident with rare codons, as in cell division cycle protein 1 (CDC1, a) or polybasic nascent chains, as in the plasma membrane G-protein coupled receptor (GPR1, b). Soluble SRP-bound polysome-protected reads were further increased at the same positions. c, In these cases, hydrophobic sequences in the nascent chain were exposed to the cytosol at the locations of increased reads, which were coincident with elongation attenuators. d, Translational efficiencies for the 6 codons following, and the number of stalling residues within the 10 residues preceding, the sites of increased SRP-bound ribosome reads. Translational efficiency was determined by attributing the nTE score to each codon55. Residues that were found to stall the ribosome, based on previous investigation20,56,57, were lysine, arginine, glutamate, aspartate, proline and glycine. Because of variation in specific motifs, and uncertainty in whether these motifs are additive, we simply compared the total number of these residues in the indicated 10 residue spans. Sets of 10,000 random sequences, at least 10 amino acids from the stop codon, were sampled from 5907 non-dubious ORFs, and translational efficiency and stalling residues were determined over 6 or 10 codon spans. *p ≤ 0.05, **p ≤ 0.01, Wilcoxon rank-sum tests. e, The targeting signals that recruited SRP directly to the nascent chain unusually far from the encoding of the signal had SRP-binding sites coincident with intrinsic elongation attenuation. Secretory protein transcripts that showed an increase in SRP-bound protected reads (see Extended Data Fig. 2c, f) were further classified by the position of the peak relative to the first signal codon. Transcripts with peaks found at least 80 codons after the signal had significantly lower translational efficiency in the 6 codons following the peak. These transcripts also had a greater, but not statistically significant, amount of stalling amino acids in the 10 residues preceding the peak. *p ≤ 0.05, Wilcoxon rank-sum tests. f, Similar increases in SRP-bound reads were observed for certain non-secretory proteins as exemplified by phosphoacetylglucosamine mutase (PCM1) and tRNASer Um44 2′-O-methyltransferase (TRM44). Hydrophobic sequences in non-secretory proteins, coupled with attenuation of elongation, may lead to SRP recruitment.
Extended Data Figure 4. Ribosome profiling of monosomes.
a, Ribosomes transition from monosomes to polysomes during elongation. The pioneer round of initiation will be a monosome, and during elongation there is a chance of additional initiation converting the transcript to a polysome. Similarly, a polysome will become a monosome if all ribosomes but one terminate. As mRNA is sampled closer to the stop codon, the likelihood of observing a footprint from the final ribosome will increase. b, Metagene analysis of soluble monosome or polysome protected reads from proteins lacking an ER targeting signal. Data were obtained using cycloheximide treatment. ORFs are at least 400 codons long and have an average of at least 0.5 reads per codon in each dataset. For each ORF, ribosome reads at each position were divided by the mean reads per codon over the range +160 to +240 codons. The median normalized read value at each codon position is plotted, and the interquartile range is shaded in gray. c, Relative reads at the start codon from ORFs normalized in b. d, Distributions of the ratio of ribosome-protected reads found in soluble monosomes over soluble polysomes. e, A pioneer round of translation deposits mRNA on the membrane. Polysomes will be retained at the membrane and are therefore depleted from the soluble fraction.
Extended Data Figure 5. Ribosome profiling of SRP-bound monosomes.
a, Ribosome-protected reads, in tags per million (TPM) for each ORF, from SRP-bound monosome fractions from two biological replicates. b, Ribosome-protected reads from the soluble SRP-bound monosome and SRP-bound polysome fractions of the same biological replicate, with cycloheximide treatment. c, Distribution of ribosome reads within example ORFs that display SRP-bound monosome and polysome profiles consistent with direct recognition of the nascent chain. d, If RNCs can recruit SRP while a TMD is within the exit tunnel, then there will be an increase in ribosome-protected reads from SRP-bound monosomes when the TMD begins to translate (lavender). This increase will maximize when the TMD is exposed to the cytosol (orange). e, Distribution of ribosome reads within example ORFs that display SRP-bound monosome profiles consistent with recruitment to transcripts prior to targeting signal synthesis. Examples are arranged for an increasing distance from the start codon to the first TMD. Only the first 600 codons for each ORF are shown.
Extended Data Figure 6. The role of the UTR from PMP1 and PMP2.
a, The cotranslational SRP enrichment of the PMP1 and PMP2 ORFs was similar to other bona fide secretory proteins, such as SEC61. In contrast, cytosolic proteins such as tubulin (TUB2), were not enriched. The enrichment scores are determined from the SRP-bound and total soluble polysomes from two biological replicates harvested without added cycloheximide. b, Distribution of ribosome-protected reads from soluble polysomes within the PMP1 and PMP2 ORFs. c, Membrane enrichment, determined by qPCR, of the mRNA of GFP fused to the indicated 3′ UTRs. The coding sequence of endogenous SEC61 transcript was also amplified as a control for a membrane localized transcript. **p ≤ 0.01, n = 3 biological replicates, Welch's t-test. d, Localization of mature GFP. The scale bar indicates 5 μM. Yeast were grown to mid-log phase and imaged using an Axio Observer Z1 with a Plan-Apochromat 100x/1.4 oil immersion objective (Zeiss). Z-stacks were deconvoluted by the iterative maximum likelihood algorithm in ZEN (Zeiss) and single planes are shown. Images were representative from a set of 2 replicated assays. e, Yeast growth after replacement of the endogenous 3′ UTR of PMP1 with the 3′ UTR of tubulin. Also shown is a complete deletion of PMP1 ORF34. Gibson assembly53 was used to fuse the 300 nt TUB2 3′ UTR to the KlURA3 cassette into SmaI digested pUC19. The TUB2-UTR-URA3 element was PCR amplified, including 40 nt overhangs matching genomic sequences, and replaced the 650 nt immediately following the PMP1 coding sequence in strain BY4741 by homologous recombination. Image is representative from a set of 3 replicated assays. f, Nascent chain independent SRP recognition may require ribosomes. Puromycin treatment of lysates disrupts elongating, but not initiating, ribosomes. g, Transcripts showing only canonical recognition are more sensitive to puromycin. This is consistent with puromycin resistance of SRP that has pre-recruited to initiating ribosomes. h, Membrane enrichment of the GFP-PMP1 construct or SEC61 mRNA after lysates were incubated with puromycin. **p ≤ 0.01, n = 3 biological replicates, Welch's t-test.
Extended Data Figure 7. The role translation in membrane enrichment.
a, Lysates were treated with puromycin prior to membrane fractionation. mRNA recovered from the soluble and membrane fractions were used for RNA-seq b, Membrane enrichment of secretory protein transcripts (SS, TMD, SS-TMD, or TA, n = 729) following puromycin treatment of lysates.
Supplementary Material
Acknowledgements
We thank P. Walter, J.S. Weissman, and C. Jan for useful discussions; R. Andino and R. Hedge for critical reading of the manuscript. We thank S. Pechmann, K.M. Dalton, E.M. Sontag, P.T. Dolan and other members of the Frydman lab for advice on analysis. Sequencing was performed at the UCSF Center for Advanced Technology with assistance from E. Chow, J. Lund, and A. Acevedo. J.W.C. is supported by an NIH NRSA award. This work was additionally supported by grants to J.F. from the NIH and HFSP.
Footnotes
Author Contributions J.W.C. and J.F. designed the study. K.C.L.H. performed experiments with prt1-1. J.W.C. performed all other experiments and analysis. J.W.C. and J.F. wrote the manuscript.
Author Information Data are deposited in Gene Expression Omnibus under accession no. GSE74393.
Supplementary Information is linked to the online version of the paper at www.nature.com/nature.
The authors declare no competing financial interests.
References
- 1.Pechmann S, Willmund F, Frydman J. The ribosome as a hub for protein quality control. Mol Cell. 2013;49:411–421. doi: 10.1016/j.molcel.2013.01.020. [DOI] [PMC free article] [PubMed] [Google Scholar]
- 2.Bornemann T, Holtkamp W, Wintermeyer W. Interplay between trigger factor and other protein biogenesis factors on the ribosome. Nat Commun. 2014;5:4180. doi: 10.1038/ncomms5180. [DOI] [PubMed] [Google Scholar]
- 3.Nyathi Y, Pool MR. Analysis of the interplay of protein biogenesis factors at the ribosome exit site reveals new role for NAC. J Cell Biol. 2015;210:287–301. doi: 10.1083/jcb.201410086. [DOI] [PMC free article] [PubMed] [Google Scholar]
- 4.Akopian D, Shen K, Zhang X, Shan SO. Signal recognition particle: an essential protein-targeting machine. Annu Rev Biochem. 2013;82:693–721. doi: 10.1146/annurev-biochem-072711-164732. [DOI] [PMC free article] [PubMed] [Google Scholar]
- 5.Zhang X, Shan SO. Fidelity of cotranslational protein targeting by the signal recognition particle. Annu Rev Biophys. 2014;43:381–408. doi: 10.1146/annurev-biophys-051013-022653. [DOI] [PMC free article] [PubMed] [Google Scholar]
- 6.Ogg SC, Walter P. SRP samples nascent chains for the presence of signal sequences by interacting with ribosomes at a discrete step during translation elongation. Cell. 1995;81:1075–1084. doi: 10.1016/s0092-8674(05)80012-1. [DOI] [PubMed] [Google Scholar]
- 7.Willmund F, et al. The cotranslational function of ribosome-associated Hsp70 in eukaryotic protein homeostasis. Cell. 2013;152:196–209. doi: 10.1016/j.cell.2012.12.001. [DOI] [PMC free article] [PubMed] [Google Scholar]
- 8.Del Alamo M, et al. Defining the specificity of cotranslationally acting chaperones by systematic analysis of mRNAs associated with ribosome-nascent chain complexes. PLoS Biol. 2011;9:e1001100. doi: 10.1371/journal.pbio.1001100. [DOI] [PMC free article] [PubMed] [Google Scholar]
- 9.Ingolia NT, Ghaemmaghami S, Newman JR, Weissman JS. Genome-wide analysis in vivo of translation with nucleotide resolution using ribosome profiling. Science. 2009;324:218–223. doi: 10.1126/science.1168978. [DOI] [PMC free article] [PubMed] [Google Scholar]
- 10.Rapoport TA, Matlack KE, Plath K, Misselwitz B, Staeck O. Posttranslational protein translocation across the membrane of the endoplasmic reticulum. Biol Chem. 1999;380:1143–1150. doi: 10.1515/BC.1999.145. [DOI] [PubMed] [Google Scholar]
- 11.Ast T, Cohen G, Schuldiner M. A network of cytosolic factors targets SRP-independent proteins to the endoplasmic reticulum. Cell. 2013;152:1134–1145. doi: 10.1016/j.cell.2013.02.003. [DOI] [PubMed] [Google Scholar]
- 12.Ng DT, Brown JD, Walter P. Signal sequences specify the targeting route to the endoplasmic reticulum membrane. J Cell Biol. 1996;134:269–278. doi: 10.1083/jcb.134.2.269. [DOI] [PMC free article] [PubMed] [Google Scholar]
- 13.Walter P, Johnson AE. Signal sequence recognition and protein targeting to the endoplasmic reticulum membrane. Annu Rev Cell Biol. 1994;10:87–119. doi: 10.1146/annurev.cb.10.110194.000511. [DOI] [PubMed] [Google Scholar]
- 14.Kutay U, Ahnert-Hilger G, Hartmann E, Wiedenmann B, Rapoport TA. Transport route for synaptobrevin via a novel pathway of insertion into the endoplasmic reticulum membrane. EMBO J. 1995;14:217–223. doi: 10.1002/j.1460-2075.1995.tb06994.x. [DOI] [PMC free article] [PubMed] [Google Scholar]
- 15.Williams CC, Jan CH, Weissman JS. Targeting and plasticity of mitochondrial proteins revealed by proximity-specific ribosome profiling. Science. 2014;346:748–751. doi: 10.1126/science.1257522. [DOI] [PMC free article] [PubMed] [Google Scholar]
- 16.Jan CH, Williams CC, Weissman JS. Principles of ER cotranslational translocation revealed by proximity-specific ribosome profiling. Science. 2014;346:1257521. doi: 10.1126/science.1257521. [DOI] [PMC free article] [PubMed] [Google Scholar]
- 17.Lakkaraju AK, Mary C, Scherrer A, Johnson AE, Strub K. SRP keeps polypeptides translocation-competent by slowing translation to match limiting ER-targeting sites. Cell. 2008;133:440–451. doi: 10.1016/j.cell.2008.02.049. [DOI] [PMC free article] [PubMed] [Google Scholar]
- 18.Mason N, Ciufo LF, Brown JD. Elongation arrest is a physiologically important function of signal recognition particle. EMBO J. 2000;19:4164–4174. doi: 10.1093/emboj/19.15.4164. [DOI] [PMC free article] [PubMed] [Google Scholar]
- 19.Pechmann S, Chartron JW, Frydman J. Local slowdown of translation by nonoptimal codons promotes nascent-chain recognition by SRP in vivo. Nat Struct Mol Biol. 2014;21:1100–1105. doi: 10.1038/nsmb.2919. [DOI] [PMC free article] [PubMed] [Google Scholar]
- 20.Lu J, Deutsch C. Electrostatics in the ribosomal tunnel modulate chain elongation rates. J Mol Biol. 2008;384:73–86. doi: 10.1016/j.jmb.2008.08.089. [DOI] [PMC free article] [PubMed] [Google Scholar]
- 21.Woolstenhulme CJ, Guydosh NR, Green R, Buskirk AR. High-precision analysis of translational pausing by ribosome profiling in bacteria lacking EFP. Cell Rep. 2015;11:13–21. doi: 10.1016/j.celrep.2015.03.014. [DOI] [PMC free article] [PubMed] [Google Scholar]
- 22.Voorhees RM, Hegde RS. Structures of the scanning and engaged states of the mammalian SRP-ribosome complex. elife. 2015;4 doi: 10.7554/eLife.07975. [DOI] [PMC free article] [PubMed] [Google Scholar]
- 23.Berndt U, Oellerer S, Zhang Y, Johnson AE, Rospert S. A signal-anchor sequence stimulates signal recognition particle binding to ribosomes from inside the exit tunnel. Proc Natl Acad Sci U S A. 2009;106:1398–1403. doi: 10.1073/pnas.0808584106. [DOI] [PMC free article] [PubMed] [Google Scholar]
- 24.Hainzl T, Sauer-Eriksson AE. Signal-sequence induced conformational changes in the signal recognition particle. Nat Commun. 2015;6:7163. doi: 10.1038/ncomms8163. [DOI] [PMC free article] [PubMed] [Google Scholar]
- 25.Holtkamp W, et al. Dynamic switch of the signal recognition particle from scanning to targeting. Nat Struct Mol Biol. 2012;19:1332–1337. doi: 10.1038/nsmb.2421. [DOI] [PubMed] [Google Scholar]
- 26.Loya A, et al. The 3′-UTR mediates the cellular localization of an mRNA encoding a short plasma membrane protein. RNA. 2008;14:1352–1365. doi: 10.1261/rna.867208. [DOI] [PMC free article] [PubMed] [Google Scholar]
- 27.Gao X, et al. Quantitative profiling of initiating ribosomes in vivo. Nat Methods. 2015;12:147–153. doi: 10.1038/nmeth.3208. [DOI] [PMC free article] [PubMed] [Google Scholar]
- 28.Kraut-Cohen J, et al. Translation- and SRP-independent mRNA targeting to the endoplasmic reticulum in the yeast Saccharomyces cerevisiae. Mol Biol Cell. 2013;24:3069–3084. doi: 10.1091/mbc.E13-01-0038. [DOI] [PMC free article] [PubMed] [Google Scholar]
- 29.Naranda T, MacMillan SE, Hershey JW. Purified yeast translational initiation factor eIF-3 is an RNA-binding protein complex that contains the PRT1 protein. J Biol Chem. 1994;269:32286–32292. [PubMed] [Google Scholar]
- 30.Elvekrog MM, Walter P. Dynamics of co-translational protein targeting. Curr Opin Chem Biol. 2015;29:79–86. doi: 10.1016/j.cbpa.2015.09.016. [DOI] [PMC free article] [PubMed] [Google Scholar]
Methods Online References
- 31.Ghaemmaghami S, et al. Global analysis of protein expression in yeast. Nature. 2003;425:737–741. doi: 10.1038/nature02046. [DOI] [PubMed] [Google Scholar]
- 32.Huh WK, et al. Global analysis of protein localization in budding yeast. Nature. 2003;425:686–691. doi: 10.1038/nature02026. [DOI] [PubMed] [Google Scholar]
- 33.Zhong T, Arndt KT. The yeast SIS1 protein, a DnaJ homolog, is required for the initiation of translation. Cell. 1993;73:1175–1186. doi: 10.1016/0092-8674(93)90646-8. [DOI] [PubMed] [Google Scholar]
- 34.Winzeler EA, et al. Functional characterization of the S. cerevisiae genome by gene deletion and parallel analysis. Science. 1999;285:901–906. doi: 10.1126/science.285.5429.901. [DOI] [PubMed] [Google Scholar]
- 35.Freidlin PJ, Patterson RJ. Heparin releases monosomes and polysomes from rough endoplasmic reticulum. Biochem Biophys Res Commun. 1980;93:521–527. doi: 10.1016/0006-291x(80)91108-0. [DOI] [PubMed] [Google Scholar]
- 36.Ingolia NT, Brar GA, Rouskin S, McGeachy AM, Weissman JS. The ribosome profiling strategy for monitoring translation in vivo by deep sequencing of ribosome-protected mRNA fragments. Nat Protoc. 2012;7:1534–1550. doi: 10.1038/nprot.2012.086. [DOI] [PMC free article] [PubMed] [Google Scholar]
- 37.Martin M. Cutadapt removes adapter sequences from high-throughput sequencing reads. EMBnet.journal. 2011;17:10. [Google Scholar]
- 38.Langmead B, Trapnell C, Pop M, Salzberg SL. Ultrafast and memory-efficient alignment of short DNA sequences to the human genome. Genome Biol. 2009;10:R25. doi: 10.1186/gb-2009-10-3-r25. [DOI] [PMC free article] [PubMed] [Google Scholar]
- 39.Kim D, et al. TopHat2: accurate alignment of transcriptomes in the presence of insertions, deletions and gene fusions. Genome Biol. 2013;14:R36. doi: 10.1186/gb-2013-14-4-r36. [DOI] [PMC free article] [PubMed] [Google Scholar]
- 40.Lawrence M, et al. Software for computing and annotating genomic ranges. PLoS Comput Biol. 2013;9:e1003118. doi: 10.1371/journal.pcbi.1003118. [DOI] [PMC free article] [PubMed] [Google Scholar]
- 41.Huber W, et al. Orchestrating high-throughput genomic analysis with Bioconductor. Nat Methods. 2015;12:115–121. doi: 10.1038/nmeth.3252. [DOI] [PMC free article] [PubMed] [Google Scholar]
- 42.Bendtsen JD, Nielsen H, von Heijne G, Brunak S. Improved prediction of signal peptides: SignalP 3.0. J Mol Biol. 2004;340:783–795. doi: 10.1016/j.jmb.2004.05.028. [DOI] [PubMed] [Google Scholar]
- 43.Käll L, Krogh A, Sonnhammer EL. A combined transmembrane topology and signal peptide prediction method. J Mol Biol. 2004;338:1027–1036. doi: 10.1016/j.jmb.2004.03.016. [DOI] [PubMed] [Google Scholar]
- 44.Reynolds SM, Käll L, Riffle ME, Bilmes JA, Noble WS. Transmembrane topology and signal peptide prediction using dynamic bayesian networks. PLoS Comput Biol. 2008;4:e1000213. doi: 10.1371/journal.pcbi.1000213. [DOI] [PMC free article] [PubMed] [Google Scholar]
- 45.Krogh A, Larsson B, von Heijne G, Sonnhammer EL. Predicting transmembrane protein topology with a hidden Markov model: application to complete genomes. J Mol Biol. 2001;305:567–580. doi: 10.1006/jmbi.2000.4315. [DOI] [PubMed] [Google Scholar]
- 46.Breker M, Gymrek M, Moldavski O, Schuldiner M. LoQAtE--Localization and Quantitation ATlas of the yeast proteomE. A new tool for multiparametric dissection of single-protein behavior in response to biological perturbations in yeast. Nucleic Acids Res. 2014;42:D726–D730. doi: 10.1093/nar/gkt933. [DOI] [PMC free article] [PubMed] [Google Scholar]
- 47.Becker AH, Oh E, Weissman JS, Kramer G, Bukau B. Selective ribosome profiling as a tool for studying the interaction of chaperones and targeting factors with nascent polypeptide chains and ribosomes. Nat Protoc. 2013;8:2212–2239. doi: 10.1038/nprot.2013.133. [DOI] [PMC free article] [PubMed] [Google Scholar]
- 48.Love MI, Huber W, Anders S. Moderated estimation of fold change and dispersion for RNA-seq data with DESeq2. Genome Biol. 2014;15:550. doi: 10.1186/s13059-014-0550-8. [DOI] [PMC free article] [PubMed] [Google Scholar]
- 49.Robinson MD, McCarthy DJ, Smyth GK. edgeR: a Bioconductor package for differential expression analysis of digital gene expression data. Bioinformatics. 2010;26:139–140. doi: 10.1093/bioinformatics/btp616. [DOI] [PMC free article] [PubMed] [Google Scholar]
- 50.Beckert B, et al. Translational arrest by a prokaryotic signal recognition particle is mediated by RNA interactions. Nat Struct Mol Biol. 2015;22:767–773. doi: 10.1038/nsmb.3086. [DOI] [PubMed] [Google Scholar]
- 51.Murtagh F, Legendre P. Ward's Hierarchical Agglomerative Clustering Method: Which Algorithms Implement Ward's Criterion? Journal of Classification. 2014;31:274–295. [Google Scholar]
- 52.Pédelacq JD, Cabantous S, Tran T, Terwilliger TC, Waldo GS. Engineering and characterization of a superfolder green fluorescent protein. Nat Biotechnol. 2006;24:79–88. doi: 10.1038/nbt1172. [DOI] [PubMed] [Google Scholar]
- 53.Gibson DG, et al. Enzymatic assembly of DNA molecules up to several hundred kilobases. Nat Methods. 2009;6:343–345. doi: 10.1038/nmeth.1318. [DOI] [PubMed] [Google Scholar]
- 54.Hessa T, et al. Recognition of transmembrane helices by the endoplasmic reticulum translocon. Nature. 2005;433:377–381. doi: 10.1038/nature03216. [DOI] [PubMed] [Google Scholar]
- 55.Pechmann S, Frydman J. Evolutionary conservation of codon optimality reveals hidden signatures of cotranslational folding. Nat Struct Mol Biol. 2013;20:237–243. doi: 10.1038/nsmb.2466. [DOI] [PMC free article] [PubMed] [Google Scholar]
- 56.Ingolia NT, Lareau LF, Weissman JS. Ribosome profiling of mouse embryonic stem cells reveals the complexity and dynamics of mammalian proteomes. Cell. 2011;147:789–802. doi: 10.1016/j.cell.2011.10.002. [DOI] [PMC free article] [PubMed] [Google Scholar]
- 57.Doerfel LK, Rodnina MV. Elongation factor P: Function and effects on bacterial fitness. Biopolymers. 2013;99:837–845. doi: 10.1002/bip.22341. [DOI] [PubMed] [Google Scholar]
Associated Data
This section collects any data citations, data availability statements, or supplementary materials included in this article.


