Abstract
Dynamin-2 (DNM2) is a GTPase essential for intracellular vesicle formation and trafficking, cytokinesis and receptor endocytosis. Mutations in DNM2 are common in early T-cell precursor acute lymphoblastic leukemia. However, DNM2 expression in other types of ALL are not reported. We studied DNM2 mRNA level in adults with B- and T-cell ALL. We found DNM2 is more highly expressed compared with normals in both forms of ALL. High DNM2 expression is associated with some clinical and laboratory features, inferior outcomes and with leukaemia cell proliferation. We also found Ikaros directly binds the DNM2 promoter and suppresses DNM2 expression. Consequently IKZF1 deletion is associated with high DNM2 expression. Conversely, casein kinase-2 (CK2)-inhibitor increases Ikaros function thereby inhibiting DNM2 expression. Inhibiting DNM2 suppresses proliferation of leukemia cells and synergizes with CK2 inhibition. Our data indicate high DNM2 expression is associated with Ikaros dysregulation and may be important in the development of B-ALL.
Dynamin-2 (DNM2) is a microtubule-associated GTPase essential for intracellular vesicle formation and trafficking, cytokinesis, and receptor endocytosis. Recent reports suggest over-expression of DNM2 promotes cancer cell growth, migration and invasion in diverse cancers1,2,3. One DNM2 mutant, DNM2V265G, is associated with cancer development in mice4. Recently, mutations in DNM2 were detected in early T-cell precursor acute lymphoblastic leukemia (ALL)5,6. There are no studies of DNM2 mRNA levels in ALL.
IZKFI encodes the DNA-binding zinc finger protein Ikaros essential for normal hematopoiesis and immune development7,8,9,10,11. Ikaros is also a tumor suppressor gene in acute B- and T-cell ALL11,12,13,14. Recently, we reported the Ikaros global binding profiling in ALL cells. We found Ikaros regulates expression of its targets through chromatin remodeling in ALL15,16,17,18. We also found CK2-inhibitors increase tumor suppressor activity of Ikaros and act as a functional activator of Ikaros15,16,17. Our ChIP-seq data indicate Ikaros binding peaks in the promoter region of DNM2. However, it is unclear how Ikaros regulates DNM2 expression. We studied correlations between DNM2 mRNA level and outcomes in adults with B- and T-cell ALL. Our data suggest high expression of DNM2 with consequent Ikaros dysfunction is associated with development of B-cell ALL.
Results
Clinical and laboratory variables in subjects with high and low DNM2 expression
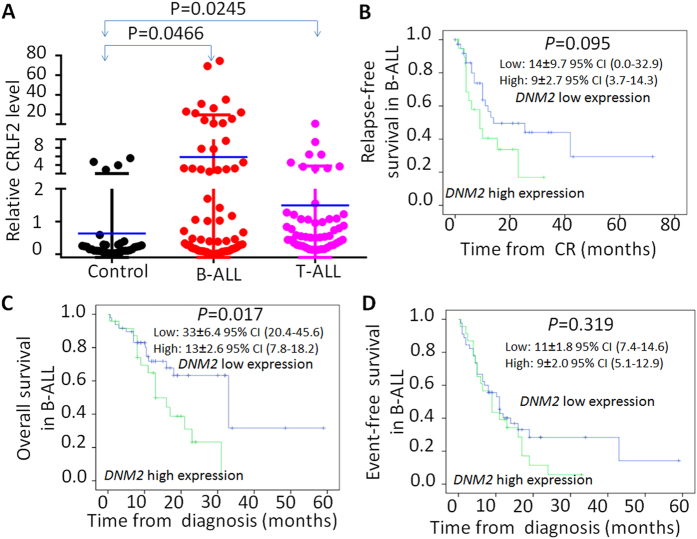
DNM2 mRNA levels in bone marrow samples from adults with ALL, especially those with B-cell ALL, were significantly higher than those in normals (Fig. 1A). We compared clinical and laboratory variables in subjects with B- and T-cell ALL divided into cohorts with high or low DNM2 mRNA levels (Tables 1 and 2). In B-cell ALL, high DNM2 mRNA levels were associated with a WBC ≥ 30 × 10E + 9/L compared to low DNM2 expression (79% vs. 42%; P = 0.003). This associated was confirmed in multivariate analyses (HR 4.56, 95% confidence interval [CI] 1.09, 19.01; P = 0.037; Table 1). The high DNM2 expression cohort also had a higher frequency of lymph-adenopathy compared with the low DNM2 expression cohort (61% vs. 23%; P = 0.002) confirmed in multivariate analyses (HR 7.245, [1.74, 30.13]; P = 0.006; Table 1). There were no significant associations between clinical and laboratory variables in the high versus low DNM2 expression cohorts in subjects with T-cell ALL (Table 2).
Figure 1. DNM2 expression in ALL patients and its correlation with survival of B-ALL patients.
q-PCR was performed to detect DNM2 in ALL patient samples and normal BM controls. (A) Comparison of DNM2 expression in B-ALL and T-ALL to normal BM control; (B–D) Comparison of relapse-free survival (B), overall survival (C) and event-free survival in patients with DNM2 high expression to those in patients with DNM2 low expression.
Table 1. Correlation of DNM2 expression with clinical and laboratory variables in subjects with B-cell ALL.
| DNM2 high expression (N = 24) | DNM2 low expression (N = 48) | Univariate analyses (Chi-Square Tests) | Multivariate analyses (Multivariate Cox model) |
||
|---|---|---|---|---|---|
| P | P | HR (95% CI) | |||
| Age (y; median; range) | 40 (14–68) | 37 (14–77) | 0.645 | 0.543 | 0.961–1.078 |
| Male (%) | 41.7 | 58.3 | 0.182 | 0.202 | 0.016–2.392 |
| WBC, × 109/L (median; range) | 43 (1–488) | 30 (1–398) | 0.840 | 0.504 | 0.993–1.014 |
| WBC ≥ 30 × 109/L (%) | 79.2 | 41.7 | 0.003 | 0.037 | 4.557 (1.092–19.009) |
| Haemoglobin, g/L (median; range) | 84 (44–150) | 95 (48–157) | 0.728 | 0.127 | 0.933–1.009 |
| Platelets × 10E + 9/L (median; range) | 37 (8–292) | 45 (4–269) | 0.853 | 0.602 | 0.991–1.016 |
| LDH (U/L; median; range) | 735 (214–7142) | 596 (125–4129) | 0.625 | 0.555 | 0.998–1.001 |
| CD13 + (%) | 35.0 | 55.3 | 0.142 | 0.161 | 0.051–1.640 |
| CD33 + (%) | 42.1 | 47.4 | 0.707 | 0.643 | 0.229–10.903 |
| Hepatomegaly (%) | 10.0 | 4.2 | 0.714 | 0.995 | 0.064–15.889 |
| Splenomegaly (%) | 45.8 | 22.9 | 0.047 | 0.059 | 346.876 (0.803–1.498 × 10⁵) |
| Lymphadenopathy (%) | 60.9 | 22.7 | 0.002 | 0.006 | 7.245 (1.742–30.134) |
| IKZF1 deletion (IK6) (%) | 54.2 | 20.8 | 0.004 | 0.016 | 6.151 (1.401–27.000) |
| BCR/ABL1 (%) | 39.1 | 44.4 | 0.675 | 0.510 | 0.225–20.109 |
| Complex karyotype (%) | 12.5 | 23.3 | 0.623 | 0.253 | 0.015–3.024 |
Table 2. Correlation of DNM2 expression with clinical and laboratory variables in subjects with T-ALL.
| Characteristics | DNM2 high expression (N = 8) | DNM2 low expression(N = 43) | Univariate analyses (Chi-Square Tests) | Multivariate analyses (Multivariate Cox model) | |
|---|---|---|---|---|---|
| P | P | 95% CI | |||
| Age (years) | 32 (20–55) | 28 (14–62) | 0.736 | 0.679 | 0.877–1.090 |
| Male (%) | 75.0 | 74.4 | 1.000 | 0.789 | 0.093–22.805 |
| WBC, × 109/L median (range) | 25.8 (8.7–52.7) | 47.9 (3.0–546.0) | 0.096 | 0.210 | 0.913–1.020 |
| WBC ≥ 30 × 109/L (%) | 25.0 | 63.2 | 0.113 | 0.064 | 0.034–1.098 |
| HGB, g/L median (range) | 123 (63–153) | 114 (56–167) | 0.766 | 0.756 | 0.964–1.052 |
| PLT, × 109/L median (range) | 103 (44–223) | 56 (17–267) | 0.137 | 0.923 | 0.982–1.021 |
| LDH (U/L) median (range) | 1067 (262–4905) | 861 (131–8601) | 0.953 | 0.713 | 1.000–1.001 |
| CD13 + (%) | 33.3 | 32.3 | 1.000 | 0.746 | 0.130–17.239 |
| CD33 + (%) | 33.3 | 37.5 | 1.000 | 0.690 | 0.057–6.637 |
| Hepatomegaly (%) | 0.0 | 17.1 | 0.478 | 0.999 | 0.000– |
| Splenomegaly (%) | 50.0 | 44.2 | 1.000 | 0.382 | 0.340–16.613 |
| Lymphadenopathy (%) | 62.5 | 82.1 | 0.449 | 0.928 | 0.081–10.601 |
| complex karyotype (%) | 0.0 | 11.8 | 0.726 | 0.999 | 0.000– |
Correlation between DNM2 expression and clinical outcomes
Subjects with B-cell ALL and high DNM2 expression had briefer median RFS than those with low DNM2 expression (9 months [3.7, 14.3 months] vs. 14 months [0, 37.9 months]; P = 0.095; Fig. 1B). 5 year survival was significantly briefer in those with high DNM2 expression (13 months [7.8, 18.2 months] vs. 33 months [20.4, 45.6 months]; P = 0.017; Fig. 1C). There was no significant difference in median EFS between the cohorts (9 months [5.1, 12.9 months] vs. 11 months [7.4, 14.6 months]; P = 0.319; Fig. 1D). There were no significant associations between DNM2 expression and any outcome in subjects with T-ALL (Supplemental Figure 2 and Table 2).
Ikaros binds to the DNM2 promoter and regulates its expression in ALL
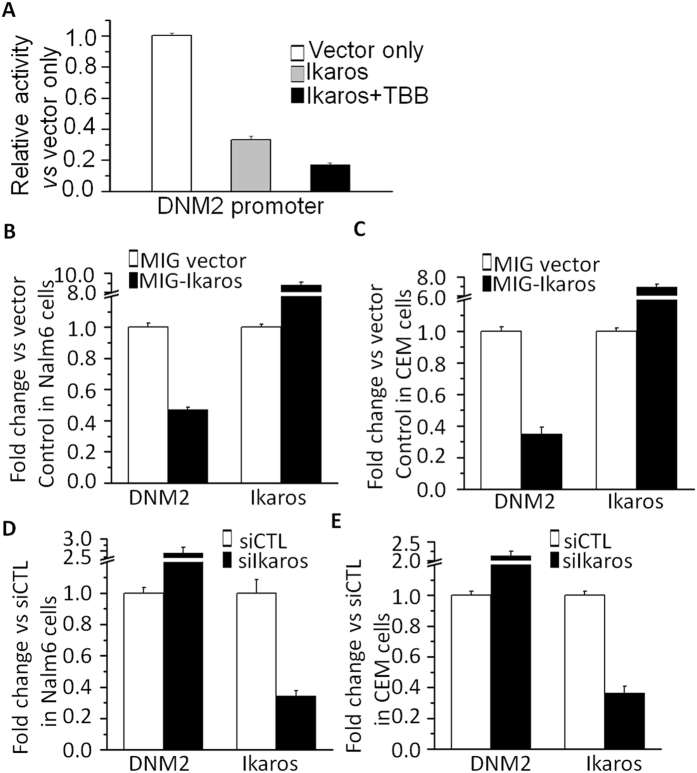
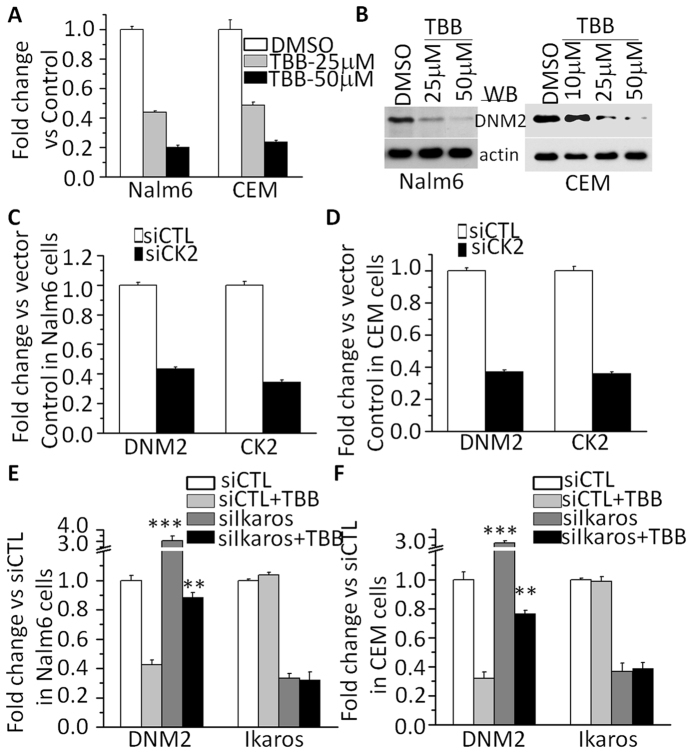
To address the potential mechanism underlying high DNM2 expression we analyzed transcription factor motifs in the DNM2 promoter region. ChIP-seq data identified Ikaros binding peaks in the DNM2 promoter region in Nalm6 B-ALL (Fig. 2A) and primary B-cell ALL cells (Supplemental Figure 3)15,16. Ikaros binding was confirmed by qChIP assay (Fig. 2B and C). Weak binding was also found in U-937 AML cells and Molt-4 T-cell ALL cells (Fig. 2B). Ikaros suppressed promoter activity of DNM2 by luciferase reporter assay (Fig. 3A). These data indicate a direct effect of Ikaros on DNM2 transcription. Expression of Ikaros suppresses DNM2 mRNA levels in Nalm6 (Fig. 3B) and CEM cells (Fig. 3C). Conversely, efficient Ikaros knockdown increased DNM2 expression in Nalm6 (Fig. 3D) and CEM cells (Fig. 3E). Treating Nalm6 and CEM cells with TBB suppressed DNM2 mRNA levels in a dose-dependent manner detected by qPCR (Fig. 4A) and protein levels by western blotting (Fig. 4B). CK2 knockdown with shRNA also induced suppression of DNM2 expression in Nalm6 (Fig. 4C) and CEM cells (Fig. 4D). Ikaros knockdown with shRNA blocked the TBB-induced decrease of DNM2 expression in Nalm6 and CEM (Fig. 4E and F) cells. These data indicate DNM2 is the direct target of Ikaros and that Ikaros suppresses DNM2 expression in B- and T-cell ALL.
Figure 2. Ikaros binds the promoters of DNM2.
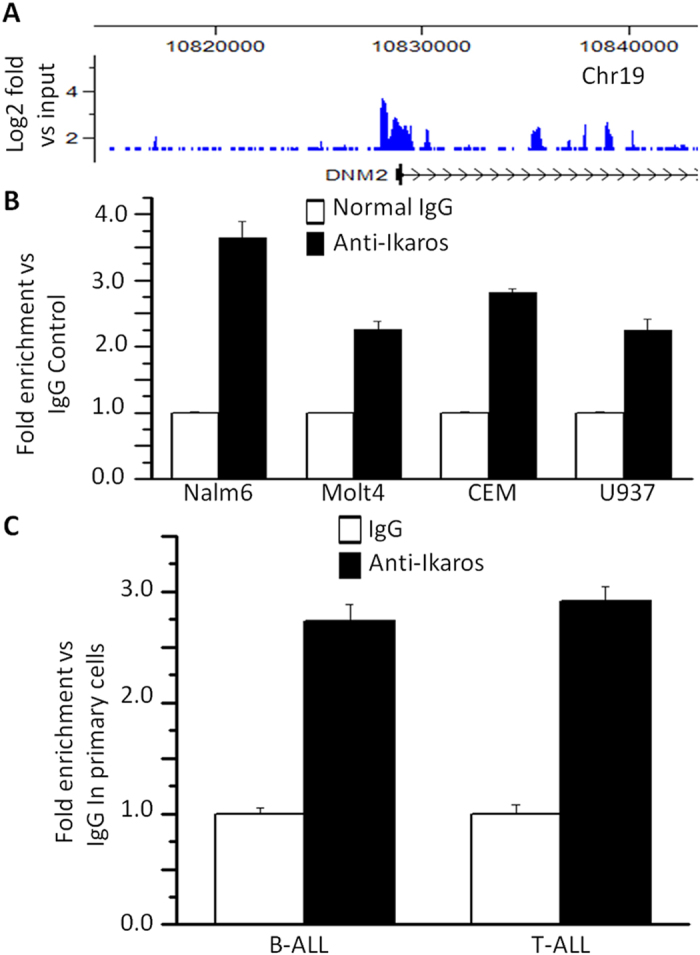
(A) Ikaros binding peaks at the promoter of DNM2 identified by ChIP-seq in Nalm6 cells. (B,C) qChIP assay to assess Ikaros binding at the promoter of DNM2 in ALL cell lines (B) and primary ALL patients’ samples(C).
Figure 3. Ikaros suppresses DNM2 expression.
(A) The promoter activity of DNM2 promoters by luciferase reporter assay following transfection with Ikaros or control vector in HEK293 cells. (B,C) Expression of DNM2 in Nalm6 (B) and CEM (C) cells transduced with vector containing Ikaros as compared to control vector. (D,E) Comparison of DNM2 expression in Nalm6 (D) and CEM (E) cells treated with Ikaros shRNA (siIkaros) or scramble shRNA (siCTL). Gene expression is determined by RT-qPCR using total RNA isolated from the cells transfected with scramble shRNA (siCTL) or Ikaros shRNA (siIkaros) for 2 days. Compared with siCTL in C: *p < 0.05, **p < 0.01 compared to siCTL group.
Figure 4. Effect of CK2 inhibitor on expression of DNM2.
(A,B) The CK2 inhibitor, TBB, suppresses DNM2 expression in ALL cells as assessed by q-PCR (A) and by western blot (B). (C,D) CK2 knockdown15 suppresses DNM2 expression in Nalm6 B-ALL (C) and CEM T-ALL (D) cells by q-PCR. (E,F) Ikaros knockdown rescues the TBB-induced change in DNM2 in Nalm6 B-ALL (E) and CEM T-ALL (F) cells. Compared with siCTL + TBB in D and E: *P < 0.05; **P < 0.01.
Correlation of IKZF1 deletion with DNM2 high expression in ALL cells
We next analyzed a possible correlation between IKZF1 levels with DNM2 in primary ALL cells19,20,21. We found IKZF1 mRNA levels were inversely-correlated with high DNM2 expression in both cohorts (Supplemental Figures 4 and 5). We also found DNM2 expression was significantly higher in B-cell ALL cells with Ik6 (13.58 ± 5.53 vs. 3.28 ± 0.92; P = 0.0048; Fig. 5A). Frequency of Ik6 in subjects with high DNM2 expression was significantly higher than in subjects with low DNM2 expression (54% vs. 21%; P = 0.004) confirmed in multivariate analyses (HR 6.15 [1.40, 27.00]; P = 0.016; Table 1). These data suggest IKZF1 deletion may contribute to high DNM2 expression. Furthermore, treatment of primary B- and T-cell ALL cells with TBB increased Ikaros binding to the DNM2 promoter region compared with normals (Fig. 5B). qPCR assays showed TBB treatment inhibited expression of DNM2 mRNA in a dose-dependent manner (Fig. 5C). These results indicate Ikaros binds to the DNM2 promoter and treatment with TBB, which enhances Ikaros tumor suppressor activity, suppresses DNM2 expression.
Figure 5. IKZF1 deletion results in increase of DNM2 expression in primary B-ALL cells.
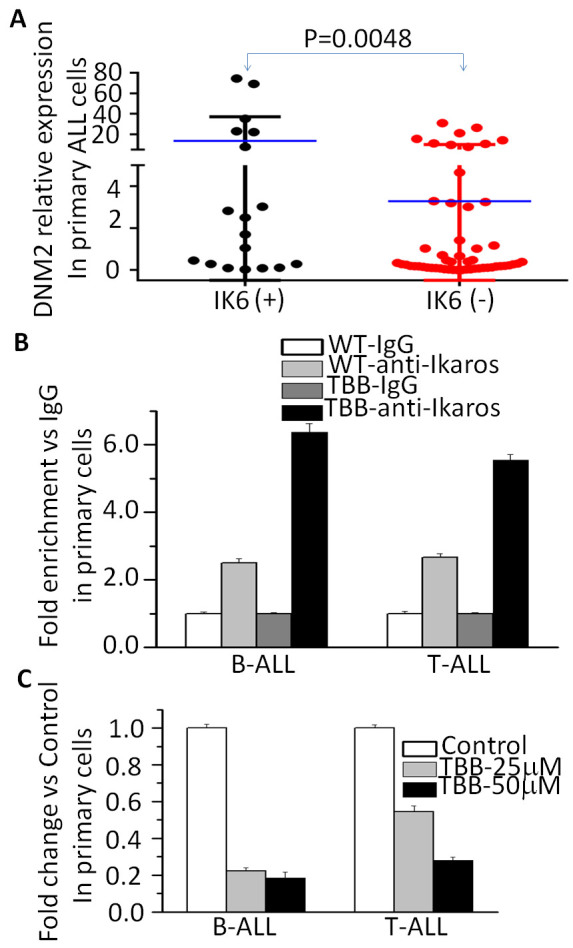
(A) comparison of DNM2 expression in patients with or without IKZF1 deletion; (B) Effect of CK2 inhibitor (TBB) on Ikaros binding on the promoter of DNM2 in primary ALL cells; (C) Effect of CK2 inhibitor (TBB) on expression of DNM2 in primary B-ALL cells with TBB treatment for 2 days.
Enhanced Ikaros activity from CK2-inhibition increases H3K9me3 at the DNM2 promoter
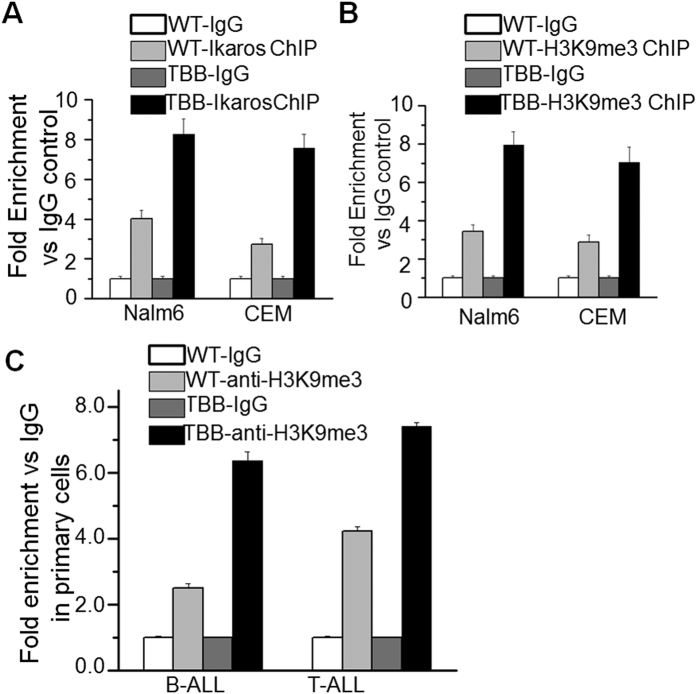
We reported Ikaros regulates gene expression through chromatin remodeling16. To further explore the epigenetic mechanism by which Ikaros regulates DNM2 expression we performed ChIP assay and amplified the resulting DNM2 promoter sequences. Our data indicate TBB treatment significantly increases binding of Ikaros to the DNM2 promoter region compared with untreated Nalm6 B-cell ALL cells and with CEM T-cell ALL cells (Fig. 6A). TBB treatment also enhanced binding of H3K9me3 at the DNM2 promoter region in Nalm6 and CEM cells (Fig. 6B). Results were similar with primary B- and T-cell ALL cells (Fig. 6C). There was no enrichment of other histone modification markers in the DNM2 promoter region (data not shown).
Figure 6. Ikaros suppresses DNM2 expression via chromatin remodeling.
(A–C) The CK2 inhibitor, TBB, increases the enrichment of Ikaros (A) and H3K9me3 (B,C) in B-ALL cells and patients’ samples. The cells were treated with TBB 25 μM for 1–2 days and qChIP was performed as described in methods section.
MiTMAB suppresses cell proliferation and synergizes with CK2-inhibitors in ALL
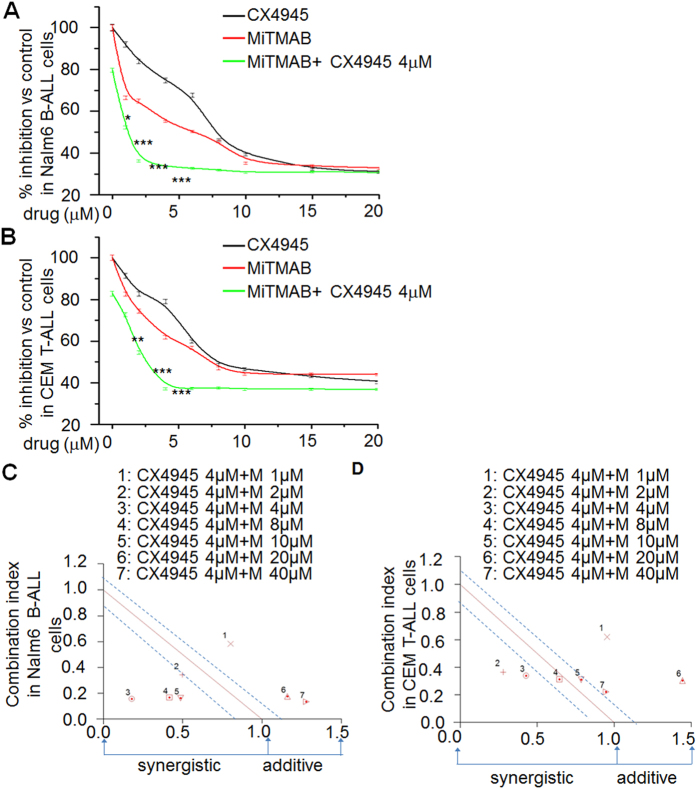
We used the WST-1 cell proliferation assay to test whether targeting DNM2, with MiTMAB, a DNM2-inhibitor, had an anti-leukemia effect in ALL cells22. Treatment with MiTMAB had a dose-dependent effect on proliferation of Nalm6 B-cell ALL cells (Fig. 7A) and CEM T-cell ALL cells (Fig. 7B). In contrast, treatment with Dynasore, a GTPase-inhibitor which suppresses dynamin activity and prevents endocytosis, had no significant effect on cell proliferation (data not shown)23,24. Because CK2-inhibition results in reduced expression of DNM2 we tested whether the CK2-inhibitors TBB and CX-4945 with MiTMAB altered cell proliferation. CX-4945 (4 μM) and various doses of MiTMAB resulted in less proliferation of Nalm-6 (Fig. 7A) and CEM cells (Fig. 7B) compared to MiTMAB alone (Fig. 7A green line vs. red line). Using the CalcuSyn assay we found treatment with CX-4945 and MiTMAB were synergistic in inhibiting proliferation of Nalm-6 (Fig. 7C) and CEM (Fig. 7D) cells25. Similar result was observed for TBB (data not shown). These data indicate targeting DNM2 transcription significantly suppresses proliferation of ALL cells and that inhibiting DNM2 with TBB, a CK2–inhibitor restores Ikaros function.
Figure 7. DNM2 inhibitor suppresses the cell proliferation of ALL cells and its synergistic effect with CK2 inhibitors.
(A,B) Effect of CX-4945 (grey line), MiTMAB (red line) and combination of MiTMAB with CX-4945 (green line) on proliferation of Nalm6 cells (A) and CEM cells (B). *P ≤ 0.05; **P ≤ 0.01; *** ≤ 0.001. (C,D) Analysis of synergistic effect of MiTMAB with CX4945 with Calcusyn in Nalm6 cell (C) and CEM cells (D). Y axis is the combination index (CI) value. CI value is: 1.15 to 0.8, additive effect; 0.85 to 0.7, moderate synergistic; < 0.7, very synergistic effect.
Discussion
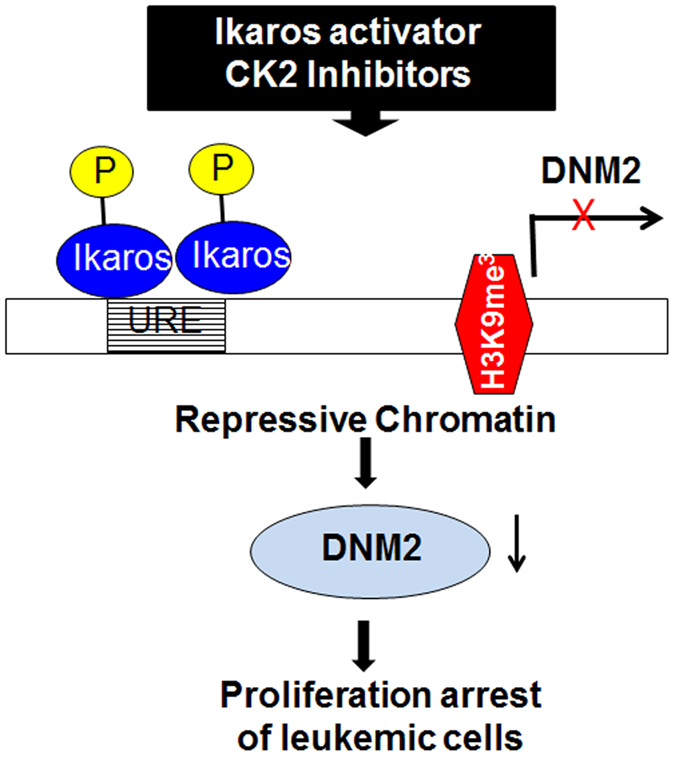
High DNM2 expression was seen in adults with B- and T-cell ALL. In persons with B-cell ALL, high DNM2 expression is associated with cell proliferation, extra-medullary leukaemia, an increased relapse risk and briefer survival. We also found DNM2 expression is significantly higher in subjects with IKZF1 deletion. Ikaros directly suppresses DNM2 expression in ALL cells and a CK2-inhibitor which restores Ikaros function and suppresses DNM2 expression in an Ikaros-dependent manner in leukemia cells by recruiting the repressive histone marker-H3K9me3. Importantly, we observed DNM2-inhibitors suppresses proliferation of leukemia cells and is synergistic with CK2-inhibitors. Our findings suggest an oncogenic role for high DNM2 expression in ALL, a possible therapeutic role for DNM2–inhibitors alone or combined with CK2 inhibitors in B-cell ALL (Fig. 8).
Figure 8. Model for the mechanism of Ikaros regulation of DNM2 expression.
Others have reported DNM2 mutations in adults with ALL but DNM2 expression was not studied5,6,26. Although we did not detect DNM2 mutations in adults with B-cell ALL (data not shown) we found significantly higher expression of DNM2. In contrast, we detected DNM2 mutations in 4 adults with T-cell ALL27. High DNM2 expression is also seen in subjects with T-cell ALL, but DNM2 expression in subjects with mutations is difficult to evaluate because of few subjects. Although we found clinical correlations between DNM2 expression and laboratory variables in B-cell ALL we did not find this in T-cell ALL, perhaps because the few subjects studied gave us little power to detect correlations.
High DNM2 expression is reported in human cancers and is associated with cancer progression and metastasis28,29, and cancer cell proliferation30. Oncogenic mechanisms underlying high DNM2 expression are partially understood. For example, DNM2 enzymatic activity and proper intra-cellular localization are required for extracellular matrix degradation by invasive cancer cells31. DNM2 is required for the endocytosis of several proteins associated with cancer motility and invasiveness32,33 and for endocytosis of several oncogenic receptors34,35. Furthermore, DNM2 regulates Golgi structure and vesiculation during the secretory process which can affect trafficking of other carcinogenic signaling molecules36. Finally, DNM2 interacts with F-actin and actin dynamics, actin-associated proteins, and molecules that induce or sense membrane curvature as well as expression of angiogenic receptors37,38. Our study shows high DNM2-expression in persons with ALL. We and others think DNM2 may be important to regulate membrane trafficking of oncogenes and/or oncogenic receptors signaling. It is reported that DNM2 is critical for endocytosis and/or internalization of IL7R, T cell receptor (TCR) and Notch1 ligand Delta-like1 (Dll1), which will trigger signaling activation in the receptor-presenting cells and could be important in the development of ALL4,7,38,39,40,41. Moreover, DNM2 is involved in control of cytokinesis and acts like a signal transducing GTPase affecting transcriptional regulation42. We observed the MiTMAB suppresses the cell proliferation of ALL cells, which is consistent with dynamin inhibitor (MiTMAB)-induced apoptosis in human Jurkat T cells43. We also observed that DNM2 is localized predominately in the cytoplasm with a weak nuclear localization in ALL cells (data not shown). These data suggest a possible nuclear mechanism underlying the oncogenic effect of DNM2 high expression in ALL although it needs to be further clarified.
It is largely unknown how DMN2 expression is regulated44. Our current study suggests that Ikaros suppresses transcription of DNM2 in leukemia cells. We observed Ikaros directly binds to and suppress DNM2 expression. Although Ikaros is dysfunctional in ALL, CK2-inhibitor suppresses DNM2 expression by restoring Ikaros function by chromatin re-modeling. These findings may explain the upstream mechanism underlying high DNM2 expression. We also observed a synergistic effect of a DNM2-inhibitor with a CK2-inhibitor in suppressing proliferation of B-ALL cells. These data suggest a possible role for inhibiting DNM2 as a therapy of adult ALL.
Materials and Methods
Subjects and samples
Between June 2008 and June 2015, 123 consecutive subjects with newly-diagnosed ALL (age 14–77 years old) were studied at the First Affiliated Hospital of Nanjing Medical University (72 had B-cell and 51, T-cell ALL). Diagnoses were based on the WHO Diagnosis and Classification of ALL (2008). The written informed consent was provided by all subjects. The study was approved by the Ethics Committee of the First Affiliated Hospital of Nanjing Medical University, Jiangsu Province Hospital, Nanjing, China, with the 1964 Helsinki declaration and its later amendments or comparable ethical standards. There were no studies with animals.
Therapy
Therapy details are published protocol (CALLG2008)45. Induction was with VDCLP (vincristine, daunorubicin, cyclophosphamide, L-asparaginase, prednisone). Early consolidation used CAT (cyclophosphamide, cytarabine, thioguanine), high-dose methotrexate/L-asparaginase, and mitoxantrone. Late consolidation used VDLP (vincristine, daunorubicin, L-asparaginase, prednisone), COATD (cyclophosphamide, vincristine, cytarabine, epipodophyllotoxin and dexamethasone), high-dose methotrexate/L-asparaginase, epipodophyllotoxin andcytarabine. Maintenance therapy used 6-mercaptopurine and methotrexate. Subjects with BCR/ABL1-positive ALL received Imatinib from day 15 of introduction therapy.
Cytogenetic and molecular analyses
Cytogenetics and detection of the most common Ikaros deletion, Ikaros 6 (Ik6) were analyzed as described17. qPCR was performed on StepOne Plus Real-time PCR system (Applied Biosystem-Thermofisher, Foster, CA, USA). Gene expression values of genes of interest (GOI) were achieved in each sample by a formula derived from a scatter graph of Ct values from serial dilutions of a template standard as described17,28. Expression levels of GOIs were normalized to housekeeping genes expressed as gene expression value of GOI/18 s rRNA. Subjects were allocated in a high or low DNM2 expression cohort (4th quartile vs. 1st–3rd quartiles) with a cut-off value (1.619) was determined by SPSS 17.017.
qPCR for DNM2 expression was analyzed as above in Nalm6, CEM cells and primary ALL cells. Results were normalized to those obtained with 18 s rRNA and presented as fold-induction over vector controls. Primers: 18s rRNA, Sense:5′-GTAACCCGTTGAACCCCATT-3′, Anti-sense: 5′-CCATCCAATCGGTAGTAGCG-3′; DNM2 Sense: 5′-TCAGGACCGGGCTTTTCA-3′, Anti-sense: 5′-CGACCTGCTTTTTCACAATGG-3′.
Cell culture, plasmids and retroviral gene transfer
The Nalm6 cell line is previously described46. The CCRF-CEM (CEM), MOLT-4 and U-937 cell lines were obtained from the American Type Culture Collection (ATCC, Manassas, VA). Cells were cultured in RPMI-1640 medium (Cellgro, Tewksbury, MA, USA) supplemented with 10% fetal bovine serum (Hyclone, Logon, Utah, USA). HEK 293T cells were cultured in DMEM (Cellgro) supplemented with 10% fetal calf serum and 1% L-glutamine (Cellgro). Cells were incubated at 37 °C in a humidified atmosphere with 5% CO2. Primary human B- and T-cell ALL cells were cultured in RPMI–1640 medium (Cellgro) supplemented with 10% fetal bovine serum (GE-Hyclone, Logon, Utah, USA). 4,5,6,7-Tetrabromobenzotriazole (TBB) and CX-4945 were purchased from Sigma (St. Louis, MO, USA). Cells were cultured with or without TBB and collected for total RNA isolation. Human IKZF1 retroviral construct and retroviral production was described15,17,47,48.
Luciferase Assay
Promoter of DNM2 (−1000bp to +200 bp) was cloned into pGL4.15 vector (Promega, Madison, WI, USA). The transient luciferase assay was performed in HEK293T cells using the Promega luciferase assay reagents and measured with a luminometer according to the manufacturer instructions15,17. The firefly luciferase activities were calculated as fold-change relative to values obtained from pGL4.15 vector only control cells, and expressed as a percent of pcDNA3.1-Ikaros transfection-induced luciferase activity vs. the pcDNA3.1 vector. All transfection and reporter assays were performed independently in triplicate at least three times.
Quantitative Chromatin Immune precipitation (qChIP)
qChIP assays were performed by incubating chromatin with antibodies against Ikaros15,16,17, H3K9me3 (Abcam, Cambridge, MA, USA) or normal rabbit IgG (Abcam) as a control15,16,17,48. Enrichment of the ChIP sample over input was evaluated by qPCR with ≥ 3 replicates using specific primers in the promoter region of DNM2(forward: 5′-ACCGCGGGATGGAAGAG-3′, reverse: 5′-TGAAGGCGTCCTGCAGTTT-3′). Relative concentration of the qPCR product is presented as the fold change of the level of DNA-Ikaros and DNA-H3K9me3 samples compared with controls.
IKZF1 shRNA knockdown
Nalm6 and CEM cells were transiently transfected with human IKZF1 shRNA constructs in the GFP vector (pGFP-v-RS) (OriGene) using the Neon Transfection System (Invitrogen, Carlsbad, CA, USA). We used scrambled 29-mer shRNA cassette in the pGFP-v-RS vector as a control. Knockdown of Ikaros was confirmed by IKZF1 mRNA level15,17,31. Primers used for qPCR are 5′-GGCGCGGTGCTCCTCCT-3′ (IKZF1-F) and 5′-TCCGACACGCCCTACGACA-3′(IKZF1-R).
Western blot
Cell lysates were prepared as described15,47,48. 20 μg protein was boiled in SDS sample buffer for 10 min., samples run on SDS-PAGE and transferred to the membrane which were blocked with 5% non-fat dry milk at 24 °C for 1 h and incubated overnight at 4 °C with primary antibody (anti-DNM2, 1:1000; Abcam) or anti-actin (1;1000, Santa Cruz, Dallas, TX, USA). The membrane was washed and incubated with goat anti-rabbit IgG conjugated to horseradish peroxidase (1:3000) at 24 °C for 2 h. Blots were developed by the enhanced chemi-luminescence (ECLPlus, Amersham, Arlington Heights, IL, USA) according to the manufacturer’s instructions.
Cell Proliferation Assay
Cell proliferation was assayed as described15,48. Briefly, the colorimetric assay (WST-1 reagent) from Roche Life Science (Indianapolis, IN, USA) was performed in 96-well white clear bottom plates (Costar, 3603). 10E + 4 cells were seeded per well with no or PBIT treatment at the indicated concentration and cultured for 72 h. WST-1 reagent was added (10 μl/well) for 4 h and absorbance at 440 nm was measured using a Synergy H1 Hybrid Reader (BioTek. Winooski, VT, USA).
Statistical analyses
Median differences between the cohorts were evaluated using a Mann–Whitney U-test. Frequency differences were analyzed using uni- and multivariate Cox model. Relapse-free survival (RFS), event-free survival (EFS) and overall survival (OS) were estimated by the Kaplan-Meier method and compared by log-rank test. The Starting point for the observation time for EFS and OS were date of diagnosis. Death in induction, resistance, relapse, death in continuous complete remission or new cancer were considered events in EFS calculation. RFS was estimated for subjects achieving complete remission (CR) starting at the time remission was declared. Living subjects were censored for survival at last follow-up. Statistical analyses used SPSS version 17.0. Data were represented as mean value with bars representing the standard error of the mean (SEM). Determinations of statistical significance were performed using a Student t-test for comparisons of two groups or using analysis of variance (ANOVA) for comparing multiple groups.
Additional Information
How to cite this article: Ge, Z. et al. Targeting High Dynamin-2 (DNM2) Expression by Restoring Ikaros Function in Acute Lymphoblastic Leukemia. Sci. Rep. 6, 38004; doi: 10.1038/srep38004 (2016).
Publisher’s note: Springer Nature remains neutral with regard to jurisdictional claims in published maps and institutional affiliations.
Supplementary Material
Acknowledgments
Supported, in part, by The National Natural Science Foundation of China (81270613, 30973376), Jiangsu Province Key Medical Talents (RC2011077), Scientific Research Foundation for the Returned Overseas Chinese Scholars, State Education Ministry (39th), China Postdoctoral Science Foundation (20090461134), special grade of the financial support from China Postdoctoral Science Foundation (201003598), Six Great Talent Peak Plan of Jiangsu (2010-WS-024), Scientific Research Foundation for the Returned Overseas Chinese Scholars, Nanjing Municipal Bureau of Personnel (2009), Southeast University Basic Research Fund (2242016k40143; to Z.G.). Also supported, in part, by Four Diamond Foundation of Pennsylvania State University, PA, USA (to S.D. and C.S.). R.P.G. acknowledges support from the National Institute of Health Research (NIHR) Biomedical Research Centre funding scheme.
Footnotes
Author Contributions Z.G., Y.G., Q.H., G.Z., M.L., J.L., B.C., T.S., S.D. and C.S. performed experiments and analyzed data; C.S., and Z.G. designed and supervised data analysis; C.S. R.G. and Z. G. wrote the manuscript.
References
- Eppinga R. D. et al. Increased expression of the large GTPase dynamin 2 potentiates metastatic migration and invasion of pancreatic ductal carcinoma. Oncogene 31, 1228–1241 (2012). [DOI] [PMC free article] [PubMed] [Google Scholar]
- Feng H. et al. Dynamin 2 mediates PDGFRalpha-SHP-2-promoted glioblastoma growth and invasion. Oncogene 31, 2691–2702 (2012). [DOI] [PMC free article] [PubMed] [Google Scholar] [Retracted]
- Tay Y., Tan S. M., Karreth F. A., Lieberman J. & Pandolfi P. P. Characterization of dual PTEN and p53-targeting microRNAs identifies microRNA-638/Dnm2 as a two-hit oncogenic locus. Cell Rep 8, 714–722 (2014). [DOI] [PMC free article] [PubMed] [Google Scholar]
- Tremblay C. S. et al. Loss-of-function mutations of Dynamin 2 promote T-ALL by enhancing IL-7 signalling. Leukemia, doi: 10.1038/leu.2016.100 (2016). [DOI] [PubMed] [Google Scholar]
- Neumann M. et al. Whole-exome sequencing in adult ETP-ALL reveals a high rate of DNMT3A mutations. Blood 121, 4749–4752 (2013). [DOI] [PubMed] [Google Scholar]
- Neumann M. et al. Mutational spectrum of adult T-ALL. Oncotarget 6, 2754–2766 (2015). [DOI] [PMC free article] [PubMed] [Google Scholar]
- Molnár A. & Georgopoulos K. The Ikaros gene encodes a family of functionally diverse zinc finger DNA-binding proteins. Mol Cell Biol 14, 8292–8303 (1994). [DOI] [PMC free article] [PubMed] [Google Scholar]
- Georgopoulos K., Moore D. D. & Derfler B. Ikaros, an early lymphoid-specific transcription factor and a putative mediator for T cell commitment. Science 258, 808–812 (1992). [DOI] [PubMed] [Google Scholar]
- Lo K., Landau N. R. & Smale S. T. LyF-1, a transcriptional regulator that interactswith a novel class of promoters for lymphocyte-specific genes. Mol Cell Biol 11, 5229–5243 (1991). [DOI] [PMC free article] [PubMed] [Google Scholar]
- Ernst P., Hahm K. & Smale S. T. Both LyF-1 and an Ets protein interact with a critical promoter element in the murine terminal transferase gene. Mol Cell Biol 13, 2982–2992 (1993). [DOI] [PMC free article] [PubMed] [Google Scholar]
- Georgopoulos K. et al. The Ikaros gene is required for the development of all lymphoid lineages. Cell 79, 143–156 (1994). [DOI] [PubMed] [Google Scholar]
- Winandy S., Wu P. & Georgopoulos K. A dominant mutation in the Ikaros gene leads to rapid development of leukemia and lymphoma. Cell 83, 289–299 (1995). [DOI] [PubMed] [Google Scholar]
- Mullighan C. G. et al. Genome-wide analysis of genetic alterations in acute lymphoblastic leukaemia. Nature 446, 758–764 (2007). [DOI] [PubMed] [Google Scholar]
- Mullighan C. G. et al. BCR-ABL1 lymphoblastic leukaemia is characterized by the deletion of Ikaros. Nature 453, 110–114 (2008). [DOI] [PubMed] [Google Scholar]
- Song C. et al. Targeting casein kinase II restores Ikaros tumor suppressor activity and demonstrates therapeutic efficacy in high-risk leukemia. Blood 126, 1813–1822 (2015). [DOI] [PMC free article] [PubMed] [Google Scholar]
- Song C. et al. Epigenetic regulation of gene expression by Ikaros, HDAC1 and Casein Kinase II in leukemia. Leukemia, doi: 10.1038/leu.2015.331 (2015). [DOI] [PMC free article] [PubMed] [Google Scholar]
- Ge Z. et al. Clinical significance of high c-MYC and low MYCBP2 expression and their association with Ikaros dysfunction in adult acute lymphoblastic leukemia. Oncotarget 6, 42300–42311 (2015). [DOI] [PMC free article] [PubMed] [Google Scholar]
- Song C., Li Z., Erbe A. K., Savic A. & Dovat S. Regulation of Ikaros function by casein kinase 2 and protein phosphatase 1. World J Biol Chem 2, 126–131 (2011). [DOI] [PMC free article] [PubMed] [Google Scholar]
- Homminga I. et al. Characterization of a pediatric T-cell acute lymphoblastic leukemia patient with simultaneous LYL1 and LMO2 rearrangements. Haematologica 97, 258–261 (2012). [DOI] [PMC free article] [PubMed] [Google Scholar]
- Kang H. et al. Gene expression classifiers for relapse-free survival and minimal residual disease improve risk classification and outcome prediction in pediatric B-precursor acute lymphoblastic leukemia. Blood 115, 1394–1405 (2010). [DOI] [PMC free article] [PubMed] [Google Scholar]
- Harvey R. C. et al. Identification of novel cluster groups in pediatric high-risk B-precursor acute lymphoblastic leukemia with gene expression profiling: correlation with genome-wide DNA copy number alterations, clinical characteristics, and outcome. Blood 116, 4874–4884 (2010). [DOI] [PMC free article] [PubMed] [Google Scholar]
- Joshi S. et al. The dynamin inhibitors MiTMAB and OcTMAB induce cytokinesis failure and inhibit cell proliferation in human cancer cells. Mol Cancer Ther 9, 1995–2006 (2010). [DOI] [PubMed] [Google Scholar]
- Sadowski L. et al. Dynamin inhibitors impair endocytosis and mitogenic signaling of PDGF. Traffic 14, 725–736 (2013). [DOI] [PMC free article] [PubMed] [Google Scholar]
- Chou T. C. & Talalay P. Quantitative analysis of dose-effect relationships: the combined effects of multiple drugs or enzyme inhibitors. Adv Enzyme Regul 22, 27–55 (1984). [DOI] [PubMed] [Google Scholar]
- Guo X. et al. Characterization of LEF1 High Expression and Novel Mutations in Adult Acute Lymphoblastic Leukemia. PloS one 10, e0125429 (2015). [DOI] [PMC free article] [PubMed] [Google Scholar]
- Zhang J. et al. The genetic basis of early T-cell precursor acute lymphoblastic leukaemia. Nature 481, 157–163 (2012). [DOI] [PMC free article] [PubMed] [Google Scholar]
- Ge Z. et al. Novel dynamin 2 mutations in adult T-cell acute lymphoblastic leukemia. Oncol Lett 12, 2746–2751 (2016). [DOI] [PMC free article] [PubMed] [Google Scholar]
- Hodge R. G. & Ridley A. J. Regulating Rho GTPases and their regulators. Nature reviews. Molecular cell biology 17, 496–510 (2016). [DOI] [PubMed] [Google Scholar]
- Orgaz J. L., Herraiz C. & Sanz-Moreno V. Rho GTPases modulate malignant transformation of tumor cells. Small GTPases 5, e29019 (2014). [DOI] [PMC free article] [PubMed] [Google Scholar]
- Pylayeva-Gupta Y., Grabocka E. & Bar-Sagi D. RAS oncogenes: weaving a tumorigenic web. Nature reviews. Cancer 11, 761–774 (2011). [DOI] [PMC free article] [PubMed] [Google Scholar]
- Prior I. A., Lewis P. D. & Mattos C. A comprehensive survey of Ras mutations in cancer. Cancer research 72, 2457–2467 (2012). [DOI] [PMC free article] [PubMed] [Google Scholar]
- Liang D. C. et al. K-Ras mutations and N-Ras mutations in childhood acute leukemias with or without mixed-lineage leukemia gene rearrangements. Cancer 106, 950–956 (2006). [DOI] [PubMed] [Google Scholar]
- Ryan S. L. et al. The role of the RAS pathway in iAMP21-ALL. Leukemia 30, 1824–1831 (2016). [DOI] [PMC free article] [PubMed] [Google Scholar]
- Long M. & Simpson J. C. Rho GTPases operating at the Golgi complex: Implications for membrane traffic and cancer biology. Tissue & cell, doi: 10.1016/j.tice.2016.09.007 (2016). [DOI] [PubMed] [Google Scholar]
- Haga R. B. & Ridley A. J. Rho GTPases: Regulation and roles in cancer cell biology. Small GTPases, 1–15, doi: 10.1080/21541248.2016.1232583 (2016). [DOI] [PMC free article] [PubMed] [Google Scholar]
- Zou T. et al. Rho GTPases: RAC1 polymorphisms affected platinum-based chemotherapy toxicity in lung cancer patients. Cancer chemotherapy and pharmacology 78, 249–258 (2016). [DOI] [PubMed] [Google Scholar]
- Li H., Peyrollier K., Kilic G. & Brakebusch C. Rho GTPases and cancer. BioFactors 40, 226–235 (2014). [DOI] [PubMed] [Google Scholar]
- Willinger T., Staron M., Ferguson S. M., De Camilli P. & Flavell R. A. Dynamin 2-dependent endocytosis sustains T-cell receptor signaling and drives metabolic reprogramming in T lymphocytes. Proceedings of the National Academy of Sciences of the United States of America 112, 4423–4428 (2015). [DOI] [PMC free article] [PubMed] [Google Scholar]
- Meloty-Kapella L., Shergill B., Kuon J., Botvinick E. & Weinmaster G. Notch ligand endocytosis generates mechanical pulling force dependent on dynamin, epsins, and actin. Dev Cell 22, 1299–1312 (2012). [DOI] [PMC free article] [PubMed] [Google Scholar]
- Nichols J. T. et al. DSL ligand endocytosis physically dissociates Notch1 heterodimers before activating proteolysis can occur. J Cell Biol 176, 445–458 (2007). [DOI] [PMC free article] [PubMed] [Google Scholar]
- Henriques C. M., Rino J., Nibbs R. J., Graham G. J. & Barata J. T. IL-7 induces rapid clathrin-mediated internalization and JAK3-dependent degradation of IL-7Ralpha in T cells. Blood 115, 3269–3277 (2010). [DOI] [PubMed] [Google Scholar]
- Fish K. N., Schmid S. L. & Damke H. Evidence that dynamin-2 functions as a signal-transducing GTPase. The Journal of cell biology 150, 145–154 (2000). [DOI] [PMC free article] [PubMed] [Google Scholar]
- Hee Kim Y., Kim K. Y., Jun do, Y., Kim J. S. & Kim Y. H. Inhibition of autophagy enhances dynamin inhibitor-induced apoptosis via promoting Bak activation and mitochondrial damage in human Jurkat T cells. Biochemical and biophysical research communications 478, 1609–1616 (2016). [DOI] [PubMed] [Google Scholar]
- Durieux A. C., Prudhon B., Guicheney P. & Bitoun M. Dynamin 2 and human diseases. J Mol Med (Berl) 88, 339–350 (2010). [DOI] [PubMed] [Google Scholar]
- Wang J. X. A Chinese expert panel consensus on diagnosis and treatment of adult acute lymphoblastic leukemia. Zhonghua Xue Ye Xue Za Zhi. 33, 789–92 (2012). [DOI] [PubMed] [Google Scholar]
- Campana D. et al. Human B cell development. I. Phenotypic differences of B lymphocytes in the bone marrow and peripheral lymphoid tissue. J Immunol 134, 1524–1530 (1985). [PubMed] [Google Scholar]
- Popescu M. et al. Ikaros stability and pericentromeric localization are regulated by protein phosphatase 1. J Biol Chem 284, 13869–13880 (2009). [DOI] [PMC free article] [PubMed] [Google Scholar]
- Wang H. et al. Protein phosphatase 1 (PP1) and Casein Kinase II (CK2) regulate Ikaros-mediated repression of TdT in thymocytes and T-cell leukemia. Pediatr Blood Cancer 61, 2230–2235 (2014). [DOI] [PMC free article] [PubMed] [Google Scholar]
Associated Data
This section collects any data citations, data availability statements, or supplementary materials included in this article.


