Abstract
Objective:
This study aimed to evaluate the image quality and apparent diffusion coefficient (ADC) values of single-shot turbo spin echo (TSE) diffusion-weighted (DW) images obtained using a parallel imaging (PI) technique.
Methods:
All measurements were performed on a 3.0-T whole-body MRI system and 32-channel phased-array coil. Signal-to-noise ratio (SNR) and ADC values were measured with a DW imaging (DWI) phantom comprising granulated sugar and agar. The SNRs were calculated using a subtraction method and compared among TSE-DW images at acceleration factors (AFs) of 1–4. Image blur was visually assessed on TSE-DW images of a pin phantom at AFs of 1–4. The ADC values were calculated using DW images with b = 0 and 1000 s mm−2. The ADC values of TSE-DW images and echo-planar imaging EPI-DW images were compared.
Results:
The SNRs decreased as AFs increased, despite selecting the shortest echo time. A lower AF caused increased image blur in the phase-encoding direction. The ADC values of TSE-DWI tended to be lower than those of EPI-DWI, and AFs of 3 and 4 yielded variable ADC values on TSE-DW images.
Conclusion:
TSE-DWI with an AF of 3 or 4 yielded reduced SNRs; in addition, the image noise and artefacts associated with PI technique may have affected ADC measurements, despite improving image blur in the phase-encoding direction.
Advances in knowledge:
Optimizing the imaging parameters of TSE-DWI is useful for providing good image quality and accurate ADC measurements.
INTRODUCTION
The diffusion-weighted imaging (DWI) technique reflects the random motion of water molecules in biological tissues. When applied clinically in the context of brain imaging, DWI plays an important role in detecting acute infarction and evaluating treatment responses in several tumour types.1–4 Moreover, apparent diffusion coefficient (ADC) values, calculated from diffusion-weighted (DW) images, are also useful for the differential diagnosis of brain lesions.5,6
A single-shot echo-planar imaging (EPI) sequence is most commonly used for DWI (EPI-DWI). Although data are acquired more rapidly with EPI-DWI, rendering the acquisition process insensitive to patient motion, images obtained using this sequence tend to be compromised by the presence of artefacts.7 Image distortion, one of the types of artefacts caused by the EPI sequence, is observed at the interfaces of tissues with different susceptibilities (e.g. skull base). Notably, several artefacts associated with the EPI sequence often cause image quality degeneration and inaccurate ADC values.8,9 Various techniques have been applied with DWI in an attempt to overcome this issue.10–12 For example, Alsop12 demonstrated that DWI with a single-shot turbo spin echo sequence (TSE-DWI) reduced image distortion and chemical shift artefacts when compared with EPI-DWI of the human brain. Although TSE-DWI avoids the image distortion observed with EPI sequence, it is associated with a low signal-to-noise ratio (SNR) and severe image blur in the phase-encoding direction.13
Because DWI is a powerful diagnostic imaging tool that requires a high level of image quality and accurate ADC measurements, it is important to optimize the imaging parameters accordingly. Generally, the shortest time echo (TE) and parallel imaging (PI) techniques are useful for EPI-DWI.14,15 The shortest TE technique increases SNR, whereas PI reduces artefacts and image blur. However, to the best of our knowledge, no report has described the relationship between image quality and the acceleration factor (AF) in TSE-DWI using the PI technique. Therefore, the present study aimed to evaluate image quality and ADC values in TSE-DW images obtained using the PI technique.
METHODS AND MATERIALS
MRI technique
All measurements were performed on a 3.0-T whole-body MRI system (Achieva® dStream 3.0T; Philips Healthcare, Best, Netherlands). A quadrature body coil was used for signal transmission, and a 32-channel phased-array coil (32-channel dS head coil; Philips Healthcare) was used for signal reception. The TSE-DWI acquisition parameters were as follows: repetition time, shortest; TE, shortest; flip angle, 90°; field of view (FOV), 230 mm; acquisition matrix, 128 × 128; reconstruction matrix, 512 × 512; slice thickness, 5 mm; bandwidth, 701–762 Hz pixel−1; b-values, 0 and 1000; number of acquisitions (NSAs), 2; shot duration, 83–324 ms; half scan factor, 0.6; and AFs, 1, 2, 3 and 4. The phase-encoding direction was left to right. Table 1 presents a detailed summary of the TSE-DWI parameters.
Table 1.
Summary of the single-shot turbo spin echo diffusion-weighted imaging parameters
| Acceleration factor | 1.0 | 2.0 | 3.0 | 4.0 |
|---|---|---|---|---|
| TR (ms) | 10,204 | 8974 | 8587 | 8330 |
| TE (ms) | 100 | 73 | 66 | 58 |
| Shot duration (ms) | 324 | 162 | 114 | 83 |
| Acquisition time (s) | 204 | 179 | 172 | 167 |
| Band width (Hz pixel−1) | 762.9 | 715.4 | 707.6 | 762.9 |
TE, echo time; TR, repetition time.
To compare ADC values, EPI-DWI was performed using the following parameters: repetition time, 8000 ms; TE, 60 ms; flip angle, 90°; FOV, 230 mm; acquisition matrix, 128 × 128; reconstruction matrix, 512 × 512; slice thickness, 5 mm; bandwidth, 30.5 Hz pixel−1; b-values, 0 and 1000; NSA, 1; half scan factor, 0.627; and AF, 2.6. The phase-encoding direction was anterior to posterior. Sensitivity encoding was used for the PI technique. Motion probing gradients were applied in three orthogonal directions in both sequences.
Preparation for a diffusion weighted imaging phantom
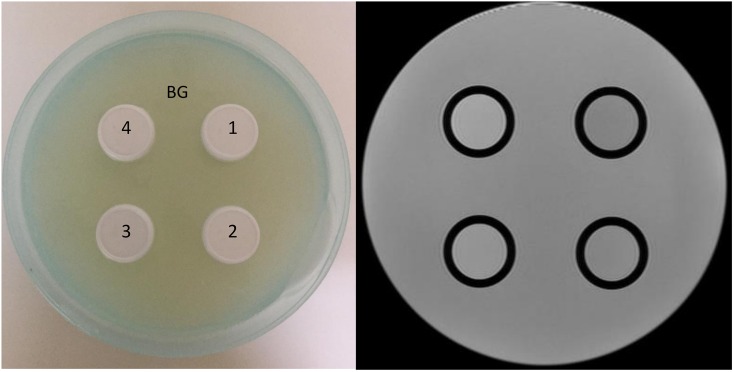
A DWI phantom for the evaluation of SNR and ADC values was constructed using commercially available granulated sugar to control the ADC values and using agar to control the transverse relaxation time (T2 value). A plastic hemispherical bottle with a 200-mm diameter was filled with 1.4% (w/v) agar gel. Four plastic bottles with diameters of 20 mm were filled with 1.4% (w/v) agar and 7.1%, 14.2%, 28.5% or 42.8% (w/v) granulated sugar and placed in the centre of the phantom (Figure 1). These granulated sugar concentrations were determined to mimic intracranial brain lesions with ADC values ranging from 0.8 to 2.0 × 10⁻³ mm2 s−1.16 As shown in Table 2, the T2 values of the background and four compartments were similar to those of brain parenchyma.17 The slice orientation was perpendicular to the main field, and the phantom diameter in the slice was similar to that of the human brain (approximately 16 cm). The phantom was positioned as for a clinical examination and scanned at room temperature (21.0 °C).
Figure 1.
The photograph (left) and T2 weighted image (right) of diffusion-weighted imaging phantom. The hemispherical plastic bottle was filled with 1.4 w/v% agar gel. Four plastic bottles were filled with 1.4 w/v% agar gel contained several concentrations of granulated sugar. The concentrations of granulated sugar of compartments 1, 2, 3 and 4 corresponded to 7.1, 14.2, 28.5 and 42.8 w/v%, respectively. BG, background.
Table 2.
T1 (T1) and T2 (T2) values of the diffusion-weighted imaging phantom
| Materials | T1 (ms) | T2 (ms) |
|---|---|---|
| BG | 2701 | 92 |
| Comp. 1 | 2142 | 72 |
| Comp. 2 | 1576 | 66 |
| Comp. 3 | 948 | 67 |
| Comp. 4 | 523 | 65 |
BG, background; Comp., compartment.
Signal-to-noise ratio
The SNRs obtained with TSE-DWI at different AFs were compared. The SNR was calculated using a subtraction method involving two images with identical parameters,18 according to the following equation:
where S is the mean signal value of the two images and σ is the standard deviation of the subtracted image. S and σ were derived from the same region of interest on the signal and subtracted images. The SNRs were calculated from TSE-DW images obtained at b = 1000 s mm−2.
Image blur
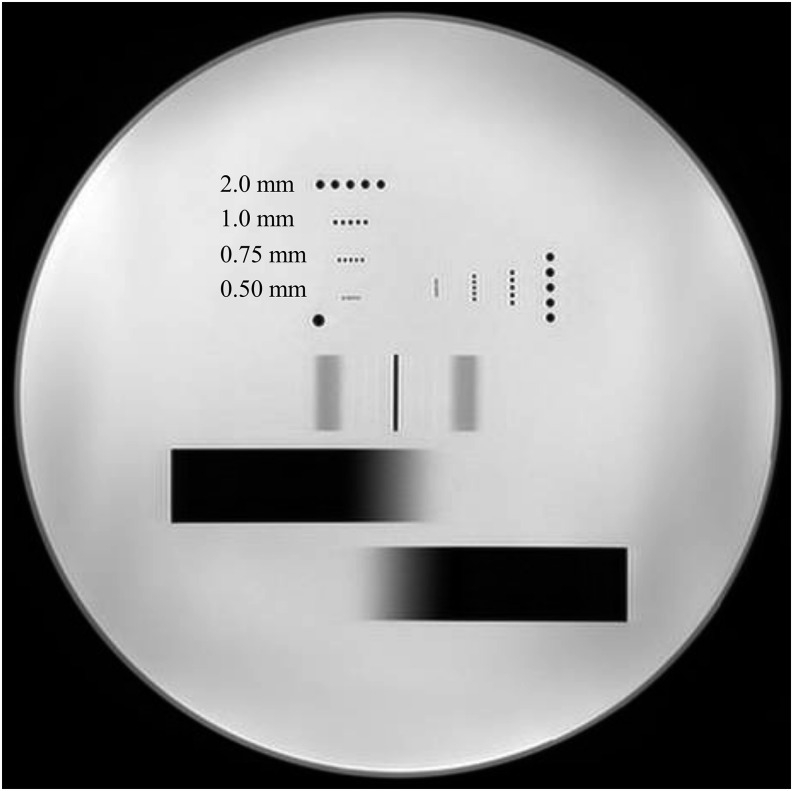
A pin phantom (90–401 type; Nikko Fines, Tokyo, Japan) with pin diameters and intervals of 0.5, 0.75, 1.0 and 2.0 mm (Figure 2) was used to evaluate image blur. Pins of the same size were orthogonally arranged to each other such that one of the pin patterns corresponded to the phase-encoding direction and the other corresponded to the frequency-encoding direction. The TSE-DW images of the pin patterns were obtained at AFs of 1–4. The separation of the pin patterns was visually assessed.
Figure 2.
T2 weighted axial image of the pin pattern phantom. The image was obtained with T2 weighted turbo spin echo sequence. The diameters and intervals of each pin pattern were 0.50, 0.75, 1.0, and 2.0 mm.
Apparent diffusion coefficient values
ADC values obtained with TSE-DWI and EPI-DWI were compared after calculating the ADC values of each sequence using the following two-point techniques:
where SI(b0) and SI(b) are the signal intensities at b = 0 and 1000 s mm−2, respectively. The ADC values were measured on the DW images obtained with both sequences.
Image analysis
Image analysis was performed using image-processing software (ImageJ v. 1.45; National Institutes of Health, Bethesda, MD), and the image magnitudes were recorded in the digital imaging and communications in medicine format. To calculate SNR and ADC values, circular regions of interest with radii of 45 pixels were placed at the centre of each compartment and background region.
Statistical analysis
The ADC values obtained with TSE-DWI were compared using a Mann–Whitney U test. p-value <0.05 was considered as statistically significant. A coefficient of variance (CV) was used to evaluate the repeatability of ADC values obtained with the different sequences. The CVs of five repeated measurements were calculated by dividing the standard deviation by the mean value. The free R software package v. 3.2.3 (R Project for Statistical Computing, Vienna, Austria) was used to calculate CVs.
RESULTS
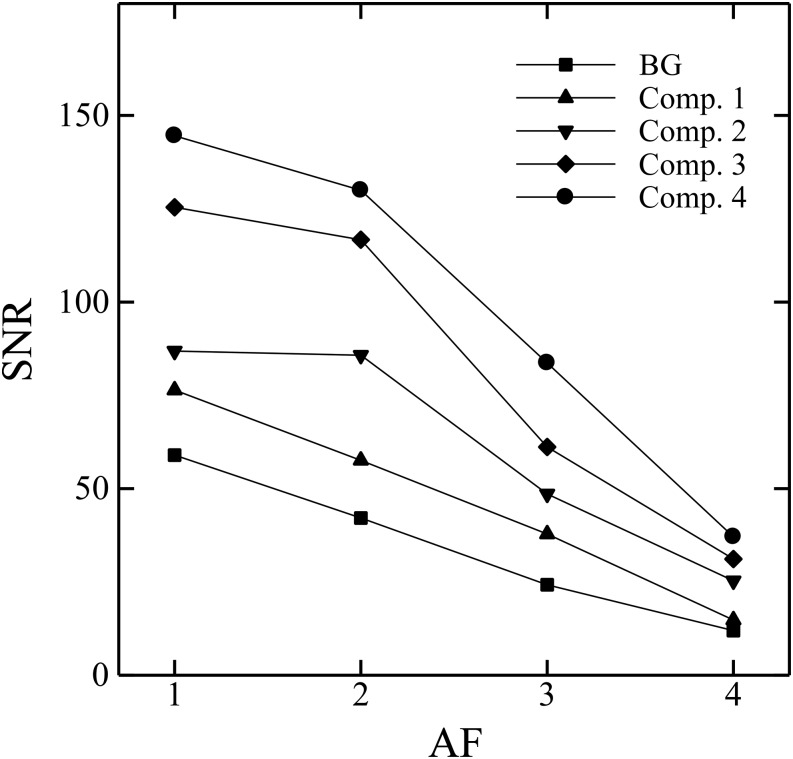
Figure 3 demonstrates the relationship between SNRs (shown as mean values) and AFs; specifically, SNRs of all compartments and the background decreased as AFs increased. The average SNR reduction rates were approximately 14.2%, 49.3% and 76.1% at AFs of 2, 3 and 4, respectively, relative to an AF of 1.
Figure 3.
Signal-to-noise ratio (SNR) of the background (BG) and each compartment (Comp.) as a function of acceleration factors (AFs). Each symbol represents the mean SNR value.
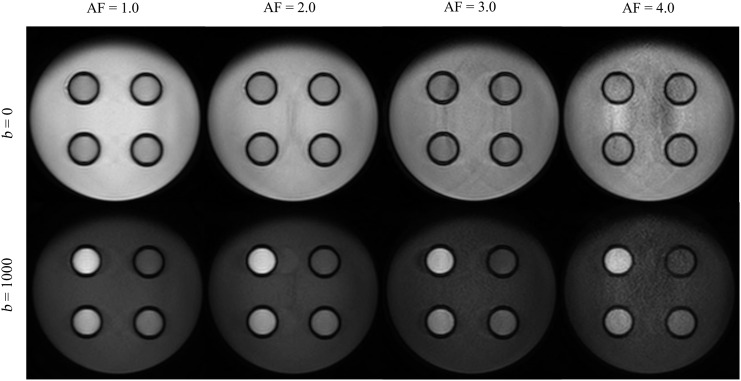
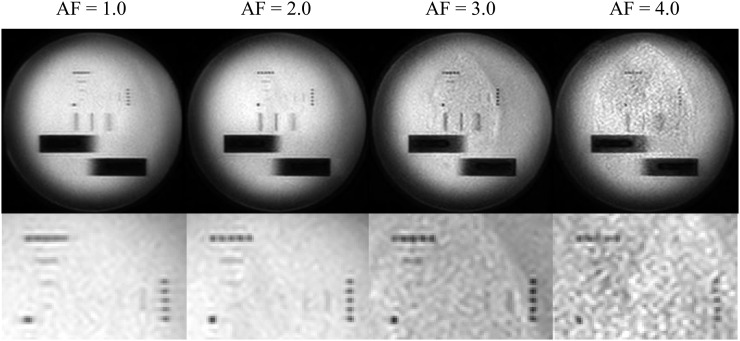
Images of TSE-DWI with b = 0 and 1000 are shown in Figure 4. On the TSE-DWI images obtained at b = 1000, the compartments with higher concentrations of granulated sugar exhibited higher signal intensities. Image noise was observed in the phase direction as AF increased.
Figure 4.
The images of single-shot turbo spin echo diffusion-weighted imaging obtained with various acceleration factor (AFs). The upper and lower rows show the images acquired with b = 0 (mm2 s−1) and b = 1000, respectively. The same window level and width were selected to compare images.
Figure 5 demonstrates the pin pattern images obtained with TSE-DWI at AFs of 1–4. Pins with diameters/intervals of ≤1.0 mm were not distinguishable in either the frequency or phase direction on any image. Although pins with a 2.0-mm diameter/interval were distinguishable in the frequency direction at an AF of 1, they were not distinguishable in the phase direction at this AF.
Figure 5.
The pin phantom (upper row) and magnitude images (lower row). The pin pattern in the traverse and longitudinal directions corresponded to the phase encoding and frequency direction, respectively. AF, acceleration factor.
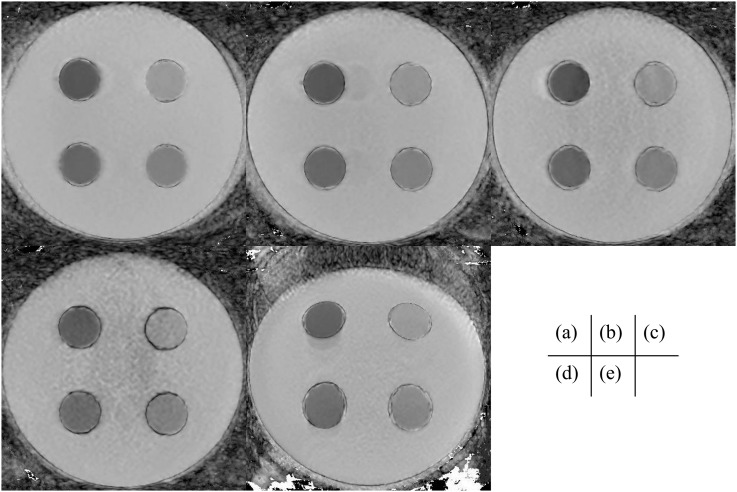
Figure 6 shows ADC maps calculated from the TSE-DW images and EPI-DW images. Image noise and artefacts were observed in the ADC maps of TSE-DW images obtained at an AF of 3 and 4. Image distortion was also observed on the ADC map of EPI-DW images. Table 3 presents the mean ADC values (and standard deviations) obtained with both sequences. The ADC values obtained with TSE-DWI tended to be lower than those obtained with EPI-DWI, regardless of the selected AF. Table 4 presents the differences in the ADC values obtained with TSE-DWI. The AFs of 3 and 4 yielded significant variations in the TSE-DWI ADC values of the background region and all compartments (p < 0.05).
Figure 6.
The apparent diffusion coefficient (ADC) maps of AF = 1.0 (a), 2.0 (b), 3.0 (c) and 4.0 (d) and single-shot echo-planar imaging diffusion-weighted imaging (e) are shown. All ADC maps were calculated with the image of b = 0 and 1000 (mm2 s−1). The same window level and width were selected to compare images.
Table 3.
Apparent diffusion coefficient (ADC) values obtained with single-shot echo-planar imaging diffusion-weighted imaging (EPI-DWI) and single-shot turbo spin echo diffusion-weighted imaging (TSE-DWI)
| Acquisition techniques | ADC values (×10−3 mm2 s−1) |
||||
|---|---|---|---|---|---|
| BG | Comp. 1 | Comp. 2 | Comp. 3 | Comp. 4 | |
| TSE-DWI | |||||
| AF1 | 1.97 ± 0.008 | 1.68 ± 0.005 | 1.31 ± 0.008 | 0.932 ± 0.004 | 0.700 ± 0.004 |
| AF2 | 1.85 ± 0.004 | 1.59 ± 0.005 | 1.32 ± 0.004 | 0.943 ± 0.004 | 0.700 ± 0.004 |
| AF3 | 1.82 ± 0.009 | 1.58 ± 0.005 | 1.29 ± 0.004 | 0.903 ± 0.003 | 0.638 ± 0.003 |
| AF4 | 1.75 ± 0.015 | 1.59 ± 0.006 | 1.29 ± 0.009 | 0.983 ± 0.005 | 0.753 ± 0.007 |
| EPI-DWI | 1.92 ± 0.005 | 1.70 ± 0.005 | 1.43 ± 0.005 | 1.04 ± 0.015 | 0.881 ± 0.014 |
AF, acceleration factor; BG, background; Comp., compartment.
ADC values are presented as mean ± standard deviation.
Table 4.
Differences in the apparent diffusion coefficient (ADC) values obtained with single-shot turbo spin echo diffusion-weighted imaging
| Materials | Group | Difference (×10−3 mm2 s−1) | p-value |
|---|---|---|---|
| BG | AF1 vs AF2 | 0.119 (0.108, 0.129) | <0.01 |
| AF1 vs AF3 | 0.145 (0.131, 0.157) | <0.01 | |
| AF1 vs AF4 | 0.214 (0.196, 0.234) | <0.01 | |
| Comp. 1 | AF1 vs AF2 | 0.084 (0.076, 0.090) | <0.01 |
| AF1 vs AF3 | 0.097 (0.089, 0.105) | <0.01 | |
| AF1 vs AF4 | 0.0815 (0.074, 0.091) | <0.01 | |
| Comp. 2 | AF1 vs AF2 | −0.004 (−0.016, −0.002) | 0.142 |
| AF1 vs AF3 | 0.0225 (0.011, 0.032) | <0.01 | |
| AF1 vs AF4 | 0.022 (0.07, 0.034) | 0.015 | |
| Comp. 3 | AF1 vs AF2 | −0.0115 (−0.016, −0.006) | <0.01 |
| AF1 vs AF3 | 0.0275 (0.023, 0.035) | <0.01 | |
| AF1 vs AF4 | −0.05 (−0.058, −0.043) | <0.01 | |
| Comp. 4 | AF1 vs AF2 | −0.001 (−0.008, 0.008) | 1 |
| AF1 vs AF3 | 0.063 (0.056, 0.068) | <0.01 | |
| AF1 vs AF4 | −0.052 (−0.063, −0.042) | <0.01 |
AF, acceleration factor; BG, background; Comp., compartment.
95% confidence interval is shown in parenthesis.
Mann–Whitney U test is used, and p < 0.05 is statistical significant.
Table 5 presents the CVs of the ADC values calculated from both sequences. Notably, the repeatability of these ADC values was good with both sequences. The CVs were <1.0% with TSE-DWI and <1.6% with EPI-DWI.
Table 5.
Coefficients of variation (CVs) of apparent diffusion coefficient values
| Acquisition techniques | CV (%) |
||||
|---|---|---|---|---|---|
| BG | Comp. 1 | Comp. 2 | Comp. 3 | Comp. 4 | |
| TSE-DWI | |||||
| AF1 | 0.384 | 0.287 | 0.569 | 0.418 | 0.627 |
| AF2 | 0.220 | 0.305 | 0.265 | 0.417 | 0.841 |
| AF3 | 0.511 | 0.299 | 0.339 | 0.332 | 0.571 |
| AF4 | 0.878 | 0.396 | 0.664 | 0.506 | 0.971 |
| EPI-DWI | 0.271 | 0.315 | 0.368 | 1.41 | 1.55 |
AF, acceleration factor; BG, background; Comp., compartment; EPI-DWI, single-shot echo-planar imaging diffusion-weighted imaging; TSE-DWI, single-shot turbo spin echo diffusion-weighted imaging.
CVs were calculated from five measurements for each sequence.
DISCUSSION
In this study, we analyzed the quality of TSE-DW phantom images by evaluating SNRs and image blur of images obtained at various AFs; in addition, we compared ADC values obtained with TSE-DWI and EPI-DWI. Here, the highest SNR obtained with TSE-DWI was achieved at an AF of 1, which provided the longest TE value relative to the other AFs. A higher AF not only decreases the TE value but also increases the g factor or noise amplification associated with the PI reconstruction.19 A previous study demonstrated rapid increases in the average g factors obtained with a 32-channel phased-array coil as AF increased.20 Therefore, these results suggest that the increase in coil g factors has much influence on the SNR as the shorter TE value.
Clinically, the low SNR of TSE-DWI remains a major concern. Previous reports suggest that TSE-DWI yields inferior lesion visibility relative to EPI-DWI because of the low SNR obtained using the former technique.21,22 An increase in NSA, which dramatically prolongs the acquisition time, is one way to improve the SNR of TSE-DWI. However, the long acquisition time required for this technique increases the risk of patient motion, which degrades image quality. Therefore, we should consider all acquisition parameters that contribute to a slight increase in the SNR of TSE-DWI, except for NSA.
Here, we performed a visual image blur evaluation using a pin pattern phantom. Generally, pixel size, which is calculated by dividing the FOV by the acquisition matrix, determines spatial resolution on MR images. However, the pixel size used in this study was 1.79 × 1.79 mm; accordingly, pin patterns of ≤1.0 mm were not distinguishable on all images.18 Regarding the 2.0-mm pin pattern, increased image blur in the phase-encoding direction was observed at an AF of 1, suggesting that the lower AF prolongs the shot duration, which causes image blur due to T2 decay in the phase-encoding direction. On the other hand, AFs of 3 and 4 reduced image blur in the phase-encoding direction, although these AFs also led to an increase in the image noise associated with PI reconstruction, as shown in Figure 6.
Our experiments also demonstrate variability in the ADC values obtained with different sequences. Previous reports also described the influence of imaging sequences on ADC values.23,24 Notably, the reproducibility of ADC values obtained with TSE-DWI was superior to that reported in a previous study, irrespective of AF.9 TSE-DWI produced fewer artefacts compared with EPI-DWI and therefore provided more accurate ADC measurements. However, the reproducibility of the ADC values obtained with EPI-DWI was also unexpectedly good, likely because a homogeneous phantom that lacked air or similar materials around each compartment was used in this study. We further observed that AFs of 3 and 4 yielded variable ADC values on TSE-DWI consequent to increased image noise and unfolding artefacts associated with the PI technique. The PI technique, in which image reconstruction is performed using aliased images, always results in unfolding artefacts,19 and Chou et al25 previously reported that these artefacts would affect the quantitative values calculated from DWI with the PI technique. These artefacts cause variations in the ADC values of signal compartments at an AF of 3 or 4.
The EPI sequence remains the most commonly used DWI sequence despite the associated image distortion. Some previous reports have demonstrated that DWI is useful for detecting skull base lesions, in which image distortions are likely to occur.26–28 Ozgen et al28 also suggested that ADC values may help differentiate malignant lesions at the skull base. For these reasons, distortion-free DWI, which provides a high image quality and accurate ADC values, is preferable in this region. It is therefore important to understand the relationship between scan parameters and image quality.
Our study has several limitations. First, it was performed using equipment from a specific vendor. The SNRs and ADC values obtained using equipment from multiple vendors might differ and therefore should be compared.8,9 Second, the location of each compartment in the DWI phantom was fixed. However, the effects of image noise on SNR differed according to the compartment location because the spatial distribution of image noise is not uniform when the PI technique is used;29 accordingly, a DWI phantom in which the signal location can be arbitrarily set is required. Third, the phantom compartments did not mimic intracranial lesions with low ADC values, such as acute cerebral infarction and malignant lymphoma. The high granulated sugar concentrations used in this study reduced not only the ADC values but also the T2 values. Accordingly, a DWI phantom substance that could control both values independently would be desirable. Finally, several biases are attributed to ADC measurements. All measurements are assumed to correspond to a clinical examination, wherein the centre of the DWI phantom does not coincide with the centre of the magnet. Our measurements, therefore, did not consider the spatial non-uniformity of ADC values.30 Moreover, although our phantom was left in place for sufficient time to avoid variations in ADC measurements, we did not measure the phantom temperature during data acquisition.
In conclusion, this study evaluated image quality and ADC values of TSE-DW images obtained using the PI technique. TSE-DWI with an AF of 3 and 4 yielded a decreased SNR; in addition, ADC measurements obtained with these settings may have been susceptible to PI technique-related image noise and artefacts despite the improvements in image blur in the phase-encoding direction.
Acknowledgments
ACKNOWLEDGMENTS
We gratefully acknowledge the work of past and present members of our laboratory.
Contributor Information
Tsukasa Yoshida, Email: ts.yoshida@scchr.jp.
Atsushi Urikura, Email: at.urikura@scchr.jp.
Kensei Shirata, Email: k.shirata@scchr.jp.
Yoshihiro Nakaya, Email: y.nakaya@scchr.jp.
Shingo Terashima, Email: s-tera@hirosaki-u.ac.jp.
Yoichiro Hosokawa, Email: hosokawa@hirosaki-u.ac.jp.
REFERENCES
- 1.Albers GW. Diffusion-weighted MRI for evaluation of acute stroke. Neurology 1998; 51(Suppl. 3): S47–9. doi: 10.1212/WNL.51.3_Suppl_3.S47 [DOI] [PubMed] [Google Scholar]
- 2.Van Everdingen KJ, Van der Grond J, Kappelle LJ, Ramos LM, Mali WP. Diffusion-weighted magnetic resonance imaging in acute stroke. Stroke 1998; 29: 1783–90. doi: 10.1161/01.STR.29.9.1783 [DOI] [PubMed] [Google Scholar]
- 3.Buckle C, Castillo M. Use of diffusion-weighted imaging to evaluate the initial response of progressive multifocal leukoencephalopathy to highly active antiretroviral therapy: early experience. AJNR Am J Neuroradiol 2010; 31: 1031–5. doi: 10.3174/ajnr.A2024 [DOI] [PMC free article] [PubMed] [Google Scholar]
- 4.Jain R, Scarpace LM, Ellika S, Torcuator R, Schultz LR, Hearshen D, et al. Imaging response criteria for recurrent gliomas treated with bevacizumab: role of diffusion weighted imaging as an imaging biomarker. J Neurooncol 2010; 96: 423–31. doi: 10.1007/s11060-009-9981-6 [DOI] [PubMed] [Google Scholar]
- 5.Asao C, Korogi Y, Kitajima M, Hirai T, Baba Y, Makino K, et al. Diffusion-weighted imaging of radiation-induced brain injury for differentiation from tumor recurrence. AJNR Am J Neuroradiol 2005; 26: 1455–60. [PMC free article] [PubMed] [Google Scholar]
- 6.Rumboldt Z, Camacho DL, Lake D, Welsh CT, Castillo M. Apparent diffusion coefficients for differentiation of cerebellar tumors in children. AJNR Am J Neuroradiol 2006; 27: 1362–9. [PMC free article] [PubMed] [Google Scholar]
- 7.Le Bihan D, Poupon C, Amadon A, Lethimonnier F. Artifacts and pitfalls in diffusion MRI. J Magn Reson Imaging 2006; 24: 478–88. doi: 10.1002/jmri.20683 [DOI] [PubMed] [Google Scholar]
- 8.Kıvrak AS, Paksoy Y, Erol C, Koplay M, Özbek S, Kara F. Comparison of apparent diffusion coefficient values among different MRI platforms: a multicenter phantom study. Diagn Interv Radiol 2013; 19: 433–7. doi: 10.5152/dir.2013.13034 [DOI] [PubMed] [Google Scholar]
- 9.Lavdas I, Miquel ME, McRobbie DW, Aboagye EO. Comparison between diffusion-weighted MRI (DW-MRI) at 1.5 and 3 tesla: a phantom study. J Magn Reson Imaging 2014; 40: 682–90. doi: 10.1002/jmri.24397 [DOI] [PubMed] [Google Scholar]
- 10.Pipe JG, Farthing VG, Forbes KP. Multishot diffusion-weighted FSE using PROPELLER MRI. Magn Reson Med 2002; 47: 42–52. doi: 10.1002/mrm.10014 [DOI] [PubMed] [Google Scholar]
- 11.Heiland S, Dietrich O, Sartor K. Diffusion-weighted imaging of the brain: comparison of stimulated- and spin-echo echo-planar sequences. Neuroradiology 2001; 43: 442–7. doi: 10.1007/s002340000537 [DOI] [PubMed] [Google Scholar]
- 12.Alsop DC. Phase insensitive preparation of single-shot RARE: application to diffusion imaging in humans. Magn Reson Med 1997; 38: 527–33. doi: 10.1002/mrm.1910380404 [DOI] [PubMed] [Google Scholar]
- 13.Sakamoto J, Sasaki Y, Otonari-Yamamoto M, Nishikawa K, Sano T. Diffusion-weighted imaging of the head and neck with HASTE: influence of imaging parameters on image quality. Oral Radiol 2012; 28: 87–94. doi: 10.1007/s11282-012-0091-3 [DOI] [Google Scholar]
- 14.Skare S, Newbould RD, Clayton DB, Albers GW, Nagle S, Bammer R. Clinical multishot DW-EPI through parallel imaging with considerations of susceptibility, motion, and noise. Magn Reson Med 2007; 57: 881–90. doi: 10.1002/mrm.21176 [DOI] [PMC free article] [PubMed] [Google Scholar]
- 15.Holdsworth SJ, Yeom KW, Antonucci MU, Andre JB, Rosenberg J, Aksoy M, et al. Diffusion-weighted imaging with dual-echo echo-planar imaging for better sensitivity to acute stroke. AJNR Am J Neuroradiol 2014; 35: 1293–302. doi: 10.3174/ajnr.A3921 [DOI] [PMC free article] [PubMed] [Google Scholar]
- 16.Yamasaki F, Kurisu K, Satoh K, Arita K, Sugiyama K, Ohtaki M, et al. Apparent diffusion coefficient of human brain tumors at MR imaging. Radiology 2005; 235: 985–91. doi: 10.1148/radiol.2353031338 [DOI] [PubMed] [Google Scholar]
- 17.Wansapura JP, Holland SK, Dunn RS, Ball WS, jr. NMR relaxation times in the human brain at 3.0 tesla. J Magn Reson Imaging 1999; 9: 531–8. doi: [DOI] [PubMed] [Google Scholar]
- 18.Price RR. Axel L, Morgan T, Newman R, Perman W, Schneiders N, et al. Quality assurance methods and phantoms for magnetic resonance imaging: Report of AAPM nuclear magnetic resonance Task Group No. 1. Med Phys 1990; 17: 287–95. doi: 10.1118/1.596566 [DOI] [PubMed] [Google Scholar]
- 19.Pruessmann KP, Weiger M, Scheidegger MB, Boesiger P. SENSE: sensitivity encoding for fast MRI. Magn Reson Med 1999; 42: 952–62. doi: [DOI] [PubMed] [Google Scholar]
- 20.Yoshida T, Shirata K, Urikura A, Ito M, Nakaya Y. Signal-to-noise ratio and parallel imaging performance of commercially available phased array coils in 3.0 T brain magnetic resonance imaging. Radiol Phys Technol 2015; 8: 305–11. doi: 10.1007/s12194-015-0321-6 [DOI] [PubMed] [Google Scholar]
- 21.Baltzer PA, Renz DM, Herrmann KH, Dietzel M, Krumbein I, Gajda M, et al. Diffusion-weighted imaging (DWI) in MR mammography (MRM): clinical comparison of echo planar imaging (EPI) and half-Fourier single-shot turbo spin echo (HASTE) diffusion techniques. Eur Radiol 2009; 19: 1612–20. doi: 10.1007/s00330-009-1326-5 [DOI] [PubMed] [Google Scholar]
- 22.Verhappen MH, Pouwels PJ, Ljumanovic R, van der Putten L, Knol DL, De Bree R, et al. Diffusion-weighted MR imaging in head and neck cancer: comparison between half-fourier acquired single-shot turbo spin-echo and EPI techniques. AJNR Am J Neuroradiol 2012; 33: 1239–46. doi: 10.3174/ajnr.A2949 [DOI] [PMC free article] [PubMed] [Google Scholar]
- 23.Dietrich O, Raya JG, Sommer J, Deimling M, Reiser MF, Baur-Melnyk A. A comparative evaluation of a RARE-based single-shot pulse sequence for diffusion-weighted MRI of musculoskeletal soft-tissue tumors. Eur Radiol 2005; 15: 772–83. doi: 10.1007/s00330-004-2619-3 [DOI] [PubMed] [Google Scholar]
- 24.Deng J, Miller FH, Salem R, Omary RA, Larson AC. Multishot diffusion-weighted PROPELLER magnetic resonance imaging of the abdomen. Invest Radiol 2006; 41: 769–75. doi: 10.1097/01.rli.0000236808.84746.95 [DOI] [PubMed] [Google Scholar]
- 25.Chou MC, Wang CY, Liu HS, Chung HW, Chen CY. Pseudolesions arising from unfolding artifacts in diffusion imaging with use of parallel acquisition: origin and remedies. AJNR Am J Neuroradiol 2007; 28: 1099–101. doi: 10.3174/ajnr.A0532 [DOI] [PMC free article] [PubMed] [Google Scholar]
- 26.Moon WJ, Lee MH, Chung EC. Diffusion-weighted imaging with sensitivity encoding (SENSE) for detecting cranial bone marrow metastases: comparison with T1-weighted images. Korean J Radiol 2007; 8: 185–91. doi: 10.3348/kjr.2007.8.3.185 [DOI] [PMC free article] [PubMed] [Google Scholar]
- 27.Nemeth AJ, Henson JW, Mullins ME, Gonzalez RG, Schaefer PW. Improved detection of skull metastasis with diffusion-weighted MR imaging. AJNR Am J Neuroradiol 2007; 28: 1088–92. doi: 10.3174/ajnr.A0501 [DOI] [PMC free article] [PubMed] [Google Scholar]
- 28.Ozgen B, Oguz KK, Cila A. Diffusion MR imaging features of skull base osteomyelitis compared with skull base malignancy. AJNR Am J Neuroradiol 2011; 32: 179–84. doi: 10.3174/ajnr.A2237 [DOI] [PMC free article] [PubMed] [Google Scholar]
- 29.Dietrich O, Raya JG, Reeder SB, Reiser MF, Schoenberg SO. Measurement of signal-to-noise ratios in MR images: influence of multichannel coils, parallel imaging, and reconstruction filters. J Magn Reson Imaging 2007; 26: 375–85. doi: 10.1002/jmri.20969 [DOI] [PubMed] [Google Scholar]
- 30.Malyarenko D, Galbán CJ, Londy FJ, Meyer CR, Johnson TD, Rehemtulla A, et al. Multi-system repeatability and reproducibility of apparent diffusion coefficient measurement using an ice-water phantom. J Magn Reson Imaging 2013; 37: 1238–46. doi: 10.1002/jmri.23825 [DOI] [PMC free article] [PubMed] [Google Scholar]


