

Abstract
Beta amyloid (Aβ) triggers the elimination of excitatory synaptic connections in the CNS, an early manifestation of Alzheimer's disease. Oligomeric assemblies of Aβ peptide associate with excitatory synapses resulting in synapse elimination through a process that requires NMDA-type glutamate receptor activation. Whether Aβ affects synaptic NMDA receptor (NMDAR) function directly and acts locally at synapses to which it has bound and whether synaptic activity influences Aβ synaptic binding and synaptotoxicity have remained fundamental questions. Here, we used subcellular Ca2+ imaging in rat hippocampal neurons to visualize NMDAR function at individual synapses before and after Aβ application. Aβ triggered a robust impairment of NMDAR Ca2+ entry at most, but not all, synapses. NMDAR function was more severely impaired at highly active synapses and synapses with bound Aβ, but activity was not required for Aβ synapse binding. Blocking NMDARs during Aβ exposure prevented Aβ-mediated impairment. Finally, Aβ impaired NMDAR Ca2+ entry at doses much lower than those required for NMDAR internalization, revealing a novel, potent mode of NMDAR regulation by Aβ.
SIGNIFICANCE STATEMENT Amyloid β (Aβ) is strongly implicated in Alzheimer's disease. Aβ triggers the elimination of excitatory synapses through a mechanism that requires NMDA receptors (NMDARs). However, little is known about how or whether Aβ influences synaptic NMDAR function. We used an imaging-based assay to investigate the relationship among Aβ binding, activity, and NMDAR function at individual synapses. Aβ triggered a robust impairment of NMDAR Ca2+ entry at most, but not all, synapses. NMDAR function was more severely impaired at highly active synapses and synapses with bound Aβ. Blocking NMDARs during Aβ exposure prevented Aβ-mediated impairment. Together, our experiments reveal a novel use-dependent, potent, and local mode of Aβ-mediated NMDAR impairment.
Keywords: Alzheimer's, amyloid, calcium, NMDA receptor, plasticity, synapse
Introduction
Widely recognized as one of the primary pathological agents responsible for Alzheimer's disease (AD), β-amyloid peptide (Aβ) triggers a broad host of cellular pathologies including synapse loss, tau phosphorylation, and ultimately cell death (Greenberg et al., 1994; Lambert et al., 1998; Kamenetz et al., 2003; Cleary et al., 2005; Hsieh et al., 2006; Lacor et al., 2007; Shankar et al., 2007). One of the earliest manifestations of AD in the CNS is the loss of excitatory synapses and impaired function at remaining synapses, which precedes widespread neuronal cell death (DeKosky and Scheff, 1990; Terry et al., 1991).
Accumulating evidence suggests that early synaptic dysfunction is triggered by soluble oligomeric assemblies of Aβ (Aβo), which bind to the surface of neurons and form clusters in close proximity to a large fraction of excitatory synaptic sites (Gong et al., 2003; Lacor et al., 2004; Renner et al., 2010). Acute exposure to nanomolar concentrations of Aβo blocks fundamental forms of synaptic plasticity, including LTP, within minutes and triggers depression and eventual elimination of excitatory synaptic connections over the course of days (Lambert et al., 1998; Freir et al., 2001; Walsh et al., 2002; Cleary et al., 2005; Shankar et al., 2008; Kessels et al., 2010; Jo et al., 2011). Intriguingly, a number of studies have demonstrated that Aβo synaptotoxicity is mediated by NMDA receptors (NMDARs), which are required for LTP and play a central role in learning and memory. NMDAR activity is required for Aβo-induced spine loss (Shankar et al., 2007; Wei et al., 2010) and for Aβo-induced synaptic depression (Tamburri et al., 2013), but how Aβo influences NMDAR function remains controversial. Some studies suggest that Aβo causes a gain of receptor function and disruption of Ca2+ homeostasis (Demuro et al., 2005; De Felice et al., 2007; Alberdi et al., 2010), whereas others provide evidence for loss of NMDAR function by removal from the cell surface and activation of synaptic depression signaling pathways (Snyder et al., 2005; Shankar et al., 2007, 2008; Kurup et al., 2010; Jo et al., 2011; Tamburri et al., 2013). Whether Aβo triggers loss or gain of NMDAR function and acts locally, where it is bound to influence NMDAR function, and whether synaptic activity influences Aβo synaptic binding or its effects on NMDAR function remain fundamental questions.
Here, we used subcellular Ca2+ imaging to visualize quantal NMDAR responses at the same synaptic sites before and after exposure to Aβo, allowing us to make longitudinal comparisons of NMDAR function before and after Aβo exposure at thousands of synapses while simultaneously visualizing Aβo localization. Therefore, for the first time, we can measure the relationship between Aβo surface binding, NMDAR function, and activity at individual synapses. Subnanomolar concentrations of Aβo triggered a reduction in synaptic NMDAR-mediated Ca2+ entry within minutes, but had no effect on AMPA receptor function over the same timescale. Surprisingly, NMDAR Ca2+ influx was impaired at Aβo doses at least an order of magnitude lower than those required for triggering NMDAR internalization. NMDARs were more robustly impaired at Aβo-bound synapses than adjacent unbound synapses, demonstrating that Aβo engages local signaling pathways to disrupt NMDAR function. Finally, using a synapse-specific silencing strategy, we show that Aβo bound to and clustered at excitatory synaptic sites regardless of their activity state. However, Aβo-induced NMDAR impairment required activation of NMDARs through a mechanism distinct from receptor internalization.
Materials and Methods
Cell culture.
Primary hippocampal neurons were prepared from neonatal Sprague Dawley rats of either sex. Hippocampi were dissected from the brains of postnatal day 0–2 rats and dissociated by papain digestion. Neurons were plated at 150,000–175,000 cells/dish in MEM and 10% FBS (Hyclone) containing penicillin/streptomycin on poly-d-lysine-coated 35 mm glass bottom dishes. After 1 d, the medium was replaced with Neurobasal-A medium supplemented with B27 (Invitrogen) and GlutaMAX (Thermo Fisher). The neurons were then fed with Neurobasal-A, B27, and mitotic inhibitors (uridine + fluoro deoxyuridine) by replacing half of the medium on day 6 or day 7 and then once weekly. Neurons were maintained at 37°C in a humidified incubator at 5% CO2. Neurons were transfected using Lipofectamine 2000 (Invitrogen) according to the manufacturer's recommendations and allowed to express for 48 h. For all Ca2+-imaging experiments, neurons were transfected with a plasmid encoding the genetically encoded Ca2+ indicator GCaMP6s (plasmid #40753, Addgene; Chen et al., 2013). All neurons were between 16 d in vitro (DIV16) and DIV19 at the time of the experiment.
Aβ preparation.
HiLyte Fluor 647 and 555-labeled Aβ1–42 (AnaSpec) were prepared (using a ratio of 1:3 labeled: unlabeled) in aliquots as a dried 1,1,1,3,3,3-hexafluoro-2-propanol film and stored at −80°C, as described previously (Klein, 2002). The peptide film was dissolved in 4.4 μl of anhydrous DMSO and diluted to 50 μm with 1× PBS and allowed to oligomerize at 4°C overnight. The preparation was centrifuged at 14,000 × g for 10 min at 4°C to remove insoluble aggregates. The supernatants were then filtered using a 30 kDa cutoff Microcon YM-30 filter (Millipore). The flow-through was discarded and the peptide remaining on the filter was resuspended in 600 μl of PBS (10 μm) and kept on ice until use. Scrambled Aβ peptide (AnaSpec) was prepared in the same manner, skipping the size exclusion filter step because they do not multimerize. Because these Aβ preparations are highly heterogeneous, it is likely that the concentration of the oligomeric Aβ species is actually lower than what is reported in our dose–response curves, which were calculated assuming complete incorporation of Aβ peptide into oligomers and without accounting for peptide that was removed in the insoluble fraction.
Pharmacological reagents.
DL-AP5 (50 μm; Tocris Bioscience) and Mg2+ (1 mm; Sigma-Aldrich) were used to inhibit NMDARs. TTX (2 μm; Tocris Bioscience) was used to inhibit voltage-gated sodium channels. Ifenprodil (5 μm; Tocris Bioscience) was used to inhibit GluN2B-containing NMDARs.
Live-cell imaging.
Live-cell imaging of dissociated neurons was performed at 34°C on an Olympus IX71 equipped with a spinning disc scan head (Yokogawa). Excitation illumination was delivered from an acousto-optic tunable filter (AOTF) controlled laser launch (Andor). Images were acquired using a 60× Plan Apochromat 1.4 numerical aperture objective and collected on a 1024 × 1024 pixel Andor iXon EM-CCD camera. Data acquisition and analysis were performed with MetaMorph (Molecular Devices) and ImageJ software.
Ca2+ imaging and analysis.
To image quantal Ca2+ transients (QCTs), neurons transfected with GCaMP6(s) were incubated in an artificial CSF (ASCF) solution containing the following (in mm): 130 NaCl, 5 KCl, 10 HEPES, 30 glucose, 2.5 CaCl2, and 0.002 TTX, pH 7.4 (Reese and Kavalali, 2015). Single z-plane images of a portion of the dendritic arbor were acquired at 7 Hz for 1 min to record baseline QCTs. Then, 500 nm Aβ, 500 nm scrambled Aβ peptide, or PBS was added directly and cells were incubated for 45 min. The same z-plane was then imaged again to record QCTs after treatment.
To measure the frequency and amplitude of QCTs, regions of interest (ROIs) were drawn around 12 clearly resolved spines per cell in the baseline movie. The ROIs were saved and the same synapses were analyzed in the posttreatment movie. The mean background-subtracted GCaMP6 fluorescence within each ROI was measured. A baseline of 10 frames was established and each frame was compared with that baseline. A threshold of a 100% increase in fluorescence over baseline was established to remove small variations in fluorescence. Event frequency and average amplitude were compared between baseline and post-Aβo treatment. Data are plotted as the change in frequency or amplitude relative to the baseline values.
For experiments performed with Mg2+ or APV, baseline QCTs were imaged in Mg2+/APV-free media. Mg2+ or APV were then coapplied with Aβ or PBS and incubated for 45 min. Inhibitors were then removed by washing with ACSF lacking Mg2+ and posttreatment QCTs were imaged. Aβ controls (using medium lacking APV/Mg2+) in these experiments were performed to ensure efficacy of the Aβ preparation.
For experiments testing the effect of Aβo on NMDAR function using spontaneous network activity to drive NMDARs in the presence of Mg2+, QCTs were first imaged (in 2 μm TTX/Mg2+-free medium), followed by exposure to 500 nm Aβo in medium lacking TTX and containing 1 mm Mg2+. After a 60 min incubation, cells were returned to medium lacking Mg2+ and containing 2 μm TTX for a second round of QCT imaging.
For experiments performed with ifenprodil, baseline QCTs were imaged. Then, 5 μm ifenprodil was added and cells were imaged immediately. Next, 500 nm Aβ was applied and allowed to incubate for 45 min, followed by a third round of QCT imaging in the continued presence of 5 μm ifenprodil.
Glutamate uncaging.
For experiments involving glutamate uncaging, neurons were incubated in ASCF solution containing the following (in mm): 130 NaCl, 5 KCl, 10 HEPES, 30 glucose, 2.5 CaCl2, and 0.002 TTX, pH 7.4, supplemented with 1 mm 4-methoxy-7-nitroindolinyl (MNI)-caged l-glutamate (Tocris Bioscience). Individual dendritic spines were focally stimulated using galvanometric mirrors (FRAPPA; Andor Technologies) to steer a diffraction-limited 405 nm spot. An AOTF was used to gate a 500 μs pulse of 405 nm light, with the laser intensity adjusted to 3% of total laser power from a 100 mW 405 nm laser that was fiber coupled to the FRAPPA laser-scanning unit. This protocol reliably triggered NMDAR-mediated Ca2+ transients with similar amplitude and duration as spontaneous NMDAR activation by quantal release of glutamate.
Electrophysiology.
Dissociated hippocampal neurons were either treated with Aβo or scrambled control peptide under conditions identical to those used for QCT imaging. Immediately before recording mEPSCs, cells were switched to medium containing Mg2+ and bicuculline. Whole-cell voltage-clamp recordings were performed from dissociated hippocampal neurons (DIV17–19) bathed in the following (in mm): 10 HEPES, 130 NaCl, 5 KCl, 30 d-glucose, 2 CaCl2, and 1 MgCl2 supplemented with 1 μm TTX and 30 μm bicuculline. Intracellular solution contained the following (in mm): 130 cesium methanesulfonate, 3 Na2ATP, 0.5 Na3 GTP, 0.5 EGTA, 10 phosphocreatine, 5 MgCl2, 2.5 NaCl, and 10 HEPES (290–300 mOsm). The pH was adjusted to 7.25 with CsOH. Data were collected using a multiclamp 700b amplifier and digitized using a National InstrumentsDAQ board at 10 kHz and filtered at 2 kHz (single-pole Bessel filter) and collected with WinLTP software (University of Bristol). Data were analyzed using WinLTP (University of Bristol), the NeuroMatic package in IGOR Pro (WaveMetrics), and Mini Analysis (Synaptosoft) software.
Lentivirus production.
Synaptophysin-GFP-IRES-tetanus toxin (TeNT) was cloned downstream of the synaptophysin promoter in a modified plentilox backbone. Lentivirus was packaged in HEK293FT cells using standard techniques (Wang and McManus, 2009). After at least 24 h of transfection, supernatant was harvested, centrifuged at 4000 × g, and filtered through a 0.45 μm syringe filter. Virus was concentrated by ultracentrifugation through a 20% sucrose cushion, resuspended in PBS, aliquoted, and stored at −80°C.
Aβo dual labeling.
HiLyte 555-labeled Aβ and HiLyte 647-labeled Aβ were prepared and described above. Then, 250 nm 555-labeled Aβ was applied to the cultures and, after a 10 min incubation, 250 nm 647-labeled Aβ was applied to the same cultures. After another 10 min of incubation, cultures were rinsed with ACSF and imaged. The inverse experiment was performed in parallel (647-labeled Aβ followed by 555-labeled Aβ) and imaged using the same imaging parameters. For the overall binding analysis, a mask was drawn around the neuron using the GFP cell fill in ImageJ and the average 561 and 647 fluorescence intensities were measured within this mask. For synapse-specific binding, ROIs were drawn around all spines (identified using the GFP cell fill) on a neuron and Aβ fluorescence levels were measured.
Surface biotinylation assay.
Surface biotinylation assay was performed as described previously with minor modifications (Mammen et al., 1997). Briefly, neurons were treated in the same conditions as used for imaging. After Aβo treatment, neurons were washed 3 times in ACSF with 2 mm Ca2+/1 mm Mg2+/1 μm TTX. Neurons were then incubated in ACSF containing 1 mg/ml EZ-link-sulfo-NHS-LC-biotin (Thermo Fisher) for 10 min at room temperature. Neurons were rinsed 3 times in ACSF + 0.1% BSA and then scraped and lysed in 200 μl warm precipitation buffer (PB) containing the following (in mm): 10 NaPO4, pH 7.4, 5 EDTA, 5 EGTA 100 NaCl, 1 Na3VO4, 10 sodium pyrophosphate, and 50 NaF with complete ULTRA protease inhibitor mixture tablets (Roche), 1% SDS, and 1% Triton X-100. Lysates were sonicated and centrifuged for 20 min at 18,000 × g. Before pull-down of biotinylated proteins, 10% of the cell lysate was reserved for total input quantification. The remaining sample was combined with NeutrAvidin agarose beads (30 μl; Thermo Fisher) and incubated overnight at 4°C. The beads were washed 2 times each with PB containing 0.1% Triton X-100, 0.1% Triton X-100 plus 600 mm NaCl, and PB alone. To elute captured proteins, 1× SDS-PAGE buffer was added to the beads and the samples were boiled for 5 min before loading onto 10% SDS-PAGE gels. Immunoblotting was performed with GluN1 antibody (1:1000, #AB9864; Millipore) and HRP-conjugated secondary antibody (Bio-Rad). Blots were quantified by comparing the ratio of biotinylated GluN1 with the total GluN1 for a given sample. Values were normalized to control samples treated in an identical manner but not exposed to Aβo.
Statistical analysis.
Statistical significance for experiments comparing two populations was determined using a two-tailed unpaired Student's t test. In cases in which the two populations represented paired measurements (e.g., pre- and post-Aβo treatment), a paired Student's t test was used. For experiments comparing three or more populations, a one-way ANOVA with Bonferroni multiple-comparisons test was used. All statistical analyses were performed using GraphPad Prism software. All data are presented as mean ± SEM unless otherwise noted.
Results
Quantal Ca2+ transients as an assay for synaptic NMDAR function
To investigate the spatiotemporal effects of Aβo on NMDAR function at individual synapses, we needed an assay that would allow us to simultaneously interrogate NMDAR function and Aβo binding with high spatial resolution. Ideally, we would be able to measure NMDAR function before and at various times after Aβo exposure at the same synaptic sites. Previous reports have demonstrated that fluorescent Ca2+ indicators can be used to visualize Ca2+ influx through NMDARs in response to spontaneous, quantal neurotransmitter release (Murthy et al., 2000; Reese and Kavalali, 2015). When we imaged dissociated hippocampal neurons expressing GCaMP6s in extracellular solution containing TTX to block evoked neurotransmitter release and nominally Mg2+-free medium to relieve NMDAR pore block, we observed brief, but very robust spontaneous fluorescent transients that originated in dendritic spines, the major sites of excitatory synaptic contact (Fig. 1A). These events decayed with a time constant τ = 0.712 ± 0.05 s (Fig. 1A), similar to the reported rate of Ca2+ dissociation for GCaMP6s (Chen et al., 2013). We observed a broad range of event frequencies at individual synaptic sites, ranging from 0 to 40 events/min, with 54 ± 3.2% of dendritic spines exhibiting at least 1 event/min. At the same synaptic sites, event frequencies were relatively stable for at least 60 min (0.92 ± 0.08 relative to baseline). Event amplitudes varied widely from synapse to synapse, but multiple events at the same synapse displayed amplitudes that were normally distributed around the mean value for that synapse (p > 0.1, Kolmogorov–Smirnov normality test), consistent with single neurotransmitter vesicle release events triggering postsynaptic Ca2+ influx (Fig. 1B). These events were only observed when cells were bathed in medium lacking Mg2+(data not shown) and were robustly blocked by APV (50 μm), confirming they originate from NMDAR activation (Fig. 1C). Spontaneous Ca2+ transients were within the dynamic range of GCaMP6s because event amplitudes approximately doubled (1.9 ± 0.1-fold) in size when we increased the concentration of extracellular Ca2+ from 2 to 4 mm (Fig. 1D). We subsequently refer to these events as quantal Ca2+ transients (QCTs).
Figure 1.

Quantal Ca2+ responses as an assay for NMDAR function. A, Left, Representative image series of a single-spine QCT (top) and kymograph (bottom) showing three consecutive events at the same spine over a 1 min imaging period. Scale bar, 5 s. Right, Successive Ca2+ responses at the same synapse display similar kinetics and amplitudes. B, QCT amplitudes are normally distributed at individual synaptic sites. Displayed is a histogram of QCT amplitudes measured at individual synaptic sites divided by the mean values for each respective site (n = 872 synapses from 72 neurons). Synapses with only 1 QCT during the 1 min imaging period were not included in the analysis. C, GCaMP6 traces from a single spine before (black) and after (red) application of 50 μM APV. The APV trace is vertically offset from the control trace. Frequency of QCTs before (−APV) and after addition of APV (+APV) is plotted to the right (n = 204 spines from 17 neurons). Scale bar, 10 s. D, Representative Ca2+ transients measured from the same spine in the presence of 2 mm (black) or 4 mm (red) extracellular Ca2+. Relative QCT amplitude and frequency values in 4 mm versus 2 mm Ca2+ are plotted to the right (amplitude: black, n = 244 spines from 47 neurons; frequency: gray, n = 281 spines from 47 neurons).
Aβo rapidly reduces synaptic NMDAR function
We next measured QCTs at the same synaptic sites before and 45 min after application of 500 nm Aβo (Fig. 2A; Movies 1, 2). We observed heterogeneous effects at individual synapses, with some synapses showing reduced amplitude (64.3% of synapses displayed >10% decrease) and/or frequency (63.2% of synapses displayed >10% decrease) responses, whereas others were unaffected. PBS (vehicle) or scrambled Aβ peptide had no effect on QCTs over the same time period, confirming that decreased QCT parameters are specific to Aβo and not a result of GCaMP6 photobleaching, residual peptide solvent/counter ions, or a decline in the health of the preparation between the first and second round of GCaMP6 imaging (Fig. 2B,C). The effects of Aβo on both QCT amplitude and frequency were saturated within 30 min of application (Fig. 2D).
Figure 2.

Aβo reduces QCT amplitude and frequency. A, Example traces from single synapses (marked by boxes in image to the left) before (red) and after 45 min treatment with 500 nM Aβo (blue). Individual synapses displayed (Ai) no change, (Aii) reduced amplitude and frequency, and (Aiii) complete loss of QCTs after Aβ treatment. B, QCT amplitudes were measured at synaptic sites before and after application of 500 nM Aβo. The bar graph plots the change in QCT amplitude 45 min after Aβo treatment divided by the baseline (pre-Aβo) value. Synapses with no QCTs posttreatment were eliminated from amplitude analysis. Left, Effect of PBS (black; n = 318 synapses from 34 neurons), Scrambled Aβ peptide (red; n = 358 synapses from 36 neurons), or Aβo (blue; n = 218 synapses from 39 neurons; PBS and Scrambled Aβ vs Aβo: p = 0.001, unpaired Student's t test). Right, Cumulative distribution of amplitudes measured posttreatment relative to baseline for spines incubated with PBS (black), Scrambled Aβ peptide (red) and Aβo (blue) (p = 0.036 comparing Scrambled Aβ and Aβo, Kolmogorov–Smirnov test). C, QCT frequencies were measured at individual synaptic sites before and after application of 500 nM Aβo. The bar graph plots the change in QCT frequency 45 min after Aβo treatment divided by the baseline (pre-Aβo) value. Left, Effect of PBS (black; n = 404 synapses from 34 neurons), Scrambled Aβ peptide (red; n = 431 synapses from 36 neurons), and Aβo (blue; n = 467 synapses from 39 neurons; PBS and Scrambled Aβ vs Aβo: p < 0.0001, Student's t test). Right, Cumulative distribution of frequency posttreatment relative to baseline for spines incubated with PBS (black), Scrambled Aβ peptide (red), and Aβo (blue) (p = 0.0067 comparing Scrambled Aβ and Aβo, K-S test). D, QCT amplitude (solid lines) and frequency (dashed lines) were measured 10, 30, and 60 min after exposure to PBS (black) or Aβo (blue). For amplitude measurements, n = 165 spines (10 min), 170 spines (30 min), and 153 spines (60 min) from 18 neurons for PBS and n = 210 spines (10 min), 193 spines (30 min), and 184 spines (60 min) from 24 neurons for Aβo. For QCT frequency measurements, n = 216 spines from 18 neurons for all time points for PBS and n = 288 spines from 24 neurons for all time points for Aβo.
Aβo reduces QCT frequency and amplitude. Shown is a representative dendritic arbor illustrating QCTs before and 45 min after application of 500 nm Aβo. Scale bar, 5 μm. Time stamp is in seconds.
Aβo affects QCTs heterogeneously. Four representative spines are shown before and 45 min after application of 500 nm Aβo. Scale bar, 0.5 μm. Time stamp is in seconds.
A reduction in QCT parameters could be presynaptic in origin, resulting from decreased spontaneous neurotransmitter release events and/or a reduction in the amount of vesicular neurotransmitter. We addressed these possibilities using two independent approaches. We first measured AMPA receptor miniature EPSCs (mEPSCs) using Aβ preparations and incubation conditions identical to those used for QCT measurements. We reasoned that any changes in presynaptic release properties that reduced QCT frequency and amplitude would also manifest in reduced frequency and amplitude of AMPA receptor mEPSCs. Although previous studies have shown that prolonged exposure to Aβ over the course of many hours or days leads to reduced excitatory synapse number with a concomitant reduction in AMPA receptor mEPSC frequency and amplitude (Chang et al., 2006; Shankar et al., 2007), we show that relatively short-term exposure (45–75 min) has no effect (amplitude: Aβo = 14.81 ± 0.52 pA, Scr. Aβ = 13.89 ± 0.54 pA or frequency: Aβo = 3.38 ± 0.49 Hz, Scr. Aβ = 2.92 ± 0.35 Hz, Aβo: n = 16 cells; Scr. Aβ: n = 15 cells; Fig. 3A–C). Using an independent approach, we bypassed presynaptic release mechanisms by activating NMDARs directly using MNI-glutamate uncaging (Matsuzaki et al., 2001; Shankar et al., 2007). We were able to induce Ca2+ transients by glutamate uncaging that were nearly identical in amplitude and duration to QCTs evoked by vesicular neurotransmitter release (Fig. 3D). Uncaging-induced Ca2+ transients were measured under baseline conditions and then again at the same synapses 45 min after the addition of Aβo or vehicle. On average, Aβo treatment resulted in a robust decrease in uncaging-evoked spine Ca2+ influx compared with pre-Aβo exposure, although 29.8% of synapses displayed no significant change, consistent with our previous data showing that NMDAR function was resistant to Aβo at a fraction of synapses (Fig. 2). Controls not exposed to Aβo showed no significant reduction over the same time period (Aβo-treated: −26.60 ± 4.33% change in amplitude, controls: 3.93 ± 5.75% change in amplitude; Fig. 3D–F). Together, this set of experiments provides strong evidence that the Aβo-triggered reduction in QCT parameters that we observed are predominantly due to impaired postsynaptic NMDAR function, but do not rule out the potential for additional presynaptic impairment after longer exposures or higher Aβo concentrations.
Figure 3.

Aβo impairs NMDARs through a postsynaptic mechanism. A, Sample traces of AMPA receptor mEPSCs from neurons incubated with scrambled Aβ peptide or Aβo. Scale bars: 20 pA (y-axis) and 1 s (x-axis). B, Left, Average mEPSC frequency after 45–75 min incubation with scrambled Aβ peptide (red; n = 15 neurons) or Aβo (blue; n = 16 neurons). Right, Cumulative probability of interevent interval for mEPSCs. C, Left, Average mEPSC amplitude after 45–75 min incubation with scrambled Aβ peptide (red; n = 15 neurons) or Aβo (blue; n = 16 neurons). Right, Cumulative probability of amplitudes with scrambled Aβ (red) or Aβo (blue). D, Ca2+ transients evoked by MNI-glutamate uncaging closely resemble spontaneous QCTs (left panel and kymographs). The right two panels display the same spine before and after Aβo treatment, with corresponding uncaging-evoked Ca2+ responses below. Asterisks denote the location of the uncaging spot. Scale bars, 1 s. E, Left, Averaged normalized uncaging-evoked spine Ca2+ transients measured before (red line) and 45 min after (blue line) treatment with PBS (left; n = 36 spines from 6 randomly selected neurons) or Aβo (right; n = 36 spines from 6 randomly selected neurons). Right, Box-and-whisker plot showing the amplitude of uncaging responses posttreatment with PBS or Aβo normalized to the baseline response. Box displays the median and upper and lower quartiles and whiskers display minimum and maximum values (PBS: n = 118 spines from 20 neurons; Aβo: n = 118 spines from 20 neurons; p < 0.0001, Student's t test). F, Left, Average effect of PBS (black; n = 118 spines from 20 neurons) or Aβo (blue; n = 118 spines from 20 neurons) on uncaging-evoked Ca2+ transient amplitudes (p < 0.0001, Student's t test). Right, Cumulative probability of the change in amplitude for PBS-treated cells (black) or Aβo-treated cells (blue).
Aβo-induced impairment of NMDAR function depends on receptor activity
Individual synapses displayed a wide range of spontaneous QCT frequencies, allowing us to compare the effects of Aβo on synapses with varying levels of baseline spontaneous activity. Intriguingly, we observed that Aβo elicited a significantly larger reduction in relative QCT frequency at synapses that initially displayed high QCT frequencies (greater than the mean value of 4.25 events/min) before Aβo treatment (Fig. 4A,B). We did not observe this phenomenon when cells were exposed to either PBS vehicle alone or scrambled Aβ peptide over the same time period (Fig. 4B; Aβo ≤4 events min−1: −0.416 ± 0.800, ≥5 events min−1: −0.7247 ± 0.0313, p = 0.04, Student's t test). We performed a similar analysis for relative QCT amplitude by comparing synapses with baseline responses that were larger or smaller than the mean amplitude for all synapses. Synapses with initial amplitudes greater than the mean value were more significantly impaired than synapses with initial amplitudes smaller than the mean value (Aβo: small amplitude: −0.0420 ± 0.0472; large amplitude: −0.495 ± 0.0362; p < 0.0001, Student's t test; Fig. 4A,B). This effect was nearly identical when we categorized high- and low-amplitude/frequency synapses based on the upper and lower quartile of their respective distributions (amplitude-lower quart: 0.084 ± 0.064, upper quart: −0.56 ± 0.041; frequency-lower quart: −0.315 ± 0.081, upper quart: −0.79 ± 0.037). This phenomenon was not observed when cells were exposed to scrambled Aβ peptide or PBS alone. We also separately analyzed synapses that had high initial frequency/low amplitude and high initial amplitude/low-frequency responses. These synapses also displayed significant reductions in both frequency and amplitude (normalized to pre-Aβo values: high amplitude/low frequency-amplitude: −0.51 ± 0.046, frequency: −0.42 ± 0.085; low amplitude/high frequency-amplitude: −0.13 ± 0.073, frequency: −0.73 ± 0.037). This analysis indicates that the effect of Aβo on NMDARs manifests both in response to low, persistent Ca2+ influx (i.e., low amplitude, more frequent QCTs) or high, but sparse Ca2+ influx (i.e., large amplitude, less frequent QCTs).
Figure 4.
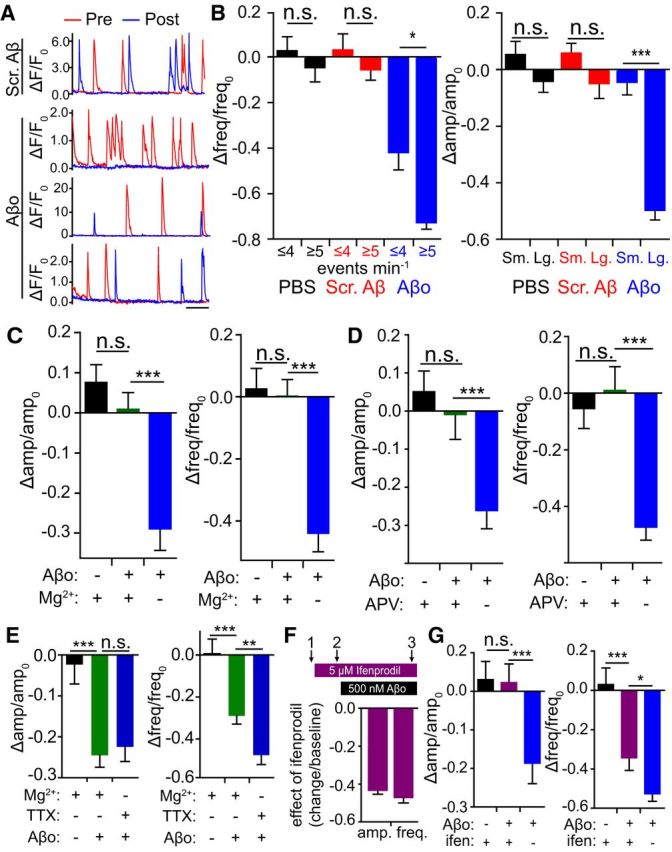
NMDAR activity is required for the Aβo-induced decrease in QCT frequency and amplitude. A, Traces from individual synapses before (red line) and after (blue line) treatment with scrambled Aβ (top example) or Aβo (bottom three examples). Example of a high-frequency, low-amplitude synapse (Aβo, top), a low-frequency, high amplitude synapse (Aβo, middle), and a low-frequency, low-amplitude synapse (Aβo, bottom) are shown. Scale bar, 10 s. B, Left, Synapses were sorted based on their initial, pretreatment QCT frequencies. Synapses with high initial frequency (above the mean) were more susceptible to Aβo than low-frequency (below the mean) synapses (PBS: less active: n = 270 spines from 34 neurons, more active: n = 134 spines from 34 neurons; Scrambled Aβ: less active: n = 254 spines from 36 neurons, more active: n = 177 spines from 36 neurons; Aβo: less active: n = 332 spines from 39 neurons, more active: n = 135 spines from 39 neurons; p = 0.0065, Student's t test) Right, Synapses were sorted based on their initial, pretreatment QCT amplitudes. Synapses that displayed large (above the mean value) baseline amplitudes were more susceptible to Aβo than synapses with small (below the mean value) amplitudes (PBS: small amplitude: n = 189 spines from 34 neurons, large amplitude: n = 127 spines from 34 neurons; Scrambled Aβ: less active: n = 249 spines from 36 neurons, more active: n = 177 spines from 36 neurons; Aβo: small amplitude: n = 136 spines from 39 neurons, large amplitude: n = 82 spines from 39 neurons; p < 0.0001, Student's t test). C, Mg2+ blocks Aβo-mediated NMDAR impairment. QCTs were measured before and after 45 min Aβo incubation (500 nM) in the presence of 1 mm Mg2+. Mg2+ was washed off immediately before post-Aβo QCT measurement. Left, Effect of PBS plus Mg2+ block (black; n = 275 spines from 29 neurons), Aβo plus Mg2+ block (green; n = 358 spines from 36 neurons) and Aβo in nominally Mg2+-free ACSF (blue; n = 121 spines from 16 neurons) on QCT amplitude. Right, Effect of PBS plus Mg2+ block (black; n = 348 spines from 29 neurons), Aβo plus Mg2+ block (green; n = 432 spines from 36 neurons), and Aβo in nominally Mg2+-free ACSF (blue; n = 192 spines from 16 neurons) on QCT frequency (amplitude and frequency: p < 0.0001, Student's t test). D, APV blocks Aβo-mediated NMDAR impairment. QCTs were measured before and after 45 min Aβo incubation in the presence of 50 μM APV. APV was washed off immediately before post-Aβo QCT measurement. Left, Effect of PBS plus APV (black; n = 216 spines from 22 neurons), Aβo plus APV (green; n = 208 spines from 23 neurons), and Aβo (blue; n = 125 spines from 16 neurons) on QCT amplitude. Right, Effect of PBS plus APV (black; n = 263 spines from 22 neurons), Aβo plus APV (green; n = 276 spines from 23 neurons), and Aβo (blue; n = 192 spines from 16 neurons) on QCT frequency (amplitude and frequency: p < 0.0001, Student's t test). E, Aβo triggers a reduction in QCT amplitude (left) and frequency (right) in the presence of Mg2+ if neurons are allowed to fire action potentials during Aβo exposure. QCTs were measured before and after 60 min Aβo incubation in the presence of 1 mm Mg2+ but in the absence of TTX. Mg2+ was removed and TTX was added immediately before post-Aβo QCT measurement. Left, Effect of PBS plus Mg2+ without TTX (black; n = 218 spines from 22 neurons), Aβo plus Mg2+ without TTX (green; n = 294 spines from 33 neurons; p < 0.0001) and Aβo from the same preparation without Mg2+ but with TTX (blue; n = 154 spines from 18 neurons) on QCT amplitude. Right, Effect of PBS plus Mg2+ without TTX (black; n = 264 spines from 22 neurons), Aβo plus Mg2+ without TTX (green; n = 395 spines from 33 neurons; p < 0.0001 vs PBS, p = 0.0029 vs Aβo), and Aβo from the same preparation without Mg2+ but with TTX (blue; n = 216 spines from 18 neurons) on QCT frequency. F, Top, Schematic of imaging paradigm and ifenprodil/Aβo addition. Bottom, Effect of 5 μM ifenprodil on the amplitude and frequency of QCTs (comparing imaging time 2 to time 1; amplitude: n = 454 spines from 64 neurons; frequency: n = 792 spines from 64 neurons). G, Effect of ifenprodil on Aβo-induced reduction in QCT amplitude (left) and frequency (right) (comparing imaging time 3 to time 2). Black bars represent the effect of PBS in the presence of ifenprodil (amplitude: n = 164 spines from 34 neurons; frequency: n = 232 spines from 34 neurons); purple bars represent the effect of Aβo in the presence of ifenprodil (amplitude: n = 186 spines from 32 neurons; frequency: n = 330 spines from 32 neurons); and blue bars represent the effect of the same Aβo preparation in the absence of ifenprodil (amplitude: n = 134 spines from 18 neurons; p < 0.0001; frequency: n = 216 spines from 18 neurons; p = 0.0318, Student's t test).
Although these data are correlative in nature, they suggest that Aβo impairs NMDAR function in a use-dependent manner. To test this more directly, we measured baseline QCTs and then inhibited NMDARs either by including Mg2+ (1 mm) in the extracellular solution to block the receptor pore (but still allow glutamate binding) or by adding the competitive inhibitor APV (50 μm) during Aβo exposure. As in previous experiments, TTX (2 μm) was also present. After 45 min, APV or Mg2+ was washed out and we performed a second round of QCT imaging. Both Mg2+ and APV completely prevented Aβo-induced reduction in QCT frequency and amplitude compared with control cells exposed to the same Aβo preparation but incubated in 0 Mg2+/APV-free solution during Aβo exposure (Fig. 4C,D). Therefore, NMDAR activation is required for Aβo-induced impairment. So far, all of our experiments were done using spontaneous quantal release to activate NMDARs in the absence of Mg2+. We also tested whether Aβo could still impair NMDARs in the presence of physiological Mg2+ by allowing spontaneous network activity in the culture to drive NMDAR activation. For these experiments, we excluded TTX and included 1 mm Mg2+ during Aβo incubation. We observed a nearly identical decrease in QCT amplitude and a robust decrease in QCT frequency under these conditions (amplitude-PBS: −0.023 ± 0.047, Aβ+Mg2+: −0.25 ± 0.029, Aβ: −0.22 ± 0.036; frequency-PBS:0.006 ± 0.070, Aβ+Mg2+: −0.29 ± 0.040, Aβ: −0.48 ± 0.044; Fig. 4E). QCT frequency impairment by Aβo was slightly attenuated compared with using spontaneous neurotransmission (in the absence of Mg2+) to drive NMDAR activation (Fig. 4E), perhaps because a subset of analyzed synapses may not have been sufficiently activated by network activity for the Aβo effect to manifest.
Previous work has demonstrated that Aβo synaptotoxicity is mediated through NMDARs containing the GluN2B subunit (Hu et al., 2009; Li et al., 2009; Rönicke et al., 2011). To determine whether this is the case for the Aβo-mediated impairment of QCTs, we tested whether the GluN2B-specific antagonist ifenprodil occluded the effects of Aβo. We reasoned that, if Aβo was acting solely through GluN2B-containing receptors, then blocking this subset of NMDARs should mask the effects of Aβo. We first imaged baseline QCTs, then added 5 μm ifenprodil to the bath solution and performed another round of QCT imaging. Ifenprodil alone immediately caused a significant reduction in both QCT frequency and amplitude similar to that observed after Aβo treatment (Fig. 4F), demonstrating that a significant fraction of synapses harbor GluN2B-containing NMDARs in this preparation. We next applied Aβo and incubated cells for an additional 45 min and performed a third round of QCT imaging in the continued presence of ifenprodil. Under these conditions, we observed no further reduction in QCT amplitude by Aβo and a significantly attenuated reduction in QCT frequency compared with Aβo alone, supporting a major role for GluN2B in Aβo-induced impairment (Fig. 4G). One explanation for the lack of complete occlusion on QCT frequency may be due to the presence of triheteromeric NMDARs (containing both GluN2B and GluN2A), which are prevalent in mammalian forebrain neurons and are only partially blocked by 5 μm ifenprodil (Tovar et al., 2013; Hansen et al., 2014). If Aβo affects triheteromeric receptors, then we would see a significant reduction even in the presence of ifenprodil. The apparent complete occlusion of amplitude by ifenprodil may be due to a relatively small effect to begin with.
Distinct mechanisms are responsible for Aβo-mediated QCT inhibition and NMDAR internalization
Numerous previous studies have demonstrated that a fraction of GluN2B-containing NMDARs are endocytosed after Aβo exposure (Snyder et al., 2005; Kurup et al., 2010). We wanted to determine whether NMDAR internalization was responsible for the reduction in QCTs that we observed. To begin addressing this issue, we generated dose–response curves measuring surface NMDARs as a function of Aβo concentration (between 5 pm and 500 nm) under conditions identical to those used for our imaging experiments (Fig. 5). QCT amplitude and frequency were inhibited at extremely low doses of Aβo, with nearly identical IC50 values (35.02 ± 17.93 pm, amplitude and 44.67 ± 2.42 pm, frequency; Fig. 5A). Surprisingly, surface NMDAR levels, measured using surface biotinylation, were not reduced significantly at Aβo concentrations that fully saturated QCT amplitude/frequency reduction (Fig. 5B–D). We next tested whether NMDAR endocytosis depended on receptor activation. Unexpectedly, unlike Aβo-mediated QCT impairment, Aβo-triggered NMDAR internalization was not affected by APV (50 μm; Fig. 5B,E). The drastically different dose–response relationship and the lack of use dependence indicate that impaired NMDAR Ca2+ entry is occurring through a process distinct from previously described surface removal mechanisms.
Figure 5.

Aβo dose-dependent reduction in QCT amplitude and frequency. A, Dose–response curves for QCT frequency (solid blue line, left axis; 0.005 nM, 0.05 nM, and 0.5 nM n = 144 spines from 12 neurons, 5 nM n = 132 spines from 11 neurons, 50 nM n = 288 spines from 24 neurons, 500 nM n = 468 spines from 39 neurons) and amplitude (dashed green line, right axis; 0.005 nM n = 117 spines from 12 neurons, 0.05 nM n = 92 spines from 12 neurons, 0.5 nM n = 84 spines from 12 neurons, 5 nM n = 92 spines from 11 neurons, 50 nM n = 178 spines from 24 neurons, 500 nM n = 218 spines from 39 neurons). B, Representative Western blot of biotinylated surface NR1 (top) and total NR1 (bottom). An unbiotinylated (no biotin) control from a separate experiment is shown to the right. C, Quantification of relative amount of surface NR1/total NR1 after treatment with various concentrations of Aβo normalized to PBS control treatment. Data are reported as the mean from at least three experiments using independent cultures and Aβo preparations. p = 0.0004, one-way ANOVA, 50 nM p < 0.05, 500 nM p < 0.001, Tukey's post test. D, Normalized (from 0 to 1) effects of Aβo on QCT frequency (solid blue line), QCT amplitude (dashed green line), and NMDAR internalization (dotted black line) are plotted together for direct comparison. E, Left, Effects of Aβo on NMDAR internalization in the absence (circles) and presence (squares) of APV normalized to PBS control treatment (see Western blot in B; n = 3 for 500 nM Aβo + APV; 500 nM repeated from C). Right, Effect of APV during Aβo incubation on QCT frequency and amplitude (data repeated from Fig. 4D).
Spatial relationship between Aβ binding and NMDAR function
Given that Aβo only binds to a subset of synapses, we investigated whether it recognizes a specific feature at these synapses or if it randomly associates nonspecifically with cell membrane. To address this, we applied two separate doses of Aβo, each labeled with a different fluorophore. We reasoned that, if the first dose was binding a saturable cell surface receptor(s), it should at least partially occlude subsequent Aβo binding. Conversely, if the first dose binds randomly, then we would expect it not to influence labeling with the second dose. We first applied 250 nm HiLyte 555-labeled Aβo, washed the cells, and then added 250 nm HiLyte 647-labeled Aβo. We found that labeling with the first dose reduced binding of the second dose significantly (Fig. 6A). Interestingly, whereas many spines that labeled with the first dose had little detectable labeling with the second, nearly all (92.8%) the spines that were labeled with the second dose had previously bound the first dose. Conversely, synapses that did not bind the first dose were seldom positive for the second dose (Fig. 6B). These data are consistent with a saturable surface receptor for Aβo that is expressed at some, but not all, excitatory synapses. The fact that we observed a significant extent of colabeled surface puncta could be the result of a previously described “seeding effect” in which surface Aβo clusters formed during the first incubation recruit additional Aβo from the second incubation (Renner et al., 2010).
Figure 6.
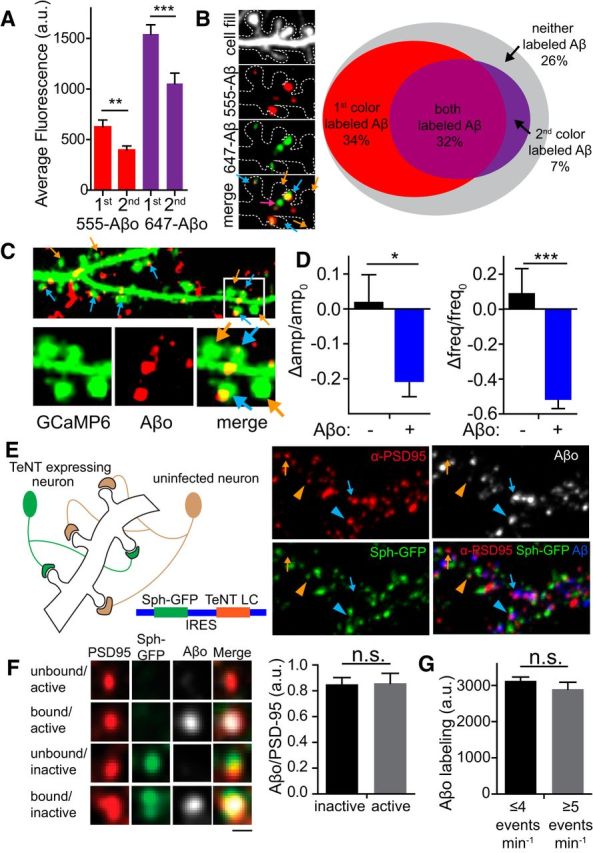
Aβo binds to specific synapses and locally reduces QCT amplitude and frequency. A, Nonrandom binding of Aβo. Cultured hippocampal neurons were exposed sequentially to 250 nM Aβo modified with either HiLyte555 or HiLyte647 for fluorescent visualization. Whole-neuron labeling with the second Aβo dose was reduced significantly regardless of whether 555- or 647-labeled Aβo was applied first (555-Aβo first vs second p = 0.0048; 647-Aβo first vs second p = 0.0008, Student's t test, n = 27 neurons for each condition). B, Aβo labeling at specific dendritic spines. The image shows dendritic spines colabeled with both doses of Aβo (blue arrows), labeled with only the second dose (pink arrow), or unlabeled (orange arrows). In the Venn diagram (right), gray represents the proportion of dendritic spines unbound by Aβo, red represents the proportion of spines bound only by the first dose of Aβo, purple represents the proportion of spines bound only by the second dose of Aβo, and magenta represents the proportion of spines bound by both the first and second doses (n = 26 neurons). C, Top, Representative image of hippocampal dendrites expressing GCaMP6 (green, signal display gain is saturated so that dendritic spine morphology can easily be identified) that were exposed to 50 nM HiLyte 647-labeled Aβo for 45 min before imaging (red). Bottom, Magnified image of Aβo-bound (blue arrows) synapses and neighboring unbound (orange arrows) synapses on the same dendritic branch. D, Change in amplitude and frequency of QCTs at synapses with no detectable Aβo (black; amplitude: n = 72 spines from 10 neurons; frequency: n = 114 spines from 10 neurons) or synapses with bound Aβo (blue; amplitude: n = 94 spines from 10 neurons; frequency: n = 202 spines from 10 neurons; amplitude: p = 0.0124; frequency: p < 0.0001, Student's t test). E, Left, Schematic of TeNT synapse inactivation strategy. Right, Segment of dendrite showing active (arrows) and inactive (arrowheads) synapses bound (blue) and unbound (orange) by Aβo. F, Left, Aβo binds to active and inactive synapses. Matrix showing Aβo binding to both active and inactive synapses. Right, Fluorescence intensity of the Aβo signal was normalized to PSD95 signal at TeNT inactived (n = 115 spines from 11 neurons) synapses and active (n = 72 spines from 11 neurons) synapses. Scale bar, 1 μm. G, Fluorescence intensity of Aβo binding at spines that displayed low-frequency spontaneous activity (n = 367 spines from 39 neurons) and high-frequency spontaneous activity (n = 101 spines from 39 neurons). Frequency was determined by QCT analysis at each spine.
We next investigated the spatial relationship between Aβo surface binding and NMDAR impairment. Our optical assay for NMDAR function can simultaneously survey hundreds of synapses before and after Aβo treatment, allowing us to determine whether NMDAR function is equally diminished at all synapses or if only Aβo-bound synapses are affected. Intriguingly, we observed reduced NMDAR function at a large fraction (63.2% amplitude; 64.3% frequency) of synapses, with a subset (36.8% amplitude; 35.7% frequency) of synapses resistant to Aβo exposure, at least over the timescale of this experiment. Previous work has shown that soluble oligomeric Aβ binds to a fraction (∼60%), but not all excitatory synapses (Lacor et al., 2004, 2007; Renner et al., 2010), but it has been impossible previously to determine the relationship between Aβo surface binding and NMDAR dysfunction. To address this issue, we used 50 nm HiLyte 647-labeled Aβo peptide, which allowed us to visualize the subset of synapses bound by Aβ (63.6 ± 2.5%; Fig. 6C) and simultaneously assay NMDAR function at these synapses compared with neighboring unbound synapses on the same dendrites. We found that both frequency and amplitude were significantly more affected at Aβo-positive spines compared with neighboring Aβo-negative spines (amplitude: Aβo negative: 0.017 ± 0.081; Aβo positive: −0.206 ± 0.046, p = 0.012; frequency: Aβo negative: 0.085 ± 0.147; Aβo positive: −0.512 ± 0.057, p < 0.0001, Student's t test; Fig. 6D), demonstrating that Aβo acts locally, at the level of individual synaptic sites, to impair NMDAR function.
Because the effects of Aβo on NMDAR function require activation of the receptor, we next investigated whether Aβo binds preferentially to excitatory synapses in an activity-dependent manner. We tested this by inactivating a subset of synaptic terminals on a given postsynaptic neuron using a lentiviral vector expressing TeNT light chain to block neurotransmission along with synaptophysin-GFP (syph-GFP) to label silenced presynaptic terminals (Lee et al., 2010; Fig. 6E). We infected dissociated hippocampal cultures with a lentivirus titer empirically determined to infect only a fraction (∼50%) of neurons. After 1.5–2 weeks of expression, we added HiLyte 647-labeled Aβo and then fixed and stained for PSD95 to label excitatory synapses. This approach allowed us to measure Aβo at inactivated (syph-GFP-positive) and control (GFP-negative) excitatory synapses. We found no difference in the level of Aβo binding at inactivated and neighboring control synapses (Fig. 6E,F). As an independent measure of possible activity-dependent Aβo binding, we also quantified Aβo binding to synapses that displayed high-frequency (greater than the mean value) QCTs versus synapses with low-frequency (lower than the mean value) QCTs and observed no significant difference in the amount of Aβo binding (Fig. 6G). Therefore, Aβo binding to excitatory synapses is not sensitive to synaptic activity even though activity is required to inhibit NMDAR Ca2+ entry.
Discussion
We used an optical approach to assess the spatial, temporal, and dose-dependent effects of Aβo on synaptic NMDAR function. The advantage of this approach is that NMDAR Ca2+ entry can be visualized with high spatial resolution at hundreds of synapses before and at various times after experimental manipulation, allowing longitudinal comparisons of NMDAR function at each synaptic site. This approach complements and overcomes limitations of electrophysiological approaches, not only by allowing us to resolve NMDAR function at individual synapses, but also by providing a direct readout of Ca2+ influx, the central second messenger for NMDAR mediated signaling, which is difficult to measure using traditional recording techniques. Coupled with imaging sites of Aβo accumulation, our approach allowed us to investigate for the first time the relationship among synaptic activity, Aβo binding, and NMDAR function.
A surprising observation from our study is that Aβo-induced NMDAR impairment is extremely heterogeneous, even when comparing neighboring synapses on the same dendritic branches. NMDAR Ca2+ entry was severely impaired (such that we no longer observed QCTs) at ∼53% of synapses, whereas 12% of synapses were completely resistant to Aβo (i.e., had no effect on either QCT frequency or amplitude), with remaining synapses showing a significant reduction in amplitude and/or frequency. Although reduced quantal amplitude suggests a postsynaptic reduction in the number and/or function of NMDARs, reduced quantal frequency is classically interpreted as a reduction in the number of spontaneous presynaptic neurotransmitter release events or fewer synapses (Fatt and Katz, 1952). Indeed, Aβo has been shown to reduce evoked neurotransmitter release probability in some studies (Huang et al., 2013; Yang et al., 2015), but was reported to have no effect in others (Shankar et al., 2008). Under conditions of spontaneous release, we observed no change in presynaptic neurotransmitter release as measured by AMPA receptor mEPSC frequency, in agreement with previous reports (Chang et al., 2006; Miller et al., 2014). This observation, coupled with our glutamate uncaging experiments, strongly suggest that reduced QCT frequency arises from either complete loss of NMDARs from a subset of synaptic sites and/or strongly impaired Ca2+ entry through synaptic receptors, such that NMDAR activation can no longer be detected with fluorescent Ca2+ indicators. Previous studies using electrophysiology to measure synaptic NMDAR currents have reported conflicting effects of Aβo (Snyder et al., 2005; Li et al., 2009; Kessels et al., 2013). Our data suggest that Aβo impairs Ca2+ entry mediated by NMDARs, but our approach cannot be used to determine how Aβo influences overall NMDAR currents because Ca2+ only contributes ∼10% to total conductance (Schneggenburger et al., 1993). Moreover, previous work has shown that fractional Ca2+ conductance of NMDARs can be regulated independently of other cations, suggesting that Aβo could selectively impair Ca2+ entry with little effect on total receptor conductance (Skeberdis et al., 2006; Sobczyk and Svoboda, 2007; Murphy et al., 2014).
What is responsible for the heterogenous effects of Aβo at different synaptic sites? Our approach is uniquely suited to address the relationship between Aβo binding and synaptic function. Consistent with previous reports (Lacor et al., 2004, 2007; Renner et al., 2010), application of low concentrations (50 nm in our study) of fluorescently labeled Aβo resulted in a punctate binding pattern that overlapped with a large fraction, but not all excitatory synapses. We found that NMDAR function was much more robustly impaired at Aβo-bound synapses vs neighboring, unbound synapses, indicating that Aβo binding to dendritic spines drives local signaling pathways that disrupt NMDARs in a spatially restricted manner. Higher concentrations (500 nm) of Aβo display more widespread surface binding such that the entire dendritic arbor (and every excitatory synapse) colabels with Aβo, yet no further effect on synaptic NMDAR Ca2+ influx was observed. Our dual-labeling experiment shows that Aβo binding is not random and suggests that a high-affinity receptor for Aβo is present at some, but not all, excitatory synaptic sites and that the more widespread association observed at higher Aβo concentrations is mediated by a different receptor(s). Numerous Aβo receptors have been reported with a broad range of affinities spanning orders of magnitude (Wang et al., 2000; Laurén et al., 2009; Renner et al., 2010; Kim et al., 2013). However, few receptors have been described that bind Aβo with high enough affinity to explain our dose–response relationship, with the exception of the α7 nicotinic acetylcholine receptor, which is reported to bind Aβo with low picomolar affinity (Wang et al., 2000).
Synaptic activity and neural firing is reported to accelerate processing and release of Aβ peptide, but whether Aβ preferentially binds to synapses, or selectively impairs NMDARs in an activity-dependent manner has been difficult to address (Kamenetz et al., 2003; Wei et al., 2010; Das et al., 2013). We observed that synapses displaying either more frequent or larger amplitude spontaneous Ca2+ transients were more susceptible to Aβo-induced NMDAR impairment. This suggests either use-dependent synapse binding and/or a use-dependent mode of impairment. Using a synapse-specific inactivation strategy, we demonstrate that Aβo surface binding is not influenced by synaptic activity but that subsequent NMDAR impairment requires NMDAR activation. Therefore, local Aβo binding with subsequent NMDAR activation are both required for the effect.
Although the molecular signaling mechanisms mediating Aβo-triggered impairment of NMDAR Ca2+ entry await further experiments, numerous previous studies have shown potent regulation of NMDAR trafficking and function through posttranslational modifications of the GluN2B subunit (Bayer et al., 2001; Chung et al., 2004; Skeberdis et al., 2006; Sanz-Clemente et al., 2010; Tu et al., 2010; Murphy et al., 2014). Consistent with this, we observed nearly complete occlusion of Aβo effects when we specifically inhibited GluN2B-containing NMDARs. The most likely mechanism that could explain our results is Aβo-triggered NMDAR endocytosis mediated by dephosphorylation of Tyr1472 by striatal-enriched protein tyrosine phosphatase (Snyder et al., 2005; Kurup et al., 2010). Indeed, our biochemical data agree with previous reports demonstrating that Aβo causes robust NMDAR internalization (Snyder et al., 2005; Kurup et al., 2010). However, we believe the Aβo-triggered reduction in NMDAR Ca2+ entry we observe occurs through a distinct mechanism for two reasons. First, Aβo-mediated effects on QCT amplitude and frequency saturate at a much lower Aβo concentration than that required for NMDAR internalization. Second, even at high Aβo doses (500 nm), Aβo-mediated QCT impairment was use dependent, whereas Aβo-triggered receptor internalization was not. This latter observation suggests that Aβo triggers internalization of predominantly extrasynaptic receptors because synaptic QCTs were unperturbed under these conditions even though total surface NMDARs were reduced by nearly 50%. If NMDAR function is not impaired through endocytosis, then what could be the mechanism? NMDAR regulation by phosphorylation/dephosphorylation at other sites on GluN2B has been the topic of intense interest. Phosphorylation sites for CaMKII, casein kinase 2, DAPK1, and PKA have been identified on the GluN2B C-terminal tail that affect synaptic localization and channel properties (Bayer et al., 2001; Chung et al., 2004; Skeberdis et al., 2006; Sanz-Clemente et al., 2010; Tu et al., 2010; Murphy et al., 2014). For example, recent experiments have demonstrated that NMDAR Ca2+ permeability can be regulated by PKA phosphorylation at Ser1166 (Murphy et al., 2014). Therefore, it is possible that Aβo selectively impairs NMDAR Ca2+ entry with little effect on overall NMDAR current. Such a mechanism could explain discrepancies between our study and previous experiments showing little to no change in total NMDAR currents after Aβo exposure because Ca2+ contributes only modestly to total NMDAR current (Snyder et al., 2005; Kessels et al., 2013). Alternatively, posttranslational modifications could dissociate NMDARs from synaptic sites without reducing total surface receptor levels. Future investigations will focus on whether Aβo-triggered QCT reduction is a result of loss of synaptic NMDARs and/or a reduction in Ca2+ permeability. The simplicity of our assay will allow rapid pharmacological and genetic dissection of the receptor and signaling mechanisms linking Aβo to NMDAR impairment.
Together, our data support a model in which Aβo engages a high-affinity surface receptor through an interaction that does not depend on synaptic activity. Aβo engagement leads to use-dependent and local impairment of synaptic NMDAR Ca2+ influx distinct from previously described surface trafficking mechanisms. More broadly, we introduce a simple, robust, high-resolution optical assay for NMDAR function at individual synaptic sites that will be a powerful platform for investigating the spatiotemporal dynamics of NMDAR signaling for synaptic function in health and disease.
Footnotes
This work was supported by the National Institutes of Health (Grants GM007635-37 and NS082271), the Linda Crnic Institute for Down Syndrome Student (B.L.S. and M.J.K.), the Brain Research Foundation, the Boettcher Foundation, and Pew Charitable Trusts. We thank Mark Dell'Acqua, Tim Benke, and Chandra Tucker for critical review of this manuscript.
The authors declare no competing financial interests.
References
- Alberdi E, Sánchez-Gómez MV, Cavaliere F, Pérez-Samartín A, Zugaza JL, Trullas R, Domercq M, Matute C. Amyloid beta oligomers induce Ca2+ dysregulation and neuronal death through activation of ionotropic glutamate receptors. Cell Calcium. 2010;47:264–272. doi: 10.1016/j.ceca.2009.12.010. [DOI] [PubMed] [Google Scholar]
- Bayer KU, De Koninck P, Leonard AS, Hell JW, Schulman H. Interaction with the NMDA receptor locks CaMKII in an active conformation. Nature. 2001;411:801–805. doi: 10.1038/35081080. [DOI] [PubMed] [Google Scholar]
- Chang EH, Savage MJ, Flood DG, Thomas JM, Levy RB, Mahadomrongkul V, Shirao T, Aoki C, Huerta PT. AMPA receptor downscaling at the onset of Alzheimer's disease pathology in double knockin mice. Proc Natl Acad Sci U S A. 2006;103:3410–3415. doi: 10.1073/pnas.0507313103. [DOI] [PMC free article] [PubMed] [Google Scholar]
- Chen TW, Wardill TJ, Sun Y, Pulver SR, Renninger SL, Baohan A, Schreiter ER, Kerr RA, Orger MB, Jayaraman V, Looger LL, Svoboda K, Kim DS. Ultrasensitive fluorescent proteins for imaging neuronal activity. Nature. 2013;499:295–300. doi: 10.1038/nature12354. [DOI] [PMC free article] [PubMed] [Google Scholar]
- Chung HJ, Huang YH, Lau LF, Huganir RL. Regulation of the NMDA receptor complex and trafficking by activity-dependent phosphorylation of the NR2B subunit PDZ ligand. J Neurosci. 2004;24:10248–10259. doi: 10.1523/JNEUROSCI.0546-04.2004. [DOI] [PMC free article] [PubMed] [Google Scholar]
- Cleary JP, Walsh DM, Hofmeister JJ, Shankar GM, Kuskowski MA, Selkoe DJ, Ashe KH. Natural oligomers of the amyloid-beta protein specifically disrupt cognitive function. Nat Neurosci. 2005;8:79–84. doi: 10.1038/nn1372. [DOI] [PubMed] [Google Scholar]
- Das U, Scott DA, Ganguly A, Koo EH, Tang Y, Roy S. Activity-induced convergence of app and bace-1 in acidic microdomains via an endocytosis-dependent pathway. Neuron. 2013;79:447–460. doi: 10.1016/j.neuron.2013.05.035. [DOI] [PMC free article] [PubMed] [Google Scholar]
- De Felice FG, Velasco PT, Lambert MP, Viola K, Fernandez SJ, Ferreira ST, Klein WL. Abeta oligomers induce neuronal oxidative stress through an N-methyl-D-aspartate receptor-dependent mechanism that is blocked by the Alzheimer drug memantine. J Biol Chem. 2007;282:11590–11601. doi: 10.1074/jbc.M607483200. [DOI] [PubMed] [Google Scholar]
- DeKosky ST, Scheff SW. Synapse loss in frontal cortex biopsies in Alzheimer's disease: correlation with cognitive severity. Ann Neurol. 1990;27:457–464. doi: 10.1002/ana.410270502. [DOI] [PubMed] [Google Scholar]
- Demuro A, Mina E, Kayed R, Milton SC, Parker I, Glabe CG. Calcium dysregulation and membrane disruption as a ubiquitous neurotoxic mechanism of soluble amyloid oligomers. J Biol Chem. 2005;280:17294–17300. doi: 10.1074/jbc.M500997200. [DOI] [PubMed] [Google Scholar]
- Fatt P, Katz B. Spontaneous subthreshold activity at motor nerve endings. J Physiol. 1952;117:109–128. [PMC free article] [PubMed] [Google Scholar]
- Freir DB, Holscher C, Herron CE. Blockade of long-term potentiation by beta-amyloid peptides in the CA1 region of the rat hippocampus in vivo. J Neurophysiol. 2001;85:708–713. doi: 10.1152/jn.2001.85.2.708. [DOI] [PubMed] [Google Scholar]
- Gong Y, Chang L, Viola KL, Lacor PN, Lambert MP, Finch CE, Krafft GA, Klein WL. Alzheimer's disease-affected brain: presence of oligomeric A-beta ligands (ADDLs) suggests a molecular basis for reversible memory loss. Proc Natl Acad Sci U S A. 2003;100:10417–10422. doi: 10.1073/pnas.1834302100. [DOI] [PMC free article] [PubMed] [Google Scholar]
- Greenberg SM, Koo EH, Selkoe DJ, Qiu WQ, Kosik KS. Secreted beta-amyloid precursor protein stimulates mitogen-activated protein kinase and enhances tau phosphorylation. Proc Natl Acad Sci U S A. 1994;91:7104–7108. doi: 10.1073/pnas.91.15.7104. [DOI] [PMC free article] [PubMed] [Google Scholar]
- Hansen KB, Ogden KK, Yuan H, Traynelis SF. Distinct functional and pharmacological properties of triheteromeric GluN1/GluN2A/GluN2B NMDA receptors. Neuron. 2014;81:1084–1096. doi: 10.1016/j.neuron.2014.01.035. [DOI] [PMC free article] [PubMed] [Google Scholar]
- Hsieh H, Boehm J, Sato C, Iwatsubo T, Tomita T, Sisodia S, Malinow R. AMPAR removal underlies Abeta-induced synaptic depression and dendritic spine loss. Neuron. 2006;52:831–843. doi: 10.1016/j.neuron.2006.10.035. [DOI] [PMC free article] [PubMed] [Google Scholar]
- Huang JK, Ma PL, Ji SY, Zhao XL, Tan JX, Sun XJ, Huang FD. Age-dependent alterations in the presynaptic active zone in a Drosophila model of Alzheimer's disease. Neurobiol Dis. 2013;51:161–167. doi: 10.1016/j.nbd.2012.11.006. [DOI] [PubMed] [Google Scholar]
- Hu NW, Klyubin I, Anwyl R, Anwy R, Rowan MJ. GluN2B subunit-containing NMDA receptor antagonists prevent Abeta-mediated synaptic plasticity disruption in vivo. Proc Natl Acad Sci U S A. 2009;106:20504–20509. doi: 10.1073/pnas.0908083106. [DOI] [PMC free article] [PubMed] [Google Scholar]
- Jo J, Whitcomb DJ, Olsen KM, Kerrigan TL, Lo SC, Bru-Mercier G, Dickinson B, Scullion S, Sheng M, Collingridge G, Cho K. Aβ(1–42) inhibition of LTP is mediated by a signaling pathway involving caspase-3, Akt1 and GSK-3β. Nat Neurosci. 2011;14:545–547. doi: 10.1038/nn.2785. [DOI] [PubMed] [Google Scholar]
- Kamenetz F, Tomita T, Hsieh H, Seabrook G, Borchelt D, Iwatsubo T, Sisodia S, Malinow R. APP processing and synaptic function. Neuron. 2003;37:925–937. doi: 10.1016/S0896-6273(03)00124-7. [DOI] [PubMed] [Google Scholar]
- Kessels HW, Nguyen LN, Nabavi S, Malinow R. The prion protein as a receptor for amyloid-β. Nature. 2010;466:E3–E4. doi: 10.1038/nature09217. discussion E4–E5. [DOI] [PMC free article] [PubMed] [Google Scholar]
- Kessels HW, Nabavi S, Malinow R. Metabotropic NMDA receptor function is required for β-amyloid-induced synaptic depression. Proc Natl Acad Sci U S A. 2013;110:4033–4038. doi: 10.1073/pnas.1219605110. [DOI] [PMC free article] [PubMed] [Google Scholar]
- Kim T, Vidal GS, Djurisic M, William CM, Birnbaum ME, Garcia KC, Hyman BT, Shatz CJ. Human LilrB2 is a β-amyloid receptor and its murine homolog PirB regulates synaptic plasticity in an Alzheimer's model. Science. 2013;341:1399–1404. doi: 10.1126/science.1242077. [DOI] [PMC free article] [PubMed] [Google Scholar]
- Klein WL. Abeta toxicity in Alzheimer's disease: globular oligomers (ADDLs) as new vaccine and drug targets. Neurochem Int. 2002;41:345–352. doi: 10.1016/S0197-0186(02)00050-5. [DOI] [PubMed] [Google Scholar]
- Kurup P, Zhang Y, Xu J, Venkitaramani DV, Haroutunian V, Greengard P, Nairn AC, Lombroso PJ. Aβ-mediated NMDA receptor endocytosis in Alzheimer's disease involves ubiquitination of the tyrosine phosphatase STEP61. J Neurosci. 2010;30:5948–5957. doi: 10.1523/JNEUROSCI.0157-10.2010. [DOI] [PMC free article] [PubMed] [Google Scholar]
- Lacor PN, Buniel MC, Chang L, Fernandez SJ, Gong Y, Viola KL, Lambert MP, Velasco PT, Bigio EH, Finch CE, Krafft GA, Klein WL. Synaptic targeting by Alzheimer's-related amyloid beta oligomers. J Neurosci. 2004;24:10191–10200. doi: 10.1523/JNEUROSCI.3432-04.2004. [DOI] [PMC free article] [PubMed] [Google Scholar]
- Lacor PN, Buniel MC, Furlow PW, Clemente AS, Velasco PT, Wood M, Viola KL, Klein WL. Abeta oligomer-induced aberrations in synapse composition, shape, and density provide a molecular basis for loss of connectivity in Alzheimer's disease. J Neurosci. 2007;27:796–807. doi: 10.1523/JNEUROSCI.3501-06.2007. [DOI] [PMC free article] [PubMed] [Google Scholar]
- Lambert MP, Barlow AK, Chromy BA, Edwards C, Freed R, Liosatos M, Morgan TE, Rozovsky I, Trommer B, Viola KL, Wals P, Zhang C, Finch CE, Krafft GA, Klein WL. Diffusible, nonfibrillar ligands derived from Aβ1–42 are potent central nervous system neurotoxins. Proc Natl Acad Sci U S A. 1998;95:6448–6453. doi: 10.1073/pnas.95.11.6448. [DOI] [PMC free article] [PubMed] [Google Scholar]
- Laurén J, Gimbel DA, Nygaard HB, Gilbert JW, Strittmatter SM. Cellular prion protein mediates impairment of synaptic plasticity by amyloid-beta oligomers. Nature. 2009;457:1128–1132. doi: 10.1038/nature07761. [DOI] [PMC free article] [PubMed] [Google Scholar]
- Lee MC, Yasuda R, Ehlers MD. Metaplasticity at single glutamatergic synapses. Neuron. 2010;66:859–870. doi: 10.1016/j.neuron.2010.05.015. [DOI] [PMC free article] [PubMed] [Google Scholar]
- Li S, Hong S, Shepardson NE, Walsh DM, Shankar GM, Selkoe D. Soluble oligomers of amyloid Beta protein facilitate hippocampal long-term depression by disrupting neuronal glutamate uptake. Neuron. 2009;62:788–801. doi: 10.1016/j.neuron.2009.05.012. [DOI] [PMC free article] [PubMed] [Google Scholar]
- Mammen AL, Huganir RL, O'Brien RJ. Redistribution and stabilization of cell surface glutamate receptors during synapse formation. J Neurosci. 1997;17:7351–7358. doi: 10.1523/JNEUROSCI.17-19-07351.1997. [DOI] [PMC free article] [PubMed] [Google Scholar]
- Matsuzaki M, Ellis-Davies GC, Nemoto T, Miyashita Y, Iino M, Kasai H. Dendritic spine geometry is critical for AMPA receptor expression in hippocampal CA1 pyramidal neurons. Nat Neurosci. 2001;4:1086–1092. doi: 10.1038/nn736. [DOI] [PMC free article] [PubMed] [Google Scholar]
- Miller EC, Teravskis PJ, Dummer BW, Zhao X, Huganir RL, Liao D. Tau phosphorylation and tau mislocalization mediate soluble Aβ oligomer-induced AMPA glutamate receptor signaling deficits. Eur J Neurosci. 2014;39:1214–1224. doi: 10.1111/ejn.12507. [DOI] [PMC free article] [PubMed] [Google Scholar]
- Murphy JA, Stein IS, Lau CG, Peixoto RT, Aman TK, Kaneko N, Aromolaran K, Saulnier JL, Popescu GK, Sabatini BL, Hell JW, Zukin RS. Phosphorylation of Ser1166 on GluN2B by PKA is critical to synaptic NMDA receptor function and Ca2+ signaling in spines. J Neurosci. 2014;34:869–879. doi: 10.1523/JNEUROSCI.4538-13.2014. [DOI] [PMC free article] [PubMed] [Google Scholar]
- Murthy VN, Sejnowski TJ, Stevens CF. Dynamics of dendritic calcium transients evoked by quantal release at excitatory hippocampal synapses. Proc Natl Acad Sci U S A. 2000;97:901–906. doi: 10.1073/pnas.97.2.901. [DOI] [PMC free article] [PubMed] [Google Scholar]
- Reese AL, Kavalali ET. Spontaneous neurotransmission signals through store-driven Ca(2+) transients to maintain synaptic homeostasis. Elife. 2015:4. doi: 10.7554/eLife.09262. [DOI] [PMC free article] [PubMed] [Google Scholar]
- Renner M, Lacor PN, Velasco PT, Xu J, Contractor A, Klein WL, Triller A. Deleterious effects of amyloid beta oligomers acting as an extracellular scaffold for mGluR5. Neuron. 2010;66:739–754. doi: 10.1016/j.neuron.2010.04.029. [DOI] [PMC free article] [PubMed] [Google Scholar]
- Rönicke R, Mikhaylova M, Rönicke S, Meinhardt J, Schröder UH, Fändrich M, Reiser G, Kreutz MR, Reymann KG. Early neuronal dysfunction by amyloid β oligomers depends on activation of NR2B-containing NMDA receptors. Neurobiol Aging. 2011;32:2219–2228. doi: 10.1016/j.neurobiolaging.2010.01.011. [DOI] [PubMed] [Google Scholar]
- Sanz-Clemente A, Matta JA, Isaac JT, Roche KW. Casein kinase 2 regulates the NR2 subunit composition of synaptic NMDA receptors. Neuron. 2010;67:984–996. doi: 10.1016/j.neuron.2010.08.011. [DOI] [PMC free article] [PubMed] [Google Scholar]
- Schneggenburger R, Zhou Z, Konnerth A, Neher E. Fractional contribution of calcium to the cation current through glutamate receptor channels. Neuron. 1993;11:133–143. doi: 10.1016/0896-6273(93)90277-X. [DOI] [PubMed] [Google Scholar]
- Shankar GM, Bloodgood BL, Townsend M, Walsh DM, Selkoe DJ, Sabatini BL. Natural oligomers of the Alzheimer amyloid-beta protein induce reversible synapse loss by modulating an NMDA-type glutamate receptor-dependent signaling pathway. J Neurosci. 2007;27:2866–2875. doi: 10.1523/JNEUROSCI.4970-06.2007. [DOI] [PMC free article] [PubMed] [Google Scholar]
- Shankar GM, Li S, Mehta TH, Garcia-Munoz A, Shepardson NE, Smith I, Brett FM, Farrell MA, Rowan MJ, Lemere CA, Regan CM, Walsh DM, Sabatini BL, Selkoe DJ. Amyloid-beta protein dimers isolated directly from Alzheimer's brains impair synaptic plasticity and memory. Nat Med. 2008;14:837–842. doi: 10.1038/nm1782. [DOI] [PMC free article] [PubMed] [Google Scholar]
- Skeberdis VA, Chevaleyre V, Lau CG, Goldberg JH, Pettit DL, Suadicani SO, Lin Y, Bennett MV, Yuste R, Castillo PE, Zukin RS. Protein kinase A regulates calcium permeability of NMDA receptors. Nat Neurosci. 2006;9:501–510. doi: 10.1038/nn1664. [DOI] [PubMed] [Google Scholar]
- Snyder EM, Nong Y, Almeida CG, Paul S, Moran T, Choi EY, Nairn AC, Salter MW, Lombroso PJ, Gouras GK, Greengard P. Regulation of NMDA receptor trafficking by amyloid-beta. Nat Neurosci. 2005;8:1051–1058. doi: 10.1038/nn1503. [DOI] [PubMed] [Google Scholar]
- Sobczyk A, Svoboda K. Activity-dependent plasticity of the NMDA-receptor fractional Ca2+ current. Neuron. 2007;53:17–24. doi: 10.1016/j.neuron.2006.11.016. [DOI] [PubMed] [Google Scholar]
- Tamburri A, Dudilot A, Licea S, Bourgeois C, Boehm J. NMDA-receptor activation but not ion flux is required for amyloid-beta induced synaptic depression. PLoS One. 2013;8:e65350. doi: 10.1371/journal.pone.0065350. [DOI] [PMC free article] [PubMed] [Google Scholar]
- Terry RD, Masliah E, Salmon DP, Butters N, DeTeresa R, Hill R, Hansen LA, Katzman R. Physical basis of cognitive alterations in Alzheimer's disease: Synapse loss is the major correlate of cognitive impairment. Ann Neurol. 1991;30:572–580. doi: 10.1002/ana.410300410. [DOI] [PubMed] [Google Scholar]
- Tovar KR, McGinley MJ, Westbrook GL. Triheteromeric NMDA receptors at hippocampal synapses. J Neurosci. 2013;33:9150–9160. doi: 10.1523/JNEUROSCI.0829-13.2013. [DOI] [PMC free article] [PubMed] [Google Scholar]
- Tu W, Xu X, Peng L, Zhong X, Zhang W, Soundarapandian MM, Balel C, Wang M, Jia N, Zhang W, Lew F, Chan SL, Chen Y, Lu Y. DAPK1 interaction with NMDA receptor NR2B subunits mediates brain damage in stroke. Cell. 2010;140:222–234. doi: 10.1016/j.cell.2009.12.055. [DOI] [PMC free article] [PubMed] [Google Scholar]
- Walsh DM, Klyubin I, Fadeeva JV, Cullen WK, Anwyl R, Wolfe MS, Rowan MJ, Selkoe DJ. Naturally secreted oligomers of amyloid beta protein potently inhibit hippocampal long-term potentiation in vivo. Nature. 2002;416:535–539. doi: 10.1038/416535a. [DOI] [PubMed] [Google Scholar]
- Wang HY, Lee DH, Davis CB, Shank RP. Amyloid peptide Abeta(1–42) binds selectively and with picomolar affinity to alpha7 nicotinic acetylcholine receptors. J Neurochem. 2000;75:1155–1161. doi: 10.1046/j.1471-4159.2000.0751155.x. [DOI] [PubMed] [Google Scholar]
- Wang X, McManus M. Lentivirus production. J Vis Exp. 2009;32:1499. doi: 10.3791/1499. pii. [DOI] [PMC free article] [PubMed] [Google Scholar]
- Wei W, Nguyen LN, Kessels HW, Hagiwara H, Sisodia S, Malinow R. Amyloid beta from axons and dendrites reduces local spine number and plasticity. Nat Neurosci. 2010;13:190–196. doi: 10.1038/nn.2476. [DOI] [PMC free article] [PubMed] [Google Scholar]
- Yang Y, Kim J, Kim HY, Ryoo N, Lee S, Kim Y, Rhim H, Shin YK. Amyloid-β oligomers may impair SNARE-mediated exocytosis by direct binding to syntaxin 1a. Cell Rep. 2015;12:1244–1251. doi: 10.1016/j.celrep.2015.07.044. [DOI] [PMC free article] [PubMed] [Google Scholar]
Associated Data
This section collects any data citations, data availability statements, or supplementary materials included in this article.
Supplementary Materials
Aβo reduces QCT frequency and amplitude. Shown is a representative dendritic arbor illustrating QCTs before and 45 min after application of 500 nm Aβo. Scale bar, 5 μm. Time stamp is in seconds.
Aβo affects QCTs heterogeneously. Four representative spines are shown before and 45 min after application of 500 nm Aβo. Scale bar, 0.5 μm. Time stamp is in seconds.