

Abstract
Background
Low back pain is a highly prevalent health problem around the world, affecting 50% to 85% of people at some point in life. The purpose of this systematic review is to summarize the previous proton magnetic resonance spectroscopy studies on brain chemical changes in patients with chronic low back pain (CLBP).
Methods
We identified relevant studies from a literature search of PubMed and EMBASE from 1980 to March 2016. Data extraction was performed on the subjects' characteristics, MRS methods, spectral analyses, cerebral metabolites and perceptual measurements.
Results
The review identified 9 studies that met the inclusion criteria, comprised of data on 135 CLBP subjects and 137 healthy controls. Seven of these studies reported statistically different neurochemical alterations in patients with CLBP. The results showed that compared to controls, CLBP patients showed reductions of 1) N-acetyl-aspartate (NAA) in the dorsolateral prefrontal cortex (DLPFC), right primary motor cortex, left somatosensory cortex (SSC), left anterior insula and anterior cingulate cortex (ACC); 2) glutamate in the ACC; 3) myo-inositol in the ACC and thalamus; 4) choline in the right SSC; and 5) glucose in the DLPFC.
Conclusion
This review provides evidence for alterations in the biochemical profile of the brain in patients with CLBP, which suggests that biochemical changes may play a significant role in the development and pathophysiology of CLBP and shed light on the development of new treatments for CLBP.
Keywords: Low back pain, Magnetic resonance imaging, Proton magnetic resonance spectroscopy, Brain chemistry, Systematic review
Highlights
-
•
Neurochemical changes in patients with chronic low back pain were detected by MRS.
-
•
Biochemical alterations may correlate with pathophysiology of CLBP.
-
•
Decrease of N-acetyl-aspartate was main metabolic changes in patients with CLBP.
-
•
Future studies need to emphasize therapeutic response in patients with CLBP.
1. Introduction
Low back pain (LBP) is a highly prevalent health problem around the world (Kamper et al., 2015), affecting 50% to 85% of people at some point in life (Becker et al., 2010). According to the Global Burden of Disease Study in 2013, LBP ranked first in the top ten causes of years lived with disability (YLDs) (Vos et al., 2015). When LBP persists for > 6 months (Koes et al., 2006, Van Tulder et al., 2003), it is classified as chronic low back pain (CLBP), which leads to considerable health care costs (Dagenais et al., 2008). Since the precise causes and origins of CLBP are unknown to 90% of patients (Koes et al., 2006), therapeutic methods targeting LBP symptoms are often nonspecific and ineffective.
Recently, neuroimaging techniques have been used to advance our understanding of back pain mechanisms (Giesecke et al., 2004, Kobayashi et al., 2009, Lloyd et al., 2008). In vivo magnetic resonance spectroscopy (MRS) is a non-invasive brain imaging method that can explore metabolic concentrations within certain brain regions. MRS detects radiofrequency signals generated by the magnetic nuclear spins of magnetically active nuclei such as protons, phosphorus, carbon and fluorine, which are excited by external magnetic fields (Glunde and Bhujwalla, 2011, Glunde et al., 2011). Compared with other nuclei, proton nuclei (1H) are widely used in MRS studies because of their high magnetic sensitivity and natural abundance in tissues (Bulik et al., 2013, Soares and Law, 2009). Another benefit of in vivo 1H MRS is that it can be conducted in clinical MRI scanners without any additional hardware (Malet-Martino and Holzgrabe, 2011).
Unlike traditional functional MRI, which obtains a spatial map of brain activity, 1H MRS voxel placement generates a graphical spectrum of specific regions of the brain (Harris and Clauw, 2012). The peaks on the spectra represent various cerebral metabolites, including N-acetyl-aspartate (NAA), choline (Cho), creatine (Cr), myo-inositol (mI), glutamate (Glu), glutamine (Gln), gamma-aminobutyric acid (GABA) and glucose (Glc). Concentration changes of these metabolites are associated with numerous neurological diseases (Aguila et al., 2015, Bustillo et al., 2010, Vrenken et al., 2005), and can sometimes be detected prior to the onset of symptoms (Godbolt et al., 2006).
Over the past two decades, a growing number of proton magnetic resonance spectroscopy (1H MRS) studies have been applied to investigate biochemical changes in individuals with CLBP. Although results from these studies have shown that CLBP patients exhibit altered 1H MRS signal changes in different brain regions, some of the results obtained appear contradictory. Therefore, we performed this systematic review of previous 1H MRS studies on CLBP to summarize the biochemical changes in brain regions of interest and to explore potential reasons for those inconsistent findings.
2. Material and methods
We conducted a systematic search of published studies in PubMed and EMBASE from 1980 to March 2016. The Medical Subject Headings were “magnetic resonance spectroscopy” and “back pain”. The search strategy also included key words such as “magnetic resonance spectroscopy”, “MRS”, “spectroscopy” and “back pain” to identify relevant studies. No language restrictions were applied. The reference lists of the selected articles were also reviewed to search for additional relevant studies. The protocol for this review was registered on PROSPERO (http://www.crd.york.ac.uk/PROSPERO; CRD42016045845).
Titles and abstracts of potentially relevant studies were examined to determine whether they fulfilled the following inclusion criteria: (1) Studies compared LBP patients with healthy controls, and (2) studies employed 1H MRS to measure metabolite concentrations in the brain. We excluded studies that (1) did not present original data, and (2) did not recruit LBP patients. After reviewing the full texts, one study was excluded because half of the patients in the study did not present with low back pain symptoms.
Data extraction was performed for subject and control numbers, gender, age, diagnostic tools, duration of LBP symptoms, comorbidities with LBP, medications, clinical measurements, metabolites studied, brain regions of interest, voxels of interest, MR scanner devices, magnetic field strengths, MRS sequences, repetition times, echo times, spectral analysis software, metabolite quantification methods (absolute quantification or ratios to Cr), and data inclusion criteria.
3. Results
Our literature search yielded 271 potentially relevant studies on patients with CLBP and healthy controls. 262 studies were excluded for reasons listed in Fig. 1. Table 1, Table 2 and Fig. 2 summarize the characteristics of the 9 included studies.
Fig. 1.
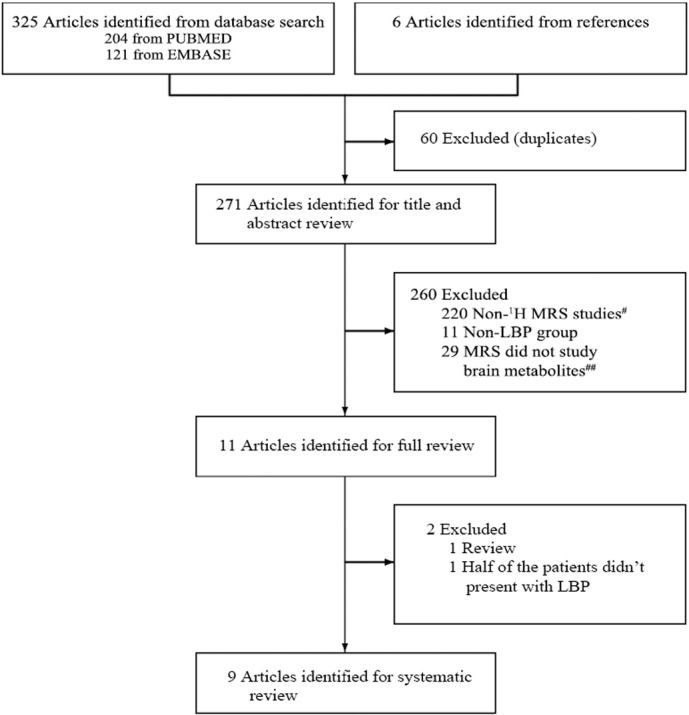
Flow diagram of search strategy.
#220 publications were excluded because they were near-infrared spectroscopy, atomic spectroscopy, 31P MRS studies and so on.
##These 29 studies mainly focused on concentrations of metabolites in the spinal cord, paraspinal muscles and intervertebral discs of LBP patients.
Table 1.
Patient characteristics.
| Study | Patients (M) | Age mean ± SD | Duration of illness (yrs) | Comorbidity (N) | Stop medication | VAS score | Other clinical measurement |
|---|---|---|---|---|---|---|---|
| Grachev et al. (2000) | 9 (7) | 45 ± 6 | 9 ± 5 | NM | ≥ 24 h | 61.81 ± 17.18 (of 100) | SF-MPQ, STAI |
| Grachev et al. (2002) | 12 (9) | 47.5 ± 5.6 | 8.86 ± 4.4 | Anxiety | ≥ 24 h | 61.81 ± 17.18 (of 100) | SF-MPQ, STAI |
| Grachev et al. (2003) | 10 (5) | 49 ± 11 | 12.6 ± 6 | Depression | ≥ 24 h | 64.6 ± 14.4 (of 100) | BDI, SF-MPQ |
| Gussew et al. (2011) | 10 (2) | 22–52 | 1–5 | NM | ≥ 24 h | 4.1 ± 1.1 | LSSI |
| Gussew et al. (2015) | 13 (1) | 54 ± 8 | NM | NM | NM | NM | NM |
| Janetzki et al. (2016) | 19 (3) | 55.3 | 13.3 ± 12.1 | NM | NM | 6.3 ± 1.3 | HADS-D, HADS-A |
| Sharma et al. (2011) | 11 (0) | 33.6 ± 10.6 | 10.6 ± 8.3 | Radiating leg pain (7) | NM | 5.9 ± 1.4 | PE, SF-MPQ, FABQ, MODS, BDI |
| Sharma et al. (2012) | 19 (4) | 46.1 ± 11.3 | 8.8 ± 7.2 | Radiating pain in buttocks (9) and/or left leg (4) | NM | 4.5 ± 1.9 | SF-MPQ, FABQ, MODS, BDI |
| Siddall et al. (2006) | 32 (NM) | NM | ≥ 0.5 | NM | No | NM | SF-MPQ, DASS, RMDQ, PSEQ, LSSI |
Abbreviation: BDI, Beck Depression Inventory; DASS, Depression Anxiety Stress Scales; FABQ, Fear-Avoidance Belief Questionnaire; HADS-A, Hospital Anxiety and Depression Scale - Anxiety subscale; HADS-D, Hospital Anxiety and Depression Scale - Depression subscale; LSSI, lumbosacral spine imaging; M, male; MODS, Modified Oswestry Disability Scale; N, number; NM, not mentioned; PE, Physical examination; PSEQ, Pain Self-Efficacy Questionnaire; RMDQ, Roland & Morris Disability Questionnaire; SF-MPQ, Short Form McGill Pain Questionnaire; STAI, State–Trait Anxiety Inventory; VAS, visual analog scale.
Table 2.
Summary of methods and results.
| Study | Metabolites | ROI | VOI | Field strength | MRS sequence | TR (ms) | TE (ms) | Results |
|---|---|---|---|---|---|---|---|---|
| Grachev et al. (2000) | NAA, Cho, GABA, Glu, Gln, Glc, Lac | DLPFC, Th, cingulate, Ins, SMC, OFC, VC | SVS | 1.5 T | STEAM | 500 | 12 | NAA and Glc ↓ in DLPFC |
| Grachev et al. (2002) | NAA, Cho, GABA, Glu, Gln, Glc, mI, Lac | DLPFC, OFC, Th, cingulate | SVS | 1.5 T | STEAM | 1500 | 30 | NAA ↑ in OFC between high anxiety groups |
| Grachev et al. (2003) | NAA | DLPFC, ACC, OFC, Th | SVS | 1.5 T | STEAM | 1500 | 30 | NAA ↓ in the right DLPFC of CLBP patients with depression |
| Gussew et al. (2011) | NAA, Cr, Cho, mI, Glu, Gln | aI (L), ACC, Th (L) | SVS | 3 T | PRESS | 2500 | 30 | 1. Glu ↓↓ in the ACC 2. NAA ↓ in left aI and ACC 3. mI ↓ in ACC and left Th |
| Gussew et al. (2015) | Glx, GABA | ACC, Ins (L), PC | SVS | 3 T | PRESS/MEGA-PRESS | 1800/1800 | 30/68 | NSSD |
| Janetzki et al. (2016) | Glu, GABA | ACC, Ins | SVS | 3 T | PRESS/MEGA-PRESS | 1800/2000 | 30/68 | NSSD |
| Sharma et al. (2011) | NAA, Cho, mI, Glx | SSC | MVS | 3 T | PRESS | 1500 | 30 | 1. NAA ↓↓ in the left SSC 2. Cho ↓ in right SSC |
| Sharma et al. (2012) | NAA, mI | M1 | MVS | 3 T | PRESS | 1500 | 30 | NAA ↓ in right M1 |
| Siddall et al. (2006) | Cho, Cr, Glx, mI, NAA | ACC (L), PFC (L), Th (L) | SVS | 1.5 T | STEAM | 1500 | 25 | MRS detected neurochemical changes with high accuracy. |
Abbreviation: ACC, anterior cingulate cortex; aI, anterior insula; Cho, choline; Cr, creatine; DLPFC, dorsolateral prefrontal cortex; GABA, gamma-aminobutyric acid; Glc, glucose; Gln, glutamine; Glu, glutamate; Glx, glutamate and glutamine; Ins, insula; Lac, lactate; MEGA-PRESS, MEscher-GArwood Point RESolved Spectroscopy; mI, myo-inositol; MVS, multiple single voxel spectroscopy; NAA, N-acetyl-aspartate; NSSD, non-statistically significant difference; OFC, orbital frontal cortex; PC, posterior cortex; PFC, prefrontal cortex; PRESS, point resolved spectroscopy; ROI, region of interest; SMC, sensorimotor cortex; SSC, somatosensory cortex; STEAM, stimulated echo acquisition mode; SVS, single voxel spectroscopy; TE, echo time; Th, thalamus; TR, repetition time; VC, visual cortex.
Fig. 2.

Biochemical changes in brain regions of CLBP patients.
3.1. Subjects
The 9 studies recruited a total of 135 CLBP subjects and 137 healthy controls. All of the studies except for one study (Siddall et al., 2006) reported subject numbers by sex, which showed that the majority of subjects were females. For diagnosis of CLBP, three of the included studies adopted the diagnostic criteria of Merskey and Bogduk (Grachev et al., 2000, Grachev et al., 2002, Grachev et al., 2003), and two studies utilized classification from the International Association for the Study of Pain (Grachev et al., 2002, Siddall et al., 2006). All of the patients presented with LBP for > 6 months. Four out of nine studies mentioned the comorbidities of CLBP; one study was associated with anxiety (Grachev et al., 2002), another focused on depression (Grachev et al., 2003), one study reported seven patients with radiating leg pain, and another study (Sharma et al., 2012) reported subjects with radiating pain in the buttocks and left leg. About 30% of all patients refrained from medication for at least 24 h before the study.
3.2. MRS method
Two studies collected data using multi-voxel MR spectroscopy imaging (Sharma et al., 2012, Sharma et al., 2011), whereas seven used single voxel spectroscopy (SVS) locations to analyze individual data (Grachev et al., 2000, Grachev et al., 2002, Grachev et al., 2003, Gussew et al., 2015, Gussew et al., 2011, Janetzki et al., 2016, Siddall et al., 2006). Five studies were performed using a 3.0 T MRI scanner (Gussew et al., 2015, Gussew et al., 2011, Janetzki et al., 2016, Sharma et al., 2012, Sharma et al., 2011), and four studies utilized a 1.5 T scanner (Grachev et al., 2000, Grachev et al., 2002, Grachev et al., 2003, Siddall et al., 2006). Four studies used stimulated echo acquisition mode sequences (STEAM) (Grachev et al., 2000, Grachev et al., 2002, Grachev et al., 2003, Siddall et al., 2006), five studies used point resolved spectroscopy sequences (PRESS) (Gussew et al., 2015, Gussew et al., 2011, Janetzki et al., 2016, Sharma et al., 2012, Sharma et al., 2011) and two also used MEscher-GArwood Point RESolved Spectroscopy (MEGA-PRESS) (Gussew et al., 2015, Janetzki et al., 2016). Repetition times ranged from 500 to 2500 ms. Echo times ranged from 12 to 68 ms.
3.3. Spectral analysis
Metabolite concentrations were calculated using LCModel in four studies (Gussew et al., 2015, Gussew et al., 2011, Sharma et al., 2012, Sharma et al., 2011), jMRUI package in one study (Gussew et al., 2015), and Scion Image analysis package in three studies (Grachev et al., 2000, Grachev et al., 2002, Grachev et al., 2003). Statistical Classification Strategy was specified in one study (Siddall et al., 2006). Data inclusion criteria of two of the studies were (1) total brain volume > 75%, (2) a SNR > 10, and (3) Cramer-Rao bounds for each neurochemical < 20% (Sharma et al., 2012, Sharma et al., 2011). In one study, statistical analysis was only conducted for data that exhibited (1) FWHMNAA < 10 Hz, and (2) CRLBGln < 30% for Gln and Glx concentrations (Gussew et al., 2011).
3.4. Cerebral metabolites
Cerebral metabolites were reported as a ratio to Cr in five studies (Grachev et al., 2000, Grachev et al., 2002, Grachev et al., 2003, Gussew et al., 2015, Janetzki et al., 2016) and absolute concentrations in three studies (Gussew et al., 2011, Sharma et al., 2012, Sharma et al., 2011). Three studies determined the absolute concentrations; two studies utilized LCModel to calculate the metabolite concentrations and corrected the LCModel output for the estimated brain tissue fraction (Sharma et al., 2012, Sharma et al., 2011), while the other study used the water signal reference method that multiplied the ratio of metabolic intensities to water signal intensities (assessed by LCModel) with the water concentration in brain tissue and corrected for factors such as relaxation (Gussew et al., 2011).
3.4.1. NAA
Studies reported reductions of NAA in five brain regions, including the dorsolateral prefrontal cortex (DLPFC), right primary motor cortex (M1), left somatosensory cortex (SSC), left anterior insula (aI) and anterior cingulate cortex (ACC) (Grachev et al., 2000, Gussew et al., 2011, Sharma et al., 2012, Sharma et al., 2011). There were no significant differences in concentrations between patients and controls in the left M1, right SSC, thalamus, cingulate, insula, sensorimotor cortex (SMC), orbital frontal cortex (OFC), and visual cortex (VC) (Grachev et al., 2000, Sharma et al., 2012, Sharma et al., 2011).
3.4.2. Glu, Gln, Glx and GABA
One study observed a significant decrease in Glu in patients' ACC (Gussew et al., 2011). There were no significant changes of Glu/GABA ratios in the ACC and insula (Janetzki et al., 2016). In the SSC, Glx concentrations were not significantly changed (Sharma et al., 2011). Additionally, patients did not show any comparable Glx and GABA interrelations in the ACC, left insula, and posterior cortex (Gussew et al., 2015).
3.4.3. mI
Four studies investigated alterations of mI; it was reduced in the ACC and thalamus (Gussew et al., 2011), whereas in the DLPFC, OFC, cingulate and M1, concentrations of mI were not significantly different between CLBP and control groups (Grachev et al., 2002, Sharma et al., 2012). In one study targeted at the SSC, the authors found significant correlations between mI in the left and right SSC of CLBP patients when compared to healthy controls (Sharma et al., 2011).
3.4.4. Cho
Three studies investigated Cho changes in CLBP patients; there were no significant changes in the regions of DLPFC, thalamus, cingulate, insula, SMC, OFC, VC, left aI, left thalamus and ACC (Grachev et al., 2000, Gussew et al., 2011). Decreased Cho was observed in the right SSC in CLBP patients as compared to controls in one study (Sharma et al., 2011).
3.4.5. Glc
One study investigated the Glc changes in CLBP patients, and reported reductions of Glc in the DLPFC (Grachev et al., 2000).
3.4.6. Cr
One study investigated the Cr changes in CLBP patients, and reported no significant changes in Cr between groups in the left aI, left thalamus and ACC (Gussew et al., 2011).
Studies demonstrated neurochemical alterations in six brain regions of CLBP patients compared to healthy controls: 1) decreased N-acetyl-aspartate (NAA) and glucose (Glc) in the dorsolateral prefrontal cortex (DLPFC); 2) significantly decreased Glu and reduced NAA and myo-inositol (mI) in the anterior cingulate cortex (ACC); 3) reduced NAA in the left anterior insula (aI); 4) decreased MI in the thalamus (Th); 5) significantly decreased NAA in the left somatosensory cortex (SSC) and decreased choline (Cho) in the right SSC; and 6) decreased NAA in the right primary motor cortex (M1).
3.5. Association between the clinical measurements and the cerebral metabolites
3.5.1. Pain
Several studies utilized the visual analog scale (VAS) to rate patients' pain intensity, and six studies also measured pain using the Short Form McGill Pain Questionnaire (SF-MPQ) (Grachev et al., 2000, Grachev et al., 2002, Grachev et al., 2003, Sharma et al., 2012, Sharma et al., 2011, Siddall et al., 2006). NAA levels in SSC were found to be negatively correlated with pain duration (Sharma et al., 2011). Reductions of NAA in the right DLPFC were negatively associated with pain behavior (as measured by total SF-MPQ scores) (Grachev et al., 2003). In addition, studies also showed that pain intensity was positively correlated with Glu levels in the insula and Glx levels in the right SSC, while pain intensity was negatively correlated with GABA concentrations in the insula (Janetzki et al., 2016, Sharma et al., 2011). No significant correlations were detected between neurochemicals (NAA, mI) and pain characteristics (VAS and SF-MPQ) in the M1 (Sharma et al., 2012).
3.5.2. Anxiety
In addition to CLBP related measurements, two studies used the State–Trait Anxiety Inventory (STAI) to measure anxiety states (Grachev et al., 2000, Grachev et al., 2002). One study found significant increases of NAA in the OFC of high anxiety controls compared to high anxiety CLBP patients, and of low anxiety CLBP patients compared to high anxiety CLBP patients (Grachev et al., 2002). Another study using the Hospital Anxiety and Depression Scale (HADS) reported anxiety as a causal variable for reduced Glu in the ACC (Janetzki et al., 2016).
3.5.3. Depression
Participants in three studies (Grachev et al., 2003, Sharma et al., 2012, Sharma et al., 2011) completed the Beck Depression Inventory (BDI). NAA levels in the right DLPFC were negatively correlated with depressive symptoms as measured by BDI scores (Grachev et al., 2003). One study used the Hospital Anxiety and Depression Scale (HADS) (Janetzki et al., 2016), and found depression and age could predict reduced GABA in the ACC.
4. Discussion
In this study, we reviewed the previous 1H MRS studies on CLBP to summarize the biochemical changes in CLBP patients. Seven of the nine studies reviewed in this paper reported statistical differences in brain metabolites in the thalamus, insula, SSC, ACC, DLPFC and M1 between healthy controls and patients, indicating brain chemical changes in brain regions associated with pain processing (Apkarian et al., 2005, Mouraux et al., 2011, Schmidt-Wilcke, 2015).
Additionally, we found reduction of NAA in five brain regions of CLPB patients, and studies focused specifically on comorbid anxiety and depression (Grachev et al., 2002, Grachev et al., 2003) found exaggerated effects (Wand et al., 2011). NAA is the acetylated form of the amino acid aspartate, and is present in very high concentrations in brain neurons (Stagg and Rothman, 2013). It has been recognized as a neuronal marker (Baslow et al., 2007, Govindaraju et al., 2000), but its function remains controversial. One hypothesis proposed for the role of NAA in the nervous system is that NAA serves as an immediate precursor for the neurotransmitter N-acetylaspartylglutamate, and NAA is reportedly reduced in neurodegenerative diseases (Moffett et al., 2007), which we ascribe to neuronal loss and degeneration. In addition, several studies suggesting that significant brain atrophy exists in the right thalamus (Apkarian et al., 2004), SSC (Schmidt-Wilcke et al.) and DLPFC (Apkarian et al., 2004, Schmidt-Wilcke et al., 2006) of CLBP patients seem to provide fairly compelling evidence to this assumption. However, another documented function of NAA is that it is involved in brain glucose consumption (O'Neill et al., 2000), which is also decreased in the DLPFC of CLBP patients. We thus believe that reduced NAA in low back pain patients may indicate that energy metabolism is altered as well.
We also found a reduction of mI in CLBP patients. MI is primarily present in glial cells (Chang et al., 2013) and has been proposed as a marker for the density of glial cells (Govindaraju et al., 2000). Studies on the biosynthesis of mI reported that it's generated in the phosphoinositide (PI) second messenger system from a key molecule in cellular signal transduction phosphatidylinositol 4,5-bisphosphate (PIP2) (Coupland et al., 2005). Thus, a decrease in mI may suggest a loss of glial cells or an alteration in glial metabolism caused by LBP.
The lower Cho concentration in the SSC of patients with LBP was an unexpected finding because Cho levels are elevated in most neurological diseases, including neoplasms, demyelination and gliosis (Glunde et al., 2006, Inglese et al., 2003). Cho is a precursor of acetylcholine (Ach) (Sarter and Parikh, 2005), which is a component of cell membranes. Therefore, we think the low concentration of Cho in the SSC can be explained by an increased uptake of Cho for the building of cell membranes (Gustafsson et al., 2007) and for maintaining cell membrane integrity.
Results from our study showed evidence of decreased Glu in the ACC of patients with CLBP, which is the most abundant excitatory neurotransmitter in the brain (Yang et al., 2011). In contrast to the results of Gussew and colleagues (Gussew et al., 2011), Grachev and colleagues (Grachev et al., 2000) reported no changes in Glu in the cingulate of CLBP patients. This contradictory finding could be attributed to the methodological differences between the two studies. Gussew and colleagues investigated absolute neurochemical concentrations of Glu while Grachev and colleagues focused on Glu ratios to creatine. In addition, patients in the studies differed in pain intensities and duration of pain symptoms, which may also influence the results.
The Cr ratio method was utilized for spectral quantification in the five studies. The Cr peak is relatively stable, and therefore is commonly used as a concentration reference for comparison. One study indicated no significant differences in Cr resonance in the left aI, left thalamus and ACC. However, this approach should be used with caution because some studies reported alterations of this metabolite in several diseases (Govindaraju et al., 2000). Thus, further investigations on Cr concentration in CLBP patients in different brain regions are needed.
No significant differences were found in excitatory neurotransmitter GABA levels in CLBP patients compared with healthy controls, despite the role of GABA receptors in the modulation of pain perception (Goudet et al., 2009). This lack of significant findings may be due to extremely low concentrations of GABA in the brain and spectral resonance overlaps with peaks of other metabolites, which cannot be resolved unless spectral editing sequences like MEGA-PRESS (Mullins et al., 2014) are utilized.
There are several limitations in our study. First, there are relatively few subjects in each cohort, and confounding factors, such as anxiety and depression, made it difficult to identify specific biochemical markers of CLBP. Secondly, in eight studies, almost half of the patients had received prior treatment for CLBP. Although some of the patients refrained from medications for at least 24 h before the study, it's not clear whether this eliminates the influence caused by long-term medication use. Finally, although these MRS studies have detected neurochemical alterations in these brain regions, the underlying causes of these metabolic changes are not fully understood. Therefore, further investigation is needed to explore the pathophysiological relationship between the neurochemical alterations and CLBP.
5. Conclusion
In summary, our study provides evidence for alterations in the biochemical profile of the brain in patients with CLBP, which suggest that biochemical changes may play a significant role in the manifestation of CLBP. Future studies need to emphasize therapeutic response and the relationships between brain metabolites and functions.
Acknowledgements
Funding: This work was supported by the Construction Funds of Key Subjects of Colleges and Universities in Zhejiang Province [grant number ZJGK2012-80-160] and National Institutes of Health [grant numbers R01AT006364, R01AT008563, R21AT008707, and P01 AT006663].
References
- Aguila M.E., Lagopoulos J., Leaver A.M., Rebbeck T., Hubscher M., Brennan P.C., Refshauge K.M. Elevated levels of GABA + in migraine detected using (1) H-MRS. NMR Biomed. 2015;28:890–897. doi: 10.1002/nbm.3321. [DOI] [PubMed] [Google Scholar]
- Apkarian A.V., Sosa Y., Sonty S., Levy R.M., Harden R.N., Parrish T.B., Gitelman D.R. Chronic back pain is associated with decreased prefrontal and thalamic gray matter density. J. Neurosci. 2004;24:10410–10415. doi: 10.1523/JNEUROSCI.2541-04.2004. [DOI] [PMC free article] [PubMed] [Google Scholar]
- Apkarian A.V., Bushnell M.C., Treede R.D., Zubieta J.K. Human brain mechanisms of pain perception and regulation in health and disease. Eur. J. Pain. 2005;9:463–484. doi: 10.1016/j.ejpain.2004.11.001. [DOI] [PubMed] [Google Scholar]
- Baslow M.H., Hrabe J., Guilfoyle D.N. Dynamic relationship between neurostimulation and N-acetylaspartate metabolism in the human visual cortex. J. Mol. Neurosci. 2007;32:235–245. doi: 10.1007/s12031-007-0049-9. [DOI] [PubMed] [Google Scholar]
- Becker A., Held H., Redaelli M., Strauch K., Chenot J.F., Leonhardt C., Keller S., Baum E., Pfingsten M., Hildebrandt J. Low back pain in primary care: costs of care and prediction of future health care utilization. Spine. 2010;35:1714–1720. doi: 10.1097/brs.0b013e3181cd656f. [DOI] [PubMed] [Google Scholar]
- Bulik M., Jancalek R., Vanicek J., Skoch A., Mechl M. Potential of MR spectroscopy for assessment of glioma grading. Clin. Neurol. Neurosurg. 2013;115:146–153. doi: 10.1016/j.clineuro.2012.11.002. [DOI] [PubMed] [Google Scholar]
- Bustillo J., Rowland L., Mullins P., Jung R., Chen H., Qualls C., Hammond R., Brooks W., Lauriello J. 1H-MRS at 4 tesla in minimally treated early schizophrenia. Mol. Psychiatry. 2010;15:629–636. doi: 10.1038/mp.2009.121. [DOI] [PMC free article] [PubMed] [Google Scholar]
- Chang L., Munsaka S.M., Kraft-Terry S., Ernst T. Magnetic resonance spectroscopy to assess neuroinflammation and neuropathic pain. J. NeuroImmune Pharmacol. 2013;8:576–593. doi: 10.1007/s11481-013-9460-x. [DOI] [PMC free article] [PubMed] [Google Scholar]
- Coupland N.J., Ogilvie C.J., Hegadoren K.M., Seres P., Hanstock C.C., Allen P.S. Decreased prefrontal Myo-inositol in major depressive disorder. Biol. Psychiatry. 2005;57:1526–1534. doi: 10.1016/j.biopsych.2005.02.027. [DOI] [PubMed] [Google Scholar]
- Dagenais S., Caro J., Haldeman S. A systematic review of low back pain cost of illness studies in the United States and internationally. Spine J. 2008;8:8–20. doi: 10.1016/j.spinee.2007.10.005. [DOI] [PubMed] [Google Scholar]
- Giesecke T., Gracely R.H., Grant M.A., Nachemson A., Petzke F., Williams D.A., Clauw D.J. Evidence of augmented central pain processing in idiopathic chronic low back pain. Arthritis Rheum. 2004;50:613–623. doi: 10.1002/art.20063. [DOI] [PubMed] [Google Scholar]
- Glunde K., Bhujwalla Z.M. Metabolic tumor imaging using magnetic resonance spectroscopy. Semin. Oncol. 2011:26–41. doi: 10.1053/j.seminoncol.2010.11.001. (Elsevier) [DOI] [PMC free article] [PubMed] [Google Scholar]
- Glunde K., Jacobs M.A., Bhujwalla Z.M. Choline metabolism in cancer: implications for diagnosis and therapy. Expert. Rev. Mol. Diagn. 2006;6:821–829. doi: 10.1586/14737159.6.6.821. [DOI] [PubMed] [Google Scholar]
- Glunde K., Jiang L., Moestue S.A., Gribbestad I.S. MRS and MRSI guidance in molecular medicine: targeting and monitoring of choline and glucose metabolism in cancer. NMR Biomed. 2011;24:673–690. doi: 10.1002/nbm.1751. [DOI] [PMC free article] [PubMed] [Google Scholar]
- Godbolt A., Waldman A., MacManus D., Schott J., Frost C., Cipolotti L., Fox N., Rossor M. MRS shows abnormalities before symptoms in familial Alzheimer disease. Neurology. 2006;66:718–722. doi: 10.1212/01.wnl.0000201237.05869.df. [DOI] [PubMed] [Google Scholar]
- Goudet C., Magnaghi V., Landry M., Nagy F., Gereau R.W., Pin J.-P. Metabotropic receptors for glutamate and GABA in pain. Brain Res. Rev. 2009;60:43–56. doi: 10.1016/j.brainresrev.2008.12.007. [DOI] [PubMed] [Google Scholar]
- Govindaraju V., Young K., Maudsley A.A. Proton NMR chemical shifts and coupling constants for brain metabolites. NMR Biomed. 2000;13:129–153. doi: 10.1002/1099-1492(200005)13:3<129::aid-nbm619>3.0.co;2-v. [DOI] [PubMed] [Google Scholar]
- Grachev I.D., Fredrickson B.E., Apkarian A.V. Abnormal brain chemistry in chronic back pain: an in vivo proton magnetic resonance spectroscopy study. Pain. 2000;89:7–18. doi: 10.1016/S0304-3959(00)00340-7. [DOI] [PubMed] [Google Scholar]
- Grachev I.D., Fredrickson B.E., Apkarian A.V. Brain chemistry reflects dual states of pain and anxiety in chronic low back pain. J. Neural Transm. (Vienna) 2002;109:1309–1334. doi: 10.1007/s00702-002-0722-7. [DOI] [PubMed] [Google Scholar]
- Grachev I.D., Ramachandran T.S., Thomas P.S., Szeverenyi N.M., Fredrickson B.E. Association between dorsolateral prefrontal N-acetyl aspartate and depression in chronic back pain: an in vivo proton magnetic resonance spectroscopy study. J. Neural Transm. (Vienna) 2003;110:287–312. doi: 10.1007/s00702-002-0781-9. [DOI] [PubMed] [Google Scholar]
- Gussew A., Rzanny R., Gullmar D., Scholle H.C., Reichenbach J.R. 1H-MR spectroscopic detection of metabolic changes in pain processing brain regions in the presence of non-specific chronic low back pain. NeuroImage. 2011;54:1315–1323. doi: 10.1016/j.neuroimage.2010.09.039. [DOI] [PubMed] [Google Scholar]
- Gussew A., Borys C., Janetzki L., Cleve M., Malessa R., Habenicht U., Strauß B., Reichenbach J. P27. Altered regional and interregional interrelations of glutamate and GABA in patients with chronic low back pain – a 1H-MR spectroscopic study. Clin. Neurophysiol. 2015;126:e109–e110. [Google Scholar]
- Gustafsson M., Dahlqvist O., Jaworski J., Lundberg P., Landtblom A.-M. Low choline concentrations in normal-appearing white matter of patients with multiple sclerosis and normal MR imaging brain scans. Am. J. Neuroradiol. 2007;28:1306–1312. doi: 10.3174/ajnr.A0580. [DOI] [PMC free article] [PubMed] [Google Scholar]
- Harris R.E., Clauw D.J. Imaging central neurochemical alterations in chronic pain with proton magnetic resonance spectroscopy. Neurosci. Lett. 2012;520:192–196. doi: 10.1016/j.neulet.2012.03.042. [DOI] [PubMed] [Google Scholar]
- Inglese M., Li B.S., Rusinek H., Babb J.S., Grossman R.I., Gonen O. Diffusely elevated cerebral choline and creatine in relapsing-remitting multiple sclerosis. Magn. Reson. Med. 2003;50:190–195. doi: 10.1002/mrm.10481. [DOI] [PubMed] [Google Scholar]
- Janetzki L., Gussew A., Malessa R., Habenicht U., Reichenbach J.R., Strauss B., Borys C. 2016. Cerebral Metabolic Changes and Chronic back Pain : Study Taking into Consideration Clinical and Psychological Parameters. (Schmerz) [DOI] [PubMed] [Google Scholar]
- Kamper S.J., Apeldoorn A., Chiarotto A., Smeets R., Ostelo R., Guzman J., van Tulder M. Multidisciplinary biopsychosocial rehabilitation for chronic low back pain: Cochrane systematic review and meta-analysis. BMJ. 2015;350:h444. doi: 10.1136/bmj.h444. [DOI] [PMC free article] [PubMed] [Google Scholar]
- Kobayashi Y., Kurata J., Sekiguchi M., Kokubun M., Akaishizawa T., Chiba Y., Konno S.-i., Kikuchi S.-i. Augmented cerebral activation by lumbar mechanical stimulus in chronic low back pain patients: an FMRI study. Spine. 2009;34:2431–2436. doi: 10.1097/BRS.0b013e3181b1fb76. [DOI] [PubMed] [Google Scholar]
- Koes B., Van Tulder M., Thomas S. Diagnosis and treatment of low back pain. Br. Med. J. 2006;332:1430–1434. doi: 10.1136/bmj.332.7555.1430. [DOI] [PMC free article] [PubMed] [Google Scholar]
- Lloyd D., Findlay G., Roberts N., Nurmikko T. Differences in low back pain behavior are reflected in the cerebral response to tactile stimulation of the lower back. Spine. 2008;33:1372–1377. doi: 10.1097/BRS.0b013e3181734a8a. [DOI] [PubMed] [Google Scholar]
- Malet-Martino M., Holzgrabe U. NMR techniques in biomedical and pharmaceutical analysis. J. Pharm. Biomed. Anal. 2011;55:1–15. doi: 10.1016/j.jpba.2010.12.023. [DOI] [PubMed] [Google Scholar]
- Moffett J.R., Ross B., Arun P., Madhavarao C.N., Namboodiri A.M. N-Acetylaspartate in the CNS: from neurodiagnostics to neurobiology. Prog. Neurobiol. 2007;81:89–131. doi: 10.1016/j.pneurobio.2006.12.003. [DOI] [PMC free article] [PubMed] [Google Scholar]
- Mouraux A., Diukova A., Lee M.C., Wise R.G., Iannetti G.D. A multisensory investigation of the functional significance of the “pain matrix”. NeuroImage. 2011;54:2237–2249. doi: 10.1016/j.neuroimage.2010.09.084. [DOI] [PubMed] [Google Scholar]
- Mullins P.G., McGonigle D.J., O'Gorman R.L., Puts N.A., Vidyasagar R., Evans C.J., Edden R.A. Current practice in the use of MEGA-PRESS spectroscopy for the detection of GABA. NeuroImage. 2014;86:43–52. doi: 10.1016/j.neuroimage.2012.12.004. [DOI] [PMC free article] [PubMed] [Google Scholar]
- O'Neill J., Eberling J.L., Schuff N., Jagust W., Reed B.R., Soto G., Ezekiel F., Klein G., Weiner M.W. Method to correlate 1H MRSI and 18 FDG-PET. Magn. Reson. Med. 2000;43:244–250. doi: 10.1002/(sici)1522-2594(200002)43:2<244::aid-mrm11>3.0.co;2-2. [DOI] [PMC free article] [PubMed] [Google Scholar]
- Sarter M., Parikh V. Choline transporters, cholinergic transmission and cognition. Nat. Rev. Neurosci. 2005;6:48–56. doi: 10.1038/nrn1588. [DOI] [PubMed] [Google Scholar]
- Schmidt-Wilcke T. Neuroimaging of chronic pain. Best Pract. Res. Clin. Rheumatol. 2015;29:29–41. doi: 10.1016/j.berh.2015.04.030. [DOI] [PubMed] [Google Scholar]
- Schmidt-Wilcke T., Leinisch E., GÃnssbauer S., Draganski B., Bogdahn U., Altmeppen J., May A. Affective components and intensity of pain correlate with structural differences in gray matter in chronic back pain patients. Pain. 2006;125:89–97. doi: 10.1016/j.pain.2006.05.004. [DOI] [PubMed] [Google Scholar]
- Sharma N.K., McCarson K., Van Dillen L., Lentz A., Khan T., Cirstea C.M. Primary somatosensory cortex in chronic low back pain - a H-MRS study. J. Pain Res. 2011;4:143–150. doi: 10.2147/JPR.S19297. [DOI] [PMC free article] [PubMed] [Google Scholar]
- Sharma N.K., Brooks W.M., Popescu A.E., Vandillen L., George S.Z., McCarson K.E., Gajewski B.J., Gorman P., Cirstea C.M. Neurochemical analysis of primary motor cortex in chronic low back pain. Brain Sci. 2012;2:319–331. doi: 10.3390/brainsci2030319. [DOI] [PMC free article] [PubMed] [Google Scholar]
- Siddall P.J., Stanwell P., Woodhouse A., Somorjai R.L., Dolenko B., Nikulin A., Bourne R., Himmelreich U., Lean C., Cousins M.J., Mountford C.E. Magnetic resonance spectroscopy detects biochemical changes in the brain associated with chronic low back pain: a preliminary report. Anesth. Analg. 2006;102:1164–1168. doi: 10.1213/01.ane.0000198333.22687.a6. [DOI] [PubMed] [Google Scholar]
- Soares D., Law M. Magnetic resonance spectroscopy of the brain: review of metabolites and clinical applications. Clin. Radiol. 2009;64:12–21. doi: 10.1016/j.crad.2008.07.002. [DOI] [PubMed] [Google Scholar]
- Stagg C., Rothman D.L. Academic Press; 2013. Magnetic Resonance Spectroscopy: Tools for Neuroscience Research and Emerging Clinical Applications. [Google Scholar]
- Van Tulder M., Furlan A., Bombardier C., Bouter L., Group, E.B.o.t.C.C.B.R Updated method guidelines for systematic reviews in the Cochrane collaboration back review group. Spine. 2003;28:1290–1299. doi: 10.1097/01.BRS.0000065484.95996.AF. [DOI] [PubMed] [Google Scholar]
- Vos T., Barber R.M., Bell B., Bertozzi-Villa A., Biryukov S., Bolliger I., Charlson F., Davis A., Degenhardt L., Dicker D. Global, regional, and national incidence, prevalence, and years lived with disability for 301 acute and chronic diseases and injuries in 188 countries, 1990–2013: a systematic analysis for the global burden of disease study 2013. Lancet. 2015;386:743–800. doi: 10.1016/S0140-6736(15)60692-4. [DOI] [PMC free article] [PubMed] [Google Scholar]
- Vrenken H., Barkhof F., Uitdehaag B., Castelijns J., Polman C., Pouwels P. MR spectroscopic evidence for glial increase but not for neuro-axonal damage in MS normal-appearing white matter. Magn. Reson. Med. 2005;53:256–266. doi: 10.1002/mrm.20366. [DOI] [PubMed] [Google Scholar]
- Wand B.M., Parkitny L., O'Connell N.E., Luomajoki H., McAuley J.H., Thacker M., Moseley G.L. Cortical changes in chronic low back pain: current state of the art and implications for clinical practice. Man. Ther. 2011;16:15–20. doi: 10.1016/j.math.2010.06.008. [DOI] [PubMed] [Google Scholar]
- Yang J.-L., Sykora P., Wilson D.M., III, Mattson M.P., Bohr V.A. The excitatory neurotransmitter glutamate stimulates DNA repair to increase neuronal resiliency. Mech. Ageing Dev. 2011;132:405–411. doi: 10.1016/j.mad.2011.06.005. [DOI] [PMC free article] [PubMed] [Google Scholar]