

Abstract
Objective
We have previously shown alterations in the composition of the gut microbiota in children with enthesitis-related arthritis (ERA). To explore the mechanisms by which an altered microbiota might predispose to arthritis, we performed metabolomic profiling of fecal samples of children with ERA.
Methods
Fecal samples were collected from two cohorts of children with ERA and healthy control subjects. Nano-liquid chromatography – mass spectroscopy (LC-MS) was performed on the fecal water homogenates with identification based upon mass: charge ratios. Sequencing of the 16S ribosomal DNA (rDNA) on the same stool specimens was performed.
Results
In both sets of subjects, patients demonstrated lower diversity of ions and under-representation of multiple metabolic pathways, including the tryptophan metabolism pathway. For example, in the first cohort, out of 1,500 negatively charged ions, 154 were lower in ERA patients, compared to only one that was higher. Imputed functional annotation of the 16S rDNA sequence data demonstrated significantly fewer microbial genes associated with metabolic processes in the patients compared to the controls (77 million versus 58 million, p = 0.050.)
Conclusions
Diminished metabolic diversity and alterations in the tryptophan metabolism pathway may be a feature of ERA.
Introduction
Interest in the composition of the gut microbiota in subjects with spondyloarthritis (SpA), like enthesitis-related arthritis (ERA)/juvenile idiopathic arthritis (JIA), has been accumulating (1). We and others have identified taxonomic differences in fecal bacteria between pediatric or adult SpA subjects and healthy controls (2–4). However, these studies have not provided a mechanism whereby dysbiosis can result in arthritis. One possible mechanism is through alterations in metabolic pathways. The metabolic capacity of bacteria is an under-appreciated aspect of the human microbiome. In total, bacteria contain over 3 million genes, 100 times the human host (5); they perform a variety of metabolic functions including metabolism of dietary components, drug detoxification, and synthesis of vitamins and essential amino acids (5). Bacteria are not created equal in their capacity to perform these functions, and thus a particular microbiome may be more or less effective than another at carrying out certain activities. To evaluate the functional potential of the microbiome, fecal water metabolomics on children with ERA and controls was performed. The aim of metabolomics is to conduct a comprehensive analysis on the identities of the low molecular weight ions (in our facility, <1,000 Da) present in a sample, so as to obtain insight into function (6). Metabolomics of fecal water, the supernatant obtained following high-speed centrifugation of feces, can discriminate between inflammatory bowel disease (IBD) patients and healthy individuals, with some studies showing elevated levels of amino acids and decreased short chain fatty acids such as butyrate (7, 8). Our intent was to identify mechanisms by which the microbiota might predispose or contribute to arthritis in children with ERA.
Results
Subjects
Two cohorts were used in this study (Table 1). Cohort one consisted of children with relatively newly diagnosed arthritis (JIA/ERA); five were naïve to treatment at the time of stool collection, while the remainder had been exposed to one or more immunosuppressive medications for no more than two months. Cohort two included JIA/ERA children with more long-standing disease. None of the controls had ever been exposed to chronic immunosuppressive therapy or were taking corticosteroids at the time of the study.
Table 1.
Subjects included in the study
| Feature | Cohort one | Cohort two | ||
|---|---|---|---|---|
| ERA | Control | ERA | Control | |
| N | 14 | 9 | 10 | 10 |
| Age (yrs)* | 14;7–17 | 10;7–18 | 14;8–16 | 12;9–17 |
| Male : female | 5 : 9 | 2 : 7 | 7 : 3 | 5 : 5 |
| BMI* | 26;17–35 | 19;14–24 | 20;15–27 | 19;15–32 |
| HLA-B27+ | 2 / 13 | ND | 4 / 10 | ND |
| Duration of drug therapy (months)* | 0;0–2 | NA | 4;0–27 | NA |
| Meds | ||||
| None | 5 | 11 | 0 | 11 |
| MTX alone | 6 | 0 | 3 | 0 |
| MTX, anti-TNF | 2 | 0 | 4 | 0 |
| Anti-TNF alone | 1 | 0 | 3 | 0 |
BMI = body mass index, ERA = enthesitis-related arthritis, NA = not applicable, ND = not done, TNF = tumor necrosis factor.
Continuous variables are shown as median;range.
Metabolomics analysis
Fecal specimens were subjected to metabolomics analysis with nano LC-MS. Out of nearly 1,500 negatively charged ions identified in the derivation run, 154 were significantly less abundant in patients, while only one was significantly higher in patients. In this analysis, differentially present negatively charged ions revealed 21 pathways that were under-abundant in ERA patients (Table 2, S3). Similar findings were observed with positively charged ions, where 107 were lower in ERA patients, yielding five pathways, compared with only 17 that were higher (Table 2, S3.). Notably, the pathway for tryptophan metabolism was represented among both the positively and negative charged ions as being decreased in JIA/ERA patients. Some of the other findings, although not internally validated, confirm previous reports in animal models or patients with IBD, such as decreased butyrate (7, 8) and compounds associated with purine metabolism (9).
Table 2.
Pathways under-represented among patients in cohort one.
| Pathway | Overlap size | Pathway size | p-value |
|---|---|---|---|
| NEGATIVELY CHARGED IONS | |||
| Glycosphingolipid biosynthesis – ganglioseries | 5 | 7 | 0.00091 |
| Tryptophan metabolism | 13 | 46 | 0.00106 |
| Glycosphingolipid biosynthesis – globoseries | 3 | 3 | 0.00122 |
| Glycosphingolipid metabolism | 6 | 15 | 0.00125 |
| N-Glycan biosynthesis | 3 | 6 | 0.00328 |
| Tyrosine metabolism | 14 | 68 | 0.00349 |
| Glycolysis and Gluconeogenesis | 6 | 23 | 0.00425 |
| Butanoate metabolism | 4 | 12 | 0.00431 |
| Biopterin metabolism | 4 | 13 | 0.00565 |
| Fructose and mannose metabolism | 4 | 16 | 0.01275 |
| Ubiquinone Biosynthesis | 2 | 4 | 0.01498 |
| Heparan sulfate degradation | 2 | 4 | 0.01498 |
| Keratan sulfate degradation | 2 | 4 | 0.01498 |
| Chondroitin sulfate degradation | 2 | 4 | 0.01498 |
| Linoleate metabolism | 3 | 11 | 0.01895 |
| Drug metabolism - other enzymes | 4 | 18 | 0.0213 |
| N-Glycan Degradation | 2 | 5 | 0.02444 |
| Pyrimidine metabolism | 5 | 27 | 0.03493 |
| De novo fatty acid biosynthesis | 2 | 6 | 0.03734 |
| Purine metabolism | 6 | 35 | 0.04268 |
| Histidine metabolism | 3 | 14 | 0.04491 |
| POSITIVELY CHARGED IONS | |||
| Tryptophan metabolism | 9 | 37 | 0.0038 |
| Xenobiotics metabolism | 8 | 36 | 0.00544 |
| Selenoamino acid metabolism | 3 | 12 | 0.02442 |
| Vitamin B6 (pyridoxine) metabolism | 2 | 6 | 0.04015 |
| Purine metabolism | 4 | 24 | 0.05128 |
Overlap size indicates the number of metabolites present in a particular pathway; for example, among negatively charged ions, 13 metabolites associated with tryptophan metabolism were identified in the original run as being significantly higher in controls as compared to patients. Pathway size is the total number of metabolites in the pathway that were present in the input files.
In cohort two, analyses of both the negatively and positively charged ions again identified many that were under-abundant among patients (59 and 71 among negatively and positively charged ions, respectively, out of approximately 1000 ions), with again 0 and 5, respectively, being relatively abundant in JIA/ERA patients. The number of pathways represented by these ions was comparatively modest (Table 3, S3); however, the tryptophan pathway was again represented among them. Pathways involved in drug metabolism were highly represented in the second, but not the first, cohort. Very few pathways emerged as being higher among ERA patients in either run (Table S4).
Table 3.
Pathways under-represented among patients in cohort two.
| Pathway | Overlap size | Pathway size | p-value |
|---|---|---|---|
| NEGATIVELY CHARGED IONS | |||
| Urea cycle/amino group metabolism | 3 | 21 | 0.0106 |
| Biopterin metabolism | 2 | 7 | 0.01162 |
| Tryptophan metabolism | 3 | 37 | 0.03769 |
| Glycerophospholipid metabolism | 2 | 16 | 0.03784 |
| POSITIVELY CHARGED IONS | |||
| N-Glycan biosynthesis | 2 | 3 | 2.00E-05 |
| Drug metabolism - cytochrome P450 | 5 | 30 | 2.00E-05 |
| Ubiquinone Biosynthesis | 2 | 5 | 9.00E-05 |
| Hexose phosphorylation | 2 | 7 | 0.0003 |
| Linoleate metabolism | 2 | 7 | 0.0003 |
| Histidine metabolism | 2 | 11 | 0.00218 |
| Galactose metabolism | 2 | 15 | 0.00922 |
| Squalene and cholesterol biosynthesis | 2 | 15 | 0.00922 |
| Glycerophospholipid metabolism | 2 | 18 | 0.02106 |
In cohort one, combining the positive and negatively charged ions, 21 unique tryptophan metabolites accounted for the under-representation of the tryptophan metabolic pathway among the patients (Table S5). Of those, the KEGG database indicated that six were metabolites of 5-hydroxy-tryptophan, including 5-hydroxy-tryptophan itself; eight were metabolites of kynurenine; and two of tryptamine (10). The remaining metabolites are not included in the KEGG tryptophan pathway, but are associated with tryptophan in the EHMN network (11). For cohort two, only three metabolites accounted for the under-representation of the pathway, two of which were highly similar compounds as present in the derivation set (Table S5.) Figure 1 depicts the tryptophan metabolic pathway and the general location of the metabolites differentially abundant between the two groups. Thus, the tryptophan metabolic pathway was differentially expressed in stool (lower in ERA patients) from both sets of ERA versus control individuals.
Figure 1. Abbreviated version of the KEGG tryptophan map.
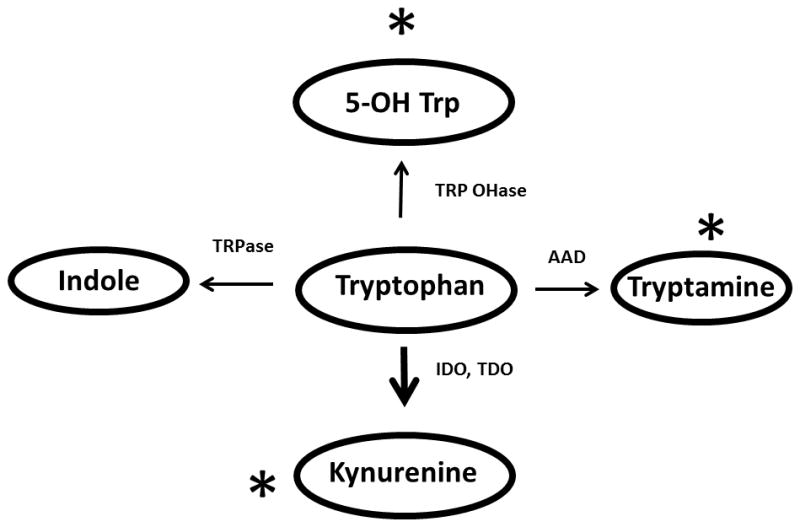
Asterisks depict locations in metabolic pathways of metabolites differentially present in controls versus ERA patients. The increased thickness size of the down arrow reflects that most of the metabolism of tryptophan is through IDO. Abbreviations: AAD = aromatic amino acid decarboxylase; IDO = indoleamine-2,3-dioxygenase; TDO = tryptophan dioxygenase; TRPase = tryptophanase; TRP OHase = tryptophan hydroxylase.
16S rDNA analysis
In order to evaluate which organisms were responsible for these metabolomics differences, sequencing of the 16S rDNA was performed on children from cohort one. High-quality sequence data was available on 22 of 23 subjects, yielding a total of 1,435,797 unique sequences; one control subject was excluded from the analysis due to a sequencing depth of < 500 reads. Principal coordinates analysis (Figure 2) revealed partial clustering with the unweighted Unifrac test, indicating differences in rare bacteria. The observations shown in Figure 2 were supported by the Permanova test, which showed that the presence versus absence of JIA/ERA affected the overall community structure (F = 1.67, p = 0.016). At the taxonomic level, no single organism clearly stood out as being higher in controls versus ERA patients. There was a trend towards higher evenness and richness in the patients versus the controls, although these differences were small and not statistically significant (1,111 vs 984, p = 0.235 for the choa1 test of richness; 6.73 vs 6.44, p = 0.240 for the Shannon test of evenness).
Figure 2. Principal coordinates analysis of the 16S rDNA sequencing data (Unweighted unifrac) from the Derivation cohort.
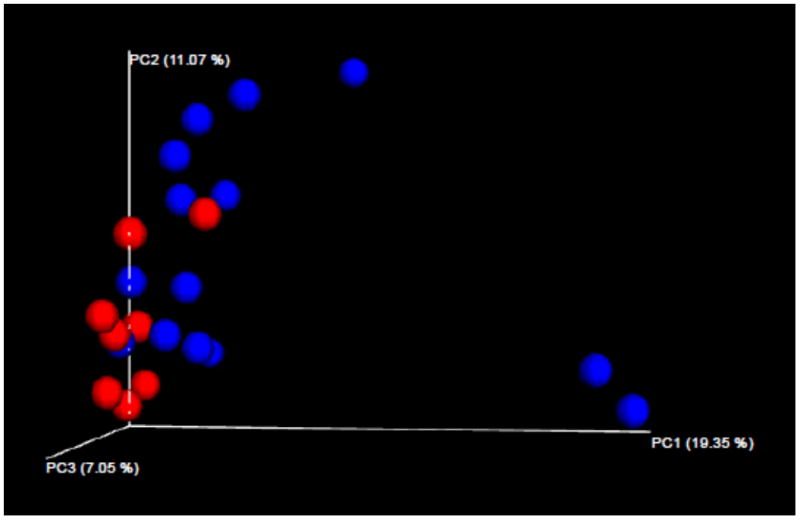
ERA patients are depicted in blue; controls in red.
To assess how the differences observed in the microbiota might result in the rather striking differences in the quantity and nature of the fecal metabolites, PICRUSt was performed on the 16S sequence data. PICRUSt takes as input 16S data and imputes metabolic activities, based upon the organisms present in the sample (12). Consistent with what was observed in the metabolomics samples, the number of predicted metabolic functions was significantly higher in control versus patient samples (77 versus 58 million, p = 0.050). There was also an increase in functions associated with Tryptophan biosynthesis (713,868 versus 533,826, p = 0.070), but not in Tryptophan metabolism (82,540 versus 70.962, p = 0.365). Similar trends were observed in cohort two, although the differences were modest and not statistically significant (not shown). Thus, the 16S fecal microbiome sequencing data confirms the relative decrease in Tryptophan metabolism in JIA/ERA patients, relative to controls, as noted in metabolomics analyses.
Discussion
This is the first study to apply metabolomics to query the function of the gut microbe communities in SpA. In two separate cohorts, despite phenotypic differences as well as differences in treatment durations, ERA patients had substantially lower diversity of ions present in their fecal water. Specifically, in cohorts one and two, 8.6% and 6.3%, respectively, of the identified ions were less abundant in the ERA patients, while very few were more abundant in the patients. This appears to be a unique finding with respect to arthritis, although similar findings of decreased metabolic diversity were reported in salivary samples of patients with Sjogren Syndrome (13). In addition, these findings are consistent with the literature showing decreased gut microbial diversity in patients with psoriatic arthritis (14) and IBD (15).
Despite differences in gut metabolomic diversity, there were not any striking differences at the taxonomic level in the microbiota between patients and controls in this cohort of largely newly diagnosed patients; this stands in contrast to our previous findings in established JIA / ERA patients (2). The significance of this finding will bear further study. However, it is of interest that despite the modest differences at the taxonomic level, there were differences in the overall community structure (Figure 2); specifically, clustering present with the Unweighted Unifrac test indicate that there are likely differences in the presence versus the absence of several bacteria, although none of these pairwise differences on their own attained statistical significance. Importantly, these differences resulted in higher functional potential in the controls as indicated by the PICRUSt analysis, and thus likely accounted for the metabolomics differences. Thus, the microbiota may have an influence on disease, even without substantial differences in the levels of any single organism.
In addition to the relative decreased gut microbial diversity in JIA/ERA patients, in both cohorts, evidence of altered tryptophan metabolism in children with ERA was also observed, with lower levels of tryptophan metabolites in patients compared to controls. The finding of decreased tryptophan metabolites is consistent with a similar finding in the synovial fluid of subjects with RA, as compared to controls with osteoarthritis (16). It is also consistent with data from a mouse model of colitis caused by deficiency in caspase recruitment domain 9, in which levels of fecal indole-3-acetic (IAA) were reduced; in this model, transfer of the microbiota to wild-type mice also resulted in colitis (17). The same study also showed decreased fecal levels of IAA in human subjects with IBD (17). Additionally, a study of mice with dextran-sulfate induced colitis also showed decreased fecal IAA (9). Importantly, we excluded children who had received antibiotics within three months prior to collection of the sample, as antibiotic usage can result in long-lasting effects on the microbiota (18) and can also impact the metabolome, including the tryptophan pathway (19). As recently reviewed (20), antibiotic usage may also increase the future risk of both JIA and IBD, although distant antibiotic usage was not explored in our subjects.
The metabolomics data, and confirmed to a lesser extent with the 16S data, suggest differences in tryptophan metabolism in children with ERA attributable to the gut microbiota. The essential amino acid tryptophan can be metabolized to a variety of different byproducts (Figure 1), several of which are immunologically relevant. When exposed to indoleamine-2,3-dioxygenase (IDO) and tryptophan dioxygenase (TDO), tryptophan forms L-kynurenine and subsequently 3-hydroxy-kynurenine; it is estimated that approximately 95% of tryptophan metabolism is generated via this route (21). Kyrunenine appears to favor the development of regulatory T cells (22).
Additionally, metabolism of tryptophan by tryptophanase into indole, by aromatic amino acid decarboxylase into tryptamine, and by tryptophan hydroxylase into 5-hydroxy-tryptophan, all result in the generation of ligands of the aryl hydrocarbon receptor (AhR) (23, 24). Ligand binding of the AhR results in disassociation from its chaperone protein and translocation into the nucleus, where it can activate a variety of pro-inflammatory cytokines (25). Blockade of the AhR in vitro results in attenuation of cytokine production normally induced by pro-inflammatory mediators, such as interleukin-1 and tumor necrosis factor (26). However, AhR are not all created equally with respect to pro-inflammatory potential (27), and 5-hydroxy tryptophan appears to be anti-inflammatory (28), whereas indole itself appears to be pro-inflammatory and is also a particularly strong AhR agonist (29). Thus, it is of interest that patients had lower levels of metabolites that served as cofactors for 5-hydroxy tryptophan synthesis, as well as its downstream products, as well as higher levels of metabolites of kynurenine. None of the metabolites higher in controls appeared to be associated with indole production. Thus, alterations in tryptophan metabolism may affect the plastic nature of effector CD4 T cells away from regulatory and towards pro-inflammatory CD4 T cell subsets (30), providing an environment conducive to JIA/ERA development or maintenance.
In summary, this study has yielded new knowledge about the potential for the fecal microbiota of ERA patients to be pro-inflammatory based on the altered tryptophan catabolism. Importantly, this is an associative study, and no definitive causal conclusions can be drawn. In addition, the low numbers of patients in this study, as well as the need for validation of the specific metabolic findings, are acknowledged. However, the replication of the observations that controls had a much greater variety of metabolites in general, as well as specifically within the tryptophan pathway, represents important internal validation. In addition, the two cohorts of ERA subjects were dissimilar from one another with respect to disease duration, medications used, and demographic features (Table 1), yet the findings were similar, speaking to the generalizability of these results. Finally, the possibility of the immunomodulatory therapies themselves resulting in some of the findings, such as the highly significant association with drug metabolism pathways in the second cohort, must be considered. However, the extent of the differences was far more striking among the cohort that was largely naïve to therapy. Further work is required to our findings and also to assess the metagenomics and metabolic effects of immunosuppressive therapy. We are just beginning to understand the functional implications of these alterations, with much more work to be done exploring potential clinical significance and therapeutic implications of abnormalities in the production of important metabolites, including, but surely not limited to the tryptophan pathway.
Patients and methods
Subjects
Patients were children with JIA/ERA (31) evaluated at a single rheumatology center, Children’s of Alabama (CoA), while the controls consisted of children age 7 – 18 in the community recruited through advertisements. These control children were negative by questionnaire for symptoms suggestive of IBD, psoriasis, arthritis, or inflammatory back pain. Subjects were excluded if they used antibiotics within three months of the collection of the fecal specimen.
Ethics, consent, and permissions
This study was approved by the Institutional Review Board at the University of Alabama at Birmingham. Written informed consent and assent were obtained as per local guidelines.
Stool collection and processing
Stool samples were immediately placed by the subject in Cary-Blair media, which is a low nutrient medium that prevents overgrowth of bacteria (32). Samples were shipped overnight to our laboratory, aliquoted, and stored in 10% glycerol as a cryopreservative at −80° C until analyzed.
Metabolomics
Fecal water was processed at 4°C via acid extraction as modified from Marchesi et al. (2007) (8) as follows: double-distilled H2O was added 1:1 to the fecal suspension, followed by addition of 98% formic acid (1 μl/ml; Sigma: St. Louis, MO, USA). The fecal homogenates were ultracentrifuged (14,000 x g for 15 min at 4°C), and the supernatants extracted with 2 x 2 volumes of ethyl acetate. The solvent extracts were combined and evaporated under N2. The supernatants were analyzed by nano-liquid chromatography – mass spectrometry (LC-MS) on a silica CHIP C18 reverse-phase column (200 μm id x 15 cm) as our group has performed previously (33). Specifically, the dried residues were reconstituted in 100 μl 0.1% formic acid and 5 μl aliquots were loaded onto a 0.5 cm x 200 μm ID silica CHIP C18 reverse-phase cartridge which was washed for 5 min with 0.1% formic acid. Trapped metabolites were separated by nanoLC-MS on a 15 cm x 200 μm ID silica CHIP C18 reverse-phase column using a 20 minute, 0–95% linear gradient of acetonitrile containing 0.1% formic acid at 1 μl/min, followed by a 1 min wash at 100% acetonitrile and column re-equilibration for 4 min with 0.1% formic acid. An Eksigent 415 nanoLC pump was used to provide the gradient. The Chip LC column was contained in an Eksigent Nanoflex™ which maintained it at 45°C. Column eluate was passed through the nanoelectrospray ionization interface of a SCIEX 5600 TripleTOF (SCIEX, Concorde, Ontario, Canada). Using a duty cycle of 1.2 sec, first, a high resolution TOF-MS spectrum was collected for 100 msec, followed by 50 msec MSMS spectra of the twenty most intense precursor ions. Once an adequate MSMS spectrum had been collected for a given precursor ion, it was placed on an exclusion list for the next 30 sec. Mass calibration using SCIEX APCI standards (APCI Positive and Negative Calibration Solutions, SCIEX, Toronto, Canada) for both positive and negative mode was run between each unknown sample in order to maintain mass calibration of the mass spectrometer (typically 2–3 ppm). Mean retention time variation for all metabolites eluting between 5 and 25 min using the nanoLC-MS system was 0.26%. Each sample was subjected to two separate metabolomics analyses: one to identify negatively charged ions, and the other to identify positively charged ions.
The collected LC-MS data (.wiff and .wiffscan files) were analyzed by XCMSonline (https://xcmsonline.scripps.edu) for retention time alignment and initial statistical analysis. Data (mass to charge (m/z) values, retention times, and ion intensities) from the aligned ions for each sample were submitted for statistical analysis using MetaboAnalyst (http://www.metaboanalyst.ca). To control for differences between samples, the data were normalized to the total ion current. Data were mean centered and subjected to Pareto scaling.
To identify the ions based upon this information and to make inferences about function, Li and colleagues generated a program (mummichog version 1.0.7) that generates metabolic networks consisting of modules (sets of ions that are chemically related) and pathways (e.g., folic acid metabolism) (34). The power behind this statistical package is its ability to evaluate all combinations of potential biochemical assignments for ions determined to be statistically different in order to identify network modules or pathways. Mummichog, by using all ions including those that are not changed significantly, establishes expected network/pathways associations under the null hypothesis, which is that there are no differences in pathway representation among the two inputted groups (in this case, ERA patients and controls). Over-representation of statistically significant ions in modules and pathways can then be identified as those higher than would be predicted by chance. Thus, the output is modules and pathways that are over- or under-represented in one group relative to another. The input to mummichog was the full set of ions, as well as those that were differentially present between the two groups (1.5 fold or higher difference with p-values of 0.05 or less.) The mummichog program uses the Fisher exact test to compare pathway utilization between the list of select ions versus the full list of ions, removing one hit from each identified pathway so as to penalize pathways with very few hits that might have arisen by chance. Mummichog analysis was performed four times, twice for ions higher in patients (once each for negatively and positively charged ions), and twice for ions higher in controls. Assignment of metabolites to pathways is based upon the KEGG database (10) and their own curation (35), which also included the Edinburgh Human Metabolic Network (EHMN) Reconstruction (11). Sample size was upon the study by Marchesi et al. (2007) (8).
Sequencing of 16S ribosomal DNA
Amplification of the variable V4 region of the 16S ribosomal DNA (rDNA) was performed as previously described and sequenced with the MiSeq (Illumina, San Diego, CA) (2). Following quality control steps, sequence data was processed with the Quantitative Insight Into Microbial Ecology tool suite (36). Sequences were grouped into groups of similar sequences (known as operational taxonomic units (OTUs)) using uclust (37). The resulting OTU table was imported into Phylogenetic Investigation of Communities by Reconstruction of Unobserved States (PICRUSt; (12)). PICRUSt is an open-source bioinformatics software program that predicts metabolic functions based upon 16S rDNA sequence data. Assessment of between-sample diversity (similarity between the sequences of each subject) was performed with the Weighted and Unweighted Unifrac tests (38) and visualized with principal coordinates analysis (PCoA). The Permanova test evaluated whether a categorical variable (JIA/ERA versus control) predicted the sample clustering obtained from the Unifrac tests. Pairwise comparisons of abundance of metabolic functions were performed with the Mann-Whitney U-test.
Supplementary Material
For race, C = Caucasian; AA = African-American. For diagnosis, ERA = enthesitis-related arthritis. For medications, MTX = methotrexate; TNFi = tumor necrosis factor inhibitor. For HLA-B27, NA = not available.
mz is the mass ; charge ratio, while rt is retention time.
These include tryptophan metabolites as well as cofactors for tryptophan metabolism. Some of the ions are part of multiple pathways besides tryptophan.
Acknowledgments
This work was supported by the National Institutes of Health (Grant numbers P60 AR064172, P30AR050948, P30AI027767, UL1TR000165, S10 RR027822) and the American College of Rheumatology, Rheumatology Research Foundation.
The following are acknowledged for their support of the Microbiome Resource at the University of Alabama at Birmingham: the School of Medicine, the Comprehensive Cancer Center (P30CA13148), the Center for AIDS Research (5P30AI027767), the Center for Clinical Translational Science (UL1TR000165), and the Heflin Center.
The authors acknowledge Drs. Peter Eipers and Anna Genin for their assistance with the preparation of the stool specimens and Landon Wilson for his assistance with metabolomics analysis.
Footnotes
Conflicts of interest statement
The author(s) declare that they have no competing interests.
Supplementary data are available at Genes and Immunity’s website. The fastq files were deposited in the NCBI sequence read archive http://www.ncbi.nlm.nih.gov/sra under accession number SRP087829.
Contributor Information
Matthew L Stoll, Email: mstoll@peds.uab.edu, Department of Pediatrics, University of Alabama at Birmingham (UAB): CPP N 210M / 1600 7th Ave S / Birmingham, AL 35233.
Ranjit Kumar, Department of Center for Clinical & Translational Sciences, UAB.
Elliot Lefkowitz, Department of Microbiology, UAB.
Randy Q Cron, Department of Pediatrics, UAB.
Casey D Morrow, Department of Cell, Developmental, and Integrative Biology, UAB.
Stephen Barnes, Department of Pharmacology, UAB.
References
- 1.Stoll ML. Gut microbes, immunity, and spondyloarthritis. Clinical immunology. 2015;159(2):134–42. doi: 10.1016/j.clim.2015.05.001. [DOI] [PubMed] [Google Scholar]
- 2.Stoll ML, Kumar R, Morrow CD, Lefkowitz EJ, Cui X, Genin A, et al. Altered microbiota associated with abnormal humoral immune responses to commensal organisms in enthesitis-related arthritis. Arthritis Res Ther. 2014;16(6):486. doi: 10.1186/s13075-014-0486-0. [DOI] [PMC free article] [PubMed] [Google Scholar]
- 3.Stebbings S, Munro K, Simon MA, Tannock G, Highton J, Harmsen H, et al. Comparison of the faecal microflora of patients with ankylosing spondylitis and controls using molecular methods of analysis. Rheumatology (Oxford) 2002;41(12):1395–401. doi: 10.1093/rheumatology/41.12.1395. [DOI] [PubMed] [Google Scholar]
- 4.Costello ME, Ciccia F, Willner D, Warrington N, Robinson PC, Gardiner B, et al. Intestinal dysbiosis in ankylosing spondylitis. Arthritis & rheumatology. 2014 doi: 10.1002/art.38967. [DOI] [PubMed] [Google Scholar]
- 5.Qin J, Li R, Raes J, Arumugam M, Burgdorf KS, Manichanh C, et al. A human gut microbial gene catalogue established by metagenomic sequencing. Nature. 2010;464(7285):59–65. doi: 10.1038/nature08821. [DOI] [PMC free article] [PubMed] [Google Scholar]
- 6.Macarulla MT, Alberdi G, Gomez S, Tueros I, Bald C, Rodriguez VM, et al. Effects of different doses of resveratrol on body fat and serum parameters in rats fed a hypercaloric diet. Journal of physiology and biochemistry. 2009;65(4):369–76. doi: 10.1007/BF03185932. [DOI] [PubMed] [Google Scholar]
- 7.Bjerrum JT, Wang Y, Hao F, Coskun M, Ludwig C, Gunther U, et al. Metabonomics of human fecal extracts characterize ulcerative colitis, Crohn’s disease and healthy individuals. Metabolomics : Official journal of the Metabolomic Society. 2015;11:122–33. doi: 10.1007/s11306-014-0677-3. [DOI] [PMC free article] [PubMed] [Google Scholar]
- 8.Marchesi JR, Holmes E, Khan F, Kochhar S, Scanlan P, Shanahan F, et al. Rapid and noninvasive metabonomic characterization of inflammatory bowel disease. J Proteome Res. 2007;6(2):546–51. doi: 10.1021/pr060470d. [DOI] [PubMed] [Google Scholar]
- 9.Shiomi Y, Nishiumi S, Ooi M, Hatano N, Shinohara M, Yoshie T, et al. GCMS-based metabolomic study in mice with colitis induced by dextran sulfate sodium. Inflamm Bowel Dis. 2011;17(11):2261–74. doi: 10.1002/ibd.21616. [DOI] [PubMed] [Google Scholar]
- 10.Kanehisa M, Sato Y, Kawashima M, Furumichi M, Tanabe M. KEGG as a reference resource for gene and protein annotation. Nucleic Acids Res. 2016;44(D1):D457–62. doi: 10.1093/nar/gkv1070. [DOI] [PMC free article] [PubMed] [Google Scholar]
- 11.Ma H, Sorokin A, Mazein A, Selkov A, Selkov E, Demin O, et al. The Edinburgh human metabolic network reconstruction and its functional analysis. Molecular systems biology. 2007;3:135. doi: 10.1038/msb4100177. [DOI] [PMC free article] [PubMed] [Google Scholar]
- 12.Langille MG, Zaneveld J, Caporaso JG, McDonald D, Knights D, Reyes JA, et al. Predictive functional profiling of microbial communities using 16S rRNA marker gene sequences. Nat Biotechnol. 2013;31(9):814–21. doi: 10.1038/nbt.2676. [DOI] [PMC free article] [PubMed] [Google Scholar]
- 13.Kageyama G, Saegusa J, Irino Y, Tanaka S, Tsuda K, Takahashi S, et al. Metabolomics analysis of saliva from patients with primary Sjogren’s syndrome. Clin Exp Immunol. 2015;182(2):149–53. doi: 10.1111/cei.12683. [DOI] [PMC free article] [PubMed] [Google Scholar]
- 14.Scher JU, Ubeda C, Artacho A, Attur M, Isaac S, Reddy SM, et al. Decreased bacterial diversity characterizes the altered gut microbiota in patients with psoriatic arthritis, resembling dysbiosis in inflammatory bowel disease. Arthritis & rheumatology. 2015;67(1):128–39. doi: 10.1002/art.38892. [DOI] [PMC free article] [PubMed] [Google Scholar]
- 15.Michail S, Durbin M, Turner D, Griffiths AM, Mack DR, Hyams J, et al. Alterations in the gut microbiome of children with severe ulcerative colitis. Inflamm Bowel Dis. 2012;18(10):1799–808. doi: 10.1002/ibd.22860. [DOI] [PMC free article] [PubMed] [Google Scholar]
- 16.Kang KY, Lee SH, Jung SM, Park SH, Jung BH, Ju JH. Downregulation of Tryptophan-related Metabolomic Profile in Rheumatoid Arthritis Synovial Fluid. J Rheumatol. 2015;42(11):2003–11. doi: 10.3899/jrheum.141505. [DOI] [PubMed] [Google Scholar]
- 17.Lamas B, Richard ML, Leducq V, Pham HP, Michel ML, Da Costa G, et al. CARD9 impacts colitis by altering gut microbiota metabolism of tryptophan into aryl hydrocarbon receptor ligands. Nat Med. 2016;22(6):598–605. doi: 10.1038/nm.4102. [DOI] [PMC free article] [PubMed] [Google Scholar]
- 18.Arvonen M, Berntson L, Pokka T, Karttunen TJ, Vahasalo P, Stoll ML. Gut microbiota-host interactions and juvenile idiopathic arthritis. Pediatr Rheumatol Online J. 2016;14(1):44. doi: 10.1186/s12969-016-0104-6. [DOI] [PMC free article] [PubMed] [Google Scholar]
- 19.Zheng X, Xie G, Zhao A, Zhao L, Yao C, Chiu NH, et al. The footprints of gut microbial-mammalian co-metabolism. J Proteome Res. 2011;10(12):5512–22. doi: 10.1021/pr2007945. [DOI] [PubMed] [Google Scholar]
- 20.Stoll ML, Cron RQ. The microbiota in pediatric rheumatic disease: epiphenomenon or therapeutic target? Curr Opin Rheumatol. 2016 doi: 10.1097/BOR.0000000000000312. in press. [DOI] [PMC free article] [PubMed] [Google Scholar]
- 21.Oxenkrug GF. Tryptophan kynurenine metabolism as a common mediator of genetic and environmental impacts in major depressive disorder: the serotonin hypothesis revisited 40 years later. Isr J Psychiatry Relat Sci. 2010;47(1):56–63. [PMC free article] [PubMed] [Google Scholar]
- 22.Cribbs AP, Kennedy A, Penn H, Read JE, Amjadi P, Green P, et al. Treg cell function in rheumatoid arthritis is compromised by ctla-4 promoter methylation resulting in a failure to activate the indoleamine 2,3-dioxygenase pathway. Arthritis & rheumatology. 2014;66(9):2344–54. doi: 10.1002/art.38715. [DOI] [PubMed] [Google Scholar]
- 23.Sridharan GV, Choi K, Klemashevich C, Wu C, Prabakaran D, Pan LB, et al. Prediction and quantification of bioactive microbiota metabolites in the mouse gut. Nature communications. 2014;5:5492. doi: 10.1038/ncomms6492. [DOI] [PubMed] [Google Scholar]
- 24.Hubbard TD, Murray IA, Perdew GH. Indole and Tryptophan Metabolism: Endogenous and Dietary Routes to Ah Receptor Activation. Drug metabolism and disposition: the biological fate of chemicals. 2015;43(10):1522–35. doi: 10.1124/dmd.115.064246. [DOI] [PMC free article] [PubMed] [Google Scholar]
- 25.Esser C, Rannug A, Stockinger B. The aryl hydrocarbon receptor in immunity. Trends Immunol. 2009;30(9):447–54. doi: 10.1016/j.it.2009.06.005. [DOI] [PubMed] [Google Scholar]
- 26.Lahoti TS, John K, Hughes JM, Kusnadi A, Murray IA, Krishnegowda G, et al. Aryl hydrocarbon receptor antagonism mitigates cytokine-mediated inflammatory signalling in primary human fibroblast-like synoviocytes. Ann Rheum Dis. 2013;72(10):1708–16. doi: 10.1136/annrheumdis-2012-202639. [DOI] [PMC free article] [PubMed] [Google Scholar]
- 27.Mohinta S, Kannan AK, Gowda K, Amin SG, Perdew GH, August A. Differential regulation of Th17 and T regulatory cell differentiation by aryl hydrocarbon receptor dependent xenobiotic response element dependent and independent pathways. Toxicol Sci. 2015;145(2):233–43. doi: 10.1093/toxsci/kfv046. [DOI] [PMC free article] [PubMed] [Google Scholar]
- 28.Yang TH, Hsu PY, Meng M, Su CC. Supplement of 5-hydroxytryptophan before induction suppresses inflammation and collagen-induced arthritis. Arthritis Res Ther. 2015;17:364. doi: 10.1186/s13075-015-0884-y. [DOI] [PMC free article] [PubMed] [Google Scholar]
- 29.Hubbard TD, Murray IA, Bisson WH, Lahoti TS, Gowda K, Amin SG, et al. Adaptation of the human aryl hydrocarbon receptor to sense microbiota-derived indoles. Scientific reports. 2015;5:12689. doi: 10.1038/srep12689. [DOI] [PMC free article] [PubMed] [Google Scholar]
- 30.Hatton RD, Weaver CT. Duality in the Th17-Treg developmental decision. F1000 biology reports. 2009;1:5. doi: 10.3410/B1-5. [DOI] [PMC free article] [PubMed] [Google Scholar]
- 31.Petty RE, Southwood TR, Manners P, Baum J, Glass DN, Goldenberg J, et al. International League of Associations for Rheumatology classification of juvenile idiopathic arthritis: second revision, Edmonton, 2001. J Rheumatol. 2004;31(2):390–2. [PubMed] [Google Scholar]
- 32.Cary SG, Blair EB. New Transport Medium for Shipment of Clinical Specimens. I. Fecal Specimens. J Bacteriol. 1964;88:96–8. doi: 10.1128/jb.88.1.96-98.1964. [DOI] [PMC free article] [PubMed] [Google Scholar]
- 33.Wilson L, Arabshahi A, Simons B, Prasain JK, Barnes S. Improved high sensitivity analysis of polyphenols and their metabolites by nano-liquid chromatography-mass spectrometry. Archives of biochemistry and biophysics. 2014;559:3–11. doi: 10.1016/j.abb.2014.06.014. [DOI] [PMC free article] [PubMed] [Google Scholar]
- 34.Li S, Park Y, Duraisingham S, Strobel FH, Khan N, Soltow QA, et al. Predicting network activity from high throughput metabolomics. PLoS Comput Biol. 2013;9(7):e1003123. doi: 10.1371/journal.pcbi.1003123. [DOI] [PMC free article] [PubMed] [Google Scholar]
- 35.Li S, Pozhitkov A, Ryan RA, Manning CS, Brown-Peterson N, Brouwer M. Constructing a fish metabolic network model. Genome Biol. 2010;11(11):R115. doi: 10.1186/gb-2010-11-11-r115. [DOI] [PMC free article] [PubMed] [Google Scholar]
- 36.Caporaso JG, Kuczynski J, Stombaugh J, Bittinger K, Bushman FD, Costello EK, et al. QIIME allows analysis of high-throughput community sequencing data. Nature methods. 2010;7(5):335–6. doi: 10.1038/nmeth.f.303. [DOI] [PMC free article] [PubMed] [Google Scholar]
- 37.Edgar RC. Search and clustering orders of magnitude faster than BLAST. Bioinformatics. 2010;26(19):2460–1. doi: 10.1093/bioinformatics/btq461. [DOI] [PubMed] [Google Scholar]
- 38.Lozupone C, Knight R. UniFrac: a new phylogenetic method for comparing microbial communities. Appl Environ Microbiol. 2005;71(12):8228–35. doi: 10.1128/AEM.71.12.8228-8235.2005. [DOI] [PMC free article] [PubMed] [Google Scholar]
Associated Data
This section collects any data citations, data availability statements, or supplementary materials included in this article.
Supplementary Materials
For race, C = Caucasian; AA = African-American. For diagnosis, ERA = enthesitis-related arthritis. For medications, MTX = methotrexate; TNFi = tumor necrosis factor inhibitor. For HLA-B27, NA = not available.
mz is the mass ; charge ratio, while rt is retention time.
These include tryptophan metabolites as well as cofactors for tryptophan metabolism. Some of the ions are part of multiple pathways besides tryptophan.