

Abstract
Networks are a fundamental tool for understanding and modeling complex systems in physics, biology, neuroscience, engineering, and social science. Many networks are known to exhibit rich, lower-order connectivity patterns that can be captured at the level of individual nodes and edges. However, higher-order organization of complex networks—at the level of small network subgraphs—remains largely unknown. Here, we develop a generalized framework for clustering networks on the basis of higher-order connectivity patterns. This framework provides mathematical guarantees on the optimality of obtained clusters and scales to networks with billions of edges. The framework reveals higher-order organization in a number of networks, including information propagation units in neuronal networks and hub structure in transportation networks. Results show that networks exhibit rich higher-order organizational structures that are exposed by clustering based on higher-order connectivity patterns.
Networks are a standard representation of data throughout the sciences, and higher-order connectivity patterns are essential to understanding the fundamental structures that control and mediate the behavior of many complex systems (1–7). The most common higher-order structures are small network subgraphs, which we refer to as network motifs (Fig. 1A). Network motifs are considered building blocks for complex networks (1, 8). For example, feed-forward loops (Fig. 1A, M5) have proven fundamental to understanding transcriptional regulation networks (9); triangular motifs (Fig. 1A, M1–M7) are crucial for social networks (4); open bidirectional wedges (Fig. 1A, M13) are key to structural hubs in the brain (10); and two-hop paths (Fig. 1A, M8–M13) are essential to understanding air traffic patterns (5). Although network motifs have been recognized as fundamental units of networks, the higher-order organization of networks at the level of network motifs largely remains an open question.
Fig. 1. Higher-order network structures and the higher-order network clustering framework.
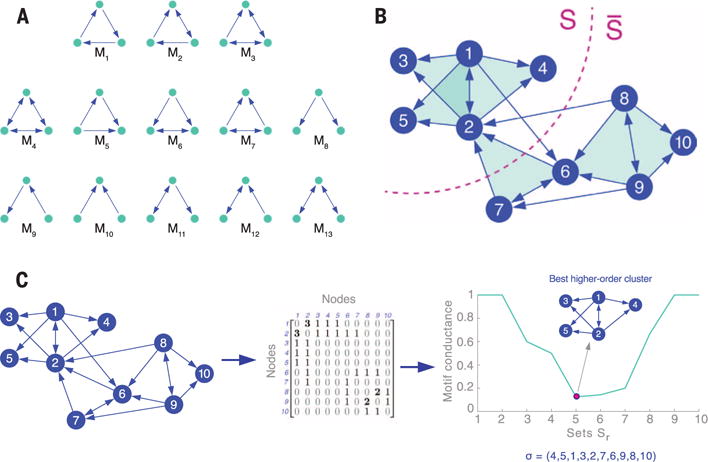
(A) Higher-order structures are captured by network motifs. For example, all 13 connected three-node directed motifs are shown here. (B) Clustering of a network based on motif M7. For a given motif M, our framework aims to find a set of nodes S that minimizes motif conductance, ϕM(S), which we define as the ratio of the number of motifs cut (filled triangles cut) to the minimum number of nodes in instances of the motif in either S or (13). In this case, there is one motif cut. (C) The higher-order network clustering framework. Given a graph and a motif of interest (in this case, M7), the framework forms a motif adjacency matrix (WM) by counting the number of times two nodes co-occur in an instance of the motif. An eigenvector of a Laplacian transformation of the motif adjacency matrix is then computed. The ordering σ of the nodes provided by the components of the eigenvector (15) produces nested sets Sr = {σ1, …, σr} of increasing size r. We prove that the set Sr with the smallest motif-based conductance, ϕM(Sr), is a near-optimal higher-order cluster (13).
Here, we use higher-order network structures to gain new insights into the organization of complex systems. We develop a framework that identifies clusters of network motifs. For each network motif (Fig. 1A), a different higher-order clustering may be revealed (Fig. 1B), which means that different organizational patterns are exposed, depending on the chosen motif.
Conceptually, given a network motif M, our framework searches for a cluster of nodes S with two goals. First, the nodes in S should participate in many instances of M. Second, the set S should avoid cutting instances of M, which occurs when only a subset of the nodes from a motif are in the set S (Fig. 1B). More precisely, given a motif M, the higher-order clustering framework aims to find a cluster (defined by a set of nodes S) that minimizes the following ratio:
| (1) |
where denotes the remainder of the nodes (the complement of S), is the number of instances of motif M with at least one node in S and one in , and volM (S) is the number of nodes in instances of M that reside in S. Equation 1 is a generalization of the conductance metric in spectral graph theory, one of the most useful graph partitioning scores (11). We refer to ϕM(S) as the motif conductance of S with respect to M.
Finding the exact set of nodes S that minimizes the motif conductance is computationally infeasible (12). To approximately minimize Eq. 1 and, hence, to identify higher-order clusters, we developed an optimization framework that provably finds near-optimal clusters [supplementary materials (13)]. We extend the spectral graph clustering methodology, which is based on the eigenvalues and eigenvectors of matrices associated with the graph (11), to account for higher-order structures in networks. The resulting method maintains the properties of traditional spectral graph clustering: computational efficiency, ease of implementation, and mathematical guarantees on the near-optimality of obtained clusters. Specifically, the clusters identified by our higher-order clustering framework satisfy the motif Cheeger inequality (14), which means that our optimization framework finds clusters that are at most a quadratic factor away from optimal.
The algorithm (illustrated in Fig. 1C) efficiently identifies a cluster of nodes S as follows:
Step 1: Given a network and a motif M of interest, form the motif adjacency matrix WM whose entries (i, j) are the co-occurrence counts of nodes i and j in the motif M: (WM)ij = number of instances of M that contain nodes i and j.
Step 2: Compute the spectral ordering σ of the nodes from the normalized motif Laplacian matrix constructed via WM (15).
Step 3: Find the prefix set of σ with the smallest motif conductance (the argument of the minimum), formally, S: = arg minr ϕM(Sr), where Sr = {σ1, …, σr}.
For triangular motifs, the algorithm scales to networks with billions of edges and, typically, only takes several hours to process graphs of such size. On smaller networks with hundreds of thousands of edges, the algorithm can process motifs up to size 9 (13). Although the worst-case computational complexity of the algorithm for triangular motifs is Θ(m1.5), where m is the number of edges in the network, in practice, the algorithm is much faster. By analyzing 16 real-world networks where the number of edges m ranges from 159,000 to 2 billion, we found the computational complexity to scale as Θ(m1.2). Moreover, the algorithm can easily be parallelized, and sampling techniques can be used to further improve performance (16).
The framework can be applied to directed, undirected, and weighted networks, as well as motifs (13). Moreover, it can also be applied to networks with positive and negative signs on the edges, which are common in social networks (friend versus foe or trust versus distrust edges) and metabolic networks (edges signifying activation versus inhibition) (13). The framework can be used to identify higher-order structure in networks where domain knowledge suggests the motif of interest. In the supplementary materials, we also show that when a domain-specific higher-order pattern is not known in advance, the framework can also serve to identify which motifs are important for the modular organization of a given network (13). Such a general framework allows complex higher-order organizational structures in a number of different networks by using individual motifs and sets of motifs. The framework and mathematical theory immediately extend to other spectral methods, such as localized algorithms that find clusters around a seed node (17) and algorithms for finding overlapping clusters (18). To find several clusters, one can use embeddings from multiple eigenvectors and k-means clustering (13, 19) or can apply recursive bipartitioning (13, 20).
The framework can serve to identify a higher-order modular organization of networks. We apply the higher-order clustering framework to the Caenorhabditis elegans neuronal network, where the four-node “bi-fan” motif (Fig. 2A) is overexpressed (1). The higher-order clustering framework then reveals the organization of the motif within the C. elegans neuronal network. We find a cluster of 20 neurons in the frontal section with low bi-fan motif conductance (Fig. 2B). The cluster shows a way that nictation is controlled. Within the cluster, ring motor neurons (RMEL, -V, or -R), proposed pioneers of the nerve ring (21), propagate information to inner labial sensory neurons, regulators of nictation (22), through the neuron RIH (Fig. 2C). Our framework contextualizes the importance of the bi-fan motif in this control mechanism.
Fig. 2. Higher-order cluster in the C. elegans neuronal network.
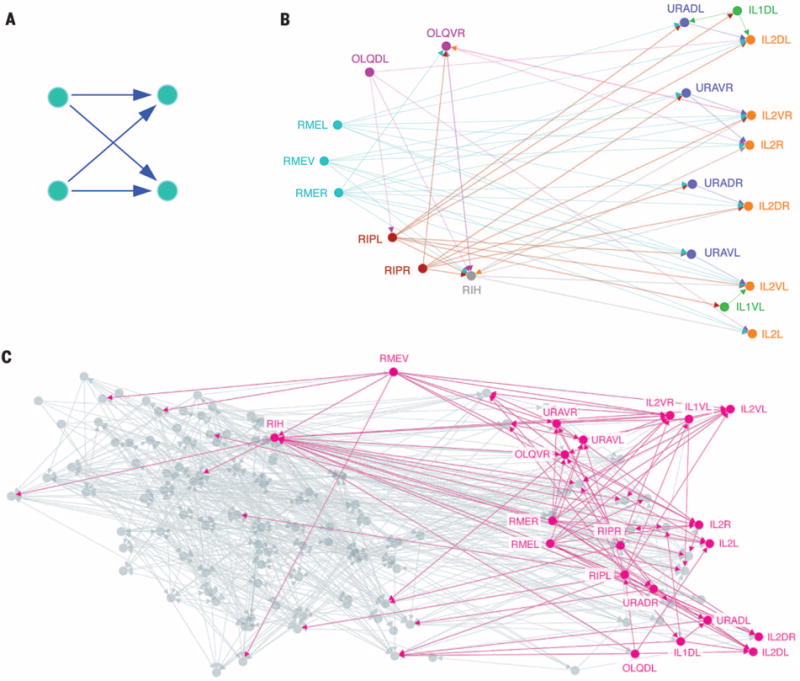
[See (29).] (A) The four-node bi-fan motif, which is overexpressed in neuronal networks (1). Intuitively, this motif describes a cooperative propagation of information from the nodes on the left to the nodes on the right. (B) The best higher-order cluster in the C. elegans frontal neuronal network based on the motif in (A). The cluster contains three ring motor neurons (RMEL, -V, and -R; cyan) with many outgoing connections, which serve as the source of information; six inner labial sensory neurons (IL2DL, -VR, -R, -DR, -VL, and -L; orange) with many incoming connections, serving as the destination of information; and four URA motor neurons (purple) acting as intermediaries. These RME neurons have been proposed as pioneers for the nerve ring (21), whereas the IL2 neurons are known regulators of nictation (22), and the higher-order cluster exposes their organization. The cluster also reveals that RIH serves as a critical intermediary of information processing. This neuron has incoming links from three RME neurons, outgoing connections to five of the six IL2 neurons, and the largest total number of connections of any neuron in the cluster. (C) Illustration of the higher-order cluster in the context of the entire network. Node locations are the true two-dimensional spatial embedding of the neurons. Most information flows from left to right, and we see that RMEV, -R, and -L and RIH serve as sources of information to the neurons on the right.
The framework also provides new insights into network organization beyond the clustering of nodes based only on edges. Results on a transportation reachability network (23) demonstrate how it finds the essential hub interconnection airports (Fig. 3). These appear as extrema on the primary spectral direction (Fig. 3C) when two-hop motifs (Fig. 3A) are used to capture highly connected nodes and nonhubs. [The first spectral coordinate of the normalized motif Laplacian embedding was positively correlated with the airport city’s metropolitan population with Pearson correlation 99% confidence interval (0.33, 0.53).] The secondary spectral direction identified the west-east geography in the North American flight network [it was negatively correlated with the airport city’s longitude with Pearson correlation 99% confidence interval (−0.66, −0.50)]. On the other hand, edge-based methods conflate geography and hub structure. For example, Atlanta, a large hub, is embedded next to Salina, a nonhub, with an edge-based method (Fig. 3D).
Fig. 3. Higher-order spectral analysis of a network of airports in Canada and the United States.
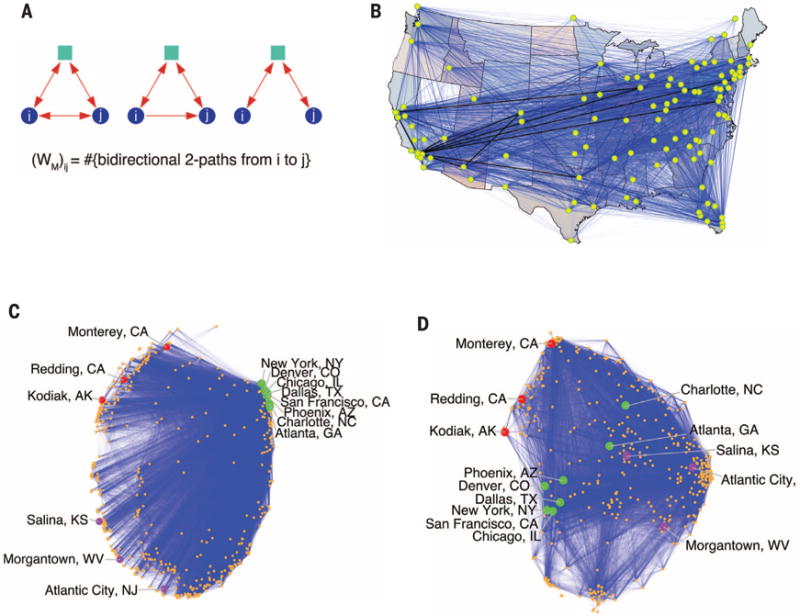
[See (23).] (A) The three higher-order structures used in our analysis. Each motif is “anchored” by the blue nodes i and j, which means our framework only seeks to cluster together the blue nodes. Specifically, the motif adjacency matrix adds weight to the (i, j) edge on the basis of the number of third intermediary nodes (green squares).The first two motifs correspond to highly connected cities, and the motif on the right connects non-hubs to nonhubs. (B) The top 50 most populous cities in the United States, which correspond to nodes in the network. The edge thickness is proportional to the weight in the motif adjacency matrix WM. The thick, dark lines indicate that large weights correspond to popular mainline routes. (C) Embedding of nodes provided by their corresponding components of the first two nontrivial eigenvectors of the normalized Laplacian for WM. The marked cities are eight large U.S. hubs (green), three West Coast nonhubs (red), and three East Coast nonhubs (purple). The primary spectral coordinate (left to right) reveals how much of a hub the city is, and the second spectral coordinate (top to bottom) captures west-east geography (13). (D) Embedding of nodes provided by their corresponding components in the first two nontrivial eigenvectors of the standard, edge-based (non–higher-order) normalized Laplacian. This method does not capture the hub and geography found by the higher-order method. For example, Atlanta, the largest hub, is in the center of the embedding, next to Salina, a nonhub.
Our higher-order network clustering framework unifies motif analysis and network partitioning—two fundamental tools in network science—and reveals new organizational patterns and modules in complex systems. Prior efforts along these lines do not provide worst-case performance guarantees on the obtained clustering (24) and do not reveal which motifs organize the network (25) but rely on expanding the size of the network (26, 27). Theoretical results in the supplementary materials (13) also explain why classes of hypergraph partitioning methods are more general than previously assumed and how motif-based clustering provides a rigorous framework for the special case of partitioning directed graphs. Finally, the higher-order network clustering framework is generally applicable to a wide range of network types, including directed, undirected, weighted, and signed networks.
Supplementary Material
Acknowledgments
The authors thank R. Sosič for insightful comments. A.R.B. was supported by a Stanford Graduate Fellowship; D.F.G. was supported by NSF (CCF-1149756 and IIS-1422918), J.L. was supported by NSF (IIS-1149837 and CNS-1010921), trans-NIH initiative Big Data to Knowledge (BD2K), Defense Advanced Research Projects Agency [XDATA and Simplifying Complexity in Scientific Discovery (SIMPLEX)], Boeing, Lightspeed, and Volkswagen. Software implementations and the data sets used to obtain the results in this manuscript are available at http://snap.stanford.edu/higher-order/.
Footnotes
SUPPLEMENTARY MATERIALS
www.sciencemag.org/content/353/6295/163/suppl/DC1
Materials and Methods
References (30–84)
REFERENCES AND NOTES
- 1.Milo R, et al. Science. 2002;298:824–827. doi: 10.1126/science.298.5594.824. [DOI] [PubMed] [Google Scholar]
- 2.Mangan S, Zaslaver A, Alon U. J Mol Biol. 2003;334:197–204. doi: 10.1016/j.jmb.2003.09.049. [DOI] [PubMed] [Google Scholar]
- 3.Yang J, Leskovec J. Proc IEEE. 2014;102:1892–1902. [Google Scholar]
- 4.Holland PW, Leinhardt S. Am J Sociol. 1970;76:492–513. [Google Scholar]
- 5.Rosvall M, Esquivel AV, Lancichinetti A, West JD, Lambiotte R. Nat Commun. 2014;5:4630. doi: 10.1038/ncomms5630. [DOI] [PubMed] [Google Scholar]
- 6.Pržulj N, Corneil DG, Jurisica I. Bioinformatics. 2004;20:3508–3515. doi: 10.1093/bioinformatics/bth436. [DOI] [PubMed] [Google Scholar]
- 7.Leskovec J, Lang KJ, Dasgupta A, Mahoney MW. Internet Math. 2009;6:29–123. [Google Scholar]
- 8.Yaveroğlu ŐN, et al. Sci Rep. 2014;4:4547. doi: 10.1038/srep04547. [DOI] [PMC free article] [PubMed] [Google Scholar]
- 9.Mangan S, Alon U. Proc Natl Acad Sci USA. 2003;100:11980–11985. doi: 10.1073/pnas.2133841100. [DOI] [PMC free article] [PubMed] [Google Scholar]
- 10.Honey CJ, Kötter R, Breakspear M, Sporns O. Proc Natl Acad Sci USA. 2007;104:10240–10245. doi: 10.1073/pnas.0701519104. [DOI] [PMC free article] [PubMed] [Google Scholar]
- 11.Schaeffer SE. Comput Sci Rev. 2007;1:27–64. [Google Scholar]
- 12.Minimizing ϕM(S) is nondeterministic polynomial-time hard (NP-hard), which follows from the NP-hardness of the traditional definition of conductance (28).
- 13.See the supplementary materials on Science Online.
- 14.Formally, when the motif has three nodes, the selected cluster S satisfies , where is the smallest motif conductance of any possible node set S. This inequality is proved in the supplementary materials.
- 15.The normalized motif Laplacian matrix is LM = D−1/2 (D − WM)D−1/2, where D is a diagonal matrix with the row-sums of WM on the diagonal [Dii = Σj (WM)ij], and D−1/2 is the same matrix with the inverse square roots on the diagonal . The spectral ordering σ is the by-value ordering of D−1/2z, where z is the eigenvector corresponding to the second smallest eigenvalue of LM, i.e., σi is the index of D−1/2z with the ith smallest value.
- 16.Seshadhri C, Pinar A, Kolda TG. Stat Anal Data Min. 2014;7:294–307. [Google Scholar]
- 17.Andersen R, Chung F, Lang K. Proceedings of the 47th Annual IEEE Symposium on Foundations of Computer Science, FOCS’06; Berkeley, California. 21 to 25 October 2006; Piscataway, NJ: Institute of Electrical and Electronics Engineers; 2006. pp. 475–486. [Google Scholar]
- 18.Whang JJ, Dhillon IS, Gleich DF. In: Venkatasubramanian S, Ye J, editors. Proceedings of the 2015 SIAM International Conference on Data Mining; Vancouver, British Columbia, Canada. 30 April to 2 May 2015; Philadelphia, PA: Society for Industrial and Applied Mathematics; 2015. pp. 936–944. [Google Scholar]
- 19.Ng AY, Jordan MI, Weiss Y. Adv Neural Inf Process Syst. 2002;14:849–856. [Google Scholar]
- 20.Boley D. Data Min Knowl Discov. 1998;2:325–344. [Google Scholar]
- 21.Riddle DL, et al. C. elegans II. 2. Cold Spring Harbor Laboratory Press; Cold Spring Harbor, NY: 1997. [PubMed] [Google Scholar]
- 22.Lee H, et al. Nat Neurosci. 2011;15:107–112. doi: 10.1038/nn.2975. [DOI] [PubMed] [Google Scholar]
- 23.Frey BJ, Dueck D. Science. 2007;315:972–976. doi: 10.1126/science.1136800. [DOI] [PubMed] [Google Scholar]
- 24.Serrour B, Arenas A, Gómez S. Comput Commun. 2011;34:629–634. [Google Scholar]
- 25.Michoel T, Joshi A, Nachtergaele B, Van de Peer Y. Mol Biosyst. 2011;7:2769–2778. doi: 10.1039/c1mb05241a. [DOI] [PubMed] [Google Scholar]
- 26.Benson AR, Gleich DF, Leskovec J. In: Venkatasubramanian S, Ye J, editors. Proceedings of the 2015 SIAM International Conference on Data Mining; Vancouver, British Columbia, Canada. 30 April to 2 May 2015; Philadelphia: SIAM; 2015. pp. 118–126. [DOI] [PMC free article] [PubMed] [Google Scholar]
- 27.Krzakala F, et al. Proc Natl Acad Sci USA. 2013;110:20935–20940. doi: 10.1073/pnas.1312486110. [DOI] [PMC free article] [PubMed] [Google Scholar]
- 28.Wagner D, Wagner F. Mathematical Foundations of Computer Science 1993. In: Borzyszkowski AM, Sokolowski S, editors. Proceedings of the 18th International Symposium on Mathematical Foundations of Computer Science; MFCS’93, Gdańsk, Poland. 30 August to 3 September 1993; New York: Springer; 1993. pp. 744–750. [Google Scholar]
- 29.Kaiser M, Hilgetag CC. PLOS Comput Biol. 2006;2:e95. doi: 10.1371/journal.pcbi.0020095. [DOI] [PMC free article] [PubMed] [Google Scholar]
Associated Data
This section collects any data citations, data availability statements, or supplementary materials included in this article.