

Abstract
Genetic linkage maps are fundamental resources that enable diverse genetic and genomic approaches, including quantitative trait locus (QTL) analyses and comparative studies of genome evolution. It is straightforward to build linkage maps for species that are amenable to laboratory culture and genetic crossing designs, and that have relatively small genomes and few chromosomes. It is more difficult to generate linkage maps for species that do not meet these criteria. Here, we introduce a method to rapidly build linkage maps for salamanders, which are known for their enormous genome sizes. As proof of principle, we developed a linkage map with thousands of molecular markers (N=2349) for the Eastern newt (Notophthalmus viridescens). The map contains 12 linkage groups (152.3–934.7cM), only one more than the number of chromosome pairs. Importantly, this map was generated using RNA isolated from a single wild caught female and her 28 offspring. We used the map to reveal chromosome-scale conservation of synteny among N. viridescens, A. mexicanum (Urodela), and chicken (Amniota), and to identify large conserved segments between N. viridescens and Xenopus tropicalis (Anura). We also show that met1, a major effect QTL that regulates the expression of alternate metamorphic and paedomorphic modes of development in Ambystoma, associates with a chromosomal fusion that is not found in the N. viridescens map. Our results shed new light on the ancestral amphibian karyotype and reveal specific fusion and translocation events that shaped the genomes of three amphibian model taxa. The ability to rapidly build linkage maps for large salamander genomes will enable genetic and genomic analyses within this important vertebrate group, and more generally, empower comparative studies of vertebrate biology and evolution.
Keywords: Salamander, Newt, Genome, Evolution, Linkage Map
INTRODUCTION
From the dawn of science to present, amphibians have greatly enriched our understanding of biology. In part, this reflects the amazing diversity of phenotypes that are expressed within and among amphibian species. For example, just among salamanders three different life cycles are observed, including direct development, indirect development/metamorphosis, and paedomorphosis, which is not observed in any other vertebrate group. Early studies of these different life cycles yielded theories for how phenotypes arise and evolve as a result of changes in developmental timing –heterochrony (Gould, 1977). More recently in the example of salamander paedomorphosis, heterochrony was shown to depend upon thyroid-hormone responsive alleles that segregate among quantitative trait loci (QTL) (Page et al., 2013; Voss and Shaffer, 1997; Voss and Smith, 2005). Almost certainly this model system will be expanded upon in the future to enrich understanding of evolution, as will countless other amphibian models that are best suited for developmental studies.
In addition to the identification of developmental timing QTL in the example above the Ambystoma linkage map has permitted the identification of genomic regions contributing to sex determination and tail regeneration (Smith and Voss, 2009; Voss et al., 2013). Linkage maps are valuable resources that not only facilitate the identification of QTL and mapped-based cloning, they are also useful for reconstructing the evolution of chromosomal rearrangements and chromosome number. Comparative mapping studies have leveraged the Ambystoma linkage map to reveal insights about vertebrate genome evolution (Smith and Voss, 2006; Voss et al., 2011; Voss et al., 2001). These studies found extensive conservation of microchromosomes and chromosomal segments from the tetrapod ancestor and independent decreases in chromosome number among lineages leading to Ambystoma, Xenopus and mammals. Similarly, comparative FISH mapping within the genus Xenopus identified a relatively small number of rearrangement events that have occurred over the last ~60 MY of evolution in the Xenopus lineage, including one inversion in X. tropicalis, inversions on two paralogous chromosomes in X. laevis and one fusion (involving orthologs of X. tropicalis chromosomes 9 and 10) that predated a whole genome duplication in the X. laevis lineage (Uno et al., 2013). While these studies have shed light on the deep evolutionary history of vertebrate genomes and shallower patterns within the Xenopus lineage, they only represent a small number of lineages with relatively derived karyotypes. As such, data from additional species are needed to reconstruct chromosome evolution in amphibian and basal vertebrate lineages.
Amphibian genomes exhibit substantial variation in DNA content, with salamander lineages presenting exceptionally large genomes relative to other extant tetrapods. Estimates of salamander genome sizes range from 10 – 120 gigabases (Gregory, 2015; Smith et al., 2009), with the smallest salamander genome exceeding the size of the largest anuran genome. Because all salamanders have large to extremely large genomes, it seems likely that genome size increased in the basal lineage that gave rise to all extant salamanders, between ~300 and 180 MYA (Hedges et al., 2015; Keinath et al., 2015; Zhang and Wake, 2009). This increase in size is thought to reflect an ancient expansion of repetitive DNA sequences (Keinath et al., 2015). This expansion appears to have affected salamander genome structure in a global sense because introns, intergenic regions and linkage map size are dramatically expanded in the axolotl (Smith et al., 2005; Smith et al., 2009; Voss et al., 2011). Interestingly, genome expansion does not appear to influence the rate of chromosome evolution. Relatively few interchromosomal rearrangements are predicted for the axolotl genome during evolution, in stark contrast to what is predicted for mammalian chromosomes and especially rodents (Smith and Voss 2006).
While analysis of a few amphibian genomes has shed critical light on the biology and evolutionary history of vertebrate genomes, it is important to recognize that our current understanding of amphibian (and vertebrate) genome evolution is based on information from a relatively small number of species. This is due, in part, to the inherent challenges of generating controlled crosses for amphibians because many species are not amenable to the establishment of laboratory stocks. Also, in the case of salamanders, the construction of gene-anchored linkage maps is made more difficult by the enormous size of the genome. Large salamander genomes contain approximately the same number of genes as other vertebrates (Gregory, 2015; Smith et al., 2009). To move toward a more comprehensive understanding of vertebrate karyotype evolution, we sought to develop an approach that permits the rapid construction of robust gene-anchored maps and circumvents the need to maintain living laboratory stocks.
Here we report the first high-density gene-anchored linkage map for the Eastern newt (Notophthalamus viridescens: the second for any salamander) and use this map to refine our understanding of the tempo and mode of karyotype evolution in the amphibian lineage. The ancestral lineages that gave rise to newt and Ambystoma mexicanum (axolotl) diverged ~150 million years ago (MYA) and ~150 MY after the frog/salamander divergence (Figure 1). The construction of this map leveraged RNA sequencing data to identify a large number of SNPs segregating within genic regions, which permit the phasing of polymorphisms and the construction of a map from the offspring of a single outbred female. Analysis of conserved syntenies between newt and other vertebrates revealed a small number of fusions that occurred prior to the divergence of ancestral amphibian lineages that gave rise to frogs and salamanders, in the axolotl/newt ancestor and still others that occurred after the divergence of salamander and newt. Notably one fusion that occurred in the Ambystoma lineage co-localized with a major effect QTL that regulates developmental timing the expression of alternate, metamorphic vs. paedomorphic, life histories (met1: (Page et al., 2013; Voss and Shaffer, 1997; Voss and Smith, 2005).
Figure 1. An abridged vertebrate phylogeny showing estimated divergence times between species included in this study (newt, axolotl, Xenopus and chicken).
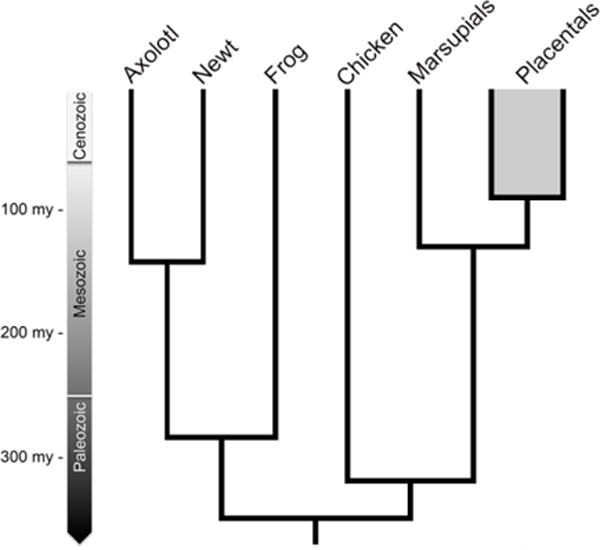
The ancestral lineages that gave rise to axolotl and newt diverged in the mid-Mesozoic and the ancestral lineages that gave rise to salamanders and frogs diverged in the late-Paleozoic. Estimated divergence dates are from (Hedges et al., 2015). The eutherian/placental divergence is included to provide perspective on the newt/axolotl divergence. Several extant taxa are not shown, including caecilians and non-avian reptiles.
MATERIALS and METHODS
Newt Collection, Embryo Sampling, RNA Extraction and Sequencing
Male and female newts were collected from a pond near the head of Gray’s Arch trail in Kentucky’s Red River Gorge under Kentucky Department of Fish and Wildlife educational collection permit number SC1311325. Females were kept in 5 gallon buckets containing water and live plants from the same pond. Eggs were collected each morning and kept in crystallization dishes with 20% Holtfreter’s solution at 20°C. One of these females produced 29 eggs, all of which developed normally until the date they were sampled at approximately 14 days of development (prior to hatching). Embryos were dechorionated using fine tip forceps and immediately placed in 1.7 ml tubes with RNAlater® (ThermoFisher Scientific AM7020). RNA was extracted from several tissues from this female (blood, liver, spleen, heart, eyes, brain and skin from the dorsal surface of the head) and from individual whole embryos, using standard trizol extraction.
The RNA extracted was assessed for quality on a bioanalyzer (Agilent 2100 Bioanalyzer; Agilent RNA 6000 Nano Kit). Samples were sent to Hudson Alpha Institute for Biotechnology (Huntsville, AL) where libraries were prepared and barcoded with 36 unique tags and sequenced (100bp paired end reads) on a single lane using Illumina HiSeq 2000. One embryo sample yielded less than 500ng of RNA and was underrepresented in the resulting sequence dataset. Sequence data are deposited at the NCBI short read archives (http://www.ncbi.nlm.nih.gov/sra) under accession number SRP067290, BioProject # PRJNA305738.
Genotyping and Linkage Analysis
To identify and genotype polymorphisms segregating within this family, we mapped RNAseq reads to the published newt transcriptome using bwa-0.7.5a (Li and Durbin, 2009), performed de-duplication using picard-tools-1.97 (http://broadinstitute.github.io/picard) and genotype calling using the HaplotypeCaller pipeline in GATK-2.7 (Looso et al., 2013; McKenna et al., 2010). Genotypes were post-filtered to include only those markers with presumptive maternal or paternal polymorphisms segregating among the 28 embryos sequenced for this study, that had variant quality scores greater equal to or greater than 100 and that were represented by a minimum of 4 reads in all individuals. For each transcript, the polymorphism with the highest variant quality score was used in subsequent linkage analyses.
Although maternity was known for all individuals, the matings that produced these offspring presumably occurred before the maternal individual was placed in isolation. To test for multiple paternities, we calculated the Jaccard distance for multilocus paternal genotypes between each pair of the 28 offspring using the “Similarity of Individuals” summary generated by JoinMap (Van Ooijen, 2011). These analyses revealed two distinct clusters, one cluster consisting of 18 individuals and a second consisting of 10 individuals, indicative of mixed parentage (paternity; Supplementary Table 1). These relationships were further verified by calculation of relatedness statistics using the relatedness2 function of VCFtools (Danecek et al., 2011) (Supplementary Table 1). As such, only the group of 18 presumably full sibs was used to estimate male meiotic recombination rates (the paternal map). All siblings were used to estimate recombination rates during female meiosis (the maternal map). Given the small number of meioses, the paternal map was only used for cross-validation of the maternal map.
Linkage analysis was performed via maximum likelihood mapping using JoinMap software package and default parameters, except that the number of optimization rounds was increased to ten to improve ordering of markers (Stam, 1993; Van Ooijen, 2011). This approach yielded 3,142 markers (transcripts) that segregated one or more maternal polymorphisms, of which 2,349 could be confidently placed on the maternal map and 6,546 markers that segregated candidate paternal polymorphisms. Linkage groups (LGs) containing at least 50 markers linked at a minimum LOD score (log of odds) of 3.0 were considered in downstream analyses. Linkage groups were manually curated to break linkages at >30 cM, except in one case where markers within a large syntenic block were within 35 cM and synteny was supported by sequence data from individual laser captured chromosomes. Patterns of linkage were further evaluated using the software suite Lep-MAP2 using default settings and increasing the number of optimization rounds to ten in order to best match parameters used in JoinMap (Rastas et al., 2016). These analyses largely recapitulate patterns of linkage generated by JoinMap (including suspect joins that were broken by manual curation), except that bi-allelic and tetra-allelic markers from the same linkage group (and component transcripts) were frequently assigned to distinct Lep-MAP2 linkage groups (Supplementary Tables 2 and 3).
A similar F1 outbred mapping strategy has been successfully used to generate dense meiotic maps for several other species using the RAD-seq approach (rather than RNAseq data) to identify polymorphisms from genomic DNA (Amores et al., 2011; Kai et al., 2014; Palaiokostas et al., 2013; Smith and Keinath, 2015; You et al., 2013). Subsampling experiments have demonstrated that this approach permits the construction of accurate meiotic maps using as few as 20 offspring (Amores et al., 2011).
Laser Capture Chromosome Sequencing
To more accurately assess the LGs and inform potential breaks in the larger maternal LGs, we performed low-coverage shotgun sequencing of a small number of laser captured chromosomes. Chromosome preparations, spreads, staining, capture and amplification were generated with the same methods described for axolotl (Keinath et al., 2015) with a few modifications: newts were dechorionated shortly after late neurula stage of development, embryos were dechorionated in 40% Holtfreter’s solution to account for the higher internal pressure of chorionic fluid, and chromosome spreading was performed in a high-humidity chamber held at 60°C (Keinath et al., 2015). We collected 24 individual chromosomes using laser capture microdissection as previously done in salamander (Keinath et al., 2015). Library preparation was performed using a Rubicon whole genome amplification (WGA) PicoPLEX™ DNA-seq (R300381), a bioanalyzer was used to check for presence of DNA, and resulting amplicons were sequenced on a HiSeq 2000 platform at Hudson Alpha Institute for Biotechnology. Sequences were demultiplexed and trimmed to remove leader sequences that were incorporated during amplification and common contaminants (e.g. PhiX) using Trimmomatic 30.2 (Bolger et al., 2014). These remaining high quality reads were aligned to the human genome using a paired-end mapping mode in Bowtie 2 (Hormozdiari et al., 2011) to detect potential human contaminants. Reads that aligned to human were removed from those libraries in which more than 10% of total reads mapped to human. The trimmed sequence libraries consisted of 210 million read pairs, averaging 8.8 million read pairs per library (minimum = 0.1 million, maximum = 15.4 million). Sequence data are deposited at the NCBI short read archives (http://www.ncbi.nlm.nih.gov/sra) under accession number SRP072907, BioProject # PRJNA317478. In order to evaluate these chromosomal libraries, reads were aligned to the newt transcriptome using single-end mapping mode via BWA-MEM (v.0.7.10) (Li and Durbin, 2009).
Comparative Mapping/Conserved Synteny
The complete set of transcripts that were assigned to newt LGs was used to query the set of transcripts that have been placed on the Ambystoma meiotic map, and masked genome assemblies for chicken and X. tropicalis, using tblastx (Altschul et al., 1990). The best matching sequence was considered the most likely ortholog (broad sense) for each newt transcript provided: 1) alignment was ≥ 40 amino acids, 2) alignment bitscore was ≥100 and 3) the aligning sequences had at least 40% amino acid identity. The percent identity cutoff was chosen by examining the distribution of percent identity statistics among all best blast hits between newt and chicken (Supplementary Figure 1). Counts of orthologs on each pairwise combination of linkage groups or chromosomes were compared to expected values derived from randomly distributing orthologies across linkage groups and chromosomes with the same number of mapped loci. In order to detect statistically significant regions of conserved synteny (and control for potential ortholog miscalls), the distribution of orthologs was assessed using chi-square tests with Yates’ correction for continuity and Bonferroni corrections for multiple testing as previously described (Smith and Keinath, 2015).
RESULTS and DISCUSSION
One lane of Illumina RNAseq data (2 × 100 bp) was generated for 35 barcoded and pooled samples; 28 newt embryos and 7 adult tissues. In total, this sequencing run yielded 43.7 Gb of raw sequence data. These sequences were used to identify segregating polymorphisms by alignment to 120,922 previously characterized newt transcripts (Looso et al., 2013). A total of 6,460 candidate segregating maternal polymorphisms were identified on 3,142 transcripts. A total of 2,349 transcripts could be confidently placed on a set of 8 LGs with at least 50 markers linked at a minimum LOD score (log of odds) of 3.0 (Looso et al., 2013). After initial map construction, newt linkage groups were examined to identify gaps exceeding 30 cM. In cases where conserved syntentic blocks or low-pass laser-capture chromosome sequencing data did not support linkage, linkage analyses were performed separately for the segments flanking these gaps. For one large linkage group, laser-capture chromosome sequencing data indicated that both ends of the linkage group were portions of the same chromosome, exclusive of an ~700 cM internal segment. Reanalysis yielded two well-supported linkage groups (Figure 2, LG1 and LG5; Supplementary Figure 2).
Figure 2. The newt meiotic map.
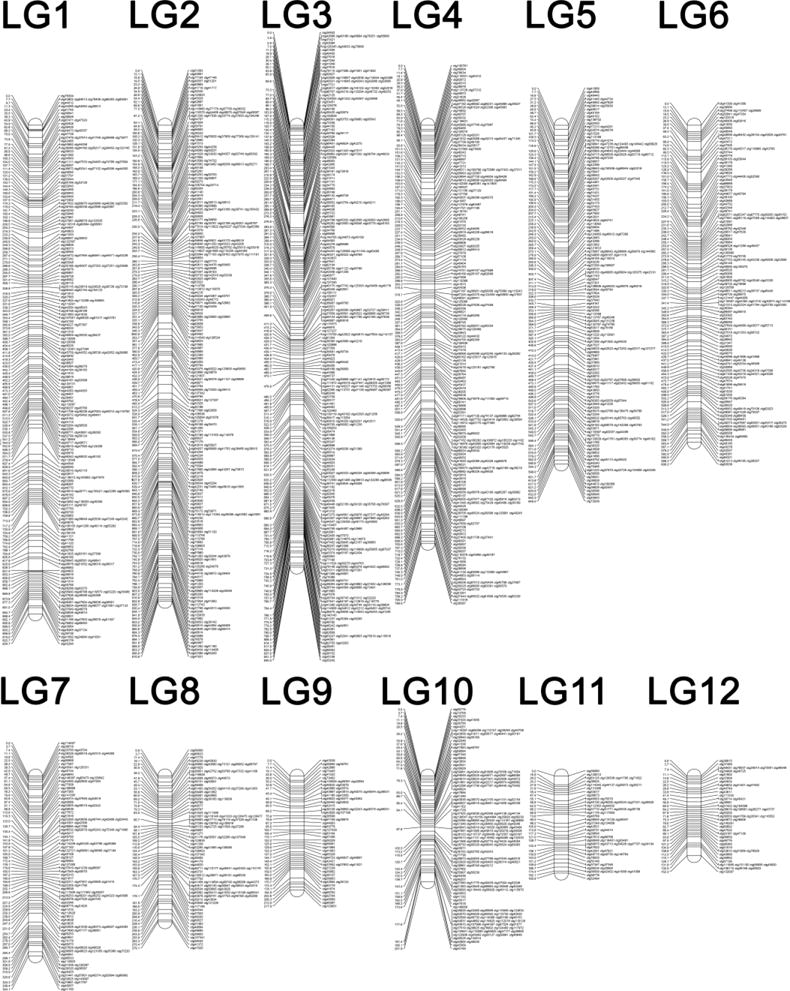
The newt meiotic map consists of 12 linkage groups that range in size form 152.3 to 934.7 centiMorgans (cM) and cover a combined distance of 6,161.9 cM. Marker names refer to previously assembled transcripts (Looso et al., 2013) with “Contig” abbreviated as “ctg”. Distances are shown in cM. Linkage groups are ordered with respect to estimated length, in cM.
The curated linkage map resolves 12 linkage groups; a number one greater than the haploid number of chromosomes in the newt karyotype and spans a total of 6,161.9 cM, with the largest group spanning 934.7 cM and the smallest spanning 152.3 cM (Figure 2, Supplementary Table 4). Although our sibship sampling strategy (and the reproductive biology of N. viridescens) permitted sampling of a modest number of meioses, our marker sampling strategy yielded dense sampling across chromosomes: the average number of recombinations between adjacent markers is less than 1 (0.73). This high marker density facilitates accurate map reconstruction using robust maximum likelihood algorithms, which leverage genotypic information from several adjacent markers to identify linkage groups and order markers, effectively minimizing the impact of genotyping errors (Stam, 1993; Van Ooijen, 2011). Cross validation of maternal and paternal genetic maps, patterns of conserved synteny and chromosome library alignments provided additional support for the grouping and ordering of markers that were incorporated into the final map (see below). In total, our low-coverage laser capture sequence data support six linkage groups as corresponding to discrete chromosomes (LGs 1, 2, 8, 9, 10 11), whereas other chromosomes could not be directly resolved at current sampling depths (Supplementary Figure 3). The relatively large size of the newt linkage map and individual LGs is consistent with previous linkage analyses in another salamander species (Ambystoma) and microscopic observations of chiasmata in salamander oocytes (Callan, 1966; Smith et al., 2005; Voss et al., 2011). As such, the large recombinational size of the newt linkage map lends support to the idea that the ancestral salamander genome expansion resulted in a proportional increase in rates of meiotic recombination (Smith et al., 2005; Voss et al., 2011).
Comparison of newt, Ambystoma, Xenopus and chicken genomes revealed extensive conservation of chromosomal segments across all taxa (Figure 2, Supplementary Tables 5–9). Examining homolog sampling depth across chicken chromosomes reveals uniform patterns of coverage across most 10 Mb intervals (newt homologs were mapped for ~10% of chicken loci sampled per interval), with the exception of the distal region of chicken chromosome 2, which was sampled at ~1/2 the average frequency (Supplementary Figure 4). As previously observed, many conserved segments correspond to large portions of chicken macrochromosomes or entire microchromosomes. Previous analyses showed that these segments and microchromosomes were derived from individual chromosomes that trace their ancestry at least to the common ancestor of all bony vertebrates (Braasch et al., 2016; Venkatesh et al., 2014; Voss et al., 2011). By examining the distribution of these conserved segments in newt, Ambystoma and Xenopus, it is possible to reconstruct several evolutionary events that define the karyotypes of these three model amphibian taxa (Table 1).
Table 1. Fusions detected in amphibian lineages.
Numbers provided in the columns “Newt” “Axolotl” and “Xenopus” correspond to the derived chromosome or linkage group that contains the segments listed in the column “Fused Chicken Chromosomes”. In several cases multiple fusions are observed to occur within a single lineage such that the ordering cannot be resolved with the available taxa. We assume that these are derived from two (e.g. 5/10/23) or three (e.g. 1/19/23/26) independent fusion events that occurred within a single ancestral or derived lineage. Groups of chromosomes enclosed by parentheses represent presumptive ancestral fusions that experienced additional fusion events in individual (newt, axolotl, or Xenopus) lineages.
| Fused Chicken Chromosomes | Newt | Ambystoma | Xenopus |
|---|---|---|---|
| 4/Z | 5 | 8 | 1 |
| 5/10/23 | 2 | 6 | – |
| 11/25/28 | 3 | 1 | – |
| 13/18/20 | 3 | 3 | – |
| 17/21 | 4 | 16 | – |
| 26/27 | 4 | 15 | – |
| 2/14 | 6 | 2 | – |
| 7/19/24 | 7 | 9 | – |
| 9/15/22 | 10 | 4 | – |
| 1/8 | 1 | – | – |
| 3/(5/10/23) | 2 | – | – |
| (11/25/28)/(13/18/20) | 3 | – | – |
| 6/(17/21)/(26/27) | 4 | – | – |
| 5/12 | 8 | – | – |
| 8/(11/25/28) | – | 1 | – |
| 12/(2/14) | – | 2 | – |
| 3/(9/15/22) | – | 4 | – |
| 15/28/(4/Z) | – | – | 1 |
| 1/19/23/26 | – | – | 2 |
| 1/10/13/22 | – | – | 3 |
| 5/8/11/12 | – | – | 4 |
| 3/9 | – | – | 5 |
| 2/20 | – | – | 6 |
| 6/21/24 | – | – | 7 |
| 4/5/17/25 | – | – | 8 |
| 7/14 | – | – | 9 |
| 18/27 | – | – | 10 |
In general, fusions in salamander and frog (Xenopus) lineages appear to be largely independent, with the exception of one ancestrally conserved linkage (GG4/Z). Notably, segments of GG4 and GGZ are syntenic on two gar chromosomes and on several scaffolds in coelacanth, indicating that this linkage may have existed in the common ancestor of all bony vertebrates as indicated by earlier comparative genomic studies (Amemiya et al., 2013; Braasch et al., 2016; Voss et al., 2001). Alternatively, this pair of chromosomes might have experienced recurrent fusions in several basal vertebrate taxa. The patterns of conserved synteny in amphibians indicate that a relatively small number of fusions (perhaps none) occurred within the ancestral amphibian lineage, an interpretation that is consistent with the observation of chicken-like karyotypes within basal frog and salamander lineages (Sessions, 2008) and suggests that the relatively compact karyotypes of Xenopus (1N = 10) and newt (1N = 11) are largely the product of convergent evolution.
These findings appear to be consistent with cytogenetic studies that showed amphibian genomes to vary considerably in structure and content, including chromosome number, size and morphology (Duellman and Trueb, 1986; Green and Sessions, 1991; Morescalchi et al., 1974; Vinogradov, 1998). Caecilian karyotypes vary from asymmetric-bimodal karyotypes with higher numbers of chromosomes to symmetric-unimodal karyotypes with fewer chromosomes (Nussbaum and Wilkinson, 1989; Sessions, 2008). Among amphibians, several basal lineages possess karyotypes characterized by the presence of both micro- and macrochromosomes (e.g. Cryptobranchid salamanders and the tailed frog Ascaphus truei), whereas other taxa possess karyotypes consisting of a small number of macrochromosomes and no microchromosomes (e.g. Xenopus tropicalis: 1N = 10) (Duellman and Trueb, 1986; Sun and Mueller, 2014; Wickbom, 1950). Similar to X. tropicalis, the Mexican axolotl (Ambystoma mexicanum) and Eastern newt (Notophthalmus viridescens) possess karyotypes consisting of relatively small numbers of macrochromosomes and no microchromosomes (1N = 14 and 11, respectively) (Humphrey, 1975; Hutchison and Pardue, 1975; Voss et al., 2011). These patterns suggest the ancestral amphibian karyotype consisted of a large number of chromosomes with two distinct morphologies, both macro- and microchromosomes, with more compact karyotypes representing derived states (Morescalchi et al., 1973; Morescalchi et al., 1974; Sessions, 2008).
Our results suggest that relatively more fusions occurred after the divergence of the ancestral lineages that gave rise to frogs and salamanders, than occurred in basal amphibian lineages. The comparative mapping data from newt allows us to better resolve the timing of several fusion events that occurred within the salamander lineage. The majority of fusions in newt (13/19) and Ambystoma (13/16) appear to have occurred before the divergence of their ancestral lineages, approximately 150–160 MYA (Table 1). The larger number of fusions in the newt lineage appears to be sufficient to explain the difference in chromosome number between newt (1N = 11) and Ambystoma (1N = 14). Among the three derived fusions detected in Ambystoma, one (corresponding to orthologous segments of newt LGs 6 and 8) is particularly notable with respect to the co-localization of it’s fusion boundary with met1, a major QTL that has a strong influence on both metamorphic timing and expression of metamorphic vs. paedomorphic life histories (Figure 4) (Voss et al., 2012). The evolutionary perspective provided by the newt meiotic map dramatically improves our understanding of the timing of this event and places an upper limit on the age of this fusion at ~150 MYA. Notably, the genus Ambystoma is characterized by a highly uniform karyotype (1N = 14), suggesting a likely lower bound at the base of the Ambystoma clade (~50 MYA) (Licht and Lowcock, 1991; Morescalchi et al., 1974).
Figure 4. Comparative mapping of the met1 containing linkage group (AM2).
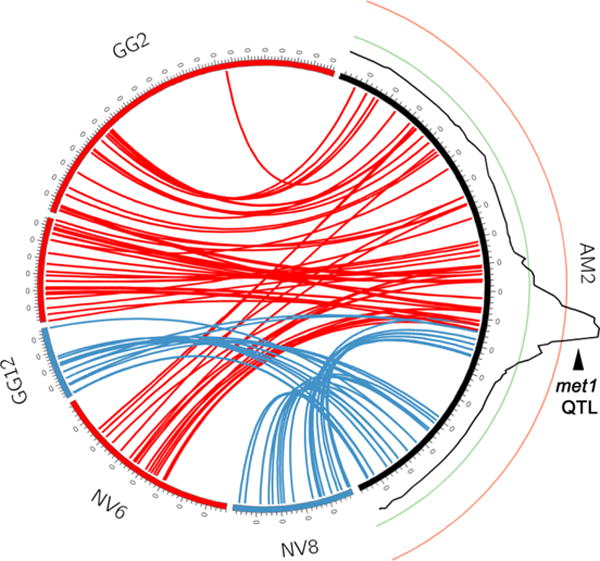
Comparative maps showing the location of presumptive Ambystoma orthologs on newt and chicken chromosomes. Lines connecting orthologous genes that are predicted to lie on newt linkage group 6 (NV6) are labeled in red and lines connecting orthologous genes that are predicted to lie on newt linkage group 8 (NV8) are labeled in blue. The log of odds profile for association between individual genotype and expression of metamorphic vs. paedomorphic life history is depicted as a black line adjacent to AM2 (Page et al., 2013). Green and red lines correspond to log of odds ratios of 3 and 10, respectively.
Resolving the precise timing of fusions in the amphibian lineage (including, the fusion that overlaps met1) and other rearrangements will require the generation of chromosome scale linkage data for several additional amphibian taxa, including several lineages that are not amenable to laboratory culture and possess genome sizes that exceed the salamander species represented here. Our mapping strategy represents one approach that should permit the rapid generation of linkage maps for any taxon wherein fresh tissues can be collected from a small group of siblings and at least one parent.
SUMMARY
We have generated the first high-density gene-anchored linkage map for Notophthalmus viridescens by generating a maternal meiotic map consisting of 2,349 expressed markers, using offspring derived from a single wild-caught female. The number of LGs equals one more than the haploid chromosome number in N. viridescens (Hutchison and Pardue, 1975). Comparative maps with newt to other amphibians (Xenopus and Ambystoma) and chicken reveal strong conservation of chromosome-scale synteny across evolutionary time. These syntenic blocks allow us to better resolve the evolutionary history of vertebrate genomes and chromosomes. Moreover, the current study serves as proof of principle for one approach that can be used to rapidly generate chromosome-scale and gene-anchored linkage maps for taxa that have been previously considered intractable.
Supplementary Material
Figure 3. Salamander comparative maps reveal fusions fissions and translocations that define the karyotypes of three model amphibian taxa.
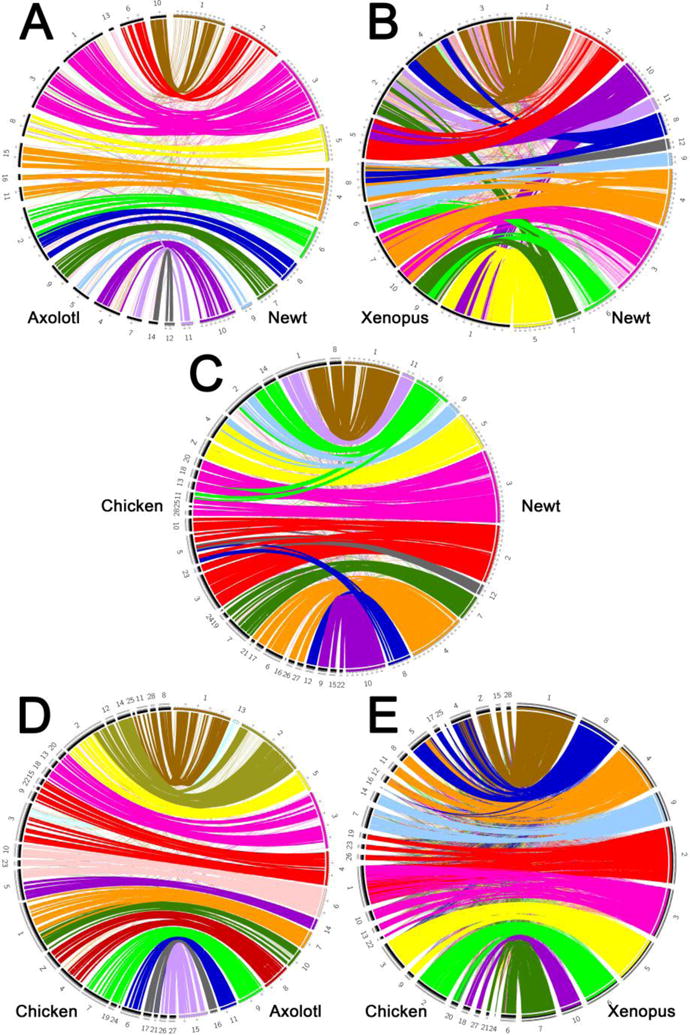
Comparative maps showing the location of presumptive orthologs in A) axolotl and newt, B) Xenopus and newt, C) chicken and newt, D) axolotl and chicken, and E) Xenopus and chicken. Lines connecting orthologs are colored according to their location in the newt (A–C), axolotl (D) or Xenopus (E) genome. Bold lines connect presumptive orthologs that exist with statistically significant conserved syntenic regions.
HIGHLIGHTS.
A dense linkage map was generated for Notophthalmus viridescens (newt).
RNAseq data from an outbred female and 28 offspring were used to generate this map.
Comparative mapping reveals conserved segments in chicken, axolotl and frog.
Analyses shed light on the evolution of ancestral and derived amphibian karyotypes.
The met1 QTL associates with a derived chromosomal fusion in Ambystoma.
Acknowledgments
This work was funded by grants from the National Institutes of Health (NIH) (R24OD010435 and EY10540) and Department of Defense (DOD) (W911NF1110475). The contents of this paper are solely the responsibility of the authors and do not necessarily represent the official views of NIH or DOD.
Footnotes
Publisher's Disclaimer: This is a PDF file of an unedited manuscript that has been accepted for publication. As a service to our customers we are providing this early version of the manuscript. The manuscript will undergo copyediting, typesetting, and review of the resulting proof before it is published in its final citable form. Please note that during the production process errors may be discovered which could affect the content, and all legal disclaimers that apply to the journal pertain.
References
- Altschul SF, Gish W, Miller W, Myers EW, Lipman DJ. Basic local alignment search tool. J Mol Biol. 1990;215:403–410. doi: 10.1016/S0022-2836(05)80360-2. [DOI] [PubMed] [Google Scholar]
- Amemiya CT, Alfoldi J, Lee AP, Fan S, Philippe H, Maccallum I, Braasch I, Manousaki T, Schneider I, Rohner N, Organ C, Chalopin D, Smith JJ, Robinson M, Dorrington RA, Gerdol M, Aken B, Biscotti MA, Barucca M, Baurain D, Berlin AM, Blatch GL, Buonocore F, Burmester T, Campbell MS, Canapa A, Cannon JP, Christoffels A, De Moro G, Edkins AL, Fan L, Fausto AM, Feiner N, Forconi M, Gamieldien J, Gnerre S, Gnirke A, Goldstone JV, Haerty W, Hahn ME, Hesse U, Hoffmann S, Johnson J, Karchner SI, Kuraku S, Lara M, Levin JZ, Litman GW, Mauceli E, Miyake T, Mueller MG, Nelson DR, Nitsche A, Olmo E, Ota T, Pallavicini A, Panji S, Picone B, Ponting CP, Prohaska SJ, Przybylski D, Saha NR, Ravi V, Ribeiro FJ, Sauka-Spengler T, Scapigliati G, Searle SM, Sharpe T, Simakov O, Stadler PF, Stegeman JJ, Sumiyama K, Tabbaa D, Tafer H, Turner-Maier J, van Heusden P, White S, Williams L, Yandell M, Brinkmann H, Volff JN, Tabin CJ, Shubin N, Schartl M, Jaffe DB, Postlethwait JH, Venkatesh B, Di Palma F, Lander ES, Meyer A, Lindblad-Toh K. The African coelacanth genome provides insights into tetrapod evolution. Nature. 2013;496:311–316. doi: 10.1038/nature12027. [DOI] [PMC free article] [PubMed] [Google Scholar]
- Amores A, Catchen J, Ferrara A, Fontenot Q, Postlethwait JH. Genome evolution and meiotic maps by massively parallel DNA sequencing: spotted gar, an outgroup for the teleost genome duplication. Genetics. 2011;188:799–808. doi: 10.1534/genetics.111.127324. [DOI] [PMC free article] [PubMed] [Google Scholar]
- Bolger AM, Lohse M, Usadel B. Trimmomatic: a flexible trimmer for Illumina sequence data. Bioinformatics. 2014;30:2114–2120. doi: 10.1093/bioinformatics/btu170. [DOI] [PMC free article] [PubMed] [Google Scholar]
- Braasch I, Gehrke AR, Smith JJ, Kawasaki K, Manousaki T, Pasquier J, Amores A, Desvignes T, Batzel P, Catchen J, Berlin AM, Campbell MS, Barrell D, Martin KJ, Mulley JF, Ravi V, Lee AP, Nakamura T, Chalopin D, Fan S, Wcisel D, Canestro C, Sydes J, Beaudry FE, Sun Y, Hertel J, Beam MJ, Fasold M, Ishiyama M, Johnson J, Kehr S, Lara M, Letaw JH, Litman GW, Litman RT, Mikami M, Ota T, Saha NR, Williams L, Stadler PF, Wang H, Taylor JS, Fontenot Q, Ferrara A, Searle SM, Aken B, Yandell M, Schneider I, Yoder JA, Volff JN, Meyer A, Amemiya CT, Venkatesh B, Holland PW, Guiguen Y, Bobe J, Shubin NH, Di Palma F, Alfoldi J, Lindblad-Toh K, Postlethwait JH. The spotted gar genome illuminates vertebrate evolution and facilitates human-teleost comparisons. Nat Genet. 2016;48:427–437. doi: 10.1038/ng.3526. [DOI] [PMC free article] [PubMed] [Google Scholar]
- Callan HG. Chromosomes and nucleoli of the axolotl, Ambystoma mexicanum. J Cell Sci. 1966;1:85–108. doi: 10.1242/jcs.1.1.85. [DOI] [PubMed] [Google Scholar]
- Danecek P, Auton A, Abecasis G, Albers CA, Banks E, DePristo MA, Handsaker RE, Lunter G, Marth GT, Sherry ST, McVean G, Durbin R, Genomes Project Analysis, G The variant call format and VCFtools. Bioinformatics. 2011;27:2156–2158. doi: 10.1093/bioinformatics/btr330. [DOI] [PMC free article] [PubMed] [Google Scholar]
- Duellman WE, Trueb L. Biology of Amphibians. McGraw-Hill; New York: 1986. [Google Scholar]
- Gould SJ. Ontogeny and Phylogeny. Belknap Press of Harvard University Press; Cambridge, MA: 1977. [Google Scholar]
- Green DM, Sessions SK. Amphibian Cytogenetics and Evolution. J Evol Biol. 1991;6:300–302. [Google Scholar]
- Gregory TR. Animal Genome Size Database 2015 [Google Scholar]
- Hedges SB, Marin J, Suleski M, Paymer M, Kumar S. Tree of Life Reveals Clock-Like Speciation and Diversification. Mol Biol Evol. 2015;32:835–845. doi: 10.1093/molbev/msv037. [DOI] [PMC free article] [PubMed] [Google Scholar]
- Hormozdiari F, Hach F, Sahinalp SC, Eichler EE, Alkan C. Sensitive and fast mapping of di-base encoded reads. Bioinformatics. 2011;27:1915–1921. doi: 10.1093/bioinformatics/btr303. [DOI] [PMC free article] [PubMed] [Google Scholar]
- Humphrey R. The Axolotl, Ambystoma mexicanum. In: King R, editor. Handbook of Genetics. Springer; US: 1975. pp. 3–17. [Google Scholar]
- Hutchison N, Pardue ML. The mitotic chromosomes of Notophthalmus (=Triturus) viridescens: localization of C banding regions and DNA sequences complementary to 18S, 28S and 5S ribosomal RNA. Chromosoma. 1975;53:51–69. doi: 10.1007/BF00329390. [DOI] [PubMed] [Google Scholar]
- Kai W, Nomura K, Fujiwara A, Nakamura Y, Yasuike M, Ojima N, Masaoka T, Ozaki A, Kazeto Y, Gen K, Nagao J, Tanaka H, Kobayashi T, Ototake M. A ddRAD-based genetic map and its integration with the genome assembly of Japanese eel (Anguilla japonica) provides insights into genome evolution after the teleost-specific genome duplication. BMC Genomics. 2014;15:233. doi: 10.1186/1471-2164-15-233. [DOI] [PMC free article] [PubMed] [Google Scholar]
- Keinath MC, Timoshevskiy VA, Timoshevskaya NY, Tsonis PA, Voss SR, Smith JJ. Initial characterization of the large genome of the salamander Ambystoma mexicanum using shotgun and laser capture chromosome sequencing. Scientific reports. 2015;5:16413. doi: 10.1038/srep16413. [DOI] [PMC free article] [PubMed] [Google Scholar]
- Li H, Durbin R. Fast and accurate short read alignment with Burrows-Wheeler transform. Bioinformatics. 2009;25:1754–1760. doi: 10.1093/bioinformatics/btp324. [DOI] [PMC free article] [PubMed] [Google Scholar]
- Licht LE, Lowcock LA. Genome Size and Metabolic-Rate in Salamanders. Comp Biochem Phys B. 1991;100:83–92. [Google Scholar]
- Looso M, Preussner J, Sousounis K, Bruckskotten M, Michel CS, Lignelli E, Reinhardt R, Hoffner S, Kruger M, Tsonis PA, Borchardt T, Braun T. A de novo assembly of the newt transcriptome combined with proteomic validation identifies new protein families expressed during tissue regeneration. Genome Biol. 2013;14:R16. doi: 10.1186/gb-2013-14-2-r16. [DOI] [PMC free article] [PubMed] [Google Scholar]
- McKenna A, Hanna M, Banks E, Sivachenko A, Cibulskis K, Kernytsky A, Garimella K, Altshuler D, Gabriel S, Daly M, DePristo MA. The Genome Analysis Toolkit: a MapReduce framework for analyzing next-generation DNA sequencing data. Genome Res. 2010;20:1297–1303. doi: 10.1101/gr.107524.110. [DOI] [PMC free article] [PubMed] [Google Scholar]
- Morescalchi A, Galgano M, Gargiulo G. Effects of cold and colcemid on the chromosomes of the fire-bellied toad, Bombina variegata pachypus Bonaparte. Riv Biol. 1973;66:183–214. [PubMed] [Google Scholar]
- Morescalchi A, Olmo E, Serra V. Chromosomes and DNA of the ambystomatoid salamanders. Experientia. 1974;30:619–620. doi: 10.1007/BF01921505. [DOI] [PubMed] [Google Scholar]
- Nussbaum RA, Wilkinson M. On the Classification and Phylogeny of Caecilians (Amphibia: Gymnophiona), a critical review. Herpetological Monographs. 1989;3:1–42. [Google Scholar]
- Page RB, Boley MA, Kump DK, Voss SR. Genomics of a metamorphic timing QTL: met1 maps to a unique genomic position and regulates morph and species-specific patterns of brain transcription. Genome biology and evolution. 2013;5:1716–1730. doi: 10.1093/gbe/evt123. [DOI] [PMC free article] [PubMed] [Google Scholar]
- Palaiokostas C, Bekaert M, Davie A, Cowan ME, Oral M, Taggart JB, Gharbi K, McAndrew BJ, Penman DJ, Migaud H. Mapping the sex determination locus in the Atlantic halibut (Hippoglossus hippoglossus) using RAD sequencing. BMC Genomics. 2013;14:566. doi: 10.1186/1471-2164-14-566. [DOI] [PMC free article] [PubMed] [Google Scholar]
- Rastas P, Calboli FCF, Guo B, Shikano T, Merilä J. Construction of Ultradense Linkage Maps with Lep-MAP2: Stickleback F2 Recombinant Crosses as an Example. Genome biology and evolution. 2016;8:78–93. doi: 10.1093/gbe/evv250. [DOI] [PMC free article] [PubMed] [Google Scholar]
- Sessions SK. Evolutionary cytogenetics in salamanders. Chromosome Res. 2008;16:183–201. doi: 10.1007/s10577-007-1205-3. [DOI] [PubMed] [Google Scholar]
- Smith JJ, Keinath MC. The sea lamprey meiotic map improves resolution of ancient vertebrate genome duplications. Genome Res. 2015;25:1081–1090. doi: 10.1101/gr.184135.114. [DOI] [PMC free article] [PubMed] [Google Scholar]
- Smith JJ, Kump DK, Walker JA, Parichy DM, Voss SR. A comprehensive expressed sequence tag linkage map for tiger salamander and Mexican axolotl: enabling gene mapping and comparative genomics in Ambystoma. Genetics. 2005;171:1161–1171. doi: 10.1534/genetics.105.046433. [DOI] [PMC free article] [PubMed] [Google Scholar]
- Smith JJ, Putta S, Zhu W, Pao GM, Verma IM, Hunter T, Bryant SV, Gardiner DM, Harkins TT, Voss SR. Genic regions of a large salamander genome contain long introns and novel genes. BMC Genomics. 2009;10:19. doi: 10.1186/1471-2164-10-19. [DOI] [PMC free article] [PubMed] [Google Scholar]
- Smith JJ, Voss SR. Gene order data from a model amphibian (Ambystoma): new perspectives on vertebrate genome structure and evolution. BMC Genomics. 2006;7:219. doi: 10.1186/1471-2164-7-219. [DOI] [PMC free article] [PubMed] [Google Scholar]
- Smith JJ, Voss SR. Amphibian sex determination: segregation and linkage analysis using members of the tiger salamander species complex (Ambystoma mexicanum and A. t. tigrinum) Heredity. 2009;102:542–548. doi: 10.1038/hdy.2009.15. [DOI] [PMC free article] [PubMed] [Google Scholar]
- Stam P. Construction of Integrated Genetic-Linkage Maps by Means of a New Computer Package – Joinmap. Plant J. 1993;3:739–744. [Google Scholar]
- Sun C, Mueller RL. Hellbender genome sequences shed light on genomic expansion at the base of crown salamanders. Genome biology and evolution. 2014;6:1818–1829. doi: 10.1093/gbe/evu143. [DOI] [PMC free article] [PubMed] [Google Scholar]
- Uno Y, Nishida C, Takagi C, Ueno N, Matsuda Y. Homoeologous chromosomes of Xenopus laevis are highly conserved after whole-genome duplication. Heredity (Edinb) 2013;111:430–436. doi: 10.1038/hdy.2013.65. [DOI] [PMC free article] [PubMed] [Google Scholar]
- Van Ooijen JW. Multipoint maximum likelihood mapping in a full-sib family of an outbreeding species. Genet Res (Camb) 2011;93:343–349. doi: 10.1017/S0016672311000279. [DOI] [PubMed] [Google Scholar]
- Venkatesh B, Lee AP, Ravi V, Maurya AK, Lian MM, Swann JB, Ohta Y, Flajnik MF, Sutoh Y, Kasahara M, Hoon S, Gangu V, Roy SW, Irimia M, Korzh V, Kondrychyn I, Lim ZW, Tay BH, Tohari S, Kong KW, Ho SF, Lorente-Galdos B, Quilez J, Marques-Bonet T, Raney BJ, Ingham PW, Tay A, Hillier LW, Minx P, Boehm T, Wilson RK, Brenner S, Warren WC. Elephant shark genome provides unique insights into gnathostome evolution (vol 505, pg 174, 2014) Nature. 2014:513. doi: 10.1038/nature12826. [DOI] [PMC free article] [PubMed] [Google Scholar]
- Vinogradov AE. Genome size and GC-percent in vertebrates as determined by flow cytometry: the triangular relationship. Cytometry. 1998;31:100–109. doi: 10.1002/(sici)1097-0320(19980201)31:2<100::aid-cyto5>3.0.co;2-q. [DOI] [PubMed] [Google Scholar]
- Voss GJ, Kump DK, Walker JA, Voss SR. Variation in salamander tail regeneration is associated with genetic factors that determine tail morphology. PLoS One. 2013;8:e67274. doi: 10.1371/journal.pone.0067274. [DOI] [PMC free article] [PubMed] [Google Scholar]
- Voss SR, Kump DK, Putta S, Pauly N, Reynolds A, Henry RJ, Basa S, Walker JA, Smith JJ. Origin of amphibian and avian chromosomes by fission, fusion, and retention of ancestral chromosomes. Genome Res. 2011;21:1306–1312. doi: 10.1101/gr.116491.110. [DOI] [PMC free article] [PubMed] [Google Scholar]
- Voss SR, Kump DK, Walker JA, Shaffer HB, Voss GJ. Thyroid hormone responsive QTL and the evolution of paedomorphic salamanders. Heredity (Edinb) 2012;109:293–298. doi: 10.1038/hdy.2012.41. [DOI] [PMC free article] [PubMed] [Google Scholar]
- Voss SR, Shaffer HB. Adaptive evolution via a major gene effect: paedomorphosis in the Mexican axolotl. Proc Natl Acad Sci U S A. 1997;94:14185–14189. doi: 10.1073/pnas.94.25.14185. [DOI] [PMC free article] [PubMed] [Google Scholar]
- Voss SR, Smith JJ. Evolution of salamander life cycles: a major-effect quantitative trait locus contributes to discrete and continuous variation for metamorphic timing. Genetics. 2005;170:275–281. doi: 10.1534/genetics.104.038273. [DOI] [PMC free article] [PubMed] [Google Scholar]
- Voss SR, Smith JJ, Gardiner DM, Parichy DM. Conserved vertebrate chromosome segments in the large salamander genome. Genetics. 2001;158:735–746. doi: 10.1093/genetics/158.2.735. [DOI] [PMC free article] [PubMed] [Google Scholar]
- Wickbom T. THE CHROMOSOMES OF ASCAPHUS TRUEI AND THE EVOLUTION OF THE ANURAN KARYOTYPES. Hereditas. 1950;36:406–418. [Google Scholar]
- You X, Shu L, Li S, Chen J, Luo J, Lu J, Mu Q, Bai J, Xia Q, Chen Q, Cai Y, Zhang H, Chen G, Lin H, Zhang Y, Shi Q. Construction of high-density genetic linkage maps for orange-spotted grouper Epinephelus coioides using multiplexed shotgun genotyping. BMC genetics. 2013;14:113. doi: 10.1186/1471-2156-14-113. [DOI] [PMC free article] [PubMed] [Google Scholar]
- Zhang P, Wake DB. Higher-level salamander relationships and divergence dates inferred from complete mitochondrial genomes. Mol Phylogenet Evol. 2009;53:492–508. doi: 10.1016/j.ympev.2009.07.010. [DOI] [PubMed] [Google Scholar]
Associated Data
This section collects any data citations, data availability statements, or supplementary materials included in this article.