

Abstract
Genome-scale metabolic network reconstructions provide a basis for the investigation of the metabolic properties of an organism. There are reconstructions available for multiple organisms, from prokaryotes to higher organisms and methods for the analysis of a reconstruction. One example is the use of flux balance analysis to improve the yields of a target chemical, which has been applied successfully. However, comparison of results between existing reconstructions and models presents a challenge because of the heterogeneity of the available reconstructions, for example, of standards for presenting gene-protein-reaction associations, nomenclature of metabolites and reactions or selection of protonation states. The lack of comparability for gene identifiers or model-specific reactions without annotated evidence often leads to the creation of a new model from scratch, as data cannot be properly matched otherwise. In this contribution, we propose to improve the predictive power of metabolic models by switching from gene-protein-reaction associations to transcript-isoform-reaction associations, thus taking advantage of the improvement of precision in gene expression measurements. To achieve this precision, we discuss available databases that can be used to retrieve this type of information and point at issues that can arise from their neglect. Further, we stress issues that arise from non-standardized building pipelines, like inconsistencies in protonation states. In addition, problems arising from the use of non-specific cofactors, e.g. artificial futile cycles, are discussed, and finally efforts of the metabolic modelling community to unify model reconstructions are highlighted.
Keywords: metabolic network reconstruction, gene-protein-reaction association, unification
Introduction
Over the past two decades, the increasing availability of genomic, proteomic and metabolomic information has led to the generation of a multitude of metabolic network reconstructions [1]. These reconstructions aim to represent our collective knowledge about the metabolism of the reconstructed organisms. They serve as a source of information on their target organism, and models derived from the reconstructions can be used to investigate its metabolic capabilities. The available reconstructions cover multiple types of organisms, ranging from microorganisms, like Escherichia coli [2–4] and Saccharomyces cerevisiae [5, 6], to complex multicellular organisms, like Arabidopsis thaliana [7–9] or Homo sapiens [10–12].
Despite the availability of high-quality protocols for the reconstruction of a genome-wide network [13], efforts are far from consistent between different groups. The most common differences are multiple naming schemes for reactions, metabolites and genes, along with different formats for reconstruction exchange. Some of the issues arising from these differences have been discussed in Monk et al. [14]. The main challenge is to compare networks generated by different reconstruction tools, or using different naming schemes [15]. Furthermore, the lack of precise annotations leads to information being overlooked, which could improve the models resulting from reconstruction efforts. With automation of model generation [16, 17], in particular towards tissue-specific sub-models [18, 19], it becomes ever more important that reconstructions are curated in a consistent way.
There have been attempts to establish databases that can help in generating consistent networks by providing links to multiple databases, like MetRxn or MetaNetX [15, 20]. These studies also highlighted the issues arising from the multitude of naming schemes used. While we know that there are multiple pathways that are shared between a multitude of organisms (like glycolysis or the Krebs cycle), finding these similarities in reconstructions is challenging. The authors of MetRxn report that by using simple string matching techniques only three reactions could be directly inferred as being identical in a set of over 30 models [15]. Thus, unification is paramount to determine the novelty of new reconstructions.
Unified representation, however, is not the only issue with current reconstructions. Most reconstructions rely purely on genetic information for functional annotation; however, recent advances in both microarray and RNA-seq technologies provide information about messenger RNA (mRNA) on a transcript level. Inclusion of this kind of information could potentially increase the accuracy of models. Another issue that can influence predictions is cofactor specificity, which has been shown to be influential in metabolic modelling [21]. In this article, we will highlight potential approaches to unify metabolic network representations and highlight the importance of transcript specificity to metabolic networks. We will further elaborate on the issues arising from cofactor specificity in metabolic network analysis (e.g. sets of reactions using either NADPH or NADH, which can form futile cycles, indicating those reactions as active while in truth they are disconnected from the network). Finally, we will provide an overview of projects aiming at improving the current lack of unification, by coordinating multiple reconstruction efforts for the same organism, or creating databases with compatible networks.
Steps towards a unification of model representation
Metabolites and reactions linking them form the core of a metabolic network. Additional information is often provided in the form of genes that code for enzymes catalyzing a specific reaction. These can be simply lists of genes associated with a reaction, or they can form gene-protein-reaction (GPR) association rules representing protein complex formation. To provide this information, multiple different types of formats have been used (see Table 1). Some, like the Systems Biology Markup Language (SBML, [32]) or spreadsheets, are platform independent, while others, like MATLAB structs, depend on a specific software. The advantage of SBML over other formats is its versatility, and general usability by almost all current software tools specific to metabolic modelling (for recent reviews on these tools, see Lakshmanan et al. [33] or Dandekar et al. [34]). Nowadays, most models are indeed published in the SBML format [25, 35–37]. In addition, many software tools, even if they have an alternative internal storage format, like ScrumPy [27], COBRA [22], RAVEN [17] or Pathway Tools [38], provide some type of import and export functionality to read and generate SBML files that can be used as input into other tools. However, there are still models like the latest versions of the popular metabolic network reconstruction of H. sapiens, Recon2, which are only available as a MATLAB export specific to the COBRA toolbox environment [22]. Beyond the common general file format, models tend to diverge substantially.
Table 1.
Different formats for the exchange of metabolic models
| Model style | Description | Advantages//Disadvantages | Examples |
|---|---|---|---|
| SBML/COBRA | SBML with additional information in the notes sections of entries [22] | Models are usable in any SBML capable tool, but the additional information needs explicit parsers. Tool independent.//There is no clear definition of used fields in the SBML format, and different groups use multiple different data fields. | BiGG models [23], MetaCyc SBMLs [24], iJO1366 [3] |
| SBML/Mod | SBML using ‘ModifierSpecies' to define GPRs | Models are usable in any SBML capable tool. Genes can be linked to multiple sources. Proteins can be encoded and linked explicitly. Tool independent.//Needs parsers that make use of these properties. Lacks a defined standard how ‘ModifierSpecies' have to be defined. | HMR [25], yeast consensus [6] |
| SBML/FBC | SBML with FBC extension for FBA-specific information [26] | Uses SBML defined fields (from the FBC extension) to provide FBA-specific information. Proteins can be encoded (and identified) explicitly. Tool independent.//FBC extension not yet processed by many tools. | BiGG2 Database (http://bigg.ucsd.edu) |
| Toolbox-specific formats | Formats specific to one modelling tool, e.g. COBRA MATLAB files [22] or ScrumPy.spy files [27] | Files can directly be used in the respective toolbox and can contain additional information.//Not easily loaded into other tools. | Recon2 [12], iMM1415 [28] Poolman et al. [7] |
| Spread sheets | Commonly multiple sheets or files with compounds, reactions and genes | Easily accessible for non-computational users. Tool independent.//Difficult to parse for further analysis, because of the lack of a standard format. | HepatoNet [29], Oh et al. [30], iNJ661 [31] |
Note. Annotation of the SBML is either achieved by COBRA notes fields (e.g. for Database links), or using BQ and the annotation class of SBML. Both types have been used in combination with SBML/Mod and SBML/COBRA, even though commonly SBML/COBRA models do not include BQ annotations, as they rely on the COBRA annotations.
Flux balance-specific information
GPR association rules, which are commonly used to link gene expression or proteomics data to metabolic networks [39–42], are inconsistently represented in different models. While some reconstructions provide those GPRs in supplemental spreadsheets [29], the COBRA toolbox defines additional fields in the SBML ‘Notes' section of a reaction, which contain the GPR rules [22]. Recently some reconstructions, like the yeast consensus model [6] or the Human Metabolic Reconstruction (HMR) [25], provide ‘ModifierSpecies', which are annotated as being encoded by specific genes using bio-qualifiers [43]. The COBRA toolbox also added further information into the ‘Notes' section, including metabolite formula and charge information, or information on pathways that include a given reaction. While this information is useful for network analysis, it lacks a clear definition of which fields can be used or should be present. Thus, multiple different fields have been used across models, with some fields remaining undefined in some models. However, this information could also be provided within the annotation field of a metabolite or reaction using biomodel qualifiers (BQ) [43], e.g. a reaction ‘isPartOf' a specific pathway, without the necessity of additional field definition. Another specification made by the COBRA toolbox was to use the ‘kineticLaw' field to define flux constraints, thus using a structure that is not designed to hold this information but is supposed to be used for real kinetic information. Because SBML is a general systems biology representation, this could lead to confusion if the structure of a stoichiometric model is imported into a kinetic tool. These inconsistencies in the use of SBML, in addition to the increasing amount of available reconstructions, have prompted the development of the flux balance constraints (FBC) extension [44] to SBML, which covers many aspects specific to flux balance analysis (FBA). While initially only providing support for flux bounds and providing additional SBML fields for charge and formula within the ‘Species' class, the latest version (Version2, Release 1 [26]) also provides facilities to handle GPRs, including the option to add gene products (thus directly adding protein identifiers to the model along with gene/transcript identifiers). FBC further allows the inclusion of specific settings for simulations in ‘FluxObjectives'. The clear definition of the FBC extension along with its direct link to the SBML specification makes it an ideal choice for data provision.
Naming conventions and comparability
While the ‘FBC’ extension handles many of the aspects specific to flux balance models, there is still wide diversity in naming schemes used for metabolite or reaction identification and the choice of gene representation. Until now, there are no generally accepted naming conventions for metabolites or reactions, and thus the choice of identifiers strongly depends on the database used as a basis for the reconstruction, or how the researchers choose to define their system. Naming schemes have included custom abbreviations [45, 46], consecutive numberings [29] or extracted identifiers from databases [7].
Newer reconstructions tend to make extensive use of the SBML annotation field, Systems Biology Ontology identifiers (see http://www.ebi.ac.uk/sbo/) and BQs. Usage of these qualifiers in addition to adherence to standards defined as the ‘Minimum Information Required In the Annotation of Models' (MIRIAM) [47] will make it possible to create universally applicable interpreters and tools. However, even when trying to adhere to the MIRIAM standards, it is important to select a proper set of resources to annotate the model components. There are multiple databases for compounds (e.g. CHEBI [48], PubChem [49], KEGG [50], MetaCyc [24]), reactions (KEGG, MetaCyc, BRENDA [51], GO [52]), proteins (BRENDA, UniProt [53], PDB [54], ENZYME [55]) and genes (NCBI—Gene [56], UniProt, GeneDB [57], GeneCards [58]), with some (like KEGG and MetaCyc) catering primarily to metabolism, while others are more comprehensive.
As new models are commonly accompanied by novel functionalities or entities, databases that allow the deposition of new entries would be preferable. While the most popular metabolic databases (MetaCyc and KEGG) do contain entry types on the most relevant entities, they do not allow a direct deposition of new entries. They are therefore unsuitable for deposition of newly developed models, as this would lead to new identifiers that cannot be directly used by others. Using multiple databases to solve this issue can introduce new sources of errors. For metabolites, one database might consider all compounds to be present at a certain pH (like MetaCyc), while other databases represent the same compound as fully protonated (like BRENDA). Thus, when trying to determine charge balance or hydrogen balance, issues arise if inconsistent sources are used, and one source might not provide the required protonation state for all compounds in the reconstruction. If novel compounds, proteins or genes are introduced in a reconstruction, we would recommend using CHEBI, UniProt and NCBI—Gene to directly deposit the novel entries and use them to annotate the entities in the model. For known compounds, a selection of consistent sources (e.g. the same protonation state as in the reconstruction) would, in our opinion, be more suitable than a large selection of databases, with different definitions, to avoid confusion.
Transcripts—the information lost in reconstructions
As mentioned above, GPRs are informationally important in metabolic reconstructions, in particular when trying to integrate omics data into metabolic networks, e.g. to extract context-specific models from a generic genome-wide reconstruction. The GPRs annotated in metabolic reconstructions mostly consider only genes, completely neglecting the fact that one locus can be translated in different variants through alternative splicing.
Alternative splicing (as shown in Figure 1) allows increased diversity and regulatory complexity of an organism without requiring a massive increase in genome size [59]. It is particularly important in humans, with splicing variants affecting 95% of the genes [60, 61]. Even if the different variants have mostly similar functions, in some cases, the alternative variants have opposing effects, like the caspase 8 isoforms that are anti- and pro-apoptotic [62]; provide insufficient activity, as in the instance of the TAZ gene [63]; or inhibit the main isoform. An example for the latter is isoform i2 of UGT1A that negatively modulates the glucuronosyltransferase activity of isoform i1 [64, 65].
Figure 1.
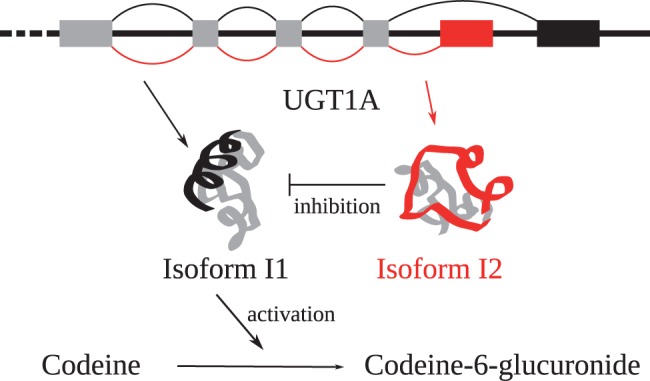
Alternative splice forms are created by removal and addition of exons during the splicing process. This example shows two the alternate splice forms i1 (depicted in black) and i2 (depicted in red) of a human glucuronosyltransferase (UGT1A). The main isoforme, i1, is implicated in the metabolism and excretion of toxic compounds, e.g. drugs like codeine, while isoform i2 inhibits the activity of the main isoform. A colour version of this figure is available online at BIB online: https://academic.oup.com/bib.
In general, several splice variants are simultaneously expressed, although usually one variant dominates the others, accounting for on average 85% of the protein-coding mRNA at a given loci [66]. The dominant variant is usually highly conserved during evolution, but the expression pattern is constantly changing to meet cell- and condition-specific requirements [67]. Not only do different cell types have a different set of variants, but also different individuals show different splicing. Furthermore, switch-like effects, where variants lose their dominant position in favour of other variants, were observed for hundreds of genes during differentiation [68, 69], demonstrating the plasticity of a tightly regulated process. Alterations of the latter are implicated in numerous pathologies, especially in cancer, and several splice variants are even considered as biomarkers, like PRKC-ζ-PrC for prostate cancer, Nek2C for breast cancer and CD-44 splice variants for colon cancer [70–72].
Current use of transcripts
Most metabolic models do not consider transcript variants, as functional information is often only available at the gene or protein level. Even metabolic reconstructions that introduced transcript identifiers in their GPR association rules based on bibliographic research, like Recon1 [10], do not allow mapping of the transcripts identifiers of the model to transcript identifiers used by databases. This issue arises from the lack of direct matching between the reconstruction identifier and available databases’ identifiers. Therefore, in practice, the information related to splicing variants is simply ignored. GPRs are gene oriented, and, as a consequence, the intensity levels of the transcripts variants are usually simply summed up or the maximal intensity values are mapped to the reactions of the model.
Alternative splicing was shown to be altered in a wide range of diseases [73, 74]. In cancer, usually minor isoforms get overexpressed and dominate the main splice form. For example, the alternative splice form pyruvate kinase isoform 2 (PKM2) favours aerobic glycolysis, whereas the main form promotes oxidative phosphorylation. The expression of PKM2, which is the embryonic isoform, is restricted in adults to cancer cells that do not express PKM1 [75]. A model with gene-oriented GPRs cannot differentiate between the two isoforms and will therefore consider the same set of target reactions as active for both isoforms.
The existence of tissue- or context-specific alternative exons involved in the same pathways, and regulated by common mechanisms as, for example, the neural-specific splicing regulator nSR100/SRRM4, was demonstrated in several studies [76–80]. Although alternative exons were mostly studied for their impact on protein–protein interaction networks, it is probable that alternative exons have a similar role in metabolic modelling, controlling the activation of tissue-specific metabolic sub-pathways. In this case, a model with gene-oriented GPRs would fail to capture tissue-specific activation patterns.
Sources for transcript-specific information
The prevalent barrier to the inclusion of transcript variants in metabolic network reconstruction is the lack of knowledge about the alternative splice forms in most organisms. Databases collecting information on alternative splicing are mainly dedicated to humans, mice and other vertebrates because splicing is most important in eukaryotic organisms. The largest benefit of this endeavour is therefore expected for human models, where the inclusion of transcript information could explain pathologies linked to alternative splice forms, e.g. in cancer [81, 82], neurodegenerative diseases [83–85] or autosomal dominant retinitis pigmentosum [86]. The inclusion of information on alternative splice forms will increase the capacity of cell-specific and context-specific models to capture the variability in metabolism of different cell types. However, even for the organisms with the highest information content on alternative splicing, the functional activity of most splice forms remains unknown. To address this problem, several databases have been dedicated for a decade to collecting transcript information. These include ASAP II [87], ECGene [88], ASTD [89], HOLLYWOOD [90], H-DBAS [91], FAST DB [92] and FANTOM 3 [93], which try to supplement generic gene databases (ENSEMBL [94, 95], Pfam [96, 97], Uniprot/Swiss-Prot [98]). A more intensive review of these databases can be found in Kelemen et al. [99] or Taneri and Gaasterland [100].
Problems of automated annotation pipelines
The increased amount of data on alternative splicing obtained through deep-sequencing technologies outpaces the capacity of databases to completely annotate the transcripts manually, and therefore nearly all databases use semi-automated or automated pipelines. Automated annotation process are more prone to errors than manual curation. The rate of wrong annotation in GenBank [101], NR [102], TrEMBL [98] and KEGG [103] was assessed by Schnoes et al. [104], who tested 37 enzyme families. They found misannotation rates ranging from 5% up to 63% for the automated databases, whereas Swissprot, which performs manual curation, had a misannotation rate close to 0 [104]. A similar misannotation rate because of the automated pipeline is expected for alternative splice forms. Several strategies can be used to identify the function of a new alternative splice form. The most common compares the sequence of the transcripts or the isoforms to species already present in the databases using tools like Basic Local Alignment Search Tool. The reliability of the annotation depends equally on the quality of the algorithms uses and the correctness of the annotations of species already present in the databases. Although algorithms do create errors in the identification of open reading frames, the database entries themselves might be more problematic, as erroneous entries can propagate quickly through automated methods. For example, one of the most used databases [105], GenBank, only allows the sequence submitter to correct or update the submitted annotation. This leads to few corrections and updates, thus accumulating errors in a database that shares its entries with several other databases [105]. In addition, the prediction of function based on the amino-acid sequence, taking advantage of massive high-throughput data, is getting more popular. The different tools used by the databases have different accuracy levels, and the characteristics of the annotation tools must be taken into consideration when selecting a reference database.
Transcript databases suitable for metabolic model annotation
The GENCODE collaboration [106] tries to annotate genes and splice variants discovered by the ENCODE consortium [107] using a combination of manual curation, automated annotation pipelines and targeted validation approaches. Within the GENCODE collaboration, the APPRIS database [66] is dedicated to the annotation of principal and alternative splice isoforms. The aim of APPRIS is to validate manually annotated isoforms with functional data and protein structures. APPRIS selects the major isoform that is present in most cells and contexts and compares that isoform to all other isoforms. APPRIS could identify the dominant variants of 85% of the protein-coding transcripts of the GENCODE 7 release for ENSEMBL [94, 95].
Vega [108], a database for vertebrate genomes that contains a section with annotations for alternative splicing information, is another useful source of transcript information. The human and vertebrate analysis and annotation team is actively participating in these annotation efforts, and it was incorporated into the set of ENSEMBL databases [94, 95]. The aim is to systematically annotate all experimentally validated expressed sequence tags or mRNAs from ENCODE [107] and the 1000 Genomes loss-of-function project [109], without prior filtering based, for example, on the tissue of origin. This unbiased approach allows the annotation of transcripts that do not yet have an obvious function.
The ASPicDB database [110] considers the human isoforms that result from alternative splicing events. Annotation is then performed by machine-learning approaches that categorize the proteins by function, localization, transmembrane domains, signal peptides, gpi- and coiled-coil domains, and similarity to known peptide sequences. The ADPicDB database uses the ASPIC algorithm [111] to perform multi-alignments to the genome. The alignment that minimizes the splicing events is then retained.
H-DBAS II [112] is the successor of H-DBAS [91], a database that collects information on human alternative splice forms, with the focus on alternative splicing events altering protein functions. The H-DBAS database was mainly based on cDNA libraries. H-DBAS II now takes advantage of the RNA-seq technology to improve the annotation of splicing variants.
The SASD database [113] predicts alternative splice forms expressed in different contexts, e.g. during disease, under drug effects or in different organs. Data extracted from ENSEMBL [95] and from the Integrated Pathway Analysis database are used to create artificial transcripts and peptides.
While all databases mentioned above are focusing on different vertebrates, the ASIP database is specialized to plants [114]. It allows the visualization of alternative splice forms in plants like A. thaliana or Oryza sativa. To obtain the annotations, the ASIP database uses an automated approach based on alignment tools.
Table 2 gives an overview of these databases, which, along with further information provided by RNA-seq experiments, represent a valuable source of data that could increase the predictive capabilities of metabolic models. Besides automated pipelines to map the correct transcripts to known metabolic reactions, data mining approaches and bibliographic research similar to those performed by the Recon1 project would be required to unravel the function of the variants. It would, however, be important to use these resources to implement a common nomenclature that would prevent information loss and create consistency between models.
Table 2.
Databases for transcript-specific genome annotations of multiple species
| Name | Species | Method of annotation | Reference | Link |
|---|---|---|---|---|
| GENCODE | Human and mouse | Manual and automated | [106] | http://www.gencodegenes.org/ |
| ASPicDB | Human | Automated | [110] | http://srv00.ibbe.cnr.it/ASPicDB/ |
| Vega | Human, zebrafish, pig, mouse and rat | Manual annotation | [108] | http://vega.sanger.ac.uk/index.html |
| H-DBAS | human, mouse, rat, chimpanzee, macaque and dog | Manual | [112] | http://www.h-invitational.jp/h-dbas/ |
| SASD | Human | Prediction | [113] | http://bioinfo.hsc.unt.edu/sasd/ |
| ASIP | Plants | Automated | [114] | http://www.plantgdb.org/ |
Non-specific cofactors can cause infeasible loops
Another issue commonly observed when reconstructing metabolic networks is the difficulty of selecting the right cofactors for reactions, specifically the right redox pairs. The assignment of cofactors to reactions is complicated by the fact that the cofactor requirement is organism specific and cell specific, explaining at least partially that the cofactors requirements vary between databases [117]. Furthermore, gene matching algorithms used to reconstruct networks will often find reactions using all potential cofactors and include them in the reconstruction. The discrepancies are further accentuated by the fact that in the case of missing electron transfer pair information, NAD+/NADH is most often the default transfer cofactor used [116]. The reason for this default choice is that finding organism-specific information is not trivial and can necessitate extensive literature research even for well-studied organisms. Furthermore, several enzymes have different isoforms that do not exhibit the same cofactor requirements. One example is aldehyde dehydrogenases, which may use both NADH and NADPH. In the cytoplasm of S. cerevisiae, the main isoform uses NADP+, whereas stress-induced isoforms prefer NAD+ as cofactor [117]. Unfortunately, databases tend to either provide unspecific reactions [using NAD(P)+], only one variant, or often both variants associated with both genes in these instances, which makes it challenging to assign the correct reaction to the respective isoform. In addition, several enzymes are able to catalyze various reactions, and the catalyzed reactions depend on the availability of a specific cofactor. This leads to the incorporation of all potentially catalyzed reactions that vary only by their cofactor requirements [5], which is likely to cause loops or cycles that are thermodynamically infeasible if one or more of the reactions are reversible. Loops carry a non-zero flux, even in the absence of an input and output flux, if no thermodynamical constraints are added. These loops violate the loop law, a law similar to Kirchhoff’s second law for electrical circuits. There have been attempts to eliminate the presence of thermodynamically infeasible loops from FBA calculations and it has been shown that their presence can diminish the predictive power of models [23]. However, the use of loopless FBA converts the simple linear problem into a mixed integer linear problem, which can lead to long computational times, particularly if multiple rounds of the problem have to be solved. Other approaches to solving this issue show similar characteristics with respect to computational requirements [118] and are therefore often not included in the analysis of metabolic models.
Community efforts to improve metabolic models
There have been attempts to create collections of metabolic networks, e.g. Model SEED [16] or BiGG [23], and unify identifiers like MetRxn [15] or MetaNetX [20] (listed in Table 3).
Table 3.
Databases aiming at providing functional metabolic models that are directly comparable
| Resource | Unification | Description |
|---|---|---|
| BiGG [23] | SBML/COBRA | Database containing multiple genome-scale metabolic networks in the COBRA format. |
| BiGG2 (http://bigg.ucsd.edu) | SBML/COBRA, SBML/FBC | Update to BiGG, currently in a beta version, providing multiple models annotated using FBC. |
| MetaCyc [24] | SBML/COBRA, biocyc flat files | Large collection of metabolic reconstructions. Flat File format contains additional details not included in the provided SBMLs. |
| SEED [16] | SEED IDs, Partial SBML/COBRA format | System for construction of metabolic reconstructions and analysis. Export of reconstructions is available in SBML format (with minimal annotations) and Excel sheets. |
| MetaNetX [19] | MNXRef IDs, SBML/COBRA, bioql information for metabolites | Repository of unified metabolic reconstructions linking to multiple external databases. Offers tools for network analysis and modifications. SBML files contain additional yeast-style annotations for species. |
| MetRxn [15] | MetRxn ID, SBML/COBRA | Database matching multiple metabolite and reaction databases aiming at providing a curated basis for network reconstruction. |
Model SEED is aimed at providing a platform for model reconstruction based on automated genome annotation using RAST [119]. While this is sufficient for the analysis tools provided on the website, the exportable model formats lack unification information. They do adhere to the COBRA toolbox standard, but as mentioned earlier, that definition itself lacks a lot of information. BiGG was introduced to allow comparison between different networks, but relied on all deposited networks adhering to the same nomenclature, and is restricted by the limited number of deposited reconstructions. The database is currently being updated however, and a beta version of BiGG2, comprising lots of additional models and providing well annotated models, has recently been made available online.
In contrast to this approach, MetRxn and MetaNetX aim at identifying common reactions by combining multiple pieces of information. Bernard et al. [120] give a good overview of the issues arising when trying to match metabolites, and how different databases try to address them. The biggest issues arise from stereoisomers and difference in protonation states. While most often protonation states can be ignored (as long as they are consistent within a model), there might be issues when different compartments exhibit different pH. This could become particularly important for energetic considerations if different protonation states are assumed for mitochondria and cytosol. The same problems can potentially arise from considering equality of stereoisomers, with different stereoisomers being processed at different efficiencies [121]. Both MetRxn and MetaNetX can be a great help to overcome most of these issues, with MetaNetX being the more comprehensive approach. Using an extensive set of external databases, it tries to match similar external compounds to its namespace. To address issues of stereoisomers and protonation states, it provides a distinction between identical structures, structures with the same tautomeric form at pH 7.3 and inferred similarities. Even though this information is not directly visible on the website, it can be retrieved from the data export files. However useful these tools become, it is even more important that they are used, and that the community works in concert to improve models, avoiding the creation of multiple distinct reconstructions for the same organism. While the exchange of models in a common language would be an important step, as it would make the combination of models easier, we also want to highlight two recent collaborative efforts that lead to the development of more comprehensive reconstructions.
The first example of a successful community effort for organism-specific reconstruction is the creation of the consensus model of S. cerevisiae. Several models of yeast had been published [122–124] until, in 2007, a combined effort was undertaken to merge these models and bring them into a more standardized format [125]. This early combined effort now led the 7th iteration of the model [6], which inspired the formulation of GPRs as suggested above.
Another example of community effort to merge models is the HMR Recon 2 [12]. The first human genome-scale metabolic reconstruction, HumanCyc, was published in 2005 [126]. Soon after, two refined genome-scale reconstructions were published; Recon 1 by Duarte et al. [10], and the Edinburgh Human Metabolic Network (EHMN) by Ma et al. [11]. These competing models, along with HepatoNet [29] and further information from the literature, were combined into Recon 2 [12] in an effort to unify the different sources. While the attempt led to a more complete knowledge source, it reinforced the problems of incompatibility between different networks. For example, Recon 1 used Entrez gene identifiers with transcript-specific details as gene IDs, while HepatoNet used gene symbols, leading to mixed identifiers in Recon 2, which makes simulations more challenging. In addition, the transcript-specific information from Recon 1 got mostly lost because it, unfortunately, was not traceable to databases Section 3, and neither EHMN nor HepatoNet contained similar information. This again highlights the importance of linking information to databases because great efforts can be lost or have to be repeated. Still, Recon 2 is an important step in the development of HMRs and is only in its second iteration. There remain competing reconstructions or knowledge bases like the HMR, which will be merged in the future.
Key Points
The increasing amount of metabolic reconstructions necessitates a more unified way of representation to make models comparable.
Available unification sources could provide a basis for this process.
Associations to genetic information in metabolic reconstructions need a clearer and more structured association.
Transcript-specific association rules would improve the specificity of network activities.
Cofactor specificity needs to be addressed more carefully during reconstruction.
Acknowledgements
We would like to thank Elizabeth Marshall for her help.
Funding
T.S. and T.P. are funded by the Life Science Research Unit, University of Luxembourg. M.P.P. was supported by a fellowship from the Fond National de la Recherche Luxembourg (AFR 6041230).
Biographies
Thomas Pfau is a postdoctoral researcher at the University of Luxembourg. His research aims at providing tools for the metabolic modelling community and understanding metabolic networks in human brains.
Maria Pires Pacheco is a PhD student at the University of Luxembourg. Her doctoral research aims at the development of algorithms for the generation of context-specific metabolic networks in humans.
Thomas Sauter is an expert in computational systems biology. Since 2008, he is professor for Systems Biology at the University of Luxembourg, where he is the study director of the Master Programme in Integrated Systems Biology.
References
- 1.Kim TY, Sohn SB, Kim YB, et al. Recent advances in reconstruction and applications of genome-scale metabolic models. Curr Opin Biotechnol 2012;23:617–23. [DOI] [PubMed] [Google Scholar]
- 2.Reed JL, Vo TD, Schilling CH, et al. An expanded genome-scale model of Escherichia coli K-12 (JR904 GSM/GPR). Genome Biol 2003;4:R54. [DOI] [PMC free article] [PubMed] [Google Scholar]
- 3.Orth JD, Conrad TM, Na J, et al. A comprehensive genome-scale reconstruction of Escherichia coli metabolism–2011. Mol Syst Biol 2011;7:535. [DOI] [PMC free article] [PubMed] [Google Scholar]
- 4.Keseler IM, Mackie A, Peralta-Gil M, et al. EcoCyc: fusing model organism databases with systems biology. Nucleic Acids Res 2013;41:D605–12. [DOI] [PMC free article] [PubMed] [Google Scholar]
- 5.Förster J, Famili I, Fu P, et al. Genome-scale reconstruction of the Saccharomyces cerevisiae metabolic network. Genome Res 2003;13:244–53. [DOI] [PMC free article] [PubMed] [Google Scholar]
- 6.Aung HW, Henry SA, Walker LP. Revising the representation of fatty acid, glycerolipid, and glycerophospholipid metabolism in the consensus model of yeast metabolism. Industrial Biotechnol 2013;9:215–28. [DOI] [PMC free article] [PubMed] [Google Scholar]
- 7.Poolman MG, Miguet L, Sweetlove LJ, et al. A genome-scale metabolic model of Arabidopsis and some of its properties. Plant Physiol 2009;151:1570–81. [DOI] [PMC free article] [PubMed] [Google Scholar]
- 8.de Oliveira Dal’Molin CG, Quek LE, Palfreyman RW, et al. AraGEM, a genome-scale reconstruction of the primary metabolic network in Arabidopsis. Plant Physiol 2010;152:579–89. [DOI] [PMC free article] [PubMed] [Google Scholar]
- 9.Mintz-Oron S, Meir S, Malitsky S, et al. Reconstruction of Arabidopsis metabolic network models accounting for subcellular compartmentalization and tissue-specificity. Proc Natl Acad Sci USA 2012;109:339–44. [DOI] [PMC free article] [PubMed] [Google Scholar]
- 10.Duarte NC, Becker SA, Jamshidi N, et al. Global reconstruction of the human metabolic network based on genomic and bibliomic data. Proc Natl Acad Sci USA 2007;104:1777–82. [DOI] [PMC free article] [PubMed] [Google Scholar]
- 11.Ma H, Sorokin A, Mazein A, et al. The Edinburgh human metabolic network reconstruction and its functional analysis. Mol Syst Biol 2007;3:135. [DOI] [PMC free article] [PubMed] [Google Scholar]
- 12.Thiele I, Swainston N, Fleming RMT, et al. A community-driven global reconstruction of human metabolism. Nat Biotechnol 2013;31:419–25. [DOI] [PMC free article] [PubMed] [Google Scholar]
- 13.Thiele I, Palsson BØ. A protocol for generating a high-quality genome-scale metabolic reconstruction. Nat Protoc 2010;5:93–121. [DOI] [PMC free article] [PubMed] [Google Scholar]
- 14.Monk J, Nogales J, Palsson BØ. Optimizing genome-scale network reconstructions. Nat Biotechnol 2014;32:447–52. [DOI] [PubMed] [Google Scholar]
- 15.Kumar A, Suthers PF, Maranas CD. MetRxn: a knowledgebase of metabolites and reactions spanning metabolic models and databases. BMC Bioinf 2012;13:6. [DOI] [PMC free article] [PubMed] [Google Scholar]
- 16.Overbeek R, Begley T, Butler RM, et al. The subsystems approach to genome annotation and its use in the project to annotate 1000 genomes. Nucleic Acids Res 2005;33:5691–702. [DOI] [PMC free article] [PubMed] [Google Scholar]
- 17.Agren R, Liu L, Shoaie S, et al. The RAVEN toolbox and its use for generating a genome-scale metabolic model for Penicillium chrysogenum. PLoS Comput Biol 2013;9:e1002980. [DOI] [PMC free article] [PubMed] [Google Scholar]
- 18.Wang Y, Eddy JA, Price ND. Reconstruction of genome-scale metabolic models for 126 human tissues using mCADRE. BMC Sys Biol 2012;6:153. [DOI] [PMC free article] [PubMed] [Google Scholar]
- 19.Vlassis N, Pacheco MP, Sauter T. Fast reconstruction of compact context-specific metabolic network models. PLoS Comput Biol 2014;10:e1003424. [DOI] [PMC free article] [PubMed] [Google Scholar]
- 20.Ganter M, Bernard T, Moretti S, et al. MetaNetX.org: a website and repository for accessing, analysing and manipulating metabolic networks. Bioinformatics 2013;29:815–16. [DOI] [PMC free article] [PubMed] [Google Scholar]
- 21.Cheung CYM, Williams TCR, Poolman MG, et al. A method for accounting for maintenance costs in flux balance analysis improves the prediction of plant cell metabolic phenotypes under stress conditions. Plant J 2013;76:1050–61. [DOI] [PubMed] [Google Scholar]
- 22.Schellenberger J, Que R, Fleming RMT, et al. Quantitative prediction of cellular metabolism with constraint-based models: the COBRA Toolbox v2.0. Nat Protoc 2011;6:1290–307. [DOI] [PMC free article] [PubMed] [Google Scholar]
- 23.Schellenberger J, Lewis NE, Palsson BØ. Elimination of thermodynamically infeasible loops in steady-state metabolic models. Biophys J 2011;100:544–53. [DOI] [PMC free article] [PubMed] [Google Scholar]
- 24.Caspi R, Altman T, Billington R, et al. The MetaCyc database of metabolic pathways and enzymes and the BioCyc collection of pathway/genome databases. Nucleic Acids Res 2014;42:D459–71. [DOI] [PMC free article] [PubMed] [Google Scholar]
- 25.Mardinoglu A, Agren R, Kampf C, et al. Genome-scale metabolic modelling of hepatocytes reveals serine deficiency in patients with non-alcoholic fatty liver disease. Nat Commun 2014;5:3083. [DOI] [PubMed] [Google Scholar]
- 26.Olivier BG, Bergmann FT. Flux Balance Constraints. Version 2 Release 1. Available from COMBINE http://identifiers.org/combine.specifications/sbml.level-3.version-2.fbc.version-1.release-1 2015. [Google Scholar]
- 27.Poolman MG. ScrumPy: metabolic modelling with Python. Syst Biol 2006;153:375–8. [DOI] [PubMed] [Google Scholar]
- 28.Sigurdsson MI, Jamshidi N, Steingrimsson E, et al. A detailed genome-wide reconstruction of mouse metabolism based on human Recon 1. BMC Syst Biol 2010;4:140. [DOI] [PMC free article] [PubMed] [Google Scholar]
- 29.Gille C, Bölling C, Hoppe A, et al. HepatoNet1: a comprehensive metabolic reconstruction of the human hepatocyte for the analysis of liver physiology. Mol Syst Biol 2010;6:411. [DOI] [PMC free article] [PubMed] [Google Scholar]
- 30.Oh YK, Palsson BO, Park SM, et al. Genome-scale reconstruction of metabolic network in Bacillus subtilis based on high-throughput phenotyping and gene essentiality data. J Biol Chem 2007;282:28791–9. [DOI] [PubMed] [Google Scholar]
- 31.Jamshidi N, Palsson BØ. Investigating the metabolic capabilities of Mycobacterium tuberculosis H37Rv using the in silico strain iNJ661 and proposing alternative drug targets. BMC Syst Biol 2007;1:26. [DOI] [PMC free article] [PubMed] [Google Scholar]
- 32.Hucka M, Finney A, Sauro HM, et al. The systems biology markup language (SBML): a medium for representation and exchange of biochemical network models. Bioinformatics 2003;19:524–31. [DOI] [PubMed] [Google Scholar]
- 33.Lakshmanan M, Koh G, Chung BKS, et al. Software applications for flux balance analysis. Brief Bioinform 2014;15:108–22. [DOI] [PubMed] [Google Scholar]
- 34.Dandekar T, Fieselmann A, Majeed S, et al. Software applications toward quantitative metabolic flux analysis and modeling. Brief Bioinform 2014;15:91–107. [DOI] [PubMed] [Google Scholar]
- 35.Schatschneider S, Persicke M, Watt SA, et al. Establishment, in silico analysis, and experimental verification of a large-scale metabolic network of the xanthan producing Xanthomonas campestris pv campestris strain B100. J Biotechnol 2013;167:123–34. [DOI] [PubMed] [Google Scholar]
- 36.Dias O, Pereira R, Gombert AK, et al. iOD907, the first genome-scale metabolic model for the milk yeast Kluyveromyces lactis. Biotechnol J 2014;9:776–90. [DOI] [PubMed] [Google Scholar]
- 37.Larocque M, Chénard T, Najmanovich R. A curated C. difficile strain 630 metabolic network: prediction of essential targets and inhibitors. BMC Syst Biol 2014;8:117. [DOI] [PMC free article] [PubMed] [Google Scholar]
- 38.Karp PD, Paley SM, Krummenacker M, et al. Pathway tools version 13.0: integrated software for pathway/genome informatics and systems biology. Brief Bioinform 2010;11:40–79. [DOI] [PMC free article] [PubMed] [Google Scholar]
- 39.Becker SA, Palsson BØ. Context-specific metabolic networks are consistent with experiments. PLoS Comput Biol 2008;4:e1000082. [DOI] [PMC free article] [PubMed] [Google Scholar]
- 40.Jerby L, Shlomi T, Ruppin E. Computational reconstruction of tissue-specific metabolic models: application to human liver metabolism. Mol Syst Biol 2010;6:401. [DOI] [PMC free article] [PubMed] [Google Scholar]
- 41.Agren R, Bordel S, Mardinoglu A, et al. Reconstruction of genome-scale active metabolic networks for 69 human cell types and 16 cancer types using INIT. PLoS Comput Biol 2012;8:e1002518. [DOI] [PMC free article] [PubMed] [Google Scholar]
- 42.Yizhak K, Gaude E, Le Dévédec S, et al. Phenotype-based cell-specific metabolic modeling reveals metabolic liabilities of cancer. eLife 2014;3e03641. [DOI] [PMC free article] [PubMed] [Google Scholar]
- 43.Li C, Courtot M, Le Novère N, et al. BioModels.net Web Services, a free and integrated toolkit for computational modelling software. Brief Bioinform 2010;11:270–7. [DOI] [PMC free article] [PubMed] [Google Scholar]
- 44.Olivier BG, Bergmann FT. Flux Balance Constraints. Version 1 Release 1. Available from COMBINE http://identifiers.org/combine.specifications/sbml.level-3.version-1.fbc.version-1.release-1 2013. [Google Scholar]
- 45.Feist AM, Henry CS, Reed JL, et al. A genome-scale metabolic reconstruction for Escherichia coli K-12 MG1655 that accounts for 1260 ORFs and thermodynamic information. Mol Syst Biol 2007;3:121. [DOI] [PMC free article] [PubMed] [Google Scholar]
- 46.Flahaut NAL, Wiersma A, van de Bunt B, et al. Genome-scale metabolic model for Lactococcus lactis MG1363 and its application to the analysis of flavor formation. Appl Microbiol Biotechnol 2013;97:8729–39. [DOI] [PubMed] [Google Scholar]
- 47.Le Novère N, Finney A, Hucka M, et al. Minimum information requested in the annotation of biochemical models (MIRIAM). Nat Biotechnol 2005;23:1509–15. [DOI] [PubMed] [Google Scholar]
- 48.Hastings J, de Matos P, Dekker A, et al. The ChEBI reference database and ontology for biologically relevant chemistry: enhancements for 2013. Nucleic Acids Res 2013;41:D456–63. [DOI] [PMC free article] [PubMed] [Google Scholar]
- 49.Bolton EE, Wang Y, Thiessen PA, et al. Chapter 12: PubChem: integrated platform of small molecules and biological activities. In: Wheeler RA, Spellmeyer DC. (Eds). Annual Reports in Computational Chemistry, Vol. 4. Elsevier, Oxford, UK, 2008, 217–41. [Google Scholar]
- 50.Kanehisa M, Goto S, Sato Y, et al. Data, information, knowledge and principle: back to metabolism in KEGG. Nucleic Acids Res 2014;42:D199–205. [DOI] [PMC free article] [PubMed] [Google Scholar]
- 51.Schomburg I, Chang A, Placzek S, et al. BRENDA in 2013: integrated reactions, kinetic data, enzyme function data, improved disease classification: new options and contents in BRENDA. Nucleic Acids Res 2013;41:D764–72. [DOI] [PMC free article] [PubMed] [Google Scholar]
- 52.Ashburner M, Ball CA, Blake JA, et al. Gene ontology: tool for the unification of biology. The Gene Ontology Consortium. Nat Genet 2000;25:25–9. [DOI] [PMC free article] [PubMed] [Google Scholar]
- 53.The UniProt Consortium. Activities at the Universal Protein Resource (UniProt). Nucleic Acids Res 2014;42:D191–8. [DOI] [PMC free article] [PubMed] [Google Scholar]
- 54.Berman HM, Westbrook J, Feng Z, et al. The protein data bank. Nucleic Acids Res 2000;28:235–42. [DOI] [PMC free article] [PubMed] [Google Scholar]
- 55.Bairoch A. The ENZYME database in 2000. Nucleic Acids Res 2000;28:304–5. [DOI] [PMC free article] [PubMed] [Google Scholar]
- 56.Maglott D, Ostell J, Pruitt KD, et al. Entrez Gene: gene-centered information at NCBI. Nucleic Acids Res 2005;33:D54–8. [DOI] [PMC free article] [PubMed] [Google Scholar]
- 57.Logan-Klumpler FJ, De Silva N, Boehme U, et al. GeneDB–an annotation database for pathogens. Nucleic Acids Res 2012;40:D98–108. [DOI] [PMC free article] [PubMed] [Google Scholar]
- 58.Safran M, Dalah I, Alexander J, et al. GeneCards Version 3: the human gene integrator. Database (Oxford) 2010;2010:baq020. [DOI] [PMC free article] [PubMed] [Google Scholar]
- 59.Ladd AN, Cooper TA. Finding signals that regulate alternative splicing in the post-genomic era. Genome Biol 2002;3:1–16. [DOI] [PMC free article] [PubMed] [Google Scholar]
- 60.Buck K, Vanek M, Groner B, et al. Multiple forms of prolactin receptor messenger ribonucleic acid are specifically expressed and regulated in murine tissues and the mammary cell line HC11. Endocrinol 1992;130:1108–14. [DOI] [PubMed] [Google Scholar]
- 61.Pan Q, Shai O, Lee LJ, et al. Deep surveying of alternative splicing complexity in the human transcriptome by high-throughput sequencing. Nat Genet 2008;40:1413–15. [DOI] [PubMed] [Google Scholar]
- 62.Djerbi M, Darreh-Shori T, Zhivotovsky B, et al. Characterization of the human FLICE-inhibitory protein locus and comparison of the anti-apoptotic activity of four different flip isoforms. Scand J Immunol 2001;54:180–9. [DOI] [PubMed] [Google Scholar]
- 63.Vaz FM, Houtkooper RH, Valianpour F, et al. Only one splice variant of the human TAZ gene encodes a functional protein with a role in cardiolipin metabolism. J Biol Chem 2003;278:43089–94. [DOI] [PubMed] [Google Scholar]
- 64.Girard H, Lévesque E, Bellemare J, et al. Genetic diversity at the UGT1 locus is amplified by a novel 3’ alternative splicing mechanism leading to nine additional UGT1A proteins that act as regulators of glucuronidation activity. Pharmacogenet Genomics 2007;17:1077–89. [DOI] [PubMed] [Google Scholar]
- 65.Bellemare J, Rouleau M, Harvey M, et al. Modulation of the human glucuronosyltransferase UGT1A pathway by splice isoform polypeptides is mediated through protein-protein interactions. J Biol Chem 2010;285:3600–7. [DOI] [PMC free article] [PubMed] [Google Scholar]
- 66.Rodriguez JM, Maietta P, Ezkurdia I, et al. APPRIS: annotation of principal and alternative splice isoforms. Nucleic Acids Res 2013;41:D110–17. [DOI] [PMC free article] [PubMed] [Google Scholar]
- 67.Lewis NE, Hixson KK, Conrad TM, et al. Omic data from evolved E. coli are consistent with computed optimal growth from genome-scale models. Mol Syst Biol 2010;6:390. [DOI] [PMC free article] [PubMed] [Google Scholar]
- 68.Trapnell C, Williams BA, Pertea G, et al. Transcript assembly and quantification by RNA-Seq reveals unannotated transcripts and isoform switching during cell differentiation. Nat Biotechnol 2010:28:511–15. [DOI] [PMC free article] [PubMed] [Google Scholar]
- 69.Gonzàlez-Porta M, Frankish A, Rung J, et al. Transcriptome analysis of human tissues and cell lines reveals one dominant transcript per gene. Genome Biol 2013:14:R70. [DOI] [PMC free article] [PubMed] [Google Scholar]
- 70.Yao S, Ireland S, Bee A, et al. Splice variant PRKC-ζ-PrC is a novel biomarker of human prostate cancer. Br J Cancer 2012;107:388–99. [DOI] [PMC free article] [PubMed] [Google Scholar]
- 71.Liu Z, Wang Y, Wang S, et al. Nek2C functions as a tumor promoter in human breast tumorigenesis. Int J Mol Med 2012;30:775. [DOI] [PubMed] [Google Scholar]
- 72.Wielenga VJ, Heider KH, Johan G, et al. Expression of CD44 variant proteins in human colorectal cancer is related to tumor progression. Cancer Res 1993;53:4754–6. [PubMed] [Google Scholar]
- 73.Tazi J, Bakkour N, Stamm S. Alternative splicing and disease. Biochim Biophys Acta 2009;1792:14–26. [DOI] [PMC free article] [PubMed] [Google Scholar]
- 74.Nissim-Rafinia M, Kerem B. Splicing regulation as a potential genetic modifier. Trends Genet 2002;18:123–7. [DOI] [PubMed] [Google Scholar]
- 75.Mazurek S, Boschek CB, Hugo F, et al. Pyruvate kinase type M2 and its role in tumor growth and spreading, Semin Cancer Biol 2005;15(4):300–8. [DOI] [PubMed] [Google Scholar]
- 76.Calarco JA, Zhen M, Blencowe BJ. Networking in a global world: establishing functional connections between neural splicing regulators and their target transcripts. RNA 2011;17:775–91. [DOI] [PMC free article] [PubMed] [Google Scholar]
- 77.Kalsotra A, Cooper TA. Functional consequences of developmentally regulated alternative splicing. Nat Rev Genet 2011;12:715–29. [DOI] [PMC free article] [PubMed] [Google Scholar]
- 78.Licatalosi DD, Darnell RB. RNA processing and its regulation: global insights into biological networks. Nat Rev Genet 2010;11:75–87. [DOI] [PMC free article] [PubMed] [Google Scholar]
- 79.Ellis JD, Barrios-Rodiles M, Olak R, et al. Tissue-specific alternative splicing remodels protein-protein interaction networks. Mol Cell 2012;46:884–92. [DOI] [PubMed] [Google Scholar]
- 80.Xu Q, Modrek B, Lee C. Genome-wide detection of tissue-specific alternative splicing in the human transcriptome. Nucleic Acids Res 2002;30:3754–66. [DOI] [PMC free article] [PubMed] [Google Scholar]
- 81.Pal S, Gupta R, Davuluri RV. Alternative transcription and alternative splicing in cancer. Pharmacol Ther 2012;136:283–94. [DOI] [PubMed] [Google Scholar]
- 82.Chen J, Weiss W. Alternative splicing in cancer: implications for biology and therapy. Oncogene 2015;34:1–14. [DOI] [PubMed] [Google Scholar]
- 83.Mills JD, Janitz M. Alternative splicing of mRNA in the molecular pathology of neurodegenerative diseases. Neurobiol Aging 2012;33:1012.e11–24. [DOI] [PubMed] [Google Scholar]
- 84.Alarcón MA, Medina MA, Hu Q, et al. A novel functional low-density lipoprotein receptor-related protein 6 gene alternative splice variant is associated with Alzheimer’s disease. Neurobiol Aging 2013;34:1709–e9. [DOI] [PubMed] [Google Scholar]
- 85.Beyer K, Ariza A. Alpha-synuclein posttranslational modification and alternative splicing as a trigger for neurodegeneration. Mol Neurobiol 2013;47:509–24. [DOI] [PubMed] [Google Scholar]
- 86.Ishunina TA, Swaab DF. Decreased alternative splicing of estrogen receptor-α mRNA in the Alzheimer’s disease brain. Neurobiol Aging 2012;33:286–96. [DOI] [PubMed] [Google Scholar]
- 87.Kim N, Alekseyenko AV, Roy M, et al. The ASAP II database: analysis and comparative genomics of alternative splicing in 15 animal species. Nucleic Acids Res 2007;35:D93–8. [DOI] [PMC free article] [PubMed] [Google Scholar]
- 88.Lee Y, Lee Y, Kim B, et al. ECgene: an alternative splicing database update. Nucleic Acids Res 2007;35:D99–103. [DOI] [PMC free article] [PubMed] [Google Scholar]
- 89.Koscielny G, Le Texier V, Gopalakrishnan C, et al. ASTD: the alternative splicing and transcript diversity database. Genomics 2009;93:213–20. [DOI] [PubMed] [Google Scholar]
- 90.Holste D, Huo G, Tung V, et al. HOLLYWOOD: a comparative relational database of alternative splicing. Nucleic Acids Res 2006;34:D56–62. [DOI] [PMC free article] [PubMed] [Google Scholar]
- 91.Takeda JI, Suzuki Y, Nakao M, et al. H-DBAS: alternative splicing database of completely sequenced and manually annotated full-length cDNAs based on H-Invitational. Nucleic Acids Res 2007;35:D104–9. [DOI] [PMC free article] [PubMed] [Google Scholar]
- 92.De La Grange P, Dutertre M, Martin N, et al. FAST DB: a website resource for the study of the expression regulation of human gene products. Nucleic Acids Res 2005;33:4276–84. [DOI] [PMC free article] [PubMed] [Google Scholar]
- 93.Maeda N, Kasukawa T, Oyama R, et al. Transcript annotation in FANTOM3: mouse gene catalog based on physical cDNAs. PLoS Genet 2006;2:e62. [DOI] [PMC free article] [PubMed] [Google Scholar]
- 94.Hubbard T, Barker D, Birney E, et al. The Ensembl genome database project. Nucleic Acids Res 2002;30:38–41. [DOI] [PMC free article] [PubMed] [Google Scholar]
- 95.Flicek P, Ahmed I, Amode MR, et al. Ensembl 2013. Nucleic Acids Res 2013;41:D48–55. [DOI] [PMC free article] [PubMed] [Google Scholar]
- 96.Bateman A, Birney E, Cerruti L, et al. The Pfam protein families database. Nucleic Acids Res 2002;30:276–80. [DOI] [PMC free article] [PubMed] [Google Scholar]
- 97.Finn RD, Tate J, Mistry J, et al. The Pfam protein families database. Nucleic Acids Res 2008;36:D281–8. [DOI] [PMC free article] [PubMed] [Google Scholar]
- 98.Bairoch A, Apweiler R, Wu CH, et al. The Universal Protein Resource (UniProt). Nucleic Acids Res 2005;33:D154–9. [DOI] [PMC free article] [PubMed] [Google Scholar]
- 99.Kelemen O, Convertini P, Zhang Z, et al. Function of alternative splicing. Gene 2013;514:1–30. [DOI] [PMC free article] [PubMed] [Google Scholar]
- 100.Taneri B, Gaasterland T. Genome and Transcriptome Sequence Databases for Discovery, Storage, and Representation of Alternative Splicing Events. John Wiley & Sons, Hoboken, New Jersey, USA: 2013, 1–34. [Google Scholar]
- 101.Bilofsky HS, Burks C. The GenBank genetic sequence data bank. Nucleic Acids Res 1988;16:1861–3. [DOI] [PMC free article] [PubMed] [Google Scholar]
- 102.Benson DA, Karsch-Mizrachi I, Lipman DJ, et al. GenBank: update. Nucleic Acids Res 2004;32:D23–6. [DOI] [PMC free article] [PubMed] [Google Scholar]
- 103.Kanehisa M, Goto S. KEGG: kyoto encyclopedia of genes and genomes. Nucleic Acids Res 2000;28:27–30. [DOI] [PMC free article] [PubMed] [Google Scholar]
- 104.Schnoes AM, Brown SD, Dodevski I, et al. Annotation error in public databases: misannotation of molecular function in enzyme superfamilies. PLoS Comput Biol 2009;5:e1000605. [DOI] [PMC free article] [PubMed] [Google Scholar]
- 105.Salzberg SL. Genome re-annotation: a wiki solution? Genome Biol 2007;8:102. [DOI] [PMC free article] [PubMed] [Google Scholar]
- 106.Harrow J, Frankish A, Gonzalez JM, et al. GENCODE: the reference human genome annotation for The ENCODE Project. Genome Res 2012;22:1760–74. [DOI] [PMC free article] [PubMed] [Google Scholar]
- 107.The ENCODE Project Consortium and others. The ENCODE (ENCyclopedia of DNA elements) project. Science 2004;306:636–40. [DOI] [PubMed] [Google Scholar]
- 108.Wilming LG, Gilbert JG, Howe K, et al. The Vertebrate Genome Annotation (Vega) database. Nucleic Acids Res 2008;36:D753–60. [DOI] [PMC free article] [PubMed] [Google Scholar]
- 109.The 1000 Genomes Project Consortium and others. A map of human genome variation from population-scale sequencing. Nature 2010;467:1061–73. [DOI] [PMC free article] [PubMed] [Google Scholar]
- 110.Martelli PL, D’Antonio M, Bonizzoni P, et al. ASPicDB: a database of annotated transcript and protein variants generated by alternative splicing. Nucleic Acids Res 2010;39:D80–5. [DOI] [PMC free article] [PubMed] [Google Scholar]
- 111.Bonizzoni P, Mauri G, Pesole G, et al. Detecting alternative gene structures from spliced ESTs: a computational approach. J Comput Biol 2009;16:43–66. [DOI] [PubMed] [Google Scholar]
- 112.Takeda JI, Suzuki Y, Sakate R, et al. H-DBAS: human-transcriptome database for alternative splicing: update 2010. Nucleic Acids Res 2010;38:D86–90. [DOI] [PMC free article] [PubMed] [Google Scholar]
- 113.Zhang F, Drabier R. SASD: the Synthetic Alternative Splicing Database for identifying novel isoform from proteomics. BMC Bioinf 2013;14:S13. [DOI] [PMC free article] [PubMed] [Google Scholar]
- 114.Wang BB, Brendel V. Genomewide comparative analysis of alternative splicing in plants. Proc Natl Acad Sci USA 2006;103:7175–80. [DOI] [PMC free article] [PubMed] [Google Scholar]
- 115.Radrich K, Tsuruoka Y, Dobson P, et al. Integration of metabolic databases for the reconstruction of genome-scale metabolic networks. BMC Sys Biol 2010;4:114. [DOI] [PMC free article] [PubMed] [Google Scholar]
- 116.Henry CS, DeJongh M, Best AA, et al. High-throughput generation, optimization and analysis of genome-scale metabolic models. Nat Biotechnol 2010;28:977–82. [DOI] [PubMed] [Google Scholar]
- 117.Remize F, Andrieu E, Dequin S. Engineering of the pyruvate dehydrogenase bypass in Saccharomyces cerevisiae: role of the cytosolic Mg2+ and mitochondrial K+ acetaldehyde dehydrogenases Ald6p and Ald4p in acetate formation during alcoholic fermentation. Appl Environ Microbiol 2000;66:3151–9. [DOI] [PMC free article] [PubMed] [Google Scholar]
- 118.De Martino D, Capuani F, Mori M, et al. Counting and correcting thermodynamically infeasible flux cycles in genome-scale metabolic networks. Metabolites 2013;3:946–66. [DOI] [PMC free article] [PubMed] [Google Scholar]
- 119.Aziz RK, Bartels D, Best AA, et al. The RAST Server: rapid annotations using subsystems technology. BMC Genomics 2008;9:75. [DOI] [PMC free article] [PubMed] [Google Scholar]
- 120.Bernard T, Bridge A, Morgat A, et al. Reconciliation of metabolites and biochemical reactions for metabolic networks. Brief Bioinform 2014;15:123–35. [DOI] [PMC free article] [PubMed] [Google Scholar]
- 121.Abelö A, Andersson TB, Antonsson M, et al. Stereoselective metabolism of omeprazole by human cytochrome P450 enzymes. Drug Metab Dispos 2000;28:966–72. [PubMed] [Google Scholar]
- 12@.Förster J, Famili I, Palsson BØ, et al. Large-scale evaluation of in silico gene deletions in Saccharomyces cerevisiae. OMICS 2003;7:193–202. [DOI] [PubMed] [Google Scholar]
- 123.Duarte NC, Herrgård MJ, Palsson BØ. Reconstruction and validation of Saccharomyces cerevisiae iND750, a fully compartmentalized genome-scale metabolic model. Genome Res 2004;14:1298–309. [DOI] [PMC free article] [PubMed] [Google Scholar]
- 124.Kuepfer L, Sauer U, Blank LM. Metabolic functions of duplicate genes in Saccharomyces cerevisiae. Genome Res 2005;15:1421–30. [DOI] [PMC free article] [PubMed] [Google Scholar]
- 125.Herrgård MJ, Swainston N, Dobson P, et al. A consensus yeast metabolic network reconstruction obtained from a community approach to systems biology. Nat Biotechnol 2008;26:1155–60. [DOI] [PMC free article] [PubMed] [Google Scholar]
- 126.Romero P, Wagg J, Green ML, et al. Computational prediction of human metabolic pathways from the complete human genome. Genome Biol 2005;6:R2. [DOI] [PMC free article] [PubMed] [Google Scholar]