Cultured pluripotent stem cells are a cornerstone of regenerative medicine due to their ability to give rise to all cell types of the body. Although pluripotent stem cells can be propagated indefinitely in vitro, pluripotency is paradoxically a transient state in vivo, lasting 2-3 days around the time of blastocyst implantation1. The exception to this rule is embryonic diapause, a reversible state of suspended development triggered by unfavorable conditions2. Diapause is a physiological reproductive strategy widely employed across the animal kingdom, including in mammals, but its regulation remains poorly understood. Here we report that partial inhibition of mechanistic target of rapamycin (mTor), a major nutrient sensor and promoter of growth3, induces reversible pausing of mouse blastocyst development and allows their prolonged culture ex vivo. Paused blastocysts remain pluripotent and competent to give rise to embryonic stem (ES) cells and mice. We show that both naturally diapaused blastocysts in vivo and paused blastocysts ex vivo display pronounced reductions in mTor activity, translation, histone modifications associated with gene activity and transcription. Pausing can be induced directly in cultured ES cells and sustained for weeks without appreciable cell death or deviations from cell cycle distributions. We show that paused ES cells display a remarkable global suppression of transcription, maintain a gene expression signature of diapaused blastocysts and remain pluripotent. These results uncover a new pluripotent stem cell state corresponding to the epiblast of the diapaused blastocyst and indicate that mTor regulates developmental timing at peri-implantation. Our findings have important implications in the fields of assisted reproduction, regenerative medicine, cancer, metabolic disorders and aging.
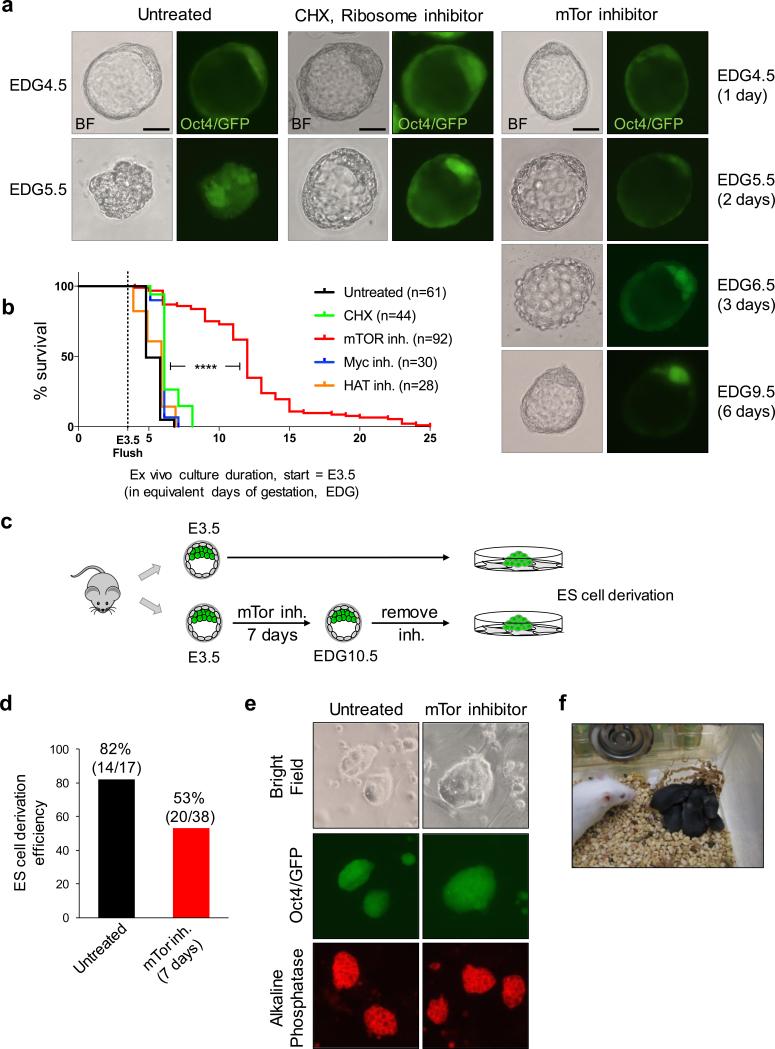
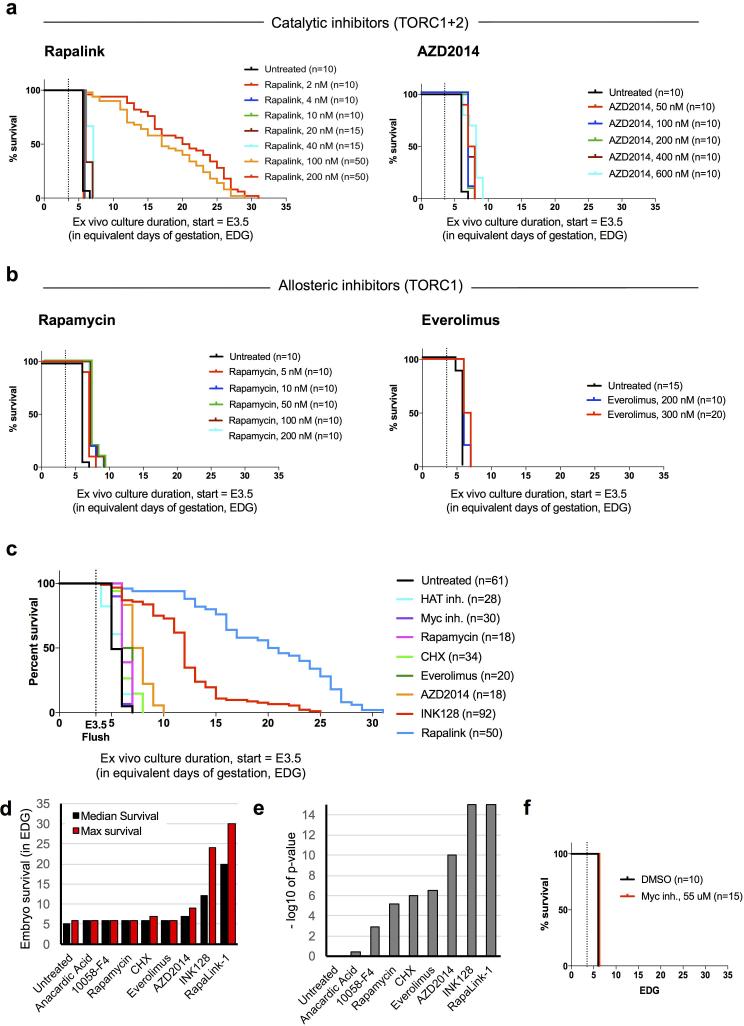
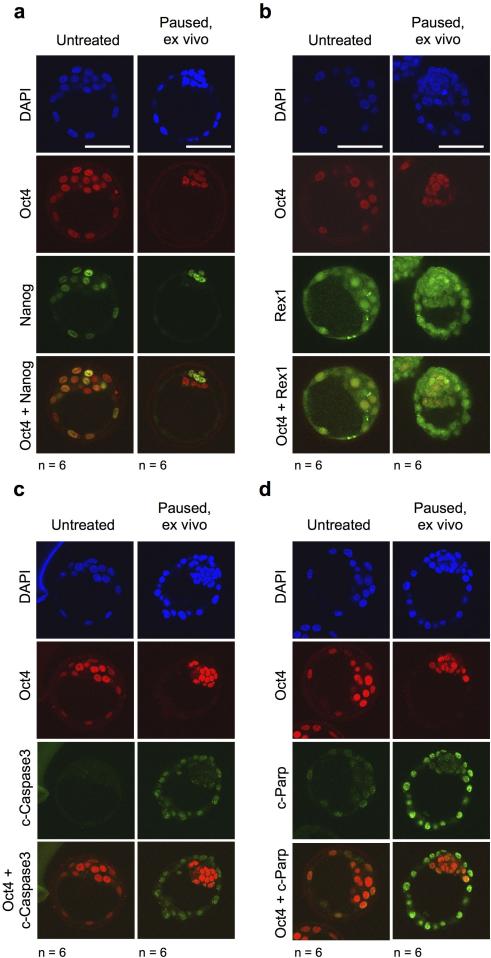
Preimplantation mammalian embryos can develop in suspension culture ex vivo up to the blastocyst stage. The E3.5 mouse blastocyst collapses after ~24-48 hours (Fig. 1a), but its survival can be extended for several days if nutrients like glucose or certain amino acids are removed from the medium4,5. We hypothesized that inhibiting growth pathways might induce a viable dormant state in blastocysts. We isolated blastocysts and cultured them ex vivo in the presence of small molecule inhibitors of translation, mTor signaling, Myc family transcription factors or histone acetyltransferases (HATs) (Fig. 1a, b). We found that inhibition of translation, Myc or HATs has minimal effects on blastocyst survival, prolonging it by a maximum of 1 day relative to controls (Fig. 1b, Extended Data Fig. 1c-f). These results are in agreement with recent findings describing culture of Myc-depleted blastocysts for 18 hours6. Remarkably, reducing mTor activity using INK1287 enables a major extension of blastocyst culture by 9-12 days [Equivalent Days of Gestation (EDG) 12.5-15.5] for the majority of embryos, reaching a maximum of 22 days ex vivo, i.e., EDG25.5 (Fig. 1b). Given that mouse gestation lasts 19 days, these data indicate that blastocysts can be maintained in culture past the time it would take for birth to occur. Another recently developed inhibitor of mTor (RapaLink-1), which like INK128 inhibits both mTORC1 and mTORC2 complexes8, greatly extends blastocyst survival ex vivo (Extended Data Fig. 1a-c). Allosteric inhibitors like Rapamycin, which target just the mTORC1 complex, only marginally extend blastocyst survival (Extended Data Fig. 1a-c), suggesting that inhibition of both complexes is required for developmental pausing. mTor-inhibited blastocysts retain a well-expanded blastocoel, activity of the Oct4/GFP transgene and normal expression patterns of Nanog and Rex1 (Fig. 1a and Extended Data Fig. 2a, b). Apoptosis markers are largely absent in the inner cell mass (ICM) but can be detected in the trophectoderm (TE) of mTor-inhibited blastocysts (Extended Data Fig. 2c, d).
Figure 1.
mTor inhibition induces blastocyst pausing ex vivo. a, Representative images of bright field and Oct4/GFP expression of blastocysts cultured ex vivo under indicated conditions. Scale bars = 25 μm. b, Kaplan-Maier survival curves of blastocysts cultured ex vivo with inhibitors. n, number of blastocysts tested. ****=P-value<0.0001 from log-rank (Mantel-Cox) test. c, Workflow of ES cell derivation from untreated or mTor-inhibited embryos. d, ES cell derivation efficiency from untreated and mTor-inhibited embryos. The reduced efficiency of derivation from mTor-inhibited embryos may be due to a lower frequency of hatching from the zona pellucida. e, Representative images of bright field, Oct4/GFP (passage 2) and alkaline phosphatase staining (passage 4) of ES cells derived from untreated and mTor-inhibited embryos. f, Live-born mice generated by transfer of mTor-inhibited blastocysts at EDG8.5 into surrogate females. See Extended Data Fig. 2a for details.
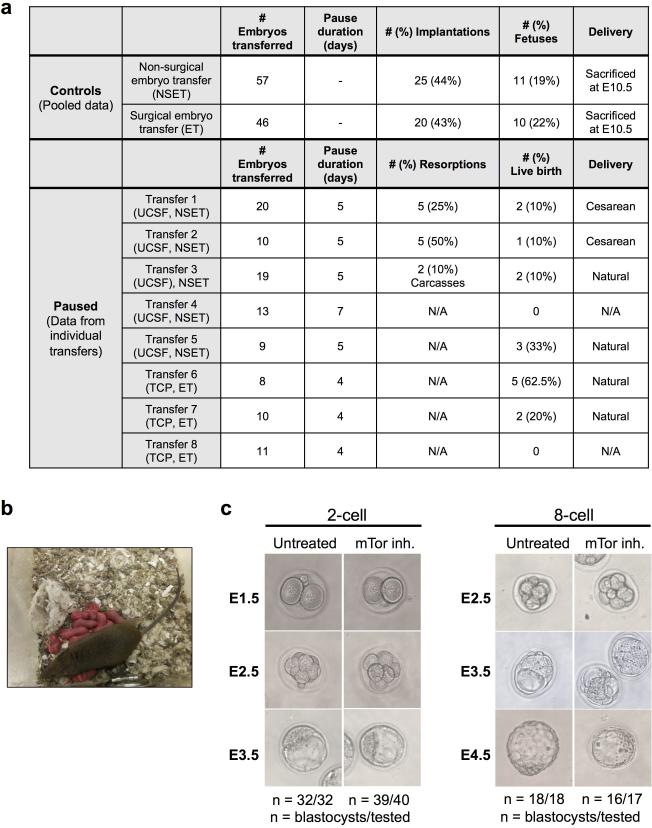
Blastocysts cultured for 7 days in mTor inhibitor give rise to ES cells (Fig. 1c, d) that express pluripotency markers (Fig. 1e). Moreover, blastocysts cultured in mTor inhibitor for 4-5 days can give rise to live-born, fertile mice (Fig. 1f and Extended Data Fig. 3a, b). These results indicate that mTor inhibition induces and sustains a reversible paused pluripotent state (referred to as ‘paused’ from here onwards). Interestingly, cleavage-stage embryos cannot be paused by inhibition of mTor and instead develop with a slight delay to the blastocyst stage (Extended Data Fig. 3c).
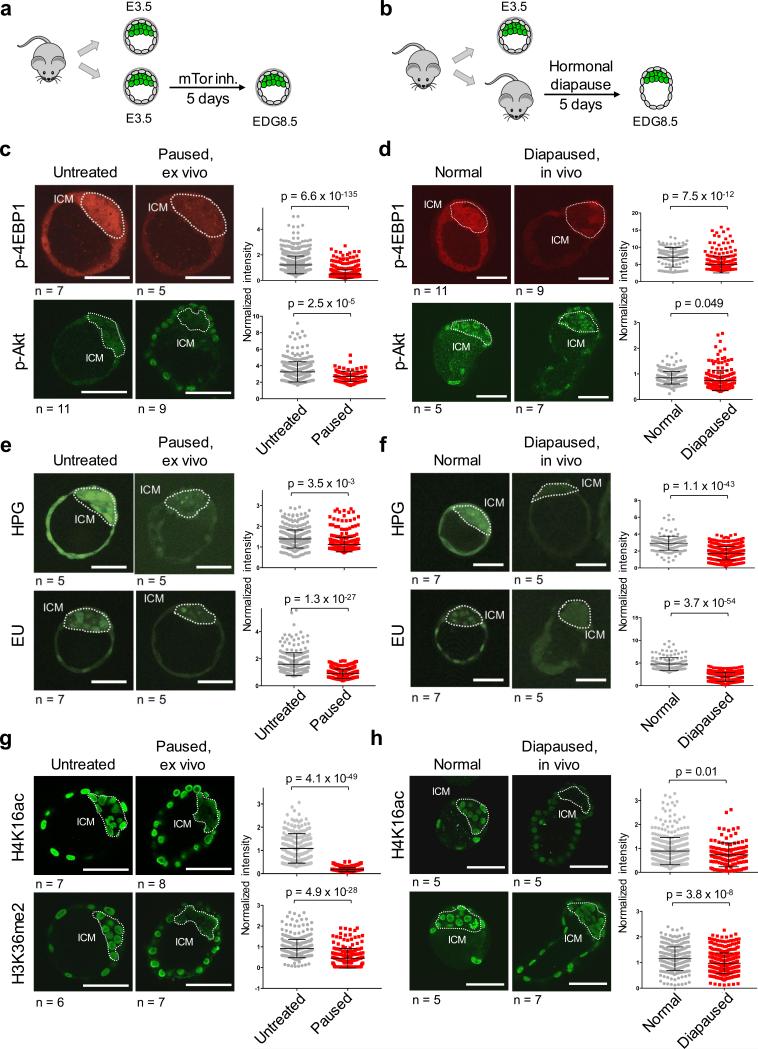
Mouse blastocysts can undergo diapause in utero for up to 2 weeks if the pregnant female is lactating, a state that can be simulated hormonally9. In fact, the first ES cell lines were derived from diapaused blastocysts10. We compared EDG8.5 blastocysts generated either ex vivo via mTor inhibition or in vivo by hormonally inducing diapause in pregnant females9 (Fig. 2a, b). A primary function of mTor is to induce high translational output in growing cells by directly phosphorylating and inactivating 4EBP1, a repressor of translation3. The levels of Phospho-4EBP1, a target of mTORC1, are significantly reduced in paused and diapaused blastocysts relative to control blastocysts (Fig. 2c, d). Phospho-Akt, an mTORC2 target and positive regulator of proliferation and metabolism3, is also reduced in paused blastocysts, and to a lesser extent in diapaused blastocysts (Fig. 2c, d). Moreover, blastocysts paused ex vivo and diapaused in vivo display significant reductions in nascent protein synthesis relative to control embryos (Fig. 2e, f). These results are in agreement with previous reports showing reduced translation in diapaused blastocysts6,11. However, suppressed translation alone is not sufficient to drive pausing, evidenced by the only slight extension in ex vivo blastocyst survival upon inhibition of protein synthesis (Fig. 1b).
Figure 2.
Ex vivo paused blastocysts and in vivo diapaused blastocysts have similarly suppressed cellular functions. a-b, Workflow of the generation of ex vivo paused (a) and in vivo diapaused (b) blastocysts at EDG8.5. c-h, Ex vivo paused (c, e and g) and in vivo diapaused blastocysts (d, f and h) were stained for the indicated markers. c-d, Phospho-4EBP1 phosphorylation and Phospho-Akt; e-f, nascent translation (EU) or transcription (HPG); g-h, H4K16ac and H3K36me2. Representative images are shown. ICM is marked with dashed lines based on Oct4 staining. Each ICM cell was quantified and pooled data from embryos were plotted in adjacent graphs. n=number of embryos. Values represent mean±SD. P-values are from two-tailed unpaired student's t-test. Scale bars = 50 μm.
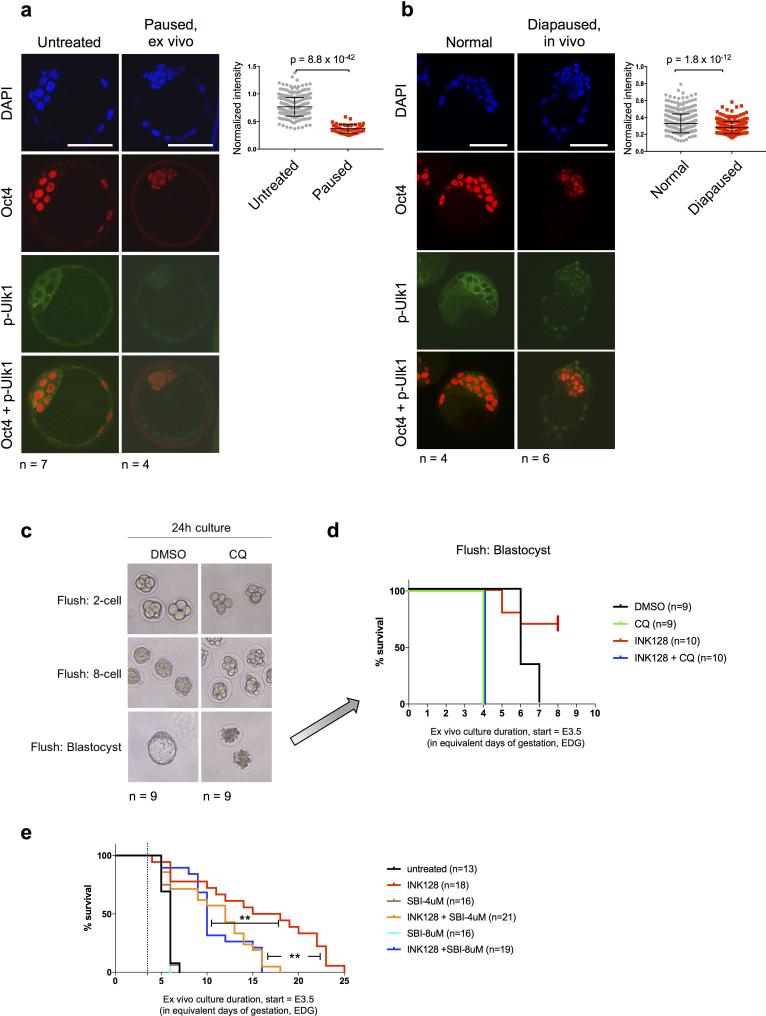
mTor is known to phosphorylate and inactivate regulators of autophagy. One major mTor target in this context is Ulk1 (also known as Atg1)12. Consistent with this notion, paused and diapaused blastocysts have reduced levels of Phospho-Ulk1 (Extended Data Fig. 4a, b). Autophagy has previously been shown to be required for pre-implantation development13 and implicated in blastocyst diapause in vivo14. We found that the survival ratio and longevity of paused blastocysts are significantly reduced when co-treated with the Ulk1 inhibitor SBI-0206965 (Extended Data Fig. 4c-e). Taken together with the published literature, these data suggest that autophagy is a component of blastocyst maintenance during developmental pausing.
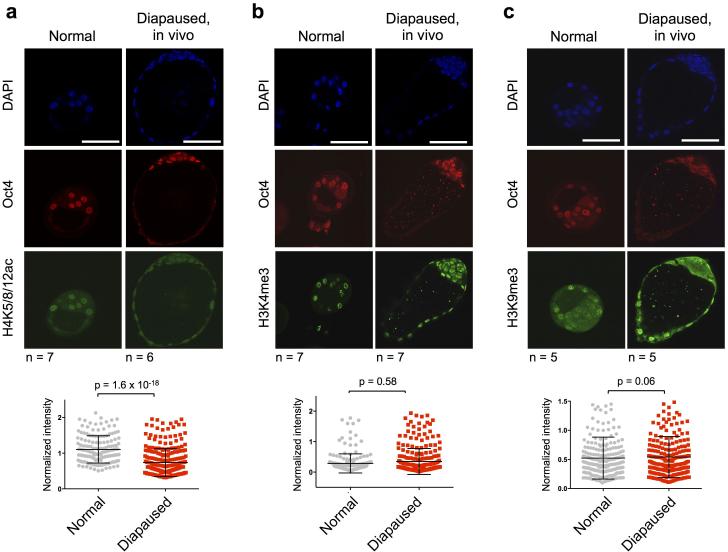
We asked whether inhibition of growth and translation are associated with changes in transcriptional activity and chromatin landscape. We found that both paused and diapaused blastocysts display a remarkable reduction in nascent transcription (Fig. 2e, f). By immunofluorescence we did not detect significant changes in the global levels of H3K4me3, a chromatin mark associated with active promoters, or H3K9me3, a heterochromatin mark (Extended Data Fig. 5b, c). In contrast, we found that both paused blastocysts and diapaused blastocysts exhibit sharply reduced levels of H4K16ac, H4K5/8/12ac and H3K36me2, particularly in the ICM (Fig. 2g, h and Extended Data Fig. 5a). Histone H4 acetylation and H3K36me2 are highly correlated with transcriptional activity. Thus, developmental pausing involves a chromatin landscape associated with suppressed transcription. Nevertheless, neither inhibition of histone acetylation nor suppression of Myc-mediated transcription15,16 can sustain a paused blastocyst state (Fig. 1b). Moreover, the TE and the ICM appear to differ in terms of changes to their chromatin landscapes in response to mTor inhibition, yet both display suppressed transcription and translation in agreement with data implicating mTor in TE differentiation17. These results suggest that a combination of multiple effects downstream of mTor inhibition on both the ICM and the TE mediates blastocyst pausing.
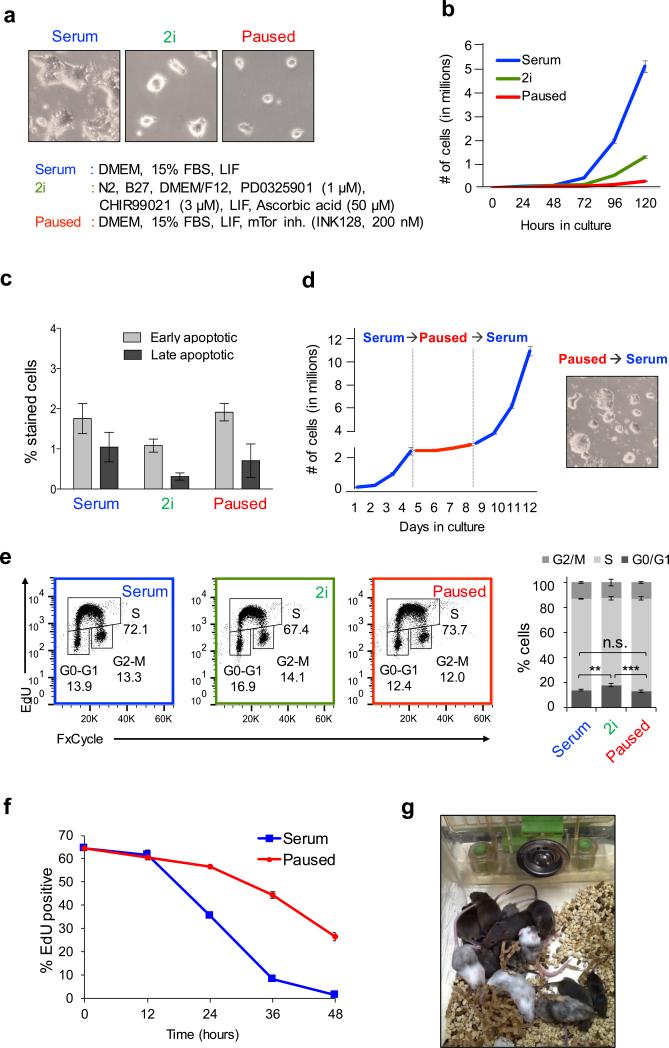
Pluripotency exists in different states in vivo, which can be captured in vitro using distinct media formulations for ES cell culture1. We sought to capture the paused pluripotent state in vitro by inhibiting mTor. ES cells cultured in serum with mTor inhibitor (‘paused’) grow at a much slower rate than cells in either serum or 2i/vitamin C18,19 conditions (Fig. 3b). Paused ES cells can be sustained in culture for weeks without appreciable cell death (Fig. 3c), unlike ES cells with reduced levels of Myc activity6, and rapidly resume growth upon release from the mTor inhibitor (Fig. 3d).
Figure 3.
mTor inhibition induces pausing of ES cells. a, Representative bright field images of ES cells cultured in serum, 2i and paused conditions (media compositions listed). b, Expansion curves of serum, 2i and paused ES cells. Two biological replicates, each with three technical replicates, were performed. c, Flow cytometry analysis of apoptotic cell populations in serum, 2i and paused ES cells. Annexin V and Sytox Blue were used for early and late apoptosis. 8 technical replicates were performed. d, Expansion curves of ES cells showing the reversible nature of the paused state. Two biological replicates, each with three technical replicates, were performed. e, Cell cycle analysis of serum, 2i and paused ES cells, based on four technical replicates of each state. f, Flow cytometry showing dilution of incorporated EdU in serum and paused ES cells. 3 technical replicates are shown. g, Chimeric mice generated from G4 ES cells previously paused for 7 days and released from pausing prior to morula aggregations with albino host embryos.
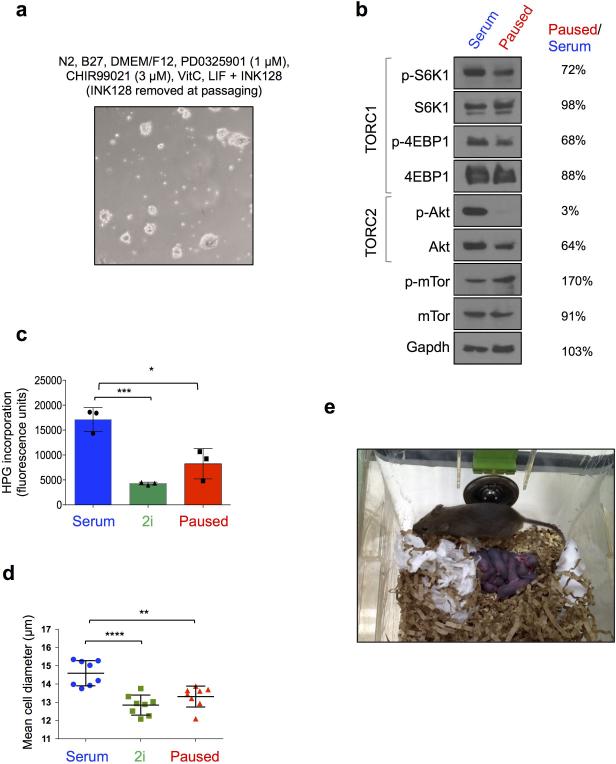
Paused ES cells show the same cell cycle distribution as serum cells, whereas 2i cells have a slightly higher proportion of cells in G0/G1 (Fig. 3e). However, the 5-ethynyl-2’-deoxyuridine (EdU) label, which marks S phase, is diluted at a much slower rate in paused cells than in serum cells (Fig. 3f). These data suggest that paused ES cells progress slower through the cell cycle without a preferential accumulation at any particular stage. Similarly to paused and diapaused blastocysts, paused ES cells have reduced levels of mTORC1/2 activity and nascent translation, correlating with a decrease in cell size (Extended Data Fig. 6b-d). Upon release from pause, ES cells contribute to high-grade, germline-transmitting mouse chimeras (Fig. 3g and Extended Data Fig. 6e), confirming their full developmental potential in vivo.
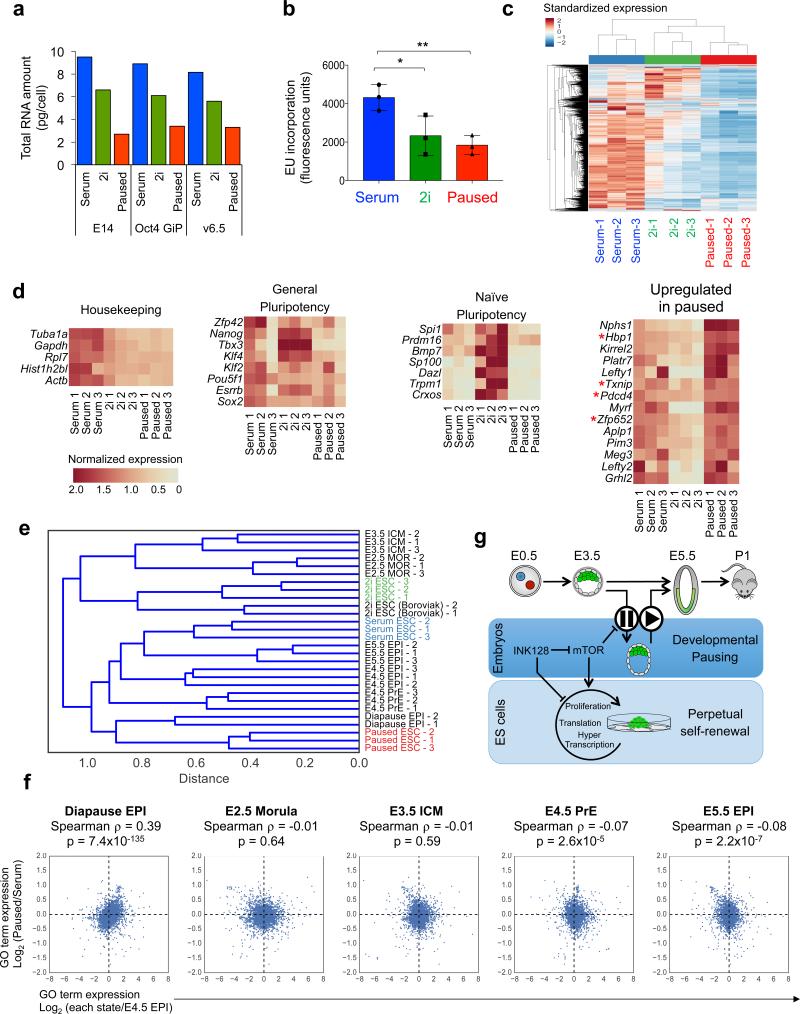
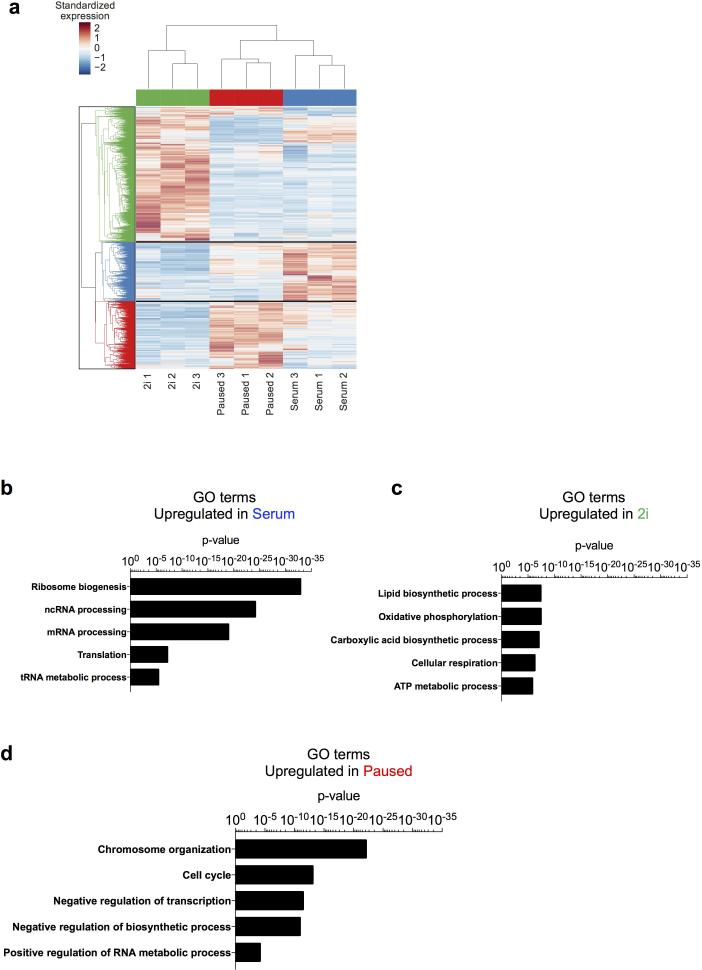
Paused ES cells display a global suppression of transcription, evident at both the total and nascent RNA levels (Fig. 4a, b). We next analyzed the transcriptome of ES cells in serum, 2i and paused conditions. Due to the significant differences in total RNA levels per cell between the three states, we first performed cell number-normalized RNA-seq (See Methods, Extended Data Fig. 7 and Supplementary Table 2). The analysis revealed a remarkably suppressed transcriptome in paused ES cells (Fig. 4c), in line with the hypotranscriptional state observed in paused and diapaused blastocysts. Interestingly, while the vast majority of genes are downregulated in the paused state relative to serum or 2i conditions, some transcriptional and translational repressors are selectively upregulated in paused ES cells (Fig. 4d). To further probe the expression differences between the three states, we analyzed gene expression levels relative to the total abundance of mRNA within each condition (i.e., sequencing depth normalization, see Methods and Extended Data Fig. 8a). We found that the distribution of the transcriptome of paused ES cells is significantly biased towards a relative upregulation of repressors of transcription (Extended Data Fig. 8b-d and Supplementary Table 3). These results indicate that paused ES cells are characterized by a global state of hypotranscription, potentially mediated by a set of transcriptional repressors. These features make the paused ES cell transcriptome readily distinguishable from serum and 2i ES cells.
Figure 4.
Paused ES cells display global transcriptional suppression and mimic diapause. a, Total RNA amount per cell in three ES cell lines cultured in serum, 2i or pause conditions. The same cell lines were used for RNA-seq (c-e). b, Flow cytometry analysis of nascent transcription in the three states. Three technical replicates using E14 cells are shown. c, Hierarchical clustering showing standardized expression values for 5992 genes with robust expression in at least one ES cell state (see Methods). d, Heatmap representation of the indicated gene sets in serum, 2i and paused ES cells. Asterisks indicate repressor factors. e-f, Comparison of RNA-seq data from this study with distinct pluripotent cells in vivo20. e, Hierarchical clustering indicating that the transcriptome of paused ES cells is similar to the in vivo diapaused epiblast. f, Scatter plots of GO term expression. y-axis represents log2 fold change of GO term expression in paused vs. serum ES cells. x-axes represent log2 fold change of GO term expression in the indicated developmental stages vs. E4.5 epiblast. g, Model for the developmental pausing of blastocysts and ES cells by mTor inhibition.
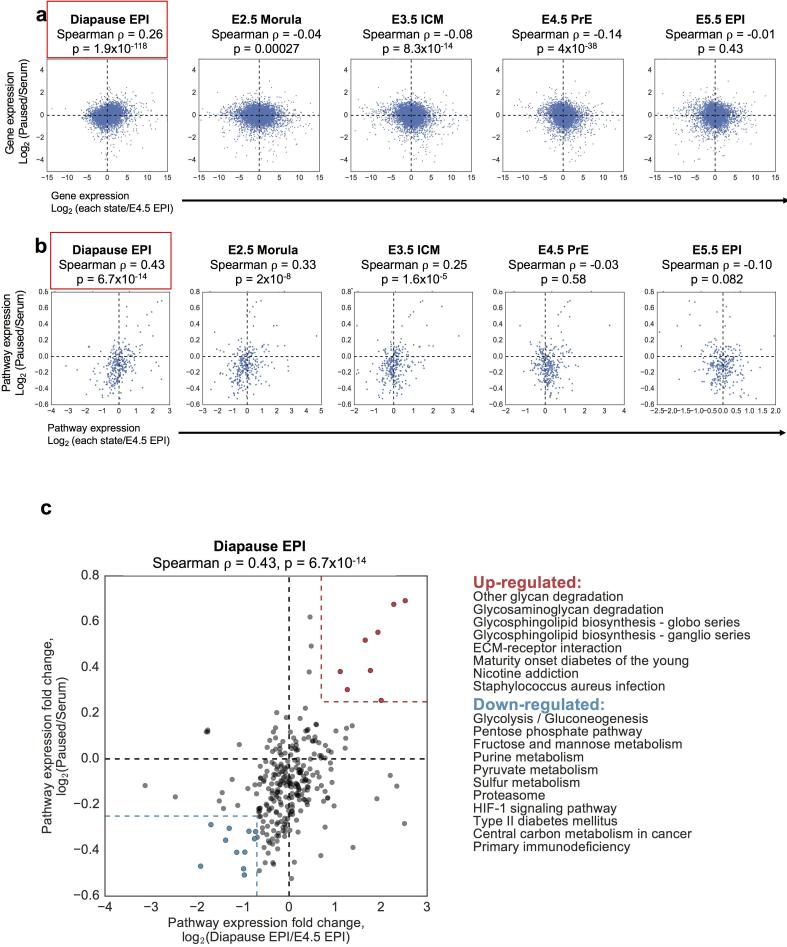
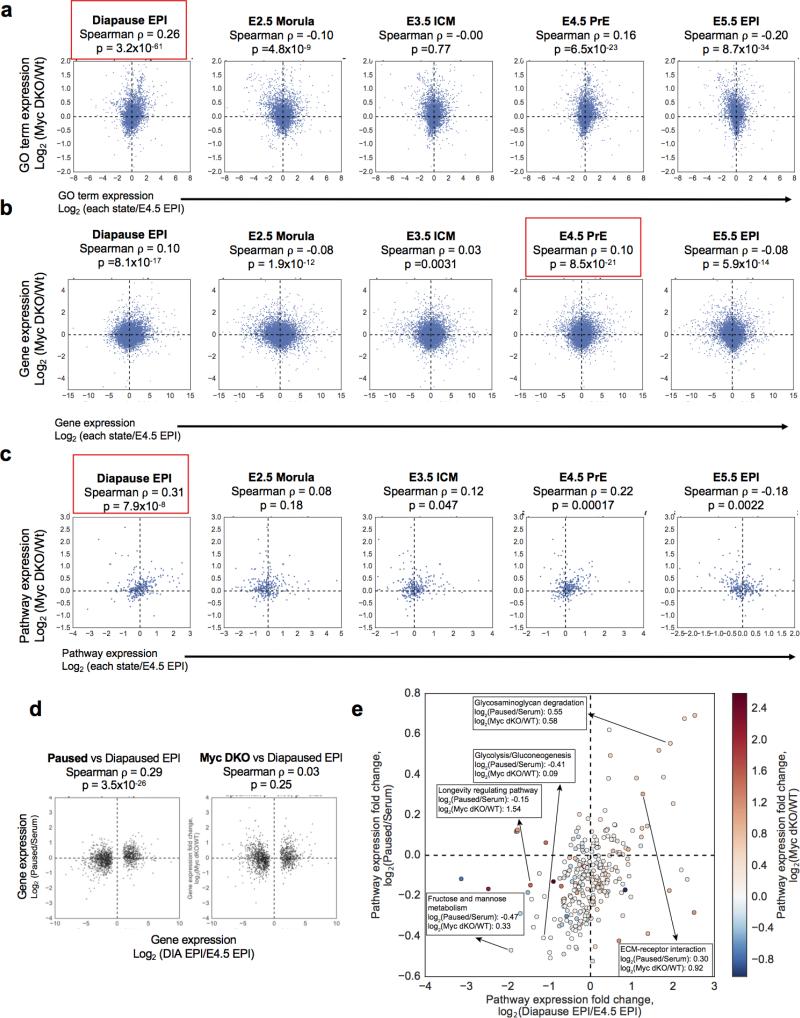
We next compared the transcriptomes of serum, 2i and paused ES cells to recently published gene expression data of various developmental stages, including diapause20 (see Methods). This analysis revealed that paused ES cells have significant similarities with the diapaused epiblast but not with other developmental stages (Fig. 4e, f). These similarities are evident whether differential gene expression is analyzed at the individual gene level or aggregated into Gene Ontology terms or annotated cellular pathways (Fig. 4f and Extended Data Fig. 9a, b). Unlike paused ES cells, the transcriptome of Myc-depleted cells6 is not consistently correlated with that of the diapaused epiblast (compare Fig. 4f, Extended Data Fig. 9 with Extended Data Fig. 10). Pathway analyses comparing paused ES cells, Myc-depleted ES cells and the diapause epiblast show that, while upregulated pathways are often concordant, several downregulated pathways are discordant in Myc-depleted ES cells (Extended Data Fig. 10e). Interestingly, pathways coordinately up-regulated in paused ES cells and the diapaused epiblast are associated with sugar and lipid metabolism and are down-regulated in diseases such as diabetes and immune disorders (Extended Data Fig. 9c). Taken together, our results document that paused blastocysts and paused ES cells induced by mTor inhibition mimic natural diapause functionally and at the molecular level.
In summary, we show here that inhibition of mTor allows the reversible suspension of developmental timing in mammalian embryos ex vivo (Fig. 4g). mTor is essential for growth of mouse embryos at peri-implantation21-23. Our results document that inhibiting mTor captures a novel pluripotent stem cell state that, unlike previously described ES cell states, corresponds to a stage that can persist for weeks in vivo. These results pave the way for a genetic and molecular dissection of embryonic diapause. We speculate that the combinatorial effects of mTor inhibition on transcription, translation and metabolism may be key to achieving developmental pausing. The ability to inhibit mTor with small molecules allows direct comparisons to other organisms and will contribute to studies of the evolution of developmental pausing24. It will be of interest to explore the utility of manipulations of the mTor pathway in assisted reproduction, regenerative medicine, preservation of cell viability after trauma and aging. Moreover, the finding that mTor inhibition induces a reversibly paused state in ES cells should be taken into consideration in cancer therapies that make use of mTor inhibitors.
Methods
Animal work
The following strains of mice were used (see details in following sections): Swiss Webster females and males, C57BL/6J or C57BL6/N males, B6.Cg-Tg(Pou5f1-GFP)1Scho25 males, CD-1 females and males. 6 to 10 week-old female mice, and 6 week- to 6 month-old male mice were used. Animals were maintained on 12 h light/dark cycle and provided with food and water ad libitum in individually ventilated units (Techniplast at TCP, Lab Products at UCSF)) in the specific-pathogen free facilities at UCSF and at TCP. All procedures involving animals were performed in compliance with the protocol approved by the IACUC at UCSF, as part of an AAALAC-accredited care and use program (protocol AN091331-03); and according to the Animals for Research Act of Ontario and the Guidelines of the Canadian Council on Animal Care. Animal Care Committee reviewed and approved all procedures conducted on animals at TCP. No blinding was done for animal studies. Samples were not randomized. No statistical methods were used to predetermine sample size estimate.
Embryo culture
Unless otherwise indicated, Swiss Webster females were mated to Swiss Webster males, or to C57BL/6 males homozygous for an Oct4/GFP transgene (B6.Cg-Tg(Pou5f1-GFP)1Scho)25. Preimplantation embryos were harvested at indicated time-points after detection of the copulatory plug by flushing oviducts (E1.5-E2.5) or uteri (E3.5) of pregnant females using M2 medium (Zenith Biotech) supplemented with 2% BSA (Sigma). Subsequent embryo culture was performed in 4-well plates in 5% O2, 5% CO2 at 37°C in KSOMAA Evolve medium (Zenith Biotech) with 2% BSA and the following inhibitors, after optimization of concentrations: 200 nM INK128 (Medchem Express), 2.5 μM 10058-F4 (Sigma), 100 ng/ml Cycloheximide (Amresco), 50 μM Anacardic Acid (Sigma). Other mTor inhibitors [AZD2014, Everolimus and Rapamycin (Medchem Express) and RapaLink-1 (gift of Kevan Shokat)] and autophagy inhibitors chloroquine (Sigma) and SBI-0206965 (Medchem Express) were used at the indicated concentrations under same culture conditions.
Diapause induction
Diapause was induced as previously described9 after natural mating of Swiss Webster mice. Briefly, pregnant females were injected at E2.5 and EDG5.5 with 10 μg Tamoxifen (intraperitoneally) and at E2.5 only with 3 mg Medroxyprogesterone 17-acetate (subcutaneously). Diapaused blastocysts were flushed from uteri in M2 media after 4 days of diapause at EDG8.5.
Embryo Transfer
Both surgical and Non-Surgical Embryo Transfers (NSET) were performed. For surgical transfers, superovulated CD-1 females were mated to C57BL/6J or C57BL6/N males and embryos were flushed at E3.5. Embryo culture (as described above) and surgical embryo transfer into the uteri of 2.5 dpc pseudopregnant CD-1 females previously mated with vasectomized CD-1 males was performed essentially as described26. For NSET, Swiss Webster females were mated to vasectomized CD-1 males and transfer was performed at E2.5 of surrogate according to manufacturer's instructions (ParaTechs, Lexington). Prior to embryo transfer, embryos were cultured in KSOMAA, 2% BSA without inhibitor for 1 hour. In the cases indicated (Extended Data Fig. 1a), Caesarian delivery was performed at E20, followed by fostering to Swiss Webster females. Coat color markers (agouti vs. albino) were used to distinguish transferred embryos after birth.
ES cell derivation
ES cell derivation was performed as previously described27. Swiss Webster females were naturally mated to Swiss Webster-C57BL/6 males heterozygous for an Oct4/GFP transgene (B6.Cg-Tg(Pou5f1-GFP)1Scho)25. Blastocysts were harvested by flushing uteri of pregnant females at E3.5, and were seeded on feeders either immediately or after culturing for 7 days in KSOMAA, 2% BSA, 200 nM INK128. Imaging of fluorescence driven by the Oct4/GFP transgene and alkaline phosphatase activity (VECTOR Red AP Substrate Kit, Vector Laboratories) was performed using a Leica DM IRB microscope.
Embryo Immunofluorescence
For immunofluorescence stainings, normal (E3.5), in vivo diapaused or ex vivo paused embryos were fixed in 4% paraformaldehyde for 15 minutes, washed with PBS and permeabilized with 0.2% Triton X-100 in PBS for 15 minutes. After blocking in PBS, 2.5% BSA, 5% donkey serum for 1 hour, embryos were incubated overnight at 4°C with the following primary antibodies in blocking solution: Phospho-4EBP1 (Thr37/46, clone 236B4), Phospho-Akt (Ser473), Phospho-Ulk1 (Ser757), Nanog, c-Parp, c-Caspase3 (all from Cell Signaling), H3K4me3, H4K16ac, H4K5/8/12ac, H3K9me3 (all from Millipore), Oct4 and Rex1 (Santa Cruz Biotechnology) and H3K36me2 (Abcam). Embryos were washed in PBS-Tween20, 2.5% BSA, incubated with fluorescence-conjugated secondary antibodies (Invitrogen) for 2 hours at room temperature, and mounted in VectaShield mounting medium with DAPI (Vector Laboratories). For labeling nascent transcription or translation, embryos were labeled in their respective culture medium for 20 minutes with EU (5-ethynyl uridine) or HPG (L-homopropargylglycine) following the manufacturer's instructions for Click-iT RNA and protein labeling kits (Thermo Fisher Scientific). Imaging was performed using a Leica SP5 confocal microscope with automated z-stacking at 10 μm intervals. Cell Profiler Software28 was used for image quantification and Prism (Graphpad Software) was used for plotting data points. Datasets do not show similar variance between control and paused/diapaused embryos in all cases, therefore we applied Welch's correction to the statistical analysis.
ES cell culture
E14 (source: Bill Skarnes, Sanger Institute), Oct4-GiP (source: Austin Smith, U. Cambridge) and v6.5 (source: Robert Blelloch, UCSF) ES cell lines were used. ‘Serum’ cells were cultured in ES-FBS medium: DMEM GlutaMAX with Na Pyruvate (Thermo Fisher Scientific), 15% FBS (Atlanta Biologicals), 0.1 mM Non-essential amino acids, 50 U/ml Penicillin/Streptomycin (UCSF Cell Culture Facility), 0.1 mM EmbryoMax 2-Mercaptoethanol (Millipore) and 2000 U/ml ESGRO supplement (LIF, Millipore). ‘2i’ cells were cultured in ES-2i medium: DMEM/F-12, Neurobasal medium, 1x N2/B27 supplements (Thermo Fisher Scientific), 1 μM PD0325901, 3 μM CHIR99021 (Selleck Chemicals), 50 μM Ascorbic acid (Sigma) and 2000 U/ml ESGRO supplement (LIF) (Millipore). ‘Paused’ cells were cultured in ES-FBS medium containing 200 nM INK128 (Medchem). ES cells can also be paused in 2i medium, but the mTor inhibitor needs to be removed at each passaging and reintroduced after colony formation to avoid major cell death (Extended Data Fig. 6a). The cell lines have not been authenticated. E14 and v6.5 tested negative for mycoplasma contamination. Oct4-GiP was not tested.
Generation of chimeras
R1 (129S1x129X1)29 and G4 (129S6xB6N)30 ES cells were used for morula aggregations. ES cells were cultured in DMEM containing 10% FBS (Wisent, lot tested to support generation of germline chimeras), 10% KnockOut Serum Replacement, 2 mM GlutaMAX, 1 mM Na Pyruvate, 0.1 mM non-essential amino acids, 0.1 mM 2-Mercaptoethanol (all Thermo Fisher Scientific), 1000 U/ml LIF (Millipore). G4 ES cells were grown on MEF obtained from TgN(DR4)1Jae/J mice at all times except one passage on gelatinized tissue culture plates before aggregation. R1 ES cells were cultured in feeder-free conditions on gelatinized tissue culture plates. CD-1 (ICR) (Charles River) outbred albino stock was used as embryo donors for aggregation with ES cells and as pseudopregnant recipients. Details of morula aggregation can be found in26. Briefly, embryos were collected at E2.5 from superovulated CD-1(ICR) female mice. Zonae pellucidae of embryos were removed by the treatment with acid Tyrode's solution (Sigma). ES cell colonies were treated with 0.05% Trypsin-EDTA to lift loosely connected clumps. Each zona-free embryo was aggregated with 10-15 ES cells inside depression well made in the plastic dish with an aggregation needle (BLS Ltd, Hungary) and cultured overnight in microdrops of KSOMAA covered by embryo-tested mineral oil (Zenith Biotech) at 37°C in 94% air/6% CO2. The following morning morulae and blastocysts were transferred into the uteri of E2.5 pseudopregnant CD-1 (ICR) females previously mated with vasectomized males. Chimeras were identified at birth by the presence of black eyes and later by the coat pigmentation. Chimeric males with more than 50% coat colour contribution were individually bred with CD-1(ICR) females. Germline transmission of ES cell genome was determined by eye pigmentation of pups at birth and later by the coat pigmentation.
Western blot analysis
1 × 10⁶ cells were harvested and lysed in RIPA buffer containing 1x Protease Inhibitor Cocktail, 1 mM PMSF, 5 mM NaVO4 and 5 mM NaF. Extracts were loaded into 4-15% Mini-Protean TGX SDS Page gels (Bio-Rad). Proteins were transferred to PVDF membranes. Membranes were blocked in 5% milk/PBS-T buffer for 30 min and incubated either overnight at 4°C or 1 hour at room temperature with the following antibodies: 4EBP1 (total or pThr37/46), S6K1 (total or pThr389), Akt (total or pSer473), mTor (total or pSer2448) (Cell Signaling Technology), Gapdh (Millipore) and anti-rabbit/mouse secondary antibodies. Membranes were incubated with ECL or ECL Plus reagents and exposed to X-ray films (Thermo Fisher Scientific).
Cell cycle analysis
4 × 10⁵ cells were seeded on 6-well plates. After overnight culture, cells were incubated for 1 hour with 5-ethynyl-2-deoxyuridine (EdU) diluted to 10 μM in the indicated ES cell media. All samples were processed according to the manufacturer's instructions (Click-iT EdU Alexa Fluor 488 Imaging Kit, Thermo Fisher Scientific). EdU incorporation was detected by Click-iT chemistry with an azide-modified Alexa Fluor 488. Cells were resuspended in EdU permeabilization/wash reagent and incubated for 30 minutes with FxCycle Violet Stain (Thermo Fisher Scientific, Waltham, MA). For EdU dilution experiments, ES cells were labeled for 90 minutes in serum, and afterwards were split into either serum or pause conditions; EdU analysis was done every 12 hours for 48 hours. Flow cytometric was performed on a LSRII flow cytometer (BD) and analyzed using FlowJo v10.0.8. Datasets show similar variance.
Analysis of nascent transcription or translation
Total nascent transcription (Ethynyl Uridine, EU) or translation (L-homopropargylglycine, HPG) were assessed in ES cells using the Click-iT RNA Alexa Fluor 488 HCS Assay kit according to the manufacturer's instructions (Thermo Fisher Scientific). Samples were analyzed on a BD LSRII. Datasets show similar variance.
Analysis of Apoptosis
After overnight culture on a 96-well plate, ESCs were washed once with PBS and trypsinized to single cells. They were resuspended in 10 μl of Annexin V diluted 1:100 in Binding Buffer (BioLegend) and incubated for 10 minutes in the dark. Cells were resuspended in 90 μl of binding buffer with Sytox Blue (Thermo Fisher Scientific) at 1:10,000. Data were collected on a BD LSRII. Datasets show similar variance.
Generation and sequencing of RNA-seq samples
Three replicates were used for all samples. Freshly collected single cell suspensions were sorted on a FACSAriaII cell sorter to collect 105 cells for each sample. Total RNA was isolated using the RNeasy kit (Qiagen). All samples were spiked-in with ERCC control RNAs (Thermo Fisher Scientific) following manufacturer's recommendations. mRNA isolation and library preparation were performed on 250 ng total RNA from all samples using NEBNext Ultra Directional RNA library prep kit for Illumina (New England Biolabs). Samples were sequenced at The Center for Advanced Technology, UCSF on Illumina HiSeq2500.
Mapping Reads
Single-end 50-bp reads were mapped to the mm10 mouse reference genome using Tophat231 with default parameters. We used Cuffnorm and Cuffdiff with the gtf file from UCSC mm10 (Illumina iGenomes July 17, 2015 version) as transcript annotation to evaluate relative expression level of genes (FPKM) and call differentially expressed genes. The alignment rate exceeded 96% in all of our samples, yielding ~40 million aligned reads per sample. Data from Boroviak et al.20 and Scognamiglio et al.11 were downloaded from GEO and ArrayExpress, respectively, and processed with the same pipeline as our data.
Normalizing Absolute Expression
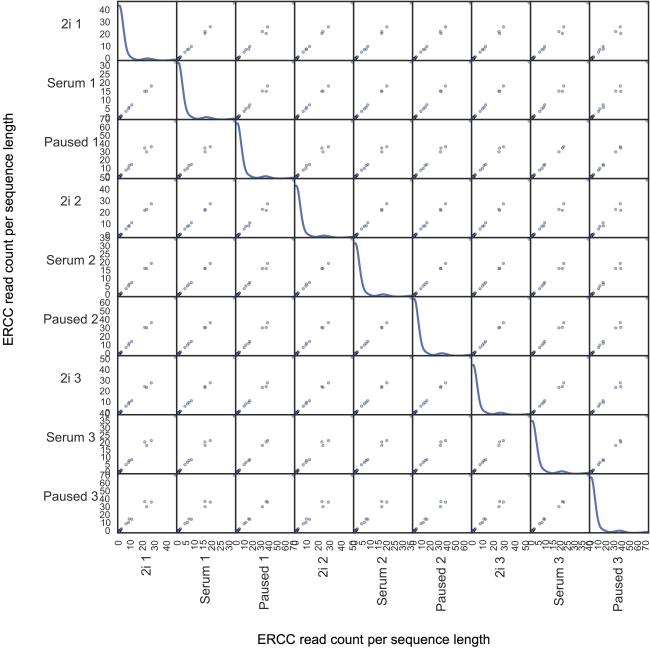
The absolute abundance of mRNA transcripts was estimated using the ERCC92 RNA spike-in32. ERCC92 contains 92 synthetic sequences with lengths ranging from 250 to 2000 bp and concentration ranging over several orders of magnitude. ERCC sequences were designed to mimic mammalian mRNA, but are not homologous to the mouse genome, ensuring their unique mappability. We have aligned the reads to the 92 reference spike-in sequences and compared the abundance of these sequences between different samples. Since ERCC sequence abundances followed a highly linear trend in all pairs of samples across at least 5 orders of magnitude (Pearson correlation coefficient larger than 99.7%, see Extended Data Fig. 8), we assessed the absolute abundance of mRNA as the number of mRNA fragments per kilobase of transcript per 10 thousand mapped reads of ERCC. The overall abundance of ERCC spike-in sequences in our samples varied from 0.3% to 0.5% of aligned reads.
Suppressing Batch Effects and Clustering
To facilitate better comparison between our and Boroviak et al.'s data20 and to reduce possible batch effects, in Fig. 4e, we followed the “batch mean-centering” approach widely used in microarray gene expression data analysis for batch effect removal33. Specifically, we have separately mean-centered the log2(FPKM + 1) value of each gene by subtracting the mean log2(FPKM + 1) across all our samples (serum, 2i and paused) and across Boroviak et al.'s samples. The numerical values of the mean-centered expression may not be directly comparable across all samples, because they may still have different dynamic ranges in different batches. We therefore used 1 - Spearman correlation coefficient as distance in the hierarchical clustering.
Clustering analysis
In Fig. 4c, we identified 5992 genes with robust expression (cell number normalized expression value > 50 in Serum, 2i, or Paused states). The cell number normalized expression value of each gene was standardized across the 9 samples by subtracting the mean and then dividing by the standard deviation. Hierarchical clustering was performed using the standardized expression values using Euclidean metric and average linkage. In Fig. 4e, in order to compare our samples with those from Boroviak et al., we used the log2(FPKM + 1) value of each gene. Hierarchical clustering was performed using mean-centered (within each batch) expression values of 9418 genes robustly expressed (FPKM > 10) in at least one cell state (serum, 2i, paused, diapause EPI, E2.5 MOR, E3.5 ICM, E4.5 EPI, E4.5 PrE, E5.5 EPI, or ESC 2i/LIF). 1 - Spearman correlation coefficient was used as distance and average linkage was used.
Pairwise GO term expression analysis
For each of the 3772 GO terms that are associated with at least 10 genes34, we defined the GO term expression as the mean FPKM values of genes associated with the corresponding term. In Fig. 4f, The log2 fold-change of GO term expressions between paused ES cells and serum ES cells was plotted on the y-axis against that between various samples in Boroviak et al. (2015) and E4.5 EPI on the x-axis. The Spearman correlation coefficient of the 3772 GO terms is indicated. Extended Data Fig. 10 was generated similarly, but with the log2 fold-change of GO term expressions between Myc DKO and WT cells from Scognamiglio et al.11 on the y-axis.
Pairwise pathway expression analysis
For each of the 281 KEGG pathways that contain at least 10 genes35, we defined the pathway expression as the mean FPKM values of genes associated with the corresponding pathway. In Extended Data Fig. 9b, the log2 fold change of pathway expressions between paused ES cells and serum ES cells was plotted on the y-axis against that between various samples in Boroviak et al. and E4.5 EPI. The Spearman correlation coefficient of the 281 pathways was indicated. Extended Data Fig. 10c was generated similarly, but with the log2 fold change of pathway expressions between Myc dKO and WT cells from Scognamiglio et al.11 on the y-axis.
Code availability
Custom codes used for the RNA-seq analysis are available upon request.
Data Availability
RNA-seq data have been deposited in Gene Expression Omnibus (GEO) under accession number GSE81285. RNA-seq data from Scognamiglio et al. and Boroviak et al. are available under the accession numbers GSE74337 and E-MTAB-2958. The authors declare that all other data supporting the findings of this study are available within the paper and its supplementary information files.
Extended Data
Extended Data Figure 1.
Catalytic mTor inhibitors can induce blastocyst pausing. a, Kaplan-Meier survival curves of blastocysts cultured with (a) two catalytic mTor inhibitors, RapaLink-1 and AZD2014, and (b) two allosteric mTor inhibitors, Rapamycin and Everolimus, at different concentrations. c, Kaplan-Meier survival curves of blastocysts cultured with all 5 mTor inhibitors used in this study. The concentrations yielding the best survival outcome are shown. d, Kaplan-Meier survival curves of blastocysts cultured with the Myc-inhibitor 10058-F4 at 55 μM, as in Scognamiglio et al.6. Dotted lines indicate the time of blastocyst flushing (E3.5).
Extended Data Figure 2.
The ex vivo paused epiblast retains naïve pluripotency markers and is devoid of apoptosis. It is possible that the signs of apoptosis in the TE contribute to the eventual demise of mTor-inhibited blastocysts after prolonged culture. Immunofluorescence images of untreated vs. paused blastocysts for Nanog (a), Rex1 (b), cleaved Caspase 3 (c) and cleaved Parp1 (d). Oct4 staining is shown in all cases as a marker of the ICM. Note that the ubiquitous staining pattern for Rex1 is as expected36. Scale bar = 50 μm. The number of embryos analyzed (n) is indicated.
Extended Data Figure 3.
Only blastocyst-stage embryos can be sustainably paused and they can give rise to live, fertile mice. a, Detailed information on the generation of live mice from paused blastocysts by transfer into pseudo-pregnant surrogate females. Conditions used and live birth events are indicated. NSET, non-surgical embryo transfer; ET, embryo transfer (surgical). b, Live pups born as a result of mating mice generated from paused blastocysts with wild-type ICR mice. All tested mice (5/5, from 15 total) proved to be fertile. (c) Representative images of ex vivo cultured 2- or 8-cell embryos with or without the mTor inhibitor. Cleavage-stage embryos proceed to generate blastocysts even in presence of mTor inhibitor. n represents number of blastocysts developed per number of tested cleavage stage embryos.
Extended Data Figure 4.
Paused blastocysts show signs of autophagy. a, Immunofluorescence images of phosphorylated Ulk1 in untreated vs. paused (a), or normal vs. diapaused (b) embryos. Oct4 staining is shown as a marker of the ICM. Scale bar = 50 μm. The number of embryos analyzed (n) is indicated. Error bars indicate standard deviation. P-values are from two-tailed unpaired student's t-test. c, Images showing embryos retrieved at different developmental stages incubated with the autophagy/lysosomal inhibitor chloroquine (CQ) for 24 hours. The number of embryos analyzed (n) is indicated. d, Kaplan-Meier survival curves of blastocysts cultured with chloroquine in the presence or absence of the mTor-inhibitor INK128. CQ treatment leads to blastocysts collapse, as previously reported37. The experiment was terminated at EDG8.5. e, Kaplan-Meier survival curves of blastocysts cultured with the autophagy/Ulk1 inhibitor SBI-0206965 in the presence or absence of the mTor inhibitor INK128. Inhibition of Ulk1 leads to decreased survival of paused blastocysts. **=P-value<0.01 from log-rank (Mantel-Cox) test. Dotted lines indicate the time of blastocyst flushing (E3.5).
Extended Data Figure 5.
In vivo diapaused blastocysts have reduced histone H4 acetylation. a-c, Immunofluorescence images and quantification at the single ICM cell level of normal vs. in vivo diapaused blastocysts for H4K5/8/12ac (a), H3K4me3 (b) and H3K9me3 (c) levels. Oct4 staining is shown in all cases as a marker of the ICM. Scale bar = 50 μm. The number of embryos analyzed (n) is indicated. Graphs show data pooled from all embryos. Error bars indicate standard deviation. P-values are from two-tailed unpaired student's t-test.
Extended Data Figure 6.
Partial inhibition of mTor activity results in ES cell pausing. a, Representative image showing morphology of ES cells paused in 2i medium, with removal of the mTor inhibitor at passaging. Under these conditions, ES cells can be discontinuously paused in 2i medium. b, Western blot showing moderately reduced 4EBP1 and S6K1 phosphorylation, which are mediated by mTORC1, and abolished Akt phosphorylation, which is mediated by mTORC2, in paused ES cells. For gel source data, see Supplementary Figure 1. c, Flow cytometry analysis of nascent translation in the three states measured by HPG incorporation in E14 cells, in triplicates. d, Analysis of cell diameter in the three states, with each data point representing a population average of at least 300 cells per measurement. Values are represented as mean±SD. P-values are from two-tailed unpaired student's t-test. *: <0.05, **: <0.01, ***: <0.001, n.s.: not significant. e, Live pups born as a result of mating highly chimeric males generated using paused G4 ES cells with wild-type CD-1(ICR) female mice.
Extended Data Figure 7.
ERCC sequence abundances followed a highly linear trend in all pairs of samples across at least 5 orders of magnitude. The absolute abundance of mRNA transcripts was estimated using the ERCC92 RNA spike-ins32. Sequencing reads were aligned to the 92 reference spike-in sequences and the abundance of these sequences between different samples was compared. ERCC sequence abundances followed a highly linear trend in all pairs of samples across at least 5 orders of magnitude (Pearson correlation coefficient larger than 99.7%). Diagonal entries in the figure matrix show the density of read counts. ERCC RNAs are consistently detected at higher abundance in the paused state compared to serum and 2i.
Extended Data Figure 8.
Distinct functional annotations are associated with different states of ES cells. a, Clustering of dynamically expressed genes. Heatmap shows 3864 dynamically expressed genes (differentially expressed between any two of the 2i, serum, and paused states and mean FPKM > 10 in at least one state). The FPKM value of each gene was standardized across the 9 samples by subtracting the mean and then dividing by the standard deviation. Hierarchical clustering was performed using the standardized expression values using Euclidean metric and average linkage. b-d, Selected GO terms enriched in the annotations of genes upregulated in serum (a), 2i (b) or paused (c) ES cells. See Supplementary Table 3 for complete list of significant GO terms associated with each ES cell state.
Extended Data Figure 9.
Analysis of RNA-seq data indicates that paused ES cells mimic embryonic diapause. a, b, Scatter plots showing gene expression (9418 genes that have FPKM > 10 in any of our or Boroviak's samples are shown) (a) and pathway expression (b) comparing paused ES cells to different developmental stages. Spearman correlation coefficients and P-values indicate a significant similarity of paused ES cells to the diapaused epiblast. y-axes represent log2 fold change in gene expression (a) or pathway expression (b) in paused vs. serum ES cells. x-axes represent log2 fold changes in gene expression (a) or pathway expression (b) in the different developmental stages (indicated above plots) vs. E4.5 epiblast. Red boxes indicate the developmental stage that paused ES cells are closest to in each analysis. c, Scatter plot showing pathway expression in paused/serum ES cells (y-axis) vs. diapaused epiblast/E4.5 epiblast (x-axis) as in (b). Pathways coordinately up-regulated (red) or down-regulated (blue) in paused ES cells and diapaused epiblast are indicated next to the scatter plot.
Extended Data Figure 10.
Analysis of RNA-seq data indicates that Myc double knock-out (DKO) cells have similarities to embryonic diapause at the GO term and pathway levels, but to a lesser extent than paused ES cells. a-c, Scatter plots showing GO term expression (a), gene expression (b), and pathway expression (c) comparing Myc DKO ES cells6 to different developmental stages, similarly to Fig. 4f and Extended Data Fig. 10a, b. Red boxes indicate the developmental stage that Myc DKO ES cells are closest to in each analysis. d, Scatter plots showing ‘diapause-driver’ gene expression (1324 genes that are differentially expressed between the diapaused epiblast and E4.5 epiblast) in paused ES cells (left panel) and Myc dKO cells (right panel) compared to the diapaused epiblast. Pseudocount 1 was used when calculating the log2 fold changes. Spearman correlation coefficient and P-value indicates a statistically significant similarity of paused ES cells, but not Myc DKO cells, to the diapaused epiblast. e, Scatter plot showing pathway expression in paused ES cells vs the diapaused epiblast, as in Extended Data Fig. 10c. Color-coded expression levels of these pathways in Myc DKO ES cells are superimposed onto this graph. Numerical values for selected pathways are indicated. Upregulated pathways are in general concordant in paused and Myc DKO ES cells, whereas downregulated pathways are mostly discordant.
Supplementary Material
Acknowledgements
We are grateful to Kevin Shokat for the kind gift of RapaLink-1. We thank Robert Blelloch, Benoit Bruneau, Marco Conti, Susan Fisher, Davide Ruggero, and members of the Santos Lab for critical reading of the manuscript. This research was supported by grants NIH 5P30CA082103 to the UCSF Center for Advanced Technology, NIH P30DK063720 to the UCSF Flow Cytometry Core, NSF 1442504 and NIH R01CA163336 to J.S.S., and NIH R01OD012204 and R01GM113014 to M.R.-S.
Footnotes
Author Contributions
A.B.-K., S.B. and M.R.-S. conceived of the project. A.B.-K. and S.B. isolated embryos. A.B.-K performed most paused embryo and ES cell cultures, embryo stainings and quantifications, and ES cell experiments with the following exceptions: T.A.M. performed HPG, EU and cell cycle analyses on ES cells. S.B. generated diapaused embryos, performed all NSET embryo transfers, and parturitions when necessary. H.J., and M.H. analyzed RNA-seq data under the supervision of J.S.S. M.G. performed parallel embryo culture for surgical transfers and ES cell culture for aggregations supported by staff of TCP Model Production Core. M.R.-S. supervised the project. A.B.-K. and M.R.-S. wrote the manuscript with feedback from all authors.
Author Information
Data have been deposited in GEO under accession number GSE81285. The authors declare no competing financial interests.
Supplementary Information is linked to the online version of the paper at www.nature.com/nature.
References
- 1.Nichols J, Smith A. Naive and Primed Pluripotent States. Cell Stem Cell. 2009;4:487–492. doi: 10.1016/j.stem.2009.05.015. [DOI] [PubMed] [Google Scholar]
- 2.Fenelon JC, Banerjee A, Murphy BD. Embryonic diapause: development on hold. Int. J. Dev. Biol. 2014;58:163–174. doi: 10.1387/ijdb.140074bm. [DOI] [PubMed] [Google Scholar]
- 3.Zoncu R, Efeyan A, Sabatini DM. mTOR: from growth signal integration to cancer, diabetes and ageing. Nat. Rev. Mol. Cell Biol. 2011;12:21–35. doi: 10.1038/nrm3025. [DOI] [PMC free article] [PubMed] [Google Scholar]
- 4.Naeslund G. The Effect of Glucose-, Arginine- and Leucine-deprivation on Mouse Blastocyst Outgrowth In Vitro. Upsala Journal of Medical Sciences. 1979;84:9–20. doi: 10.3109/03009737909179136. [DOI] [PubMed] [Google Scholar]
- 5.Gwatkin RBL. Amino acid requirements for attachment and outgrowth of the mouse blastocyst in vitro. Journal of Cellular Physiology. 1966;68:335–343. [Google Scholar]
- 6.Scognamiglio R, et al. Myc Depletion Induces a Pluripotent Dormant State Mimicking Diapause. Cell. 2016;164:668–680. doi: 10.1016/j.cell.2015.12.033. [DOI] [PMC free article] [PubMed] [Google Scholar]
- 7.Hsieh AC, et al. The translational landscape of mTOR signalling steers cancer initiation and metastasis. Nature. 2012;485:55–61. doi: 10.1038/nature10912. [DOI] [PMC free article] [PubMed] [Google Scholar]
- 8.Rodrik-Outmezguine VS, et al. Overcoming mTOR resistance mutations with a new-generation mTOR inhibitor. Nature. 2016;534:272–276. doi: 10.1038/nature17963. [DOI] [PMC free article] [PubMed] [Google Scholar]
- 9.MacLean Hunter S, Evans M. Non-surgical method for the induction of delayed implantation and recovery of viable blastocysts in rats and mice by the use of tamoxifen and Depo-Provera. Molecular Reproduction and Development. 1999;52:29–32. [Google Scholar]
- 10.Evans MJ, Kaufman MH. Establishment in culture of pluripotential cells from mouse embryos. Nature. 1981;292:154–156. doi: 10.1038/292154a0. [DOI] [PubMed] [Google Scholar]
- 11.Fu Z, et al. Integral proteomic analysis of blastocysts reveals key molecular machinery governing embryonic diapause and reactivation for implantation in mice. Biol. Reprod. 2014;90:52–52. doi: 10.1095/biolreprod.113.115337. [DOI] [PubMed] [Google Scholar]
- 12.Chan EY. mTORC1 phosphorylates the ULK1-mAtg13-FIP200 autophagy regulatory complex. Science Signaling. 2009;2:pe51–pe51. doi: 10.1126/scisignal.284pe51. [DOI] [PubMed] [Google Scholar]
- 13.Tsukamoto S, et al. Autophagy Is Essential for Preimplantation Development of Mouse Embryos. Science. 2008;321:117–120. doi: 10.1126/science.1154822. [DOI] [PubMed] [Google Scholar]
- 14.Lee J-E, et al. Autophagy Regulates Embryonic Survival During Delayed Implantation. Endocrinology. 2011;152:2067–2075. doi: 10.1210/en.2010-1456. [DOI] [PubMed] [Google Scholar]
- 15.Nie Z, et al. c-Myc is a universal amplifier of expressed genes in lymphocytes and embryonic stem cells. Cell. 2012;151:68–79. doi: 10.1016/j.cell.2012.08.033. [DOI] [PMC free article] [PubMed] [Google Scholar]
- 16.Lin CY, et al. Transcriptional amplification in tumor cells with elevated c-Myc. Cell. 2012;151:56–67. doi: 10.1016/j.cell.2012.08.026. [DOI] [PMC free article] [PubMed] [Google Scholar]
- 17.Martin PM, Sutherland AE. Exogenous Amino Acids Regulate Trophectoderm Differentiation in the Mouse Blastocyst through an mTOR-Dependent Pathway. Developmental Biology. 2001;240:182–193. doi: 10.1006/dbio.2001.0461. [DOI] [PubMed] [Google Scholar]
- 18.Blaschke K, et al. Vitamin C induces Tet-dependent DNA demethylation and a blastocyst-like state in ES cells. Nature. 2013;500:222–226. doi: 10.1038/nature12362. [DOI] [PMC free article] [PubMed] [Google Scholar]
- 19.Ying Q-L, et al. The ground state of embryonic stem cell self-renewal. Nature. 2008;453:519–523. doi: 10.1038/nature06968. [DOI] [PMC free article] [PubMed] [Google Scholar]
- 20.Boroviak T, et al. Lineage-Specific Profiling Delineates the Emergence and Progression of Naive Pluripotency in Mammalian Embryogenesis. Developmental Cell. 2015;35:366–382. doi: 10.1016/j.devcel.2015.10.011. [DOI] [PMC free article] [PubMed] [Google Scholar]
- 21.Murakami M, et al. mTOR is essential for growth and proliferation in early mouse embryos and embryonic stem cells. Mol. Cell. Biol. 2004;24:6710–6718. doi: 10.1128/MCB.24.15.6710-6718.2004. [DOI] [PMC free article] [PubMed] [Google Scholar]
- 22.Guertin DA, et al. Ablation in mice of the mTORC components raptor, rictor, or mLST8 reveals that mTORC2 is required for signaling to Akt-FOXO and PKCalpha, but not S6K1. Developmental Cell. 2006;11:859–871. doi: 10.1016/j.devcel.2006.10.007. [DOI] [PubMed] [Google Scholar]
- 23.Gangloff Y-G, et al. Disruption of the mouse mTOR gene leads to early postimplantation lethality and prohibits embryonic stem cell development. Mol. Cell. Biol. 2004;24:9508–9516. doi: 10.1128/MCB.24.21.9508-9516.2004. [DOI] [PMC free article] [PubMed] [Google Scholar]
- 24.Schiesari L, O'Connor MB. Diapause: delaying the developmental clock in response to a changing environment. Curr. Top. Dev. Biol. 2013;105:213–246. doi: 10.1016/B978-0-12-396968-2.00008-7. [DOI] [PubMed] [Google Scholar]
- 25.Yeom YI, et al. Germline regulatory element of Oct-4 specific for the totipotent cycle of embryonal cells. Development. 1996;122:881–894. doi: 10.1242/dev.122.3.881. [DOI] [PubMed] [Google Scholar]
- 26.Behringer R, Gertsenstein M, Nagy KV, Nagy A. Manipulating the Mouse Embryo. 2013 [Google Scholar]
- 27.Lee K-H, Chuang C-K, Guo S-F, Tu C-F. Simple and efficient derivation of mouse embryonic stem cell lines using differentiation inhibitors or proliferation stimulators. Stem Cells Dev. 2012;21:373–383. doi: 10.1089/scd.2011.0021. [DOI] [PubMed] [Google Scholar]
- 28.Carpenter AE, et al. CellProfiler: image analysis software for identifying and quantifying cell phenotypes. Genome Biol. 2006;7:R100. doi: 10.1186/gb-2006-7-10-r100. [DOI] [PMC free article] [PubMed] [Google Scholar]
- 29.Nagy A, Rossant J, Nagy R, Abramow-Newerly W, Roder JC. Derivation of completely cell culture-derived mice from early-passage embryonic stem cells. Proc. Natl. Acad. Sci. U.S.A. 1993;90:8424–8428. doi: 10.1073/pnas.90.18.8424. [DOI] [PMC free article] [PubMed] [Google Scholar]
- 30.George SHL, et al. Developmental and adult phenotyping directly from mutant embryonic stem cells. Proc. Natl. Acad. Sci. U.S.A. 2007;104:4455–4460. doi: 10.1073/pnas.0609277104. [DOI] [PMC free article] [PubMed] [Google Scholar]
- 31.Kim D, et al. TopHat2: accurate alignment of transcriptomes in the presence of insertions, deletions and gene fusions. Genome Biol. 2013;14:R36. doi: 10.1186/gb-2013-14-4-r36. [DOI] [PMC free article] [PubMed] [Google Scholar]
- 32.External RNA Controls Consortium Proposed methods for testing and selecting the ERCC external RNA controls. BMC Genomics. 2005;6:150. doi: 10.1186/1471-2164-6-150. [DOI] [PMC free article] [PubMed] [Google Scholar]
- 33.Lazar C, et al. Batch effect removal methods for microarray gene expression data integration: a survey. Brief. Bioinformatics. 2013;14:469–490. doi: 10.1093/bib/bbs037. [DOI] [PubMed] [Google Scholar]
- 34.Gene Ontology Consortium Gene Ontology Consortium: going forward. Nucleic Acids Res. 2015;43:D1049–56. doi: 10.1093/nar/gku1179. [DOI] [PMC free article] [PubMed] [Google Scholar]
- 35.Kanehisa M, Goto S. KEGG: kyoto encyclopedia of genes and genomes. Nucleic Acids Res. 2000;28:27–30. doi: 10.1093/nar/28.1.27. [DOI] [PMC free article] [PubMed] [Google Scholar]
- 36.Climent M, et al. Functional Analysis of Rex1During Preimplantation Development. Stem Cells Dev. 2013;22:459–472. doi: 10.1089/scd.2012.0211. [DOI] [PMC free article] [PubMed] [Google Scholar]
- 37.Aziz M, Alexandre H. The origin of the nascent blastocoele in preimplantation mouse embryos ultrastructural cytochemistry and effect of chloroquine. Roux's Archives of Developmental Biology. 1991;200:77–85. doi: 10.1007/BF00637187. [DOI] [PubMed] [Google Scholar]
Associated Data
This section collects any data citations, data availability statements, or supplementary materials included in this article.
Supplementary Materials
Data Availability Statement
RNA-seq data have been deposited in Gene Expression Omnibus (GEO) under accession number GSE81285. RNA-seq data from Scognamiglio et al. and Boroviak et al. are available under the accession numbers GSE74337 and E-MTAB-2958. The authors declare that all other data supporting the findings of this study are available within the paper and its supplementary information files.


