

Abstract
Hematologic measures such as hematocrit and white blood cell (WBC) count are heritable and clinically relevant. Erythrocyte and WBC phenotypes were analyzed with Illumina HumanExome BeadChip genotypes in 52,531 individuals (37,775 of European ancestry; 11,589 African Americans; 3,167 Hispanic Americans) from 16 population-based cohorts. We then performed replication analyses of novel discoveries in 18,018 European American women and 5,261 Han Chinese. We identified and replicated four novel erythrocyte trait-locus associations (CEP89, SHROOM3, FADS2, and APOE) and six novel WBC loci for neutrophil count (S1PR4), monocyte count (BTBD8, NLRP12, and IL17RA), eosinophil count (IRF1), and total WBC (MYB). The novel association of a rare missense variant in S1PR4 supports the role of sphingosine-1-phosphate signaling in leukocyte trafficking and circulating neutrophil counts. Loss-of-function experiments of S1pr4 in mouse and zebrafish demonstrated phenotypes consistent with the association observed in humans and altered kinetics of neutrophil recruitment and resolution in response to tissue injury.
Introduction
Erythrocyte and leukocyte blood counts are heritable traits (estimated heritability 0.40–0.901–3 and 0.14–0.40, respectively4) that reflect core physiologic functions of oxygen-carrying capacity and anti-microbial activity. Peripheral blood cell counts are commonly measured in the clinical setting to diagnose and monitor therapy of many acute and chronic conditions, such as infection or anemia. Abnormalities in these clinical measures often reflect primary hematologic disease, blood loss or inflammation. Inter-individual differences in erythrocyte traits, total WBC, and neutrophil counts have been associated with risk of cardiovascular diseases and all-cause mortality.5–7
Previous genome-wide association studies (GWAS) have defined over 100 loci influencing erythrocyte traits8–12 and leukocyte counts.8,13,14 However, few studies have systematically evaluated the contribution of coding variation, particularly variants at low frequency in the general population.15,16 Recently completed exome sequencing in diverse populations has led to international collaboration and creation of a genome-wide catalog of low frequency coding variants. We undertook a large-scale study of erythrocyte and leukocyte traits in up to 52,531 individuals of European, African and Hispanic ancestry to evaluate the impact of both low-frequency and common variants assayed by the Illumina HumanExome BeadChip, also referred to as the exome chip.
Results
Study Samples
In the discovery stage, we analyzed erythrocyte traits (hemoglobin (Hb), hematocrit (Hct), mean corpuscular hemoglobin (MCH), mean corpuscular hemoglobin concentration (MCHC), mean corpuscular volume (MCV), red cell distribution width (RDW), and red blood cell count (RBC)) and leukocyte traits (total WBC count and absolute neutrophil, lymphocyte, monocyte, eosinophil, and basophil counts) (Supplementary Table 1) in 52,531 individuals, including 37,775 with European ancestry (EA), 11,589 African Americans (AA), and 3,167 white Hispanics (HA) sampled from 16 population-based cohorts. Sample sizes per trait analyzed in each cohort are provided in Supplementary Table 2. The traits followed expected distributions, and characteristics of the study participants, including age, sex and trait summaries, are presented in Supplementary Table 3. Descriptions of each cohort are provided in the Supplementary Note.
Single variant and gene-based meta-analyses
In single variant analyses, we did not observe significant inflation of the meta-analysis p-values (Supplementary Table 4). A total of 104 unique locus-trait associations exceeded the Bonferroni-corrected significance threshold (p<4×10⁻⁷; Supplementary Table 5). These included 49 independent loci associated with erythrocyte traits and 22 loci associated with leukocyte traits (Supplementary Table 6). Many of these were single nucleotide polymorphisms (SNPs) well-established to be associated with hematologic traits (see Supplementary Note), thus confirming the validity of the exome chip. Novel findings reaching study-wide significance (p<4×10⁻⁷; n=9 for erythrocytes; n=10 for leukocytes) are listed in Table 1 and were carried forward to replication in an independent sample. Of these, 4 novel trait-locus associations for erythrocyte traits (SHROOM, CEP89, and APOE were study-wide significant, p<0.003; FADS2 was only nominally significant, p=0.02) and 6 novel trait-locus associations for WBC traits (BTBD8, MYB/HBS1L, S1PR4, and IL17RA were study-wide significant, p<0.003; IRF1 and NLRP12 were only nominally significant, p<0.05) were replicated in an independent set of European American samples from WHI (Supplementary Table 7).
Table 1.
Novel RBC (a) and WBC (b) discovered associations in the discovery samples, with replication results
| (a) Trait |
rsID | Chr | Position | Gene | Function | EA+AA+HA beta |
EA+AA+HA p-value |
EA / AA / HA −log10(p) |
EA / AA / HA MAFs |
WHI EA Beta |
WHI EA p-value |
|---|---|---|---|---|---|---|---|---|---|---|---|
| (a) Red Blood Cell traits | |||||||||||
| Hct | rs587404 | 1 | 39,908,506 | MACF1 | p.Ala6577Thr | −0.107 | 2.9×10⁻⁷ | 4.6 / 2.5 / 0.3 | 0.298 / 0.462 / 0.349 | 0.009 | 0.79 |
| MCV | rs2229032 | 3 | 142,178,144 | ATR | p.Arg2425Gln | −0.003 | 1.1×10⁻⁷ | 6.4 / 0.1 / 1.5 | 0.160 / 0.077 / 0.110 | 0.000 | 0.98 |
| Hct | rs13146355 | 4 | 77,412,140 | SHROOM3 | intronic | 0.105 | 4.1×10⁻⁷ | 4.2 / 2.0 / 2.6 | 0.444 / 0.150 / 0.317 | 0.144 | 4.7×10⁻⁶ |
| MCV | rs853678 | 6 | 28,297,313 | ZSCAN31 | p.Thr50Ser | −0.003 | 8.1×10⁻⁸ | 8.3 / 0.6 / 0.3 | 0.134 / 0.351 / 0.220 | 0.001 | 0.81 |
| MCH | rs4909444 | 8 | 139,701,209 | COL22A1 | p.Ala938Asp | −0.003 | 2.7×10⁻⁷ | 5.0 / 2.0 / 0.9 | 0.328 / 0.265 / 0.310 | 0.002 | 0.22 |
| RBC | rs1535 | 11 | 61,597,972 | FADS2 | intronic | 0.020 | 3.1×10⁻⁹ | 7.3 / 0.8 / 1.3 | 0.344 / 0.149 / 0.381 | 0.028 | 0.02 |
| MCV | rs2748427 | 17 | 76,121,864 | TMC6 | p.Trp125Arg | −0.002 | 1.6×10⁻⁵ | 6.9 / 2.0 / 1.4 | 0.210 / 0.468 / 0.291 | -0.001 | 0.96 |
| Hb | rs4805834 | 19 | 33,453,659 | CEP89 | intronic | −0.059 | 2.2×10⁻⁸ | 6.1 / 2.6 / 0.7 | 0.145 / 0.025 / 0.080 | −0.052 | 4.0×10⁻⁴ |
| RDW | rs7412 | 19 | 45,412,079 | APOE | p.Arg202Cys | 0.009 | 5.6×10⁻⁸ | 6.1 / 1.7 / - | 0.068 / 0.111 / - | 0.012 | 0.003 |
| (b) White Blood Cell traits | |||||||||||
| Monocytes | rs34856868 | 1 | 92,554,283 | BTBD8 | p.Val60Ile | 0.079 | 1.2×10⁻¹² | 10.7 / 1.0 / 1.0 | 0.029 / 0.005 / 0.015 | 0.118 | 1.2×10⁻⁵ |
| Total WBC | rs147630966 | 3 | 158,970,516 | IQCJ | p.Asn25Lys | 0.082 | 1.8×10⁻⁷ | 3.4 / 5.5 / 0.1 | 0.0004 / 0.013 / 0.006 | 0.122 | 0.35 |
| Total WBC | rs116085696 | 4 | 119,745,814 | SEC24D | p.Gly70Val | 0.095 | 2.4×10⁻⁷ | - / 6.7 / 0.2 | - / 0.011 / 0.003 | – | – |
| Eosinophils | rs12521868 | 5 | 131,784,393 | IRF1 | intronic | −0.008 | 7.5×10⁻⁸ | 8.3 / 1.0 / 1.2 | 0.415 / 0.090 / 0.280 | −0.009 | 0.03 |
| Total WBC | rs7776054 | 6 | 135,418,916 | MYB/HBS1L | intergenic | −0.010 | 6.1×10⁻⁷ | 7.1 / 0.1 / 0.2 | 0.262 / 0.217 / 0.195 | −0.011 | 1.0×10⁻⁴ |
| Eosinophils | rs1342326 | 9 | 6,190,076 | IL33 | intergenic | 0.009 | 1.5×10⁻⁷ | 8.2 / 0.4 / 0.3 | 0.164 / 0.349 / 0.206 | −0.009 | 0.10 |
| Lymphocytes | rs3744064 | 17 | 75,211,208 | SEC14L1 | UTR3 | 0.004 | 0.49 | 0.3 / 0.3 / 8.1 | 0.030 / 0.006 / 0.026 | −0.024 | 0.44 |
| Total WBC | rs3746072 | 19 | 3,179,884 | S1PR4 | p.Arg365Leu | −0.062 | 1.5×10⁻⁷ | 5.4 / 0.6 / 1.7 | 0.006 / 0.003 / 0.010 | −0.056 | 0.001 |
| Monocytes | rs34436714 | 19 | 54,327,313 | NLRP12 | p.Gly39Val | −0.022 | 1.0×10⁻⁷ | 5.9 / 0.5 / 1.7 | 0.217 / 0.370 / 0.263 | −0.026 | 0.02 |
| Monocytes | rs149771513 | 22 | 17,588,658 | IL17RA | p.Asp363Asn | 0.284 | 3.2×10⁻⁸ | 6.7 / 1.4 / 0.3 | 0.001 / 0.0002 / 0.0002 | −0.073 | 0.82 |
Bold indicates a significant association in either the discovery (p<5×10⁻⁷) or replication samples (p<0.003); Italics indicates nominal significance (p<0.05)
Novel, replicated associations with erythrocyte traits
All 4 novel, replicated erythrocyte associations are common SNPs present on the exome chip because of prior associations with non-hematologic phenotypes as listed in the NHGRI GWAS catalog. Two common intronic SNPs previously associated with renal function (SHROOM3/rs13146355 and CEP89/rs4805834) were associated with both Hb and Hct. The minor allele of SHROOM3/rs13146355-A (previously associated with both lower estimated glomerular filtration rate (eGFR)17 and higher serum magnesium18) was associated with significantly higher Hb and Hct and nominally higher RBC count in our discovery and replication cohorts. The minor allele of CEP89/rs4805834-T was associated with lower Hb and Hct and higher eGFR.19 The observed directions of effect on Hb and Hct for both CEP89/rs4805834 and SHROOM3/rs13146355 are opposite of that expected based on the known relationship between lower eGFR and anemia. Conditional analyses performed in a subset of our cohorts demonstrated that the effect of either CEP89/rs4805834 or SHROOM3/rs13146355 on Hb and Hct was independent of eGFR (see Supplementary Note for more detail).
An intronic SNP of the fatty acid desaturase gene FADS2 (rs1535) previously associated with transferrin levels20 and polyunsaturated fatty acid (PUFA) levels21 was associated with RBC count. Finally, we identified an association between increased RDW and the SNP encoding the canonical APOE-ɛ2 variant rs7412, which is known to be associated with cholesterol22–25 and inversely associated with dementia.26,27 Additional adjustment for LDL-cholesterol, HDL-cholesterol, and triglyceride levels did not attenuate the APOE-ɛ2/RDW association in the ARIC study. A tag for the APOE-ɛ4 allele was present on the exome chip, but had no association with either LDL-cholesterol or RDW independent of APOE-ɛ2 (Supplementary Note).
In gene-based tests, several loci were significantly associated with erythrocyte traits in the discovery sample (Table 2; Supplementary Table 8). The EPO gene-based association was driven by a single low-frequency missense variant (p.Asp70Asn/rs62483572), confirming the recent association of this variant with lower Hb.16 Similarly, a single novel variant drove the ITFG3 association (p.Asp534Asn/rs144091859). The HFE and G6PD associations were driven by population-specific common variants identified in prior GWAS that were included in the gene-based test because they are common in one population but absent in another and therefore averaged out to below the minor allele frequency (MAF) <0.05 threshold for inclusion in the trans-ethnic analysis. Significant associations in ANK1, NLRC3, and HBS1L were supported by multiple rare variants (Supplementary Table 9a; Supplementary Note).
Table 2.
Top results for gene-based tests in the discovery and replication samples
| Red Blood Cell Traits | T5Count p-value | SKATwu5 p-value | Replication p-value* | ||||||||
|---|---|---|---|---|---|---|---|---|---|---|---|
| Trait | Gene | EA+AA+HA | EA | AA | HA | EA+AA+HA | EA | AA | HA | WHI EA Hb | WHI EA Hct |
| Hb | EPO | 0.0024 | 9.9E-04 | 0.72 | 0.90 | 1.0E-08 | 2.3E-08 | 0.17 | 0.30 | 0.0001 | 6.4E-05 |
| Hb, Hct, MCH, MCHC, MCV | HFE | 4.7E-31 | 0.18 | 0.08 | 0.89 | 2.2E-23 | 0.06 | 0.03 | 0.92 | N/A | N/A |
| Hb, Hct, MCH, MCV, RBC | G6PD | 2.6E-19 | 0.02 | 0.32 | 0.07 | 1.6E-19 | 0.08 | 0.25 | 0.07 | N/A | N/A |
| MCH | NLRC3 | 0.0028 | 0.38 | 0.44 | 4E-04 | 0.06 | 0.77 | 0.87 | 2.5E-07 | 0.96 | 0.96 |
| MCH, MCHC, MCV, RBC | ITFG3 | 1.3E-04 | 0.95 | 9.9E-17 | 0.49 | 5.2E-26 | 0.85 | 1.1E-40 | 8.0E-04 | 0.095 | 0.94 |
| MCHC | ANK1 | 5.7E-04 | 2.5E-06 | 0.39 | 0.56 | 1.3E-10 | 1.1E-09 | 0.48 | 0.42 | 0.70 | 0.92 |
| MCV | HBS1L | 0.01 | 0.001 | 0.62 | 0.68 | 6.1E-07 | 1.5E-06 | 0.44 | 0.94 | 0.84 | 0.71 |
| White Blood Cell Traits | T5Count p-value | SKATwu5 p-value | Replication p-value | |||||||
|---|---|---|---|---|---|---|---|---|---|---|
| Trait | Gene | EA+AA+HA | EA | AA | HA | EA+AA+HA | EA | AA | HA | WHI EA trait |
| Monocytes | BTBD8 | 1.1E-06 | 8.3E-06 | 0.26 | 0.06 | 6.6E-12 | 1.5E-10 | 0.3 | 0.16 | 5.0E-6 |
| Monocytes | IL17RA | 0.24 | 0.22 | 0.81 | 0.5 | 6.4E-07 | 1.4E-07 | 0.77 | 0.08 | 0.004 |
| Total WBC | IQCJ | 2.7E-05 | 5.6E-04 | 8.0E-05 | 0.16 | 1.8E-07 | 5.1E-04 | 3.5E-06 | 0.39 | 0.67 |
| Total WBC, Neutrophils | (DARC locus) | 0.47 | 0.14 | 3.6E-08 | 0.59 | 0.36 | 0.23 | 1.2E-07 | 0.86 | N/A |
| Total WBC, Neutrophils | S1PR4 | 4.8E-06 | 4.5E-05 | 0.33 | 0.05 | 1.8E-07 | 5.1E-06 | 0.26 | 0.02 | 3.9E-05 |
Multiple associations in DARC, HFE and G6PD with Hb and Hct which were previously known and also seen in the single variant analyses were not evaluated.
Novel, replicated leukocyte associations
We discovered and replicated 6 novel WBC trait-locus associations. In the single-variant analysis, we identified a single missense variant in the type 4 sphingosine-1-phosphate receptor (S1PR4), p.Arg365Leu/rs3746072, that was associated with lower total WBC (p=1.5×10⁻⁷) and lower neutrophil counts (p=3.4×10⁻⁷) (Supplementary Figure 1). The association was consistent across cohorts (Figure 1) and validated in both replication samples (WHI EA women p=0.001; PUUMA Han Chinese p=0.003; p-metadiscovery+replication=5×10⁻¹²) (Supplementary Table 7). The variant is rare (MAFmeta=0.006) and not in linkage disequilibrium with variants in the region (Supplementary Figure 1). In both discovery and replication analyses, p.Arg365Leu was the only variant contributing to the significant gene-based association. Neutrophil counts were approximately 10% lower in the p.Arg365Leu minor allele carriers (Figure 2). The S1PR4 p.Arg365Leu amino acid substitution is located in the intracellular cytoplasmic tail of S1PR4, is at a conserved site (GERP: 3.94), and is predicted to be “possibly damaging” by PolyPhen-2.28
Figure 1.
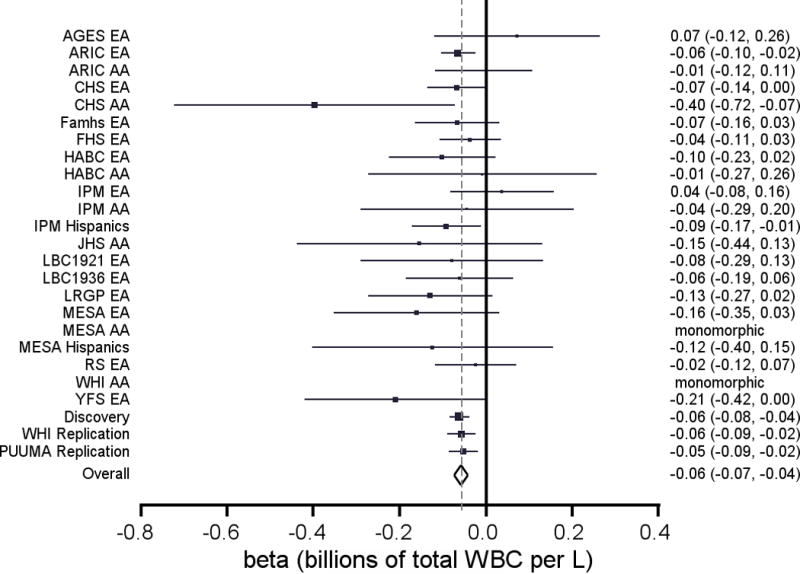
Forest plot of S1PR4 p.Arg365Leu for neutrophil count and total WBCs. Betas and 95% confidence intervals for each contributing study and for each meta-analysis
Figure 2.
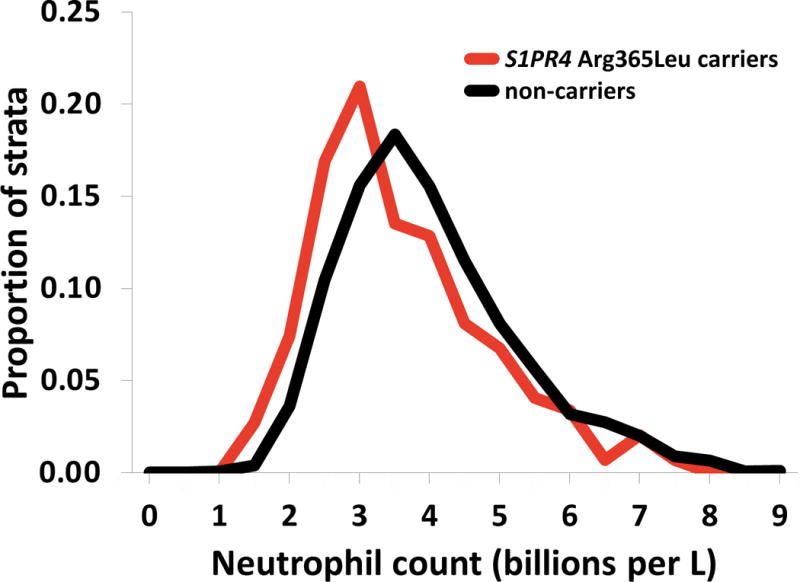
Distributions of neutrophil counts for carriers and non–carriers of S1PR4 p.Arg365Leu in ARIC.
Two missense variants were associated with lower monocyte count: a low-frequency p.Val60Ile variant in BTBD8 (rs34856868; MAFEA=0.03) and a common p.Gly39Val variant in NLRP12 (rs34436714; MAFEA=0.217). Three common, intergenic variants included on the exome chip as GWAS index SNPs originally associated with non-leukocyte phenotypes were newly associated with WBC traits in our analysis. The common intergenic regulatory variant of HBS1L-MYB (previously associated with erythrocyte and platelet traits) was associated with total WBC count. Common non-coding SNPs in the regions of IL33 and IRF1 previously associated with asthma29 and other allergic/autoimmune disorders30–33 were associated with eosinophil count.
Gene-based analyses identified an association between low frequency variation in the IL17RA locus and monocyte count (p=6.4×10⁻⁷). We confirmed the recently reported multi-variant association between CXCR2 and lower neutrophil count; 6 of the 9 rare CXCR2 missense variants in our analysis had a p-value less than 0.05, with the strongest associations from p.Arg153His (rs55799208; p=2.4×10⁻⁵) and p.Arg248Gln (rs61733609; p=6.1×10⁻⁵). Several additional single-variant and gene-based associations with WBC traits were observed within the AA or HA discovery samples, but not in the larger EA discovery sample. Three of these associations were driven by low frequency (MAF 0.01–0.05) variants in AAs (IQCJ and SEC24D) or HAs (SEC14L1) (Table 1b and Supplementary Tables 8 and 9b). Further assessment in independent AA or HA samples will be needed to validate these ethnicity-specific associations.
Characterization of variants in previously known GWAS loci
To evaluate whether variants identified in our analysis overlap previously known GWAS results or whether we identified independent associations, we conducted conditional analyses in ARIC, adjusting for previously known variants associated with erythrocyte and leukocyte traits in several regions overlapping the findings in this study (Supplementary Table 10). Specifically, we interrogated any variant that was rare (MAF<5%) and meeting study-wide significance (Supplementary Note).
We identified a novel association between a low-frequency variant in ANK1 (p.Ala1462Val/rs34664882; MAFEA=0.029; MAFAA=0.015; MAFHA=0.013) and MCHC that is independent of the original GWAS result (rs4737009; 1000G CEU MAF=0.27; ARIC MAFEA=0.24). We also identified several low-frequency missense variants in the HBA1-HBA2 region on chromosome 16. The most prominent was an AA-specific variant in ITFG3 (p.Asp534Asn) that was associated with several erythrocyte parameters (MCH, MCHC, MCV, RBC count) and is independent of the common GWAS association (see Supplementary Note). Significant associations with the same traits were also seen for rare variants in MRPL28, NARFL, RGS11, TMEM8A, and TPSD1 (see Supplementary Note).
Expression quantitative trait loci (eQTL) analysis
We used eQTL analysis34 to determine if newly identified non-coding variants are associated with expression of nearby genes across a range of tissue types (Supplementary Table 11). The most notable eQTL findings were in the FADS2 locus, which was associated with RBC count in our discovery analysis and met a nominal significance level in the replication analysis (p=0.02). In this region, FADS1, FADS2, and FADS3 all showed evidence of strong cis eQTL association to either the index SNP (rs1535) in multiple tissues, including FADS1 (minimum p= 8.0×10⁻³¹ in CD19+ B cells) and FADS2 (minimum p= 3.0×10−57 in blood lymphocytes). The S1PR4 p.Arg365Leu variant does not demonstrate an association with expression levels of S1PR4 or any nearby transcript (Supplementary Table 12).
Among the novel and independently replicated loci, rs4895441 at the HBS1L-MYB locus showed the expected eQTL association with HBS1L expression in multiple tissues (minimum p=3.1×10⁻³⁴ in aortic endothelial cells). In the SHROOM3 locus, rs131463 exhibited a weak eQTL association (p=7.3×10⁻⁶) with SHROOM3 transcript expression in subcutaneous adipose tissue. In the CEP89 locus, rs4805834 was associated with expression of SLC7A9 in multiple tissue (p=1.9×10⁻²⁴ in whole blood). The IRF1 SNP, rs12521868, was associated with expression of IRF1 in multiple tissues (p=1.4×10−125 in whole blood).
Pleiotropy in the associated loci
In addition to pleiotropy between our novel findings and the known associations with kidney function (CEP89 and SHROOM3) and with dementia and dyslipidemia (APOE), we also identified variants with pleiotropy across multiple blood cell lineages, most notably for the HBSL1-MYB and SH2B3 loci as well as other subthreshold associations (see Supplementary Note; Supplementary Table 13).
Confirmation of S1PR4 as a causal gene in model systems
The primary hypothesis of our exome chip study was that focused evaluation of coding variation would yield novel genetic associations of rare variants with hematologic traits, and that these variants would be more likely to be functionally relevant owing to the selection of variants for the exome chip. Our study yielded many novel associations, in part due to coverage of noncoding variation included in the exome chip as follow-up of previous GWAS, as is the case for the three novel RBC loci we report here. The association of a rare missense variant in S1PR4 associated with total WBC and neutrophil count was consistent with our a priori hypothesis, and we therefore undertook further follow-up studies of this gene’s functional impact on neutrophil traits in model systems.
Using previously generated S1pr4 null mice,35 we evaluated peripheral circulating blood neutrophil and monocyte counts, bone marrow neutrophil counts, and spleen neutrophil counts in S1pr4−/− mice and S1pr4+/+ littermates. We analyzed 12 mice in each genotype group (total n=24 mice), with equal numbers of males and females in each group, and found the mean percentage of total cells analyzed by fluorescence-activated cell sorting (FACS) that were Gr1+ CD11b+, marking neutrophils, was 31% lower in S1pr4−/− mice compared to wild-type mice. We repeated the experiment again in an additional 24 mice, again with 12 mice in each genotype group and equal numbers of males and females in each group and saw a similar decrease. Across the 48 mice, both the percentage of white blood cells that were neutrophils (28.0% decrease; p=0.11) and the absolute neutrophil count (54.3% decrease; p=0.03) were lower in S1pr4−/− mice compared to wild-type mice (Figure 3; Supplementary Figure 2; Supplementary Table 14). To evaluate the effects on circulating monocyte counts, FACS analysis was conducted in the same samples, and the mean percentage of total leukocytes analyzed by FACS that were Gr1- CD11b+ was equivalent in the two mouse groups (6.36% in S1pr4+/+ mice and 6.20% in S1pr4−/− mice, p=0.80, Supplementary Figures 3–4). Since abnormalities of leukocyte bone marrow egress have been described in the setting of S1pr1 deficiency,36 we evaluated the proportion of neutrophils in the bone marrow and spleen, to evaluate whether cells may be abnormally retained in these tissues, and the expression of specific adhesion molecules involved in leukocyte trafficking. No significant differences in neutrophil proportions or absolute counts were observed in the bone marrow or spleen (Supplementary Table 14, Supplementary Figures 3–6). Cd49b and Cxcr4 expression on bone marrow neutrophils were not differentially expressed (p>0.05), whereas Cd62l, or L-selectin, expression measured on circulating neutrophils was reduced approximately 2-fold in the S1pr4−/− mice (p=0.003) across both groups of mice studied. Since lower L-selectin expression may reflect shedding upon activation and cell extravasation in tissues, we evaluated tissue neutrophil numbers in the liver and lung of S1pr4−/− and wild-type mice. Neutrophil numbers were lower in both tissues in S1pr4−/− mice, with a 29.2% reduction in liver (p=0.12) and 40.2% reduction in lung (p=0.02) Supplementary Figure 7).
Figure 3. Blood neutrophils in S1pr4−/− mice.
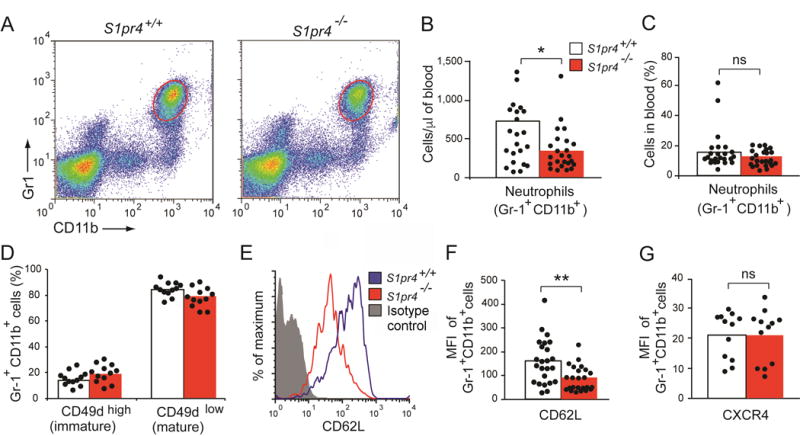
(A–C) Neutrophil numbers. Blood cells from 2–4 month–old S1pr4+/+ (n=24) and S1pr4−/− (n=24) mice were stained with anti–Gr–1 and anti–CD11b antibodies and analyzed by flow cytometry. Neutrophils were identified as Gr–1high CD11b+. Results are shown as density plots (A), as absolute numbers per μl of blood (B) and as the percentage of cells analyzed (C). (D–G) Adhesion molecule expression on blood neutrophils. Blood neutrophils from S1pr4+/+ and S1pr4−/− mice were analyzed by flow cytometry for the expression of CD49d (D), CD62L (E, F) and CXCR4 (G). Expression of CD49 is shown as percentage of Gr1+ CD11b+ CD49high (immature neutrophils) and Gr1+ CD11b+ CD49low (mature neutrophils) (D). Expression of CD62L (F) and CXCR4 (G) on Gr1+ CD11b+ cells are shown as mean fluorescence intensity (MFI). Representative histogram analysis showing the CD62L expression for S1pr4+/+ neutrophils (blue line), S1pr4−/− neutrophils (red line) and the corresponding isotype control staining (green line) (E). The bars represent mean values, and the closed circles are individual mice. S1pr4+/+ (open bars) and S1pr4−/− (red bars). Student’s t test *p < 0.05; **p < 0.01; ns, not significant.
To further assess the impact of disrupted s1pr4 expression in vivo, we conducted parallel experiments in zebrafish in which gene expression may be manipulated readily using morpholino (MO) antisense technology to specifically knock down the expression of target genes.37 In the comparison of embryos injected with ATG-MO’s designed against two independent sequences (Supplementary Note) within the single exon of s1pr4 (n=14 and 19) to non-specific MO (n=22), we confirmed a 36.6% and 34.3% decrease in neutrophil count in the two batches of whole embryos at two days post fertilization (dpf) (p=3.8×10⁻⁶ and p=4.4×10⁻⁷, respectively) (Figure 4; Supplementary Table 15).
Figure 4. Reduction in neutrophil counts in zebrafish embryos with decreased s1pr4 expression by morpholino knock–down with two independent morpholino oligonucleotides.
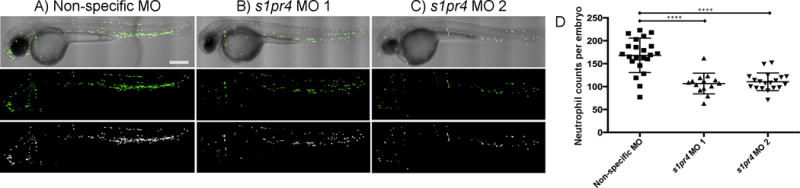
Representative images of zebrafish mpx–gfp fish are shown, demonstrating decreases in neutrophil number in s1pr4 morphants at 2 dpf. (A-C) The top set of panels are composite images of differential interference contrast (DIC), the middle panels are images using fluorescence (green channel), and the bottom panels are black and white images of the fluorescent signal of the same embryo injected at 2 dpf with either (A) non–specific MO, (B) 2 ng/embryo morphlino 1, or (C) 2 ng/embryo morphlino 2; D) distribution of average numbers of neutrophils across s1pr4 MO 1 (n=14), s1pr4 MO 2 (n=19) and non-specific MO (n=22). ****Student t–test p–value < 0.0001. Scale bar represents 300 μm and is the same for all panels.
Finally, to assess neutrophil behavior in response to injury, a cutaneous wound was made on the ventral side of the tail fin of the embryos at 2 dpf after treatment with the s1pr4 MO versus uninjected controls, and the numbers of neutrophils around the wound area at intervals up to five hours post injury were counted to quantify neutrophil recruitment and resolution in response to the injury. The overall number of neutrophils recruited to the wound was higher and took place faster in embryos treated with s1pr4 MO; however, after initial recruitment a trend for higher reverse migration rate and fewer cells retained at the site of injury in the s1pr4 morphants (Supplementary Table 16) suggests that the time course of neutrophil response to injury and/or resolution of inflammation may be altered in the setting of decreased s1pr4 expression (Figure 5).
Figure 5. Neutrophil migration in response to injury is altered in embryos with low S1pr4 gene expression.
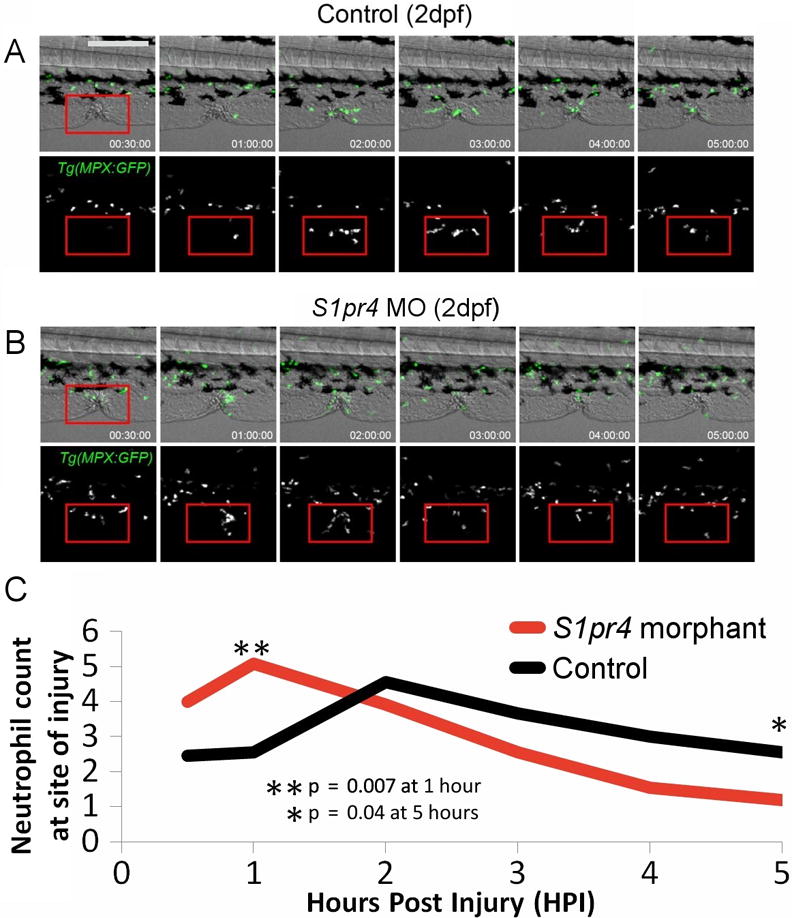
Neutrophil recruitment and resolution in zebrafish at site of cutaneous wound in the tail fin. A series of images from time–lapse movies of control (A) and s1pr4 morphant (B) embryos post injury. The red squares mark the injury area where numbers of neutrophil were counted. Green = mpx:GFP marked. Quantification plots are shown for the number of neutrophils in the marked injury area over time post injury (C). Scale bar represents 200 μm and is the same for all panels.
Discussion
Using a custom genotyping array with focused coverage of missense and loss-of-function variants in exonic regions, we conducted an analysis of erythrocyte and leukocyte traits in as many as 52,531 individuals of European, African and Hispanic ancestry. We identified and replicated 9 novel genetic loci associated with inter-individual differences in blood cell traits and have extended the role of several common variants previously associated with non-hematologic traits to erythrocyte or WBC phenotypes. Of these new findings, we identified a novel association between a rare missense variant in S1PR4 and WBC and neutrophil counts, and confirmed a role for this gene in two model organisms. Our findings highlight the importance of genes involved in erythrocyte membrane composition and leukocyte trafficking in the regulation of peripheral erythrocyte and WBC phenotypes.
The rare missense variant in S1PR4 (p.Arg365Leu/rs3746072; MAFmeta0.006) was robustly associated with total WBC count and neutrophil count. S1PR4 belongs to a family of G-coupled protein receptors for spingosine-1-phosphate (S1P), a lysophospholipid which functions as an extracellular signaling molecule with diverse biologic functions, including leukocyte trafficking.38 Another S1P receptor subtype, S1PR1, plays an important role in regulating immune cell function and lymphocyte trafficking by regulating egress of lymphocytes from bone marrow and lymphoid tissues;39–41 however, much less is known about the function of S1PR4. S1PR4 is expressed on hematopoietic and lymphoid cells and has been implicated in terminal megakaryocyte differentiation to platelets,42 and the regulation of dendritic cell function and T(H)17-cell43 and plasmacytoid dendritic cell44 differentiation. S1PR4 is highly expressed in neutrophils and lymphocytes. In the setting of combined s1p lyase and S1pr4 deletion in mice, neutrophilia and inflammation are decreased compared to S1P lyase deficiency alone. This suggests that S1PR4 may mediate the higher neutrophil count that accompanies highly elevated S1P levels in mice with S1P lyase deficiency.35,45
Here, we confirm in two in vivo vertebrate model systems (mouse and zebrafish) that loss of S1pr4 function leads to lower basal numbers (and proportion) of circulating neutrophils, consistent with the association observed in human p.Arg365Leu carriers. The mild reduction in neutrophil count suggests a hypothesis of abnormal neutrophil trafficking, rather than a critical role in neutrophil development. Bone marrow egress of leukocytes is known to be impaired in the setting of S1pr1 deficiency.39–41 We therefore examined the expression of previously defined key adhesion molecules for leukocyte migration in response to S1P signaling in the bone marrow neutrophils of S1pr4 null mice, including CD49b, which is abnormally expressed in S1pr1 and S1P lyase deficient states,36 and CXCR4, which interacts with the cytokine peptide SDF-1 required for cellular bone marrow egress.46,47 We did not find any alterations of these adhesion molecules, and we did not observe accumulation of neutrophils in the bone marrow or spleen, which corroborates a lack of effect on egress of neutrophils. Because neutrophil recruitment to injured or infected tissue is a key process, we evaluated neutrophil CD62L surface expression, which mediates interactions between the neutrophil and endothelium and is required for leukocyte trafficking across the endothelial border.48 CD62L neutrophil expression was reduced approximately two-fold in the S1pr4 null mouse. Since CD62L is shed from the surface of neutrophils upon activation and mediates leukocyte extravasation into tissues, we examined whether tissue neutrophil counts were elevated in the S1pr4 null mouse, accounting for lower circulating neutrophil counts. However, tissue neutrophil numbers were not increased in the S1pr4 null mouse compared to the wild-type; rather they were similarly decreased as in the blood.
In the zebrafish s1pr4 morphants, neutrophil accumulation and resolution at the site of a cutaneous wound occurred earlier than in controls, suggesting impaired cellular inflammation in response to tissue injury. Further experiments to delineate neutrophil-endothelial cell interactions will be needed to delineate further the precise mechanisms by which S1PR4 impacts circulating neutrophil counts. Together, our observations support the role of S1PR4 in the regulation of neutrophil counts and potentially clinically relevant impairment in response to injury or infection.
Blood monocyte counts are altered in the setting of chronic inflammatory disease and various infections, both viral and non-viral. NLRP12 is a member of a sub-group of a non-inflammasome forming NLR family that attenuates inflammation by suppressing NF-κB signaling in activated monocytes.49 NLRP12 loss-of-function mutations have been identified in families with hereditary periodic fever syndromes50. The missense variant reported here, p.Gly39Val, was not reported in these families and is not present in the ClinVar database.51 In humans and mice, NLRP12 is highly expressed in bone marrow, and macrophages from Nlrp12-deficient mice exhibit decreased chemotaxis in response to chemokines in vitro suggesting that NLRP12 is important for leukocyte cell trafficking.52 IL17RA is a proinflammatory cytokine with a role in hematopoietic cell maturation, and vascular IL-17RA supports monocyte adherence.53,54 Mutations in IL17RA are associated with familial candidiasis.55
Eosinophil counts are altered in parasitic infection, allergic and autoimmune diseases such as asthma and inflammatory bowel disease. The IL33 variant rs1342326 has previously been associated with asthma,29 and IL33 activates eosinophils.56 The IRF1 variant (rs12521868), which we show to be associated with IRF1 expression, has been previously associated with Crohn’s disease.57 IRF1 is also near IL5, a known regulator of eosinophil production previously associated with eosinophil count.58
We observed novel erythrocyte trait associations for common non-coding SNPs representing two genomic regions previously associated with kidney function, near SHROOM3 and near CEP89.19,59 For both loci, the allele associated with lower Hb and Hct was associated with higher eGFR,17 suggesting that these erythrocyte trait associations are not mediated through an effect of renal dysfunction and related decreased erythropoietin production. The SHROOM3 locus has additionally been associated with serum magnesium levels.18 The effects of these two loci on erythrocyte, renal, and electrolyte traits may occur instead through cytoskeleton-dependent solute/ion channels shared between kidney epithelia and erythrocyte membranes, as has been demonstrated in other examples such as PIEZO1, another GWAS locus for erythrocyte traits. PIEZO1 is a RBC membrane mechano-sensitive cation channel that appears to require actin cytoskeleton reorganization60,61 and senses mechanical forces associated with fluid flow and/or circumferential stretch in epithelial cells at the basolateral side of renal proximal convoluted tubules.62–64 Dominant missense mutations of PIEZO1 have been reported in patients with hereditary xerocytosis,65 a congenital hemolytic anemia characterized by dehydrated, shrunken erythrocytes and the presence of stomatocytes due to increased potassium permeability. By analogy, SHROOM3 is an actin-binding protein involved in epithelial shape regulation, modulating ion channel activity through myosin II-dependent cytoskeletal re-organization in the kidney.66 Its role in erythrocyte function has yet to be tested experimentally. CEP89 is a ubiquitously expressed and highly conserved gene for which biologic function is not well known. CEP89 is flanked by SLC7A9, a kidney solute transporter. Mutations in SLC7A9 result in congenital cystinuria.67 Our eQTL analyses showed a significant association of the index SNP associated with Hb and Hct and SLC7A9 transcript levels in multiple tissue types and most strongly in whole blood, supporting a possible hematologic function.
FADS1 and FADS2 encode the two rate-limiting desaturases in the conversion of dietary essential medium-chain PUFAs (e.g., α-linoleic acid [ALA]), to long-chain PUFAs (arachadonic acid, eicosapentaenoic acid [EPA], docosahexaenoic acid [DHA]). The minor allele of the FADS2 intronic variant rs1535-G is associated with higher levels of ALA and lower levels of EPA and DHA. This suggests less efficient conversion due to decreased FADS activity,21 as well as cholesterol levels and pro-inflammatory eicosanoids.68 Here we report that the same FADS2 allele is associated with higher RBC count, Hb and Hct. rs1535 is in strong LD with other common SNPs in the FADS1-FADS2 region on chromosome 11q12.2, including several eQTL SNPs for FADS1. Our eQTL analysis of this region showed strong associations of these SNPs with FADS1, FADS2 and FADS3 expression levels. Long-chain PUFAs are incorporated into erythrocyte membrane glycerolipids, affecting erythrocyte membrane fluidity, permeability, and sensitivity to oxidative damage and subsequent hemolysis.69 Nonetheless, the association of rs1535 with higher RBC count suggests additional mechanisms. In this regard, rs1535 is also located ~100 kb from FTH1, which encodes the heavy subunit of ferritin, the major intracellular iron storage protein which is expressed in both mature erythrocytes and early erythroid precursors.
Pleiotropy (i.e., more than one trait associated with the same locus) was observed for erythrocyte associations at the CEP89, FADS1 and HFE loci, and we extended the association of the well-characterized common HBSL1-MYB regulatory variant, previously associated with erythrocyte and platelet traits, to WBC count. MYB encodes c-Myb, a transcription factor and proto-oncogene expressed in immature hematopoietic cells and leukemic cells that plays an essential role in the regulation of normal hematopoiesis and leukemogenesis.70 In addition, we confirmed the previously reported association of the chromosome 12q24 SH2B3 region with erythrocyte and WBC traits; this locus has been associated with multiple cardiovascular and inflammatory traits and diseases.9,71–73
Our results add to recent observations that rare coding variants contribute to phenotypic differences in complex blood cell traits among community-dwelling individuals unselected for hematologic disorders. Experimental testing of S1PR4 loss of function in vivo, performed to follow up a S1PR4 rare missense variant association in our study, showed novel biologic effects on neutrophil count and function. Common variants originally associated with a single blood cell trait through GWAS, such as SH2B3, have subsequently been associated with traits related to all 3 blood cell lineages,10,74 as well as non-hematologic traits,73,75,76 and these pleiotropic effects will be useful to discern patterns suggesting specific biologic hypotheses for further mechanistic hypothesis testing.
Methods (online)
Study Samples
Our discovery sample consisted of exome chip data from 52,531 individuals, including 37,775 European Americans (EA), 11,589 African Americans (AA), and 3,167 Hispanic Americans (HA) sampled from 16 population-based cohorts participating in the CHARGE Consortium77: Age, Gene/Environment Susceptibility study (AGES), Atherosclerosis Risk in Communities (ARIC) Study, Cardiovascular Health Study (CHS), Family Heart Study (FamHS), Framingham Heart Study (FHS), Health ABC (HABC), Health2006/2008, the Mount Sinai Institute for Personalized Medicine BioMe Biobank Project (BioMe), Jackson Heart Study (JHS), the Lothian Birth Cohorts 1921/1936 (LBC), Multi-Ethnic Study of Atherosclerosis (MESA), the Rotterdam Study (RS), the Women’s Health Initiative (WHI; AAs only), and the Cardiovascular Risk in Young Finns Study (YFS). The replication sample consisted of 17,500 samples from the Women’s Health Initiative (WHI; EAs only) and 5,261 Han Chinese individuals from the Peking University – University of Michigan Study of Atherosclerosis (PUUMA). Descriptions of each of the cohorts and the techniques used to measure the hematologic traits are provided in previous publications (Supplementary Note) and summarized in Supplementary Table 1. All participants provided written informed consent as approved by local human-subjects committees.
Erythrocyte and Leukocyte Phenotypes
The hematology traits we studied included hemoglobin concentration (Hb), hematocrit (Hct), mean corpuscular volume (MCV), mean corpuscular hemoglobin (MCH), mean corpuscular hemoglobin concentration (MCHC), red blood cell (RBC) count, red cell distribution width (RDW), total white blood cell (WBC) count, and counts of the WBC subtypes neutrophils, monocytes, lymphocytes, basophils, and eosinophils, using the transformations defined in Supplementary Table 1. Traits were harmonized across cohorts for the same units of measurement, and within each cohort, traits were transformed according to standard convention (Supplementary Table 1). We Winsorized values greater than three standard deviations of the population mean for each trait in each cohort in order to reduce false positives caused by extreme outliers while still maintaining power to identify a potential signal with strong effect.
Genotyping and quality control
Genotypes were assayed using the Illumina HumanExome Beadchip (Illumina, Inc., San Diego, CA) in accordance with the manufacturer’s instructions. Genotype calls were assigned using GenomeStudio v2010.3. Samples were excluded if any of the following applied to them: a call-rate less than 95%, ethnic outlier in a principal components analysis, evidence of contamination, sex mismatch, or unexpected cryptic relatedness. SNPs were excluded with call-rates less than 95% or if they deviated from Hardy-Weinberg at p<5×10⁻⁶. For the SNPs identified by the association analyses, the cluster plots were visually inspected.
Association analysis of single variants and implementation of gene-based tests
Variants were annotated using dbNSFP v2.0.78,79 Phenotypes were first transformed (either natural log transform, square root, or none at all, as delineated in Supplementary Table 1 and then Winsorized at 3 standard deviations (mean and standard deviation was computed separately for each cohort and the threshold was computed as mean±3 standard deviations; any individual with a value exceeding this threshold was replaced with this threshold). Age, sex, study (if needed), and principal components were included as covariates in the analyses. The R skatMeta (v1.4.2) package was used for all cohort-level analyses. Each study used either the skatCohort or the skatFamCohort function to create an R object that was then uploaded to a central server.
After performing quality control of the genotypes as described previously,80 we analyzed 247,870 SNPs meeting quality control, using single variant association tests and gene-based tests of aggregate variants. For single variant association tests, a minor allele count filter of at least 40 was used for each trait. As a secondary analysis, we lowered this filter to a minor allele count of 10 or greater, to evaluate for any lower frequency alleles with strong effects (Supplementary Note; Supplementary Figure 8). For gene-based testing, only coding variants putatively affecting protein structure (missense, stop-gain, stop-loss, and splice variants) that also had a frequency < 5% in a given population (~200,000 SNPs) were included.
In parallel with the single-variant association tests, we conducted aggregate variant testing using two methods: the T5 test81 (MAF < 0.05) and the SKAT test82 (MAF < 0.05, Wu weights). The T5 test identifies those genes where multiple samples have private or rare mutations leading to a strong effect in a single direction. The SKAT test allows for different variants to have effects in different directions. In both tests, only those variants with a possible effect on amino acid sequence (missense, stop-gain, stop-loss, and splice variants) were included in the analysis.
Meta-analysis of single variant and gene-based tests
Single variant and gene-based association statistics were combined in a fixed-effects, inverse-variance weighted meta-analysis and performed in parallel at two different sites using the same skatMeta package. Analyses were stratified first by ancestry and then combined in a trans-ethnic analysis using the same methodology. Results for single variant analyses were reported only when 40 or more minor allele counts were observed, and a Bonferroni correction for the number of tests was employed to determine significance. For gene-based tests, two different methods were employed. The first was the Combined Multivariate and Collapsing (CMC) approach,81 where the number of qualifying variants in each gene were added together for each individual separately and then used as the predictor in a linear regression model. To be included, a variant had to have an average allele frequency less than 5% across all cohorts and also change the amino acid sequence of an mRNA, either as a missense, stop-gain, stop-loss, frameshift or splice site variant. The second method was the SKAT method82 and used the same set of variants as the CMC/T5 approach. Only those genes with a minor allele count greater than 40 were analyzed, and a Bonferroni correction for the number of genes tested was employed to determine significance. The number of individuals with each of the hematologic traits under study differed, and consequently the number of markers reaching our minor allele count threshold of 40 varied by trait. We therefore applied trait-specific p-value thresholds, according to the number of variants available for the individuals with each trait (Supplementary Table 5).
Independent replication analysis
We conducted follow-up replication analysis in 18,018 independent EA samples from the Women’s Health Initiative (WHI) and 5,261 Han Chinese individuals from the Shijingshan district of Beijing that participated in the Peking University – University of Michigan Study of Atherosclerosis (PUUMA) (Supplementary Note). Both studies were genotyped using an Illumina HumanExome BeadChip genotyping array and had erythrocyte and WBC traits available.16 All novel, significant (p<trait-specific Bonferroni threshold) variant associations from the discovery results were tested in the replication analysis. Gene-based test results that were significant in the discovery analyses were tested in the replication samples, with the exception of HFE and PIGM/DARC since these loci have previously well-defined, known signals and were also seen in the single variant analyses. In the case where an association was identified in the discovery analysis with an erythrocyte trait other than Hb or Hct, we analyzed the association with Hb and Hct in the replication analysis. Similarly, in the case where a leukocyte subtype association was found in the discovery analyses, we analyzed those variants’ association with total WBC in the replication analysis. We applied a Bonferroni correction to the number of replication tests we conducted for the single variant analyses (p-value = 0.05 / 19 = 0.003) and for the gene-based tests (p-value = 0.05 / 10 = 0.005).
Expression quantitative trait loci (eQTL) analysis
We identified proxy SNPs in high linkage disequilibrium (LD; r2>0.8) with associated index SNPs in 3 HapMap builds and 1000 Genomes with SNAP83. SNP rsIDs were searched for primary SNPs and LD proxies against a collected database of expression SNP (eSNP) results (Supplementary Note). The collected eSNP results met criteria for statistical thresholds for association with gene transcript levels as described in the original papers.
Mouse experiments
S1pr4+/− mice on a C57Bl/6 background (stock number 005799) were obtained from The Jackson Laboratory, Bar Harbor, ME.35 Mice were housed in a clean conventional facility that excluded specific mouse pathogens. All animal procedures were approved by the National Institute of Diabetes and Digestive and Kidney Diseases and were performed in accordance with the National Institutes of Health guidelines. Because neutrophil counts are known to exhibit a high degree of variability within the same mouse and between mice, and by sex,84,85 we studied a total of 48 mice. The first 24 mice (6 S1pr4−/− females, 6 S1pr4−/− males, 6 S1pr4+/+ females, and 6 S1pr4+/+ males) were all littermates (“Experiment 1” in Supplementary Table 14). In a second set of confirmatory experiments, 12 S1pr4−/− mice were compared to 12 C57BL6 controls (Jackson Labs), again with equal proportions of males and females in each genotype group (“Experiment 2” in Supplementary Table 14). Mice were genotyped by multiplex PCR from tail snips using the set of primers and conditions as previously described.35 Mice were analyzed between 2 and 4 months after birth.
Total bone marrow cells were isolated from mice by flushing the femur and tibia from both legs two times with 1 ml of PBS. To obtain total leukocytes, spleen was dissected and mechanically disaggregated. Single-cell suspensions were obtained using a 40-μm cell strainer. Blood samples were obtained by cardiac puncture. Erythrocytes were removed by ammonium chloride lysis. Absolute blood cell counts were determined by flow cytometry using CALTAG counting beads (Life Technology, Grand Island, NY), and % neutrophils of the total leukocyte pool were calculated and analyzed to account for any possible pipetting error. Neutrophils were analyzed by flow cytometry as previously described.35 All antibodies were purchased from BD Bioscience, San Jose, CA and were used in 1/50 dilutions. Briefly, cells were diluted in 1% BSA-PBS and incubated with anti-FcgR antibody (catalog # 553141 clone 2.4G2) followed by the antibodies anti-mouse Gr-1 (allophycocyanin [APC]-conjugated) (catalog # 553129 clone RB6-8C5) and anti-mouse CD11b (phycoerythrin [PE]-conjugated) (catalog # 553311 clone m1/70). Cells were also incubated with anti-mouse CD62L (catalog # 553150 clone MEL-14), CD49d (catalog # 553156 clone R1-2) and CXCR4 (catalog # 551967 clone 2B11/CXCR4) (all three antibodies were fluorescein-conjugated). After cells were labeled for 30 minutes on ice, and fixed in 1% paraformaldehyde in PBS, then subjected to flow cytometry on a FACScalibur (BD Bioscience). Data were analyzed using the FlowJo software (Tree Star, Ashland, OR). Neutrophils were identified as Gr-1+ CD11b+ cells, and monocytes were identified as Gr-1- CD11b+ cells.
Zebrafish experiments
Zebrafish ortholog s1pr4 was identified by sequence homology searches and gene synteny analysis, and MO design also incorporated information about gene structure and translational initiation sites (Gene-Tool Inc., Philomath, OR). Two separate MO’s were designed against s1pr4, which is a single exon gene, in the ATG region to inhibit its mRNA translation (see Supplementary Table 15) MOs were injected at multiple doses into one-cell stage embryos of the mpx1-gfp zebrafish line to find the optimal dose, 2 ng/embryo, and the number of gfp-expressing cells was imaged under a spinning-disk confocal microscope and counted at 2 days post fertilization. Experiments were conducted in >10 each of control and morphant embryos. The day 2 cutaneous injury was created 2 days after MO injection by nicking the tail fin, and the number of gfp+ cells at the site of the cutaneous wound was counted at 30 minutes, and 1, 2, 3, 4, 5, 6, and 8 hours post injury. Paired, one-tailed t-tests were computed for the comparison groups, and linear regression analysis of neutrophil numbers at the cutaneous wound in the time series was performed. Experiments were done in replicates of at least 10 embryos by a technician and analysis was checked by a postdoctoral fellow blinded to MO injection status.
Supplementary Material
Highlights.
-
▪
Exome chip analysis identified loci associated with RBC and WBC traits that were replicated in an independent sample
-
▪
Systematic assessment of coding variation identified candidate causal genes
-
▪
A low frequency S1PR4 missense variant was robustly associated with neutrophil counts
-
▪
Loss-of-function experiments in vivo in murine and zebrafish models confirmed S1PR4 function in maintaining circulating neutrophil counts, consistent with the effect observed in humans
-
▪
S1PR4 appears to play a role in recruitment and resolution of neutrophils in response to tissue injury
Acknowledgments
The authors thank the staff and participants of all studies for their important contributions. A complete list of acknowledgments for each study is available in the Supplementary Note. This work was supported by the following grants and contracts.
US National Institutes of Health contracts: N01AG12100, HHSN268201100005C, HHSN268201100006C, HHSN268201100007C, HHSN268201100008C, HHSN268201100009C, HHSN268201100010C, HHSN268201100011C, HHSN268201100012C, HHSN268201200036C, HHSN268200800007C, N01HC55222, N01HC85079, N01HC85080, N01HC85081, N01HC85082, N01HC85083, N01HC85086, N01HC25195, N02HL64278, N01AG62101, N01AG62103, N01AG62106, HHSN268200782096C, HHSN268201300046C, HHSN268201300047C, HHSN268201300048C, HHSN268201300049C, HHSN268201300050C, N01HC95159, N01HC95160, N01HC95161, N01HC95162, N01HC95163, N01HC95164, N01HC95165, N01HC95166, N01HC95167, N01HC95168, N01HC95169, RR024156, N02HL64278, HHSN268201100046C, HHSN268201100001C, HHSN268201100002C, HHSN268201100003C, HHSN268201100004C, HHSN271201100004C, RC2HL102924, CA137088
US National Institutes of Health grants: 5RC2HL102419, HL080295, HL087652, HL103612, HL105756, HL120393, AG023629, DK063491, R01DK089256, R01HL087700, R01HL088215, R01HL117078, 1R01AG032098-01A1, U01-HG005152, R25CA094880, R01HL122684, R01HL04880, R01HL32262, R01DK49216, R01HL10001, R01DK092760, R01OD017870
Clinical and Translational Science Institute grant: UL1TR000124
Danish Heart Foundation: 07-10-R61-A1754-B838-22392F
Biobanking and BioMolecular resources Research Infrastructure – The Netherlands (BBMRI-NL) grant: NWO 184.021.007
Health Insurance Foundation: 2012B233
Academy of Finland grants: 134309, 126925, 121584, 124282, 129378, 117787, 41071
This work was supported in part by the NIDDK Division of Intramural Research.
The views expressed in this manuscript are those of the authors and do not necessarily represent the views of the National Heart, Lung, and Blood Institute; the National Institutes of Health; or the U.S. Department of Health and Human Services.
This work was carried out in part using computing resources at the University of Minnesota Supercomputing Institute.
Footnotes
Accession codes for data access
Summary data for all analyses has been deposited into the database of Genotypes and Phenotypes (dbGaP) under the “CHARGE (Cohorts for Heart and Aging Research in Genomic Epidemiology) Consortium Summary Results from Genomic Studies”. The dbGaP Study Accession is “phs000930” and can be found at: http://www.ncbi.nlm.nih.gov/projects/gap/cgi-bin/study.cgi?study_id=phs000930
Author Contributions
NP, YZ, YZ, EPB, IJD, OHF, MEG, VG, TH, TBH, AH, LJL, AL, OP, JMS, AD, YH, CJO, APR, and SKG designed the study. YZ, IIB, EPB, MC, IJD, LD, MFF, MEG, VG, TBH, AH, RDJ, JJ, MK, TL, AL, MEN, BMP, OTR, SSR, JMS, BHT, RPT, JW, and CJO recruited and assessed participants. PLA, JB, NG, LL, YZ, FWA, EB, IIB, EPB, PIWdB, MFF, MLG, TL, DCL, YL, SSR, FR, JIR, KDT, and AGU generated genotyping data. YZ, MLA, VC, EJH, BH, KH, XZ, VMN, AMRDS, RLP, and LIZ performed functional experiments. NP, UMS, TSA, MLA, PLA, JB, NG, BH, YL, MAN, RP, AVS, YZ, JSF, NF, MLG, RJFL, BMP, AD, ALW, JGW, RLP, LIZ, CJO, APR, and SKG analyzed and interpreted data. NP, UMS, WZ, TSA, JB, JAB, MHC, JDE, NG, ADJ, ML, YL, LL, AM, REM, MAN, RP, AVS, FvR, MY, JW, and APR performed statistical analysis. NP, UMS, YZ, APR, and SKG wrote the manuscript. All authors were given the opportunity to comment and provide revisions to the manuscript text.
COMPETING FINANCIAL INTERESTS
The authors declare no competing financial interests
References
- 1.Whitfield JB, Martin NG. Genetic and environmental influences on the size and number of cells in the blood. Genet Epidemiol. 1985;2:133–44. doi: 10.1002/gepi.1370020204. [DOI] [PubMed] [Google Scholar]
- 2.Evans DM, Frazer IH, Martin NG. Genetic and environmental causes of variation in basal levels of blood cells. Twin Res. 1999;2:250–7. doi: 10.1375/136905299320565735. [DOI] [PubMed] [Google Scholar]
- 3.Lin JP, et al. Evidence for linkage of red blood cell size and count: genome-wide scans in the Framingham Heart Study. Am J Hematol. 2007;82:605–10. doi: 10.1002/ajh.20868. [DOI] [PubMed] [Google Scholar]
- 4.Pilia G, et al. Heritability of cardiovascular and personality traits in 6,148 Sardinians. PLoS Genet. 2006;2:e132. doi: 10.1371/journal.pgen.0020132. [DOI] [PMC free article] [PubMed] [Google Scholar]
- 5.Zakai NA, et al. A prospective study of anemia status, hemoglobin concentration, and mortality in an elderly cohort: the Cardiovascular Health Study. Arch Intern Med. 2005;165:2214–20. doi: 10.1001/archinte.165.19.2214. [DOI] [PubMed] [Google Scholar]
- 6.Brennan ML, et al. Comprehensive peroxidase-based hematologic profiling for the prediction of 1-year myocardial infarction and death. Circulation. 2010;122:70–9. doi: 10.1161/CIRCULATIONAHA.109.881581. [DOI] [PMC free article] [PubMed] [Google Scholar]
- 7.Elwood PC, Waters WE, Benjamin IT, Sweetnam PM. Mortality and anaemia in women. Lancet. 1974;1:891–4. doi: 10.1016/s0140-6736(74)90346-8. [DOI] [PubMed] [Google Scholar]
- 8.Reiner AP, et al. Genome-wide association study of white blood cell count in 16,388 African Americans: the continental origins and genetic epidemiology network (COGENT) PLoS Genet. 2011;7:e1002108. doi: 10.1371/journal.pgen.1002108. [DOI] [PMC free article] [PubMed] [Google Scholar]
- 9.Ganesh SK, et al. Multiple loci influence erythrocyte phenotypes in the CHARGE Consortium. Nat Genet. 2009;41:1191–8. doi: 10.1038/ng.466. [DOI] [PMC free article] [PubMed] [Google Scholar]
- 10.van der Harst P, et al. Seventy-five genetic loci influencing the human red blood cell. Nature. 2012;492:369–75. doi: 10.1038/nature11677. [DOI] [PMC free article] [PubMed] [Google Scholar]
- 11.Kamatani Y, et al. Genome-wide association study of hematological and biochemical traits in a Japanese population. Nat Genet. 2010;42:210–5. doi: 10.1038/ng.531. [DOI] [PubMed] [Google Scholar]
- 12.Pistis G, et al. Genome wide association analysis of a founder population identified TAF3 as a gene for MCHC in humans. PLoS ONE. 2013;8:e69206. doi: 10.1371/journal.pone.0069206. [DOI] [PMC free article] [PubMed] [Google Scholar]
- 13.Nalls MA, et al. Multiple loci are associated with white blood cell phenotypes. PLoS Genet. 2011;7:e1002113. doi: 10.1371/journal.pgen.1002113. [DOI] [PMC free article] [PubMed] [Google Scholar]
- 14.Okada Y, et al. Identification of nine novel loci associated with white blood cell subtypes in a Japanese population. PLoS Genet. 2011;7:e1002067. doi: 10.1371/journal.pgen.1002067. [DOI] [PMC free article] [PubMed] [Google Scholar]
- 15.Auer PL, et al. Imputation of exome sequence variants into population- based samples and blood-cell-trait-associated loci in African Americans: NHLBI GO Exome Sequencing Project. Am J Hum Genet. 2012;91:794–808. doi: 10.1016/j.ajhg.2012.08.031. [DOI] [PMC free article] [PubMed] [Google Scholar]
- 16.Auer PL, et al. Rare and low-frequency coding variants in CXCR2 and other genes are associated with hematological traits. Nat Genet. 2014;46:629–34. doi: 10.1038/ng.2962. [DOI] [PMC free article] [PubMed] [Google Scholar]
- 17.Okada Y, et al. Meta-analysis identifies multiple loci associated with kidney function-related traits in east Asian populations. Nat Genet. 2012;44:904–9. doi: 10.1038/ng.2352. [DOI] [PMC free article] [PubMed] [Google Scholar]
- 18.Meyer TE, et al. Genome-wide association studies of serum magnesium, potassium, and sodium concentrations identify six Loci influencing serum magnesium levels. PLoS Genet. 2010;6 doi: 10.1371/journal.pgen.1001045. [DOI] [PMC free article] [PubMed] [Google Scholar]
- 19.Chambers JC, et al. Genetic loci influencing kidney function and chronic kidney disease. Nat Genet. 2010;42:373–5. doi: 10.1038/ng.566. [DOI] [PMC free article] [PubMed] [Google Scholar]
- 20.Benyamin B, et al. Novel loci affecting iron homeostasis and their effects in individuals at risk for hemochromatosis. Nat Commun. 2014;5:4926. doi: 10.1038/ncomms5926. [DOI] [PMC free article] [PubMed] [Google Scholar]
- 21.Lemaitre RN, et al. Genetic loci associated with plasma phospholipid n-3 fatty acids: a meta-analysis of genome-wide association studies from the CHARGE Consortium. PLoS Genet. 2011;7:e1002193. doi: 10.1371/journal.pgen.1002193. [DOI] [PMC free article] [PubMed] [Google Scholar]
- 22.Wu Y, et al. Genetic association with lipids in Filipinos: waist circumference modifies an APOA5 effect on triglyceride levels. J Lipid Res. 2013;54:3198–205. doi: 10.1194/jlr.P042077. [DOI] [PMC free article] [PubMed] [Google Scholar]
- 23.Rasmussen-Torvik LJ, et al. High density GWAS for LDL cholesterol in African Americans using electronic medical records reveals a strong protective variant in APOE. Clin Transl Sci. 2012;5:394–9. doi: 10.1111/j.1752-8062.2012.00446.x. [DOI] [PMC free article] [PubMed] [Google Scholar]
- 24.Chasman DI, et al. Genetic determinants of statin-induced low-density lipoprotein cholesterol reduction: the Justification for the Use of Statins in Prevention: an Intervention Trial Evaluating Rosuvastatin (JUPITER) trial. Circ Cardiovasc Genet. 2012;5:257–64. doi: 10.1161/CIRCGENETICS.111.961144. [DOI] [PubMed] [Google Scholar]
- 25.Kettunen J, et al. Genome-wide association study identifies multiple loci influencing human serum metabolite levels. Nat Genet. 2012;44:269–76. doi: 10.1038/ng.1073. [DOI] [PMC free article] [PubMed] [Google Scholar]
- 26.Corder EH, et al. Protective effect of apolipoprotein E type 2 allele for late onset Alzheimer disease. Nat Genet. 1994;7:180–4. doi: 10.1038/ng0694-180. [DOI] [PubMed] [Google Scholar]
- 27.Talbot C, et al. Protection against Alzheimer’s disease with apoE epsilon 2. Lancet. 1994;343:1432–3. doi: 10.1016/s0140-6736(94)92557-7. [DOI] [PubMed] [Google Scholar]
- 28.Adzhubei IA, et al. A method and server for predicting damaging missense mutations. Nat Methods. 2010;7:248–9. doi: 10.1038/nmeth0410-248. [DOI] [PMC free article] [PubMed] [Google Scholar]
- 29.Moffatt MF, et al. A large-scale, consortium-based genomewide association study of asthma. N Engl J Med. 2010;363:1211–21. doi: 10.1056/NEJMoa0906312. [DOI] [PMC free article] [PubMed] [Google Scholar]
- 30.Barrett JC, et al. Genome-wide association defines more than 30 distinct susceptibility loci for Crohn’s disease. Nat Genet. 2008;40:955–62. doi: 10.1038/NG.175. [DOI] [PMC free article] [PubMed] [Google Scholar]
- 31.McGovern DP, et al. Fucosyltransferase 2 (FUT2) non-secretor status is associated with Crohn’s disease. Hum Mol Genet. 2010;19:3468–76. doi: 10.1093/hmg/ddq248. [DOI] [PMC free article] [PubMed] [Google Scholar]
- 32.Jostins L, et al. Host-microbe interactions have shaped the genetic architecture of inflammatory bowel disease. Nature. 2012;491:119–24. doi: 10.1038/nature11582. [DOI] [PMC free article] [PubMed] [Google Scholar]
- 33.Sabater-Lleal M, et al. Multiethnic meta-analysis of genome-wide association studies in >100 000 subjects identifies 23 fibrinogen-associated Loci but no strong evidence of a causal association between circulating fibrinogen and cardiovascular disease. Circulation. 2013;128:1310–24. doi: 10.1161/CIRCULATIONAHA.113.002251. [DOI] [PMC free article] [PubMed] [Google Scholar]
- 34.Zhang X, et al. Synthesis of 53 tissue and cell line expression QTL datasets reveals master eQTLs. BMC Genomics. 2014;15:532. doi: 10.1186/1471-2164-15-532. [DOI] [PMC free article] [PubMed] [Google Scholar]
- 35.Allende ML, et al. Sphingosine-1-phosphate lyase deficiency produces a pro-inflammatory response while impairing neutrophil trafficking. J Biol Chem. 2011;286:7348–58. doi: 10.1074/jbc.M110.171819. [DOI] [PMC free article] [PubMed] [Google Scholar]
- 36.Allende ML, et al. S1P1 receptor directs the release of immature B cells from bone marrow into blood. J Exp Med. 2010;207:1113–24. doi: 10.1084/jem.20092210. [DOI] [PMC free article] [PubMed] [Google Scholar]
- 37.Amatruda JF, Zon LI. Dissecting hematopoiesis and disease using the zebrafish. Dev Biol. 1999;216:1–15. doi: 10.1006/dbio.1999.9462. [DOI] [PubMed] [Google Scholar]
- 38.Rivera J, Proia RL, Olivera A. The alliance of sphingosine-1-phosphate and its receptors in immunity. Nat Rev Immunol. 2008;8:753–63. doi: 10.1038/nri2400. [DOI] [PMC free article] [PubMed] [Google Scholar]
- 39.Allende ML, Dreier JL, Mandala S, Proia RL. Expression of the sphingosine 1-phosphate receptor, S1P1, on T-cells controls thymic emigration. J Biol Chem. 2004;279:15396–401. doi: 10.1074/jbc.M314291200. [DOI] [PubMed] [Google Scholar]
- 40.Matloubian M, et al. Lymphocyte egress from thymus and peripheral lymphoid organs is dependent on S1P receptor 1. Nature. 2004;427:355–60. doi: 10.1038/nature02284. [DOI] [PubMed] [Google Scholar]
- 41.Schwab SR, Cyster JG. Finding a way out: lymphocyte egress from lymphoid organs. Nat Immunol. 2007;8:1295–301. doi: 10.1038/ni1545. [DOI] [PubMed] [Google Scholar]
- 42.Golfier S, et al. Shaping of terminal megakaryocyte differentiation and proplatelet development by sphingosine-1-phosphate receptor S1P4. FASEB J. 2010;24:4701–10. doi: 10.1096/fj.09-141473. [DOI] [PubMed] [Google Scholar]
- 43.Schulze T, et al. Sphingosine-1-phospate receptor 4 (S1P(4)) deficiency profoundly affects dendritic cell function and TH17-cell differentiation in a murine model. FASEB J. 2011;25:4024–36. doi: 10.1096/fj.10-179028. [DOI] [PubMed] [Google Scholar]
- 44.Dillmann C, Mora J, Olesch C, Brune B, Weigert A. S1PR4 is required for plasmacytoid dendritic cell differentiation. Biol Chem. 2015 doi: 10.1515/hsz-2014-0271. [DOI] [PubMed] [Google Scholar]
- 45.Olivera A, et al. Sphingosine kinase 1 and sphingosine-1-phosphate receptor 2 are vital to recovery from anaphylactic shock in mice. J Clin Invest. 2010;120:1429–40. doi: 10.1172/JCI40659. [DOI] [PMC free article] [PubMed] [Google Scholar]
- 46.Eash KJ, Greenbaum AM, Gopalan PK, Link DC. CXCR2 and CXCR4 antagonistically regulate neutrophil trafficking from murine bone marrow. J Clin Invest. 2010;120:2423–31. doi: 10.1172/JCI41649. [DOI] [PMC free article] [PubMed] [Google Scholar]
- 47.Beck TC, Gomes AC, Cyster JG, Pereira JP. CXCR4 and a cell-extrinsic mechanism control immature B lymphocyte egress from bone marrow. J Exp Med. 2014;211:2567–81. doi: 10.1084/jem.20140457. [DOI] [PMC free article] [PubMed] [Google Scholar]
- 48.McEver RP, Moore KL, Cummings RD. Leukocyte trafficking mediated by selectin-carbohydrate interactions. J Biol Chem. 1995;270:11025–8. doi: 10.1074/jbc.270.19.11025. [DOI] [PubMed] [Google Scholar]
- 49.Ye Z, et al. ATP binding by monarch-1/NLRP12 is critical for its inhibitory function. Mol Cell Biol. 2008;28:1841–50. doi: 10.1128/MCB.01468-07. [DOI] [PMC free article] [PubMed] [Google Scholar]
- 50.Borghini S, et al. Clinical presentation and pathogenesis of cold-induced autoinflammatory disease in a family with recurrence of an NLRP12 mutation. Arthritis Rheum. 2011;63:830–9. doi: 10.1002/art.30170. [DOI] [PMC free article] [PubMed] [Google Scholar]
- 51.Landrum MJ, et al. ClinVar: public archive of relationships among sequence variation and human phenotype. Nucleic Acids Res. 2014;42:D980–5. doi: 10.1093/nar/gkt1113. [DOI] [PMC free article] [PubMed] [Google Scholar]
- 52.Arthur JC, et al. Cutting edge: NLRP12 controls dendritic and myeloid cell migration to affect contact hypersensitivity. J Immunol. 2010;185:4515–9. doi: 10.4049/jimmunol.1002227. [DOI] [PMC free article] [PubMed] [Google Scholar]
- 53.Gaffen SL. An overview of IL-17 function and signaling. Cytokine. 2008;43:402–7. doi: 10.1016/j.cyto.2008.07.017. [DOI] [PMC free article] [PubMed] [Google Scholar]
- 54.Butcher MJ, Gjurich BN, Phillips T, Galkina EV. The IL-17A/IL-17RA axis plays a proatherogenic role via the regulation of aortic myeloid cell recruitment. Circ Res. 2012;110:675–87. doi: 10.1161/CIRCRESAHA.111.261784. [DOI] [PMC free article] [PubMed] [Google Scholar]
- 55.Puel A, et al. Chronic mucocutaneous candidiasis in humans with inborn errors of interleukin-17 immunity. Science. 2011;332:65–8. doi: 10.1126/science.1200439. [DOI] [PMC free article] [PubMed] [Google Scholar]
- 56.Hashiguchi M, et al. IL-33 activates eosinophils of visceral adipose tissue both directly and via innate lymphoid cells. Eur J Immunol. 2015;45:876–85. doi: 10.1002/eji.201444969. [DOI] [PubMed] [Google Scholar]
- 57.Franke A, et al. Genome-wide meta-analysis increases to 71 the number of confirmed Crohn’s disease susceptibility loci. Nat Genet. 2010;42:1118–25. doi: 10.1038/ng.717. [DOI] [PMC free article] [PubMed] [Google Scholar]
- 58.Kouro T, Takatsu K. IL-5- and eosinophil-mediated inflammation: from discovery to therapy. Int Immunol. 2009;21:1303–9. doi: 10.1093/intimm/dxp102. [DOI] [PubMed] [Google Scholar]
- 59.Tin A, et al. Using multiple measures for quantitative trait association analyses: application to estimated glomerular filtration rate. J Hum Genet. 2013;58:461–6. doi: 10.1038/jhg.2013.23. [DOI] [PMC free article] [PubMed] [Google Scholar]
- 60.Li J, et al. Piezo1 integration of vascular architecture with physiological force. Nature. 2014;515:279–82. doi: 10.1038/nature13701. [DOI] [PMC free article] [PubMed] [Google Scholar]
- 61.Ranade SS, et al. Piezo1, a mechanically activated ion channel, is required for vascular development in mice. Proc Natl Acad Sci U S A. 2014;111:10347–52. doi: 10.1073/pnas.1409233111. [DOI] [PMC free article] [PubMed] [Google Scholar]
- 62.Peyronnet R, et al. Piezo1-dependent stretch-activated channels are inhibited by Polycystin-2 in renal tubular epithelial cells. EMBO Rep. 2013;14:1143–8. doi: 10.1038/embor.2013.170. [DOI] [PMC free article] [PubMed] [Google Scholar]
- 63.Miyamoto T, et al. Functional role for Piezo1 in stretch-evoked Ca(2)(+) influx and ATP release in urothelial cell cultures. J Biol Chem. 2014;289:16565–75. doi: 10.1074/jbc.M113.528638. [DOI] [PMC free article] [PubMed] [Google Scholar]
- 64.Brohawn SG, Su Z, MacKinnon R. Mechanosensitivity is mediated directly by the lipid membrane in TRAAK and TREK1 K+ channels. Proc Natl Acad Sci U S A. 2014;111:3614–9. doi: 10.1073/pnas.1320768111. [DOI] [PMC free article] [PubMed] [Google Scholar]
- 65.Sandberg MB, Nybo M, Birgens H, Frederiksen H. Hereditary xerocytosis and familial haemolysis due to mutation in the PIEZO1 gene: a simple diagnostic approach. Int J Lab Hematol. 2014;36:e62–5. doi: 10.1111/ijlh.12172. [DOI] [PubMed] [Google Scholar]
- 66.Yeo NC, et al. Shroom3 contributes to the maintenance of the glomerular filtration barrier integrity. Genome Res. 2015;25:57–65. doi: 10.1101/gr.182881.114. [DOI] [PMC free article] [PubMed] [Google Scholar]
- 67.Feliubadalo L, et al. Non-type I cystinuria caused by mutations in SLC7A9, encoding a subunit (bo,+AT) of rBAT. Nat Genet. 1999;23:52–7. doi: 10.1038/12652. [DOI] [PubMed] [Google Scholar]
- 68.Teslovich TM, et al. Biological, clinical and population relevance of 95 loci for blood lipids. Nature. 2010;466:707–13. doi: 10.1038/nature09270. [DOI] [PMC free article] [PubMed] [Google Scholar]
- 69.van den Berg JJ, et al. Increased n-3 polyunsaturated fatty acid content of red blood cells from fish oil-fed rabbits increases in vitro lipid peroxidation, but decreases hemolysis. Free Radic Biol Med. 1991;11:393–9. doi: 10.1016/0891-5849(91)90156-w. [DOI] [PubMed] [Google Scholar]
- 70.Waldron T, et al. c-Myb and its target Bmi1 are required for p190BCR/ABL leukemogenesis in mouse and human cells. Leukemia. 2012;26:644–53. doi: 10.1038/leu.2011.264. [DOI] [PMC free article] [PubMed] [Google Scholar]
- 71.Schunkert H, et al. Large-scale association analysis identifies 13 new susceptibility loci for coronary artery disease. Nat Genet. 2011;43:333–8. doi: 10.1038/ng.784. [DOI] [PMC free article] [PubMed] [Google Scholar]
- 72.Stahl EA, et al. Genome-wide association study meta-analysis identifies seven new rheumatoid arthritis risk loci. Nat Genet. 2010;42:508–14. doi: 10.1038/ng.582. [DOI] [PMC free article] [PubMed] [Google Scholar]
- 73.Levy D, et al. Genome-wide association study of blood pressure and hypertension. Nat Genet. 2009;41:677–87. doi: 10.1038/ng.384. [DOI] [PMC free article] [PubMed] [Google Scholar]
- 74.Shameer K, et al. A genome- and phenome-wide association study to identify genetic variants influencing platelet count and volume and their pleiotropic effects. Hum Genet. 2014;133:95–109. doi: 10.1007/s00439-013-1355-7. [DOI] [PMC free article] [PubMed] [Google Scholar]
- 75.Plagnol V, et al. Genome-wide association analysis of autoantibody positivity in type 1 diabetes cases. PLoS Genet. 2011;7:e1002216. doi: 10.1371/journal.pgen.1002216. [DOI] [PMC free article] [PubMed] [Google Scholar]
- 76.Dichgans M, et al. Shared genetic susceptibility to ischemic stroke and coronary artery disease: a genome-wide analysis of common variants. Stroke. 2014;45:24–36. doi: 10.1161/STROKEAHA.113.002707. [DOI] [PMC free article] [PubMed] [Google Scholar]
- 77.Psaty BM, et al. Cohorts for Heart and Aging Research in Genomic Epidemiology (CHARGE) Consortium: Design of prospective meta-analyses of genome-wide association studies from 5 cohorts. Circ Cardiovasc Genet. 2009;2:73–80. doi: 10.1161/CIRCGENETICS.108.829747. [DOI] [PMC free article] [PubMed] [Google Scholar]
- 78.Liu X, Jian X, Boerwinkle E. dbNSFP: a lightweight database of human nonsynonymous SNPs and their functional predictions. Hum Mutat. 2011;32:894–9. doi: 10.1002/humu.21517. [DOI] [PMC free article] [PubMed] [Google Scholar]
- 79.Liu X, Jian X, Boerwinkle E. dbNSFP v2.0: a database of human non-synonymous SNVs and their functional predictions and annotations. Hum Mutat. 2013;34:E2393–402. doi: 10.1002/humu.22376. [DOI] [PMC free article] [PubMed] [Google Scholar]
- 80.Grove ML, et al. Best practices and joint calling of the HumanExome BeadChip: the CHARGE Consortium. PLoS ONE. 2013;8:e68095. doi: 10.1371/journal.pone.0068095. [DOI] [PMC free article] [PubMed] [Google Scholar]
- 81.Li B, Leal SM. Methods for detecting associations with rare variants for common diseases: application to analysis of sequence data. Am J Hum Genet. 2008;83:311–21. doi: 10.1016/j.ajhg.2008.06.024. [DOI] [PMC free article] [PubMed] [Google Scholar]
- 82.Wu MC, et al. Rare-variant association testing for sequencing data with the sequence kernel association test. Am J Hum Genet. 2011;89:82–93. doi: 10.1016/j.ajhg.2011.05.029. [DOI] [PMC free article] [PubMed] [Google Scholar]
- 83.Johnson AD, et al. SNAP: a web-based tool for identification and annotation of proxy SNPs using HapMap. Bioinformatics. 2008;24:2938–9. doi: 10.1093/bioinformatics/btn564. [DOI] [PMC free article] [PubMed] [Google Scholar]
- 84.Bain BJ, England JM. Normal haematological values: sex difference in neutrophil count. Br Med J. 1975;1:306–9. doi: 10.1136/bmj.1.5953.306. [DOI] [PMC free article] [PubMed] [Google Scholar]
- 85.Bain BJ, England JM. Variations in leucocyte count during menstrual cycle. Br Med J. 1975;2:473–5. doi: 10.1136/bmj.2.5969.473. [DOI] [PMC free article] [PubMed] [Google Scholar]
Associated Data
This section collects any data citations, data availability statements, or supplementary materials included in this article.