Abstract
Stathmin (STMN1), a recognized oncoprotein upregulated in various solid tumors, promotes microtubule disassembly and modulates tumor growth and migration activity. However, the mechanisms underlying the genetic regulation of STMN1 have yet to be elucidated. In the current study, we report that thyroid hormone receptor (THR) expression is negatively correlated with STMN1 expression in a subset of clinical hepatocellular carcinoma (HCC) specimens. We further identified the STMN1 gene as a target of thyroid hormone (T3) in the HepG2 hepatoma cell line. An analysis of STMN1 expression profile and mechanism of transcriptional regulation revealed that T3 significantly suppressed STMN1 mRNA and protein expression, and further showed that THR directly targeted the STMN1 upstream element to regulate STMN1 transcriptional activity. Specific knockdown of STMN1 suppressed cell proliferation and xenograft tumor growth in mice. In addition, T3 regulation of cell growth arrest and cell cycle distribution were attenuated by overexpression of STMN1. Our results suggest that the oncogene STMN1 is transcriptionally downregulated by T3 in the liver. This T3-mediated suppression of STMN1 supports the theory that T3 plays an inhibitory role in HCC tumor growth, and suggests that the lack of normal THR function leads to elevated STMN1 expression and malignant growth.
Thyroxine, also known as 3,3′,5-triiodo-L-thyronine (T3), mediates numerous physiological processes, including ontogenesis, cell growth, cellular differentiation and metabolism, in nearly all mammalian tissues. The biological activity of T3 relies on binding to nuclear thyroid hormone receptors (THRs) belonging to the ligand-dependent transcriptional factor family, which maintain homeostasis by modulating expression levels of various genes. Two human THR genes, TRα (THRA) and TRβ (THRB), are located on human chromosomes 17 and 3, respectively1. Different isoforms of THR (TRα1, TRα2/TRβ1 and TRβ2) are generated by alternative RNA splicing or multiple promoter usage2. Moreover, THRs usually interact with retinoid X receptor (RXR) to form heterodimers that bind to thyroid hormone response elements (TREs) within the promoter regions or introns of target genes to regulate their transcriptional activity3.
Disorders of the thyroid gland are increasingly common endocrine diseases4. The lack of T3 causes goiter and metabolic syndromes, such as mental retardation5. The liver expresses equal amounts of THRA and THRB, implying that T3 regulates gene expression through transactivation6. To date, several studies have confirmed that hypothyroidism triggers hyperlipidemia, obesity and non-alcoholic steatohepatitis, the latter of which progresses to liver cirrhosis and hepatocellular carcinoma (HCC) development7,8. A significantly increased risk of HCC development (up to 2–3 fold) has been reported in human adults with hypothyroidism9. Moreover, studies on patients with chronic hepatitis C virus infection have suggested a correlation between lower T3 levels and thyroid papillary cancer10,11. Notably, chemical-induced liver cancer in rats was shown to be markedly reduced in the presence of T312. These findings suggest a significant association of T3 malfunction and impaired liver function with the pathogenesis of cancer.
Analogously, aberrant THR expression or mutations have been reported in cases of severe resistance to thyroid hormone and are associated with developmental disease and cancer progression. Genetic mutations in THRA and THRB were detected in 65% and 76% of HCCs, respectively13. A characterization of mutant THRs in the J7 human hepatocellular carcinoma cell line revealed that mutated THRA binds TREs, but not T3, indicative of dominant-negative activity14,15. THRs play an important role in tumor progression, as evidenced by their aberrant expression and mutation in other human cancers, including pituitary tumors, thyroid papillary cancer and renal clear-cell carcinomas16,17,18,19. Transgenic mice harboring a THRB mutation (THRBpv/pv) isolated from patients with thyroid hormone resistance exhibit spontaneous induction of metastatic thyroid carcinomas20. Loss of functional THRs in mice leads to the development of follicular thyroid cancer and metastases in the lung21. Moreover, THRB overexpression potently represses tumor metastasis22. These findings collectively suggest that loss of normal regulation of THRs enhances tumor progression, supporting a tumor-suppressor function of these receptors. Conversely, however, other studies have indicated that THRs enhance tumor progression. For instance, T3 has been reported to stimulate the proliferation of various cancer cell types, including pituitary-derived cancer, breast cancer, prostate cancer, and glioma23,24,25,26. Previous experiments by our group showed that T3 suppresses hepatoma cell growth by prolonging the G0/G1 phase while inducing cell migration in association with enhanced matrix metallopeptidase (MMP) activity27,28. Thus, the complex roles of T3/THR in tumorigenesis appear to reflect distinct, tissue-specific genetic backgrounds and definitions of oncogenic roles. The details of the regulatory mechanisms involved in these oncogenic processes remain to be established.
Stathmin (STMN1, also known as oncoprotein 18 [OP18]) is a 149-amino-acid, cytosolic protein that is highly conserved among vertebrates29,30. STMN1 is highly expressed in various cancers and has been characterized as an oncogenic protein31. The predominant molecular function of STMN1 is regulation of microtubule dynamics. The phosphorylated C-terminal domain of STMN1 physically interacts with unpolymerized tubulin dimers, influencing the dynamics of microtubule formation32,33. STMN1 prevents assembly and promotes disassembly of microtubules, thus participating in microtubule-related cellular functions, such as cell proliferation and migration. STMN1 is downregulated by p53 and regulates cell cycle arrest at the G2/M and G1/S checkpoints34,35. Moreover, STMN1 interacts with p27 and Cdk2/Cdk5, leading to enhanced protein phosphorylation and consequent tubulin stabilization and inhibition of cell migration36. These findings support a crucial role of STMN1 in cancer growth and mobility.
Accumulating evidence suggests that STMN1 regulates microtubulin assembly and consequently tumorigenesis, but the mechanisms underlying the regulation of STMN1 gene expression remain unknown. Here, we found that THR and STMN1 are negatively correlated at RNA and protein levels in clinical specimens. We further determined that STMN1 expression was markedly repressed by T3 at the transcriptional level. Moreover, cell growth was inhibited by STMN1 depletion as well as T3 treatment, confirming that T3 plays a role in suppression of tumor growth.
Results
Negative correlation of THRA and STMN1 expression in clinical liver cancer specimens
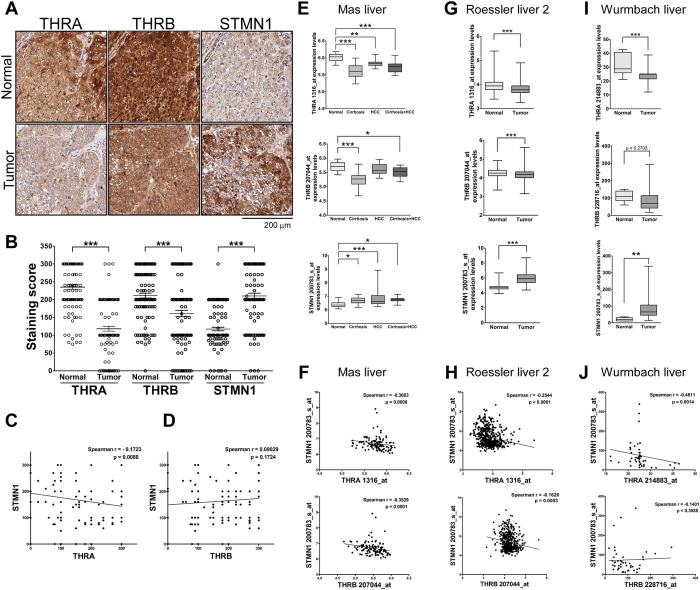
Previous studies have reported THR-mediated suppression of cell proliferation28 and loss of THR expression in clinical samples of HCC37,38. In contrast, several lines of evidence indicate that STMN1 is upregulated in cancers31. To gain insight into the biological significance of these expression patterns, we compared the relative abundance of THR isoforms (THRA, THRB) and STMN1 proteins in clinical HCC specimens (Fig. 1A). Immunohistochemical findings revealed that expression of THRs was markedly decreased in tumor specimens, whereas STMN1 levels were enhanced (Fig. 1B). Moreover, expression of THRA, but not THRB, was negatively correlated with that of STMN1 in patients (Fig. 1C and D). To further clarify the negative correlation between specific THR isoforms and STMN1, we analyzed three public datasets from Oncomine (Fig. 1E–J). Notably, THRA and THRB mRNA expression were decreased, whereas expression of STMN1 was enhanced, in tumor specimens (Fig. 1E,G and I). Importantly, the negative correlation between STMN1 and THRA was stronger than that between STMN1 and THRB (Fig. 1F,H and J).
Figure 1. Negative correlation of thyroid hormone receptor and STMN1 expression levels in clinical HCCs.
(A) Immunohistochemical staining of THR and STMN1 in normal livers (N = 115) and HCCs (N = 115). Staining score were compared and plotted in (B). (C,D) Correlations of THRs and STMN1 expression levels were analyzed and indicated. (THRA vs. STMN1, Spearman r = −0.1723; 95% CI, −0.2986 to −0.04003; p = 0.0088. THRB vs. STMN1, Spearman r = 0.09029; 95% CI, −0.04341 to 0.2208; p = 0.1724). (E–J) THRA, THRB and STMN1 mRNA expression levels in three public liver cancer datasets from Oncomine were analyzed. (E,F Mas Liver, N = 115; G,H Roessler liver 2, N = 488; I,J Wurmbach liver, N = 75, respectively) (***P < 0.001; **P < 0.01, *P < 0.05). Error bars, s.e.m.
T3 suppresses STMN1 expression in HepG2 cell lines
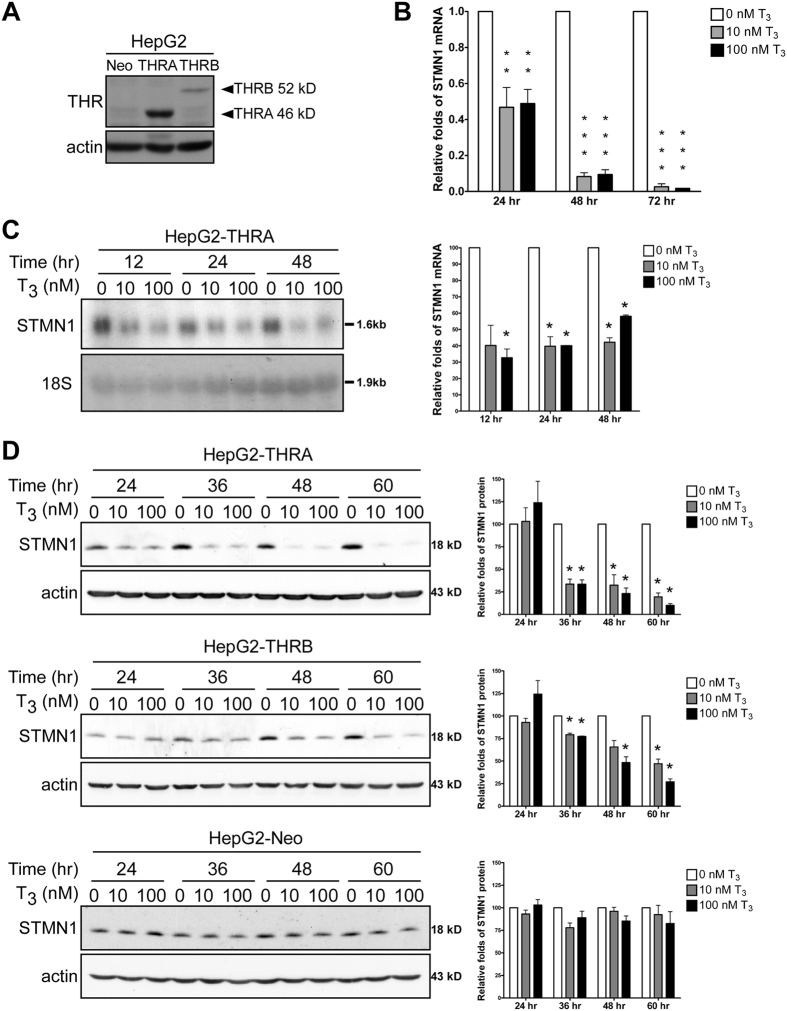
Next, we overexpressed THRA in HepG2 cells, which express low levels of endogenous THRs (Fig. 2A and S1A). We then verified suppression of STMN1 mRNA expression by T3 in THRA-overexpressing HepG2 cells using quantitative reverse transcription-polymerase chain reaction (qRT-PCR) (Fig. 2B, S1B and S1C). After 72 h in the presence of T3, STMN1 mRNA levels were less than 10% of control levels (fold-repression values were normalized to those in the absence of T3 at each time point). The effects of T3 on endogenous STMN1 mRNA levels in THRA-overexpressing cells were further analyzed by Northern blotting, which confirmed that STMN1 mRNA levels were repressed by T3 (Fig. 2C, right panel). Of note, qRT-PCR analysis shows higher sensitivity that STMN1 mRNA levels have been reduced to 20% in 48 h. Next, we examined whether T3 exerts an inhibitory effect on STMN1 protein expression. Immunoblot analyses revealed that STMN1 protein was markedly suppressed by T3 in cells ectopically expressing THR compared with that in cells devoid of THR (Fig. 2D; -THRA, -THRB and empty vector-Neo, Supplementary Fig. S1D and E; -THRA and empty vector-Neo, respectively). These data collectively demonstrate that T3 suppresses STMN1 mRNA and protein expression in a concentration- and THR-dependent manner.
Figure 2. T3 represses STMN1 expression in HepG2 cell lines.
(A) THR protein expression levels in HepG2 control and THR overexpressing cell lines. (B) qRT-PCR of STMN1 mRNA expression levels in HepG2-THRA cells (**P < 0.01, ***P < 0.001, n = 3). (C) Northern blots of HepG2-THRA cell RNAs. (*P < 0.03, n = 2). (D) Immunoblots of HepG2-THRA, HepG2-THRB and HepG2-Neo cell lysates (*P < 0.03, n = 3). Error bars, s.e.m. Electrophoretic gels and blots in each experiment were conducted under the same experimental conditions, and images were cropped.
T3 represses STMN1 expression at the transcriptional level
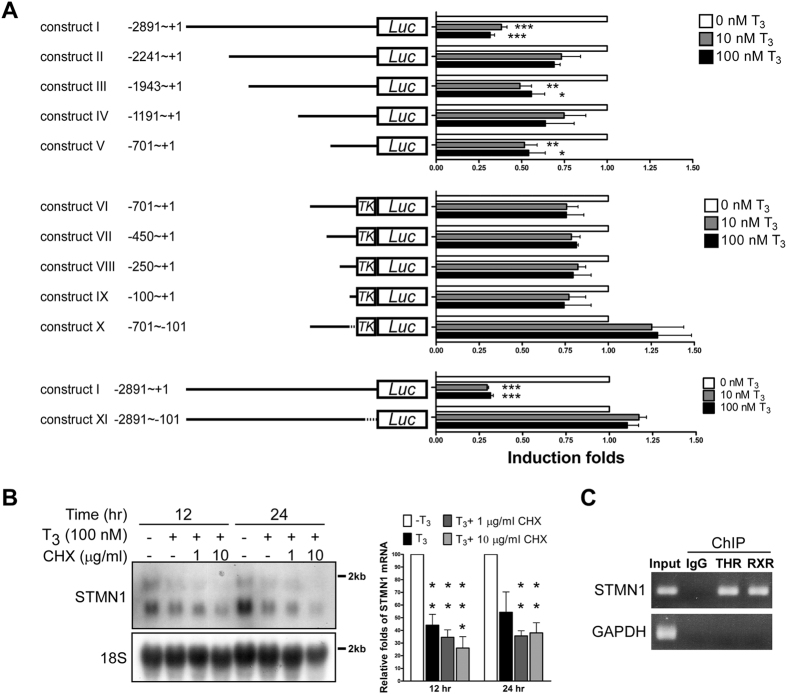
Next, we determined whether the repression of STMN1 gene expression by T3 is attributable to THR-mediated transcriptional regulation. To this end, we created a promoter-luciferase reporter construct by cloning a 3-kb genome sequence upstream of the STMN1 start codon into a pGL3-Luc vector and performed luciferase assays. As shown in Fig. 3A, the 3-kb upstream region (construct I, positions −2891 to +1) was involved in mediating T3-induced repressive activity (Fig. 3A, upper panel). A serial deletion analysis of the STMN1 promoter further revealed that the −701 to +1 fragment contains the element responsible for T3 suppression of STMN1 transcription (Fig. 3A, construct V). Further deletion impaired STMN1 promoter activity, suggesting that these additionally deleted regions might be responsible for native RNA polymerase II recognition (Supplementary Fig. S2). Accordingly, the −701 to +1 region and serially truncated fragments were subcloned into a pA3tk-Luc vector containing a minimum thymidine kinase promoter to provide basal transcriptional activity (Fig. 3A, constructs VI–X). The transcriptional activity of −100 to +1 as well as −701 to +1 regions was suppressed by T3 (constructs VI and IX, respectively). Furthermore, T3 suppression of transcriptional activity was blunted in the absence of the −100 to +1 fragment (Fig. 3A, construct X, −701 to −101, and construct XI, −2891 to −101). Collectively, these data indicate that a suppressive TRE is present upstream of the STMN1 start codon and mediates negative regulation of STMN1 transcription by T3.
Figure 3. Thyroid hormone receptor represses STMN1 in HepG2 cell at the transcription level directly.
(A) Schematic representation of the STMN1 promoter (+1, translation start site). A serial deletion fragments of STMN1 5′-flanking DNA were cloned into pGL3 (construct I~V, XI) or pGL3tk-luc (construct VI~X) reporter plasmids, as indicated. The T3 repression folds were presented as mean values ± s.e.m. (n = 3). (B) HepG2-THRA was incubated for 12–24 h with 0 to 10 μg/ml cycloheximide (CHX) in the absence or presence of T3, after which total RNA was isolated and sequentially analyzed by Northern blot. (n = 3, Error bars, s.e.m.). (C) ChIP assay of STMN1 5′-flanking region (−101~+1). The promoter region of GAPDH was used as the negative control. Electrophoretic gels and blots in each experiment were conducted under the same experimental conditions, and images were cropped.
Since THRs act as nuclear transcription regulators, we examined whether THR directly targets the STMN1 promoter to downregulate STMN1 transcription. Experiments using the protein synthesis inhibitor, cycloheximide (CHX), showed that STMN1 mRNA levels remained suppressed upon T3 treatment in the absence of de novo protein synthesis (Fig. 3B). Quantification of these results revealed that co-treatment with CHX suppressed STMN1 mRNA levels to an extent similar to that of T3 treatment alone (Fig. 3B, right panel). These data imply that THR regulates the STMN1 promoter directly and not through an intermediate transcription factor. If this were not the case, the intermediate transcription factor protein should be inhibited by CHX, resulting in impaired T3 repression of STMN1 expression. To validate specific THR binding to the STMN1 genome, we performed chromatin immunoprecipitation (ChIP) assays. These assays revealed a THR-associated signal in the upstream element (positions −101 to +1) of STMN1 (Fig. 3C, lane 3; compare to IgG control in lane 2). This fragment was additionally pulled down by RXR, which dimerizes with THR (Fig. 3C, lane 4), suggesting that THR and RXR co-bind this sequence to exert repressive activity. On the basis of these findings, we suggest that THR physically binds this upstream element, leading to suppression of STMN1 transcription by T3. Furthermore, in view of previous and present results, we speculate that STMN1 is negatively regulated by T3; thus, its expression levels are elevated in THR-deficient HCCs.
Depletion of STMN1 in J7 cells suppresses cell proliferation
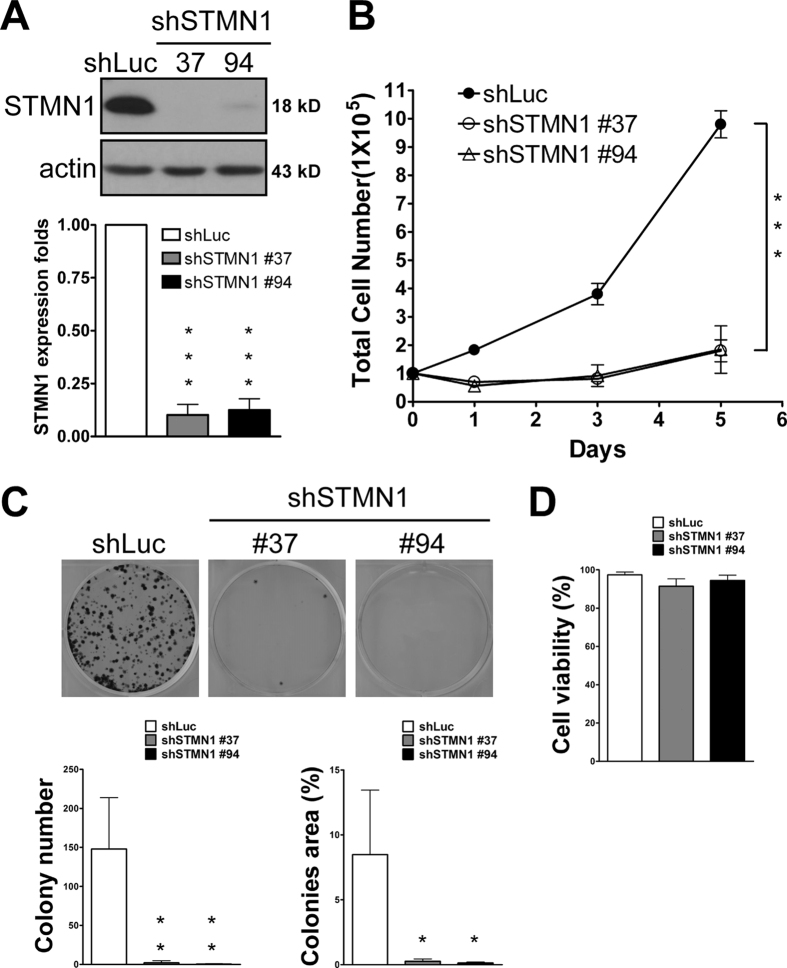
We further examined the effects of STMN1 knockdown on cell growth. Because HepG2 cells are inadequate for tumor xenograft models, we chose J7 cells for proliferation assays and xenograft transplantation. Silencing of STMN1 in J7 cells by transduction with a lentivirus expressing small hairpin RNA (shRNA; clones #37 and #94) against STIMN1 led to marked suppression of STMN1 expression and growth of J7 liver cells compared with cells transduced with control lentivirus shRNA targeting firefly luciferase (Fig. 4A and B). Only a few colonies were detected in colony-formation assays (Fig. 4C). In contrast, cell viability was not significantly reduced by knockdown of STMN1 (Fig. 4D).
Figure 4. Knockdown of STMN1 in J7 represses cell proliferation.
(A) Immunoblots of J7 knockdown STMN1 (shSTMN1) and cognate control (shLuc) cells. Repressed protein levels were indicated. (B) For proliferation assay, 1*105 cells were seeded in 6-well plate. At the indicated day, cells were trypsinized and counted. (C) For colony formation assay, 2*103 cells were seeded in 6-well plate for 14 days. (D) Trypan blue staining of viable cell was examined. (***P < 0.001; **P < 0.01; *P < 0.05 n = 3). Error bars, s.e.m. Gel electrophoresis was conducted under the same experimental conditions, and images of blots were cropped.
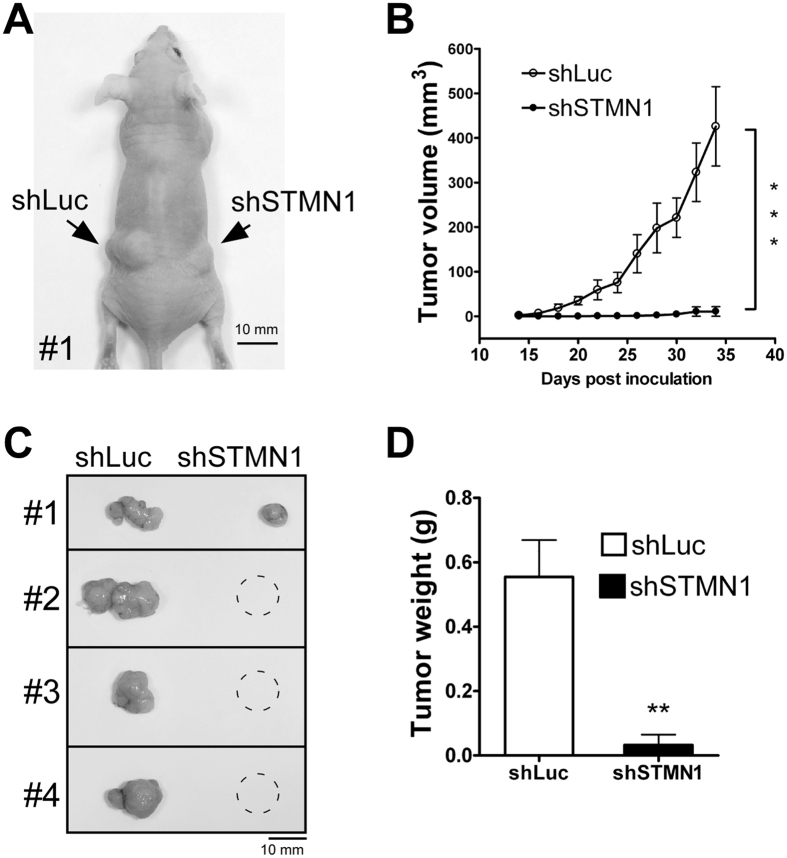
These findings indicate that STMN1 depletion significantly reduces cell growth. To confirm this phenomenon, we established a heterotopic xenograft model to test tumorigenesis potential in vivo. STMN1-knockdown cells and parental control cells were transplanted in parallel in the dorsal skin of nude mice (Fig. 5A). Notably, tumor growth was largely reduced in regions containing STMN1-knockdown cells, but was maintained in regions containing shLuc control cells (Fig. 5B,C and D; n = 4), suggesting that STMN1 is crucial for tumor cell growth.
Figure 5. Knockdown of STMN1 in J7 represses xenograft tumor growth.
(A) Subcutaneous injection of J7-shSTMN1 cells in nude mice. J7-shSTMN1 was generated from the pooled lentivirus (shSTMN1#37 and shSTMN1#94, 1:1). Briefly, 1*106 cells were suspended in 150 μl of PBS and injected into dorsal skin of mice. Two weeks later, visible tumor size was measured for 3 weeks (B). The mice were finally sacrificed at 5 weeks, and xenograft tumors were dissected (C) and weighed (D) (***P < 0.001; **P < 0.01 n = 4). Error bars, s.e.m.
STMN1 knockdown causes cell cycle redistribution
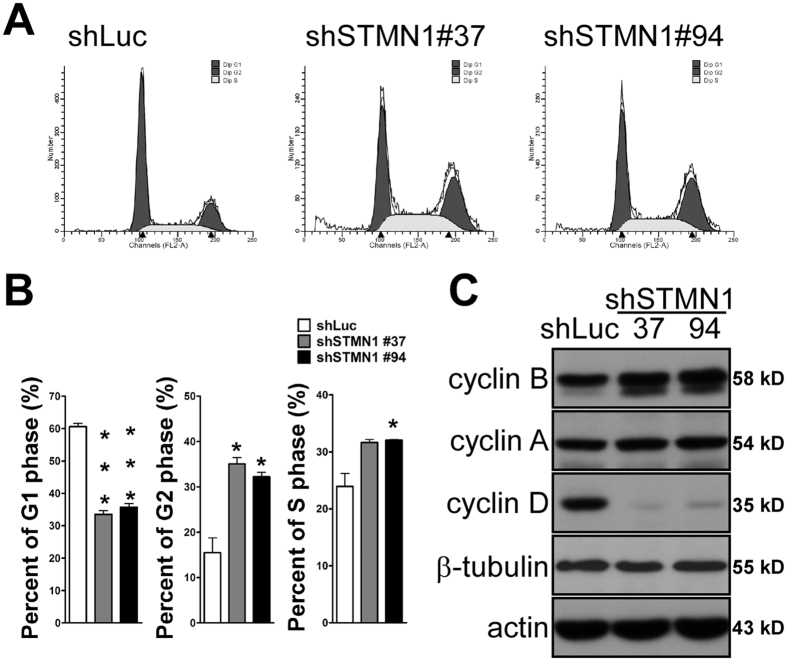
To further investigate the molecular mechanism underlying STMN1-regulated cell growth, we analyzed the cell cycle distribution of parental and STMN1-knockdown J7 cells. Flow cytometry analyses indicated that the G2/M phase population was expanded in STMN1-knockdown cells, whereas the G1 phase population was reduced (Fig. 6A). Quantification of these results confirmed a 2-fold increase in the G2/M population in STMN1-knockdown cells compared with the Luc-knockdown control group (Fig. 6B). Moreover, STMN1 depletion was accompanied by increased levels of cyclin B and decreased levels of cyclin D, which modulate cell-cycle progression (Fig. 6C). These findings provide evidence for changes in cell-cycle progression upon suppression of STMN1 expression. Accordingly, we speculate that G2/M phase progression is retarded by knockdown of STMN1, leading to reduced cell proliferation.
Figure 6. Cell cycle was redistributed in the knockdown of STMN1.
(A) J7-shSTMN1 and control cells were grown to desired confluence. Cells were then trypsinized, fixed and stained with PI. DNA contents were analyzed by flow cytometry. Percent of cell cycle distributions were presented in (B). Error bars, s.e.m. (n = 3). (C) Immunoblots of J7-shSTMN1 and J7-shLuc cells. Gel electrophoresis was conducted under the same experimental conditions, and images of blots were cropped. Uncropped blot images are shown in Supplementary Fig. S3A.
T3-mediated suppression of STMN1 contributes to cell growth arrest
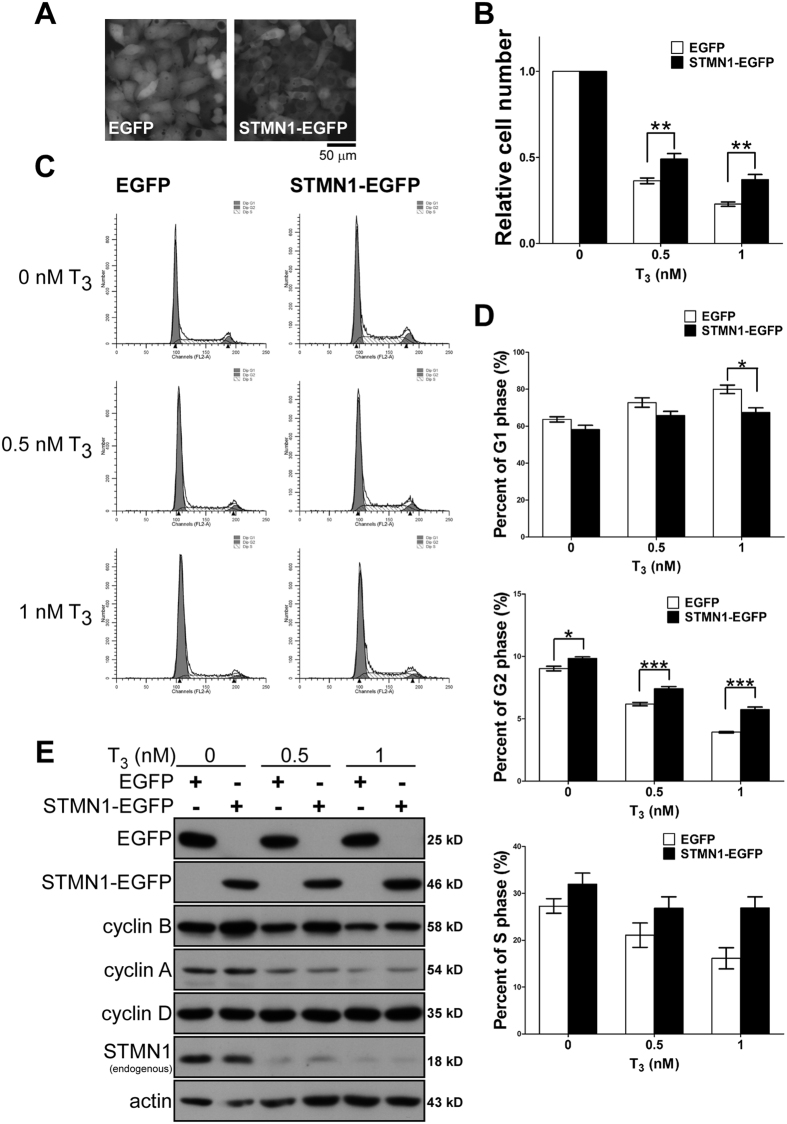
To further investigate the relevance of STMN1 in T3-mediated repression of cell growth, we restored STMN1 levels in HepG2-THRA cells by stably expressing STMN1-EGFP (Fig. 7A). T3 repressed cell growth through an increase in the G1 phase population and a reduction in the G2/S phase population (Fig. 7B–D); it also suppressed both cyclin B and cyclin A protein levels (Fig. 7E). In contrast, ectopic expression of STMN1 increased cell growth and expanded the G2 phase population in the presence of T3, and reduced the G1 phase population and caused accumulation of cyclin B (Fig. 7B–E). These data further confirm that STMN1 is involved in T3-induced cell growth arrest.
Figure 7. Overexpression of STMN1 attenuates T3-suppressed cell growth.
(A) Fluorescent image of stable expressing STMN1-GFP fusion protein in HepG2-THRA cell. (B) Cell growth in the absent or present of T3 for 4 days were analyzed. The relative folds of T3-suppressed growth of each individual clone were normalized by 0 nM T3. (C) The STMN1 overexpressing and control cells were analyzed by flow cytometry. Percent of cell cycle distributions were presented in (D). (***P < 0.001; **P < 0.01; *P < 0.05 n = 3). Error bars, s.e.m. (E) Immunoblots of STMN1-EGFP and EGFP stable expressing cells in the absent or present of 4 days T3 treatment. Gel electrophoresis was conducted under the same experimental conditions, and images of blots were cropped. Uncropped blot images are shown in Supplementary Fig. S3B.
We conclude that STMN1, an essential protein for tumorigenic growth and cell-cycle progression, is inhibited by T3 at the transcriptional level, reflecting the negative correlation between the expression patterns of these proteins in clinical liver cancer specimens.
Discussion
The present study confirmed that STMN1 is highly expressed in clinical HCC samples39. Our results further indicate that THR down-regulates STMN1 expression and show that its expression is negatively correlated with that of STMN1 in HCC, supporting the role of THR as a tumor suppressor. These results also establish THR as a new transcriptional regulator of STMN1 gene expression. Notably, previous reports have indicated that both T3 treatment and STMN1 knockdown suppress cell growth28,39,40. However, the opposite changes in the cell cycle distribution caused by T3 treatment and STMN1 knockdown reveal differential regulation by these two interventions. We speculate that T3 treatment reduces the proliferation rate by causing accumulation of cells in G1 phase. By contrast, STMN1-knockdown cells lack normal microtubule turnover, leading to retardation in G2/M phase progression. This finding is in accord with previous reports41,42. However, G1 arrest has also been observed in STMN1-depleted gastric tumor cell lines43. These inconsistencies in cell cycle regulation reflect the different mechanisms of tumor proliferation in which STMN1 participates44. Our molecular evidence further revealed the cyclin B protein is elevated by STMN1 knockdown, whereas cyclin D is repressed. STMN1 rescue experiments designed clarify the role of STMN1 in T3-induced cell growth arrest confirmed that STMN1 partially restores T3 effects on cell growth, cell-cycle redistribution and expression of cyclins. These data also suggest that T3 acts at least in part through STMN1 to repress cell proliferation. However, the detailed molecular mechanism remains to be elucidated.
A previous investigation showed that, in normal liver subjected to partial hepatectomy, STMN1 expression is elevated in proliferating hepatocytes, but is silenced in resting hepatocytes, leading to the proposal that STMN1 expression is reversible and participates in tissue-specific proliferation–differentiation switching45. Other studies have revealed an oncogenic role of STMN1 based on its expression profiles in patients or effects of manipulating its expression on cellular tumorigenicity39,40,46. Silencing of STMN1 expression in the HCC cell line, HCCLM3, was shown to significantly reduce cell proliferation, adhesion and invasion, and trigger apoptosis40. Exogenous expression of E2F1 and the transcription factor DP-1 (TFDP1) has been shown to induce STMN1 mRNA expression46. Moreover, overexpression of STMN1 results in microtubule disassembly and is associated with formation of binucleated cells39. These data collectively indicate that THR-mediated suppression of STMN1 is required for normal liver maintenance. Impairment of this process may lead to constitutive STNM1 expression, and consequently, hepatic carcinogenesis.
T3 actions also extend to microtubules—the major cytoskeletal targets of STMN1—which are essential for internal vesicle transport and nervous system differentiation. Several studies have revealed that T3 regulates microtubule organization and is involved in microtubule-associated cell physiology47,48. Specifically, the rate of microtubule assembly in vitro is reduced in hypothyroid rats and restored upon administration of physiological levels of T347. Notably, experiments using granulosa cells have shown that T3 dramatically reduces the effects of paclitaxel, a microtubule inhibitor used for disruption of mitotic microtubule assembly and cancer therapy48. Considered in this context, our observations suggest that T3 might regulate microtubule network assembly through repression of STMN1 expression.
Conclusions
In summary, we have provided evidence that T3 suppresses proliferation via transcriptional regulation of STMN1 expression. Moreover, T3-regulated STMN1 expression may be associated with HCC malignancy.
Materials and Methods
Cell culture
Human HCC cell lines were cultured in Dulbecco’s modified Eagle’s medium supplemented with 10% (v/v) fetal bovine serum at 37 °C in a humidified 5% CO2 incubator. T3-depleted serum was prepared as described previously49. Briefly, an aliquot of serum (50 ml) was incubated with 2.2 g AG 1-X8 resin that had been washed three times with distilled, deionized water (15 min each), pelleted by brief centrifugation, and sterilized by autoclaving. T3 was depleted three times for at least 5 h each and filtered using a 0.22-μm filter.
qRT-PCR
Total RNA was extracted using TRIzol (Invitrogen, 10296-028), as described previously50. cDNA was generated from 4 μg of purified total RNA using the SuperscriptIII kit for RT-PCR (Invitrogen). qRT-PCR was performed in a 15-μl reaction mixture containing 50 nM forward and reverse primers, 1× SYBR Green reaction mix (Applied Biosystems, 4309155) and 48 μg template, according to a previously described protocol50. The sequences of forward (q-STMN1-F) and reverse (q-STMN1-R) primers used were 5′-GTG GTC AGG CGG CTC GGA CTG-3′ and 5′-CTC TCG TTT CTC AGC CAG CTG C-3′, respectively.
Northern blotting
Cellular RNA was denatured by heating at 75 °C for 15 min and then chilled on ice for 5 min. Denatured RNAs were resolved on a 1.2% agarose gel and transferred to a nylon membrane (Amersham Bioscience, UK) overnight. The membrane was cross-linked and blocked by prehybridization in the presence of 250 μg/ml single-strand DNA for at least 8 h. α-32P-dCTP* was incorporated into the STMN1 probe by PCR. The sequences of forward (STMN1-F) and reverse (STMN1-R) primers used were 5′-ATG GCT TCT TCT GAT ATC-3′ and 5′-TTA GTC AGC TTC AGT CTC-3′, respectively. The membrane was incubated with radiolabeled probe at 42 °C for 18 h. After a brief wash, the remaining isotope signal was detected with X-ray film (Amersham Bioscience).
Immunohistochemical staining
Tumor tissue microarrays were purchased from Taiwan Liver Cancer Network (TCLN) and constructed to contain 115 normal liver tissues and 115 hepatocellular carcinoma samples. The staining score (Quick score) was calculated using the following formula:
 |
Staining intensity was rate on a 0 to 3 scale, where 0 is negative, 1 is weak, 2 is moderate and 3 is strong; the area percentage reflects the degree of positive staining51. This study was approved by the Institutional Review Board of Chang Gung Medical Center Human Ethics Committee (IRB No: 99-3588B). The study subjects provided written informed consent, and all methods were carried out in accordance with the approved guidelines.
SDS-PAGE and immunoblot analysis
Total cell extracts were purified as described previously50. Equal amounts of protein were resolved by sodium dodecyl sulfate-polyacrylamide gel electrophoresis (SDS-PAGE) and transferred to a PVDF (polyvinylidene difluoride) membrane using a semi-dry transfer system. The membrane was blocked by incubating with 5% non-fat milk dissolved in phosphate-buffered saline containing 0.1% Tween-20 (PBST) for 1 h, and then was incubated with the appropriately diluted primary antibody at 4 °C overnight. After washing with PBST, the membrane was incubated with the appropriate secondary antibody for 2 h at room temperature. Immune complexes were developed by chemiluminescence using an enhanced chemiluminescence (ECL) detection kit (Amersham, RPN2232)50.
Antibodies and reagents
The following antibodies and reagents were used: rabbit polyclonal anti-STMN1 (Calbiochem, 569391), rabbit polyclonal anti-THRA (GeneTex, GTX25621), mouse monoclonal anti-THRB (Santa Cruz, SC-737), mouse monoclonal anti-β-actin (Chemicon, MAB1501R), rabbit monoclonal anti-cyclin B1 (Abcam, ab32053), rabbit monoclonal anti-cyclin A (Abcam, ab185619), rabbit monoclonal anti-cyclin D1 (Epitomics, 4202-1), mouse monoclonal anti-β-tubulin (Chemicon, MAB3408), AG 1-X8 resin (Bio-Rad, 140-1451), T3 (Sigma-Aldrich, T2752), and cycloheximide (Sigma-Aldrich, C7698). Mouse monoclonal anti-THR (C4) was a gift from Sheue-yann Cheng (National Cancer Institute).
Plasmid construction
Constructs containing potential THR-regulated sites of the STMN1 promoter were generated by PCR-amplification of an upstream region of the STMN1 gene corresponding to nucleotides −2891 to +1 (where +1 corresponds to the AUG initiation site) and serially deleted fragments, and subcloning them into pGL3-Luc or pA3tk-Luc plasmids. The primer sequences and restriction sites used were as follows:
STMN1(−2891)-KpnI-F: 5′-AAATAAGGTACCTCAAAGCAGGTGTCTTGGTG-3′, STMN1(−2241)-KpnI-F: 5′-AAATAAGGTACCGTCTTAGGCACCCATGTGGG-3′, STMN1(−1943)-KpnI-F: 5′-AAATAAGGTACCCATTGTCCTCCTGCCCTCCG-3′, STMN1(−1191)-KpnI-F: 5′-AAATAAGGTACCAGCTTGGGTGGCGGCAGGTT-3′, STMN1(−701)-KpnI-F: 5′-AAATAAGGTACCGGTACTAGCTGGCGTCTACA-3′, STMN1(−450)-KpnI-F: 5′-AAATAAGGTACCCAATGAGTTGTAGGCAGTAT-3′, STMN1(−250)-KpnI-F: 5′-AAATAAGGTACCATATTCAGGTCATATTTCCC-3′, STMN1(−100)-KpnI-F: 5′-ATAAGGTACCAAAGAAAGTGATTGCATGTTTT-3′, STMN1(+1)-NheI-R: 5′-ACTATCGCTAGCTGGTGAATAGAAGACAAGCG-3′, STMN1(−101)-NheI-R: 5′-ACTATCGCTAGCGCCTTTCTATATGTCAT-3′.
The STMN1-EGFP fusion plasmid was generated by first PCR-amplifying STMN1 fragments and enhanced green fluorescent protein (EGFP) using primer pairs with the indicated sequences and incorporated restriction sites:
STMN1-BamHI-F, 5′-AAT CGG ATC CAT GGC TTC TTC TGA TAT CCA GG-3′ (forward) and STMN1-EGFP-R, 5′-CCC TTG CTC ACC ATG TCA GCT TCA GTC TCG TCA GCA G-3′ (reverse); and EGFP-STMN1-F, 5′-CTG CTG ACG AGA CTG AAG CTG ACA TGG TGA GCA AGG G-3′ (forward) and EGFP-HindIII-R, 5′-GAT CAA GCT TTT ACT TGT ACA GCT CGT CCA TG-3′ (reverse).
STMN1-EGFP was conjugated by mixing the two PCR products and performing a further extension step, followed by subcloning into the pcDNA3.1/Hygro plasmid.
Promoter-reporter and ChIP assays
HepG2-THRA cells were transfected overnight with STMN1 promoter vectors using the TurboFect reagent (Thermo Fisher Scientific, R0531). Transfected cells were incubated in the presence or absence of T3 for an additional 48 h. After treatment, cells were lysed for the detection of firefly luciferase activity (Promega, E1960).
ChIP assays were performed as described previously52. Briefly, HepG2-THRA cells were fixed to cross-link DNA-protein complexes, and sonicated on ice to obtain bulk DNA fragments with a size range of ~200–400 bp. THR- or RXRA-binding DNA was immunoprecipitated with the corresponding antibody, and complex crosslinking was reversed by heating at 65 °C overnight. Targeted elements were detected by amplifying purified DNA fragments using primer pairs specific for the STMN1 TRE. The glyceraldehyde 3-phosphate dehydrogenase (GAPDH) promoter region was used as a negative control. The following primer pairs were employed to detect specific promoter regions: ChIP-STMN1-F, 5′-AAA GAA AGT GAT TGC ATG TTT TTG AAA ATC-3′ (STMN1 forward) and ChIP-STMN1-R, 5′-TGG TGA ATA GAA GAC AAG CGA CAG-3′ (STMN1 reverse); ChIP-GAPDH-F, 5′-CAA GGC TGA GAA CGG GAA GC-3’ (GAPDH forward) and ChIP-GAPDH-R, 5′-AGG GGG CAG AGA TGA TGA CC-3′ (GAPDH reverse).
Knockdown and overexpression of STMN1
For knockdown of endogenous STMN1, J7 cells were infected with lentivirus expressing shRNA targeting STMN1. The pLKO.1 shLuc (control) and pLKO.1 shSTMN1 expression vectors were obtained from the National RNA Interference Core Facility (Institute of Molecular Biology, Academia Sinica, Taipei, Taiwan). Clones TRCN0000072243 and TRCN0000160037 correspond to shLuc and shSTMN1, respectively. For overexpression of STMN1, HepG2-THRA cells were transfected with an STMN1-EGFP expression plasmid. EGFP-positive cells were further enriched by flow cytometry.
Proliferation and colony-formation assays
For analysis of cell proliferation, 1 × 10⁵ cells were seeded in wells of a 6-well plate. Viable cells were trypsinized and counted on the indicated days. Colony-formation activity was analyzed by seeding 2 × 10³ cells in 6-well plates for 14 d. After incubating for 2 weeks, colonies were fixed and stained with crystal violet. Colony numbers and occupied areas were scanned and measured using ImageJ software.
Murine tumor-progression model
SCID mice were used to assess the in vivo growth potential of J7-shSTMN1-derived tumors. Briefly, J7-shLuc and J7-shSTMN1 cells (1 × 10⁶) were suspended in 150 μl of PBS and injected into the dorsal skin of mice (left, shLuc; right, shSTMN1). After 2 weeks, visible tumors were measured every 2–3 d. Tumor volume was calculated using the following formula:
 |
Xenograft tumors were subsequently dissected and individually weighed. Animal care procedures were in accordance with the Chang-Gung Institutional Animal Care and Use Committee Guide for the Care and Use of Laboratory Animals (CGU08-05), and all methods were approved by the Chang-Gung Institutional Animal Care and Use Committee.
Flow cytometry
For cell-cycle analysis, cells were harvested by trypsin digestion and fixed in 75% ethanol for at least 1 h at −20 °C. Cells were then treated with 0.5% Triton X-100 and 0.05% RNase A for 1 h at 37 °C. Thereafter, nuclear DNA was incubated with 50 μg/ml propidium iodide stain for 20 min at 4 °C, and cells were analyzed on a FACSCalibur flow cytometer (Becton Dickinson Immunocytometry Systems, CA, USA).
Statistical analysis
Values are expressed as means ± s.e.m. Statistical analyses of data were performed using Student’s t-test or one-way analysis of variance (ANOVA), as appropriate. A P- value < 0.05 was considered significant.
Additional Information
How to cite this article: Tseng, Y.-H. et al. Thyroid hormone suppresses expression of stathmin and associated tumor growth in hepatocellular carcinoma. Sci. Rep. 6, 38756; doi: 10.1038/srep38756 (2016).
Publisher's note: Springer Nature remains neutral with regard to jurisdictional claims in published maps and institutional affiliations.
Supplementary Material
Acknowledgments
This work was supported by grants from Chang-Gung Memorial Hospital, Taoyuan, Taiwan (BMRP 130, CMRPD180011, 180012, 180013, CMRPD1A0331, CMRPD1A0332, CMRPD1A0333, NMRPD1A0921, 1A0922, NMRPD1A0923, NMRPD1A1231, NMRPD1A1232, NMRPD1A1233) and from the Ministry of Science and Technology, Taiwan (MOST 100-2320-B-182-029-MY3, 102-2811-B-182-009, 100-2321-B-182-005, 101-2321-B-182-003, 102-2321-B-182-003).
Footnotes
Author Contributions Y.H.T. designed the study, performed and analyzed all experiments, and wrote the manuscript. Y.H.H. performed and analyzed the promoter assay, and designing of the promoter construction. T.K.L., S.M.W., H.C.C., C.Y.T., M.M.T., and Y.H.L. provided experimental and technical assistance in acquisition of data. W.C.C. and Y.T.C. performed and analyzed most experiments. W.J.C. supervised the study, and edited the manuscript. K.H.L. designed the study, supervised the study, and wrote the manuscript.
References
- Lazar M. A. Thyroid hormone receptors: multiple forms, multiple possibilities. Endocr Rev 14, 184–193 (1993). [DOI] [PubMed] [Google Scholar]
- Cheng S. Y. Multiple mechanisms for regulation of the transcriptional activity of thyroid hormone receptors. Rev Endocr Metab Disord 1, 9–18 (2000). [DOI] [PubMed] [Google Scholar]
- Dong H. et al. Identification of thyroid hormone receptor binding sites and target genes using ChIP-on-chip in developing mouse cerebellum. PLoS One 4, e4610 (2009). [DOI] [PMC free article] [PubMed] [Google Scholar]
- Harris K. B. & Pass K. A. Increase in congenital hypothyroidism in New York State and in the United States. Mol Genet Metab 91, 268–277 (2007). [DOI] [PubMed] [Google Scholar]
- Forrest D., Reh T. A. & Rusch A. Neurodevelopmental control by thyroid hormone receptors. Curr Opin Neurobiol 12, 49–56 (2002). [DOI] [PubMed] [Google Scholar]
- Chamba A. et al. Expression and function of thyroid hormone receptor variants in normal and chronically diseased human liver. J Clin Endocrinol Metab 81, 360–367 (1996). [DOI] [PubMed] [Google Scholar]
- Loria P., Carulli L., Bertolotti M. & Lonardo A. Endocrine and liver interaction: the role of endocrine pathways in NASH. Nat Rev Gastroenterol Hepatol 6, 236–247 (2009). [DOI] [PubMed] [Google Scholar]
- Pearce E. N. Update in lipid alterations in subclinical hypothyroidism. J Clin Endocrinol Metab 97, 326–333 (2012). [DOI] [PubMed] [Google Scholar]
- Hassan M. M. et al. Association between hypothyroidism and hepatocellular carcinoma: a case-control study in the United States. Hepatology 49, 1563–1570 (2009). [DOI] [PMC free article] [PubMed] [Google Scholar]
- Antonelli A. et al. Endocrine manifestations of hepatitis C virus infection. Nat Clin Pract Endocrinol Metab 5, 26–34 (2009). [DOI] [PubMed] [Google Scholar]
- Moustafa A. H., Ali E. M., Mohamed T. M. & Abdou H. I. Oxidative stress and thyroid hormones in patients with liver diseases. Eur J Intern Med 20, 703–708 (2009). [DOI] [PubMed] [Google Scholar]
- Perra A., Kowalik M. A., Pibiri M., Ledda-Columbano G. M. & Columbano A. Thyroid hormone receptor ligands induce regression of rat preneoplastic liver lesions causing their reversion to a differentiated phenotype. Hepatology 49, 1287–1296 (2009). [DOI] [PubMed] [Google Scholar]
- Lin K. H., Shieh H. Y., Chen S. L. & Hsu H. C. Expression of mutant thyroid hormone nuclear receptors in human hepatocellular carcinoma cells. Mol Carcinog 26, 53–61 (1999). [DOI] [PubMed] [Google Scholar]
- Lin K. H. et al. Dominant negative activity of mutant thyroid hormone alpha1 receptors from patients with hepatocellular carcinoma. Endocrinology 138, 5308–5315 (1997). [DOI] [PubMed] [Google Scholar]
- Lin K. H. et al. Identification of naturally occurring dominant negative mutants of thyroid hormone alpha 1 and beta 1 receptors in a human hepatocellular carcinoma cell line. Endocrinology 137, 4073–4081 (1996). [DOI] [PubMed] [Google Scholar]
- Ando S. et al. Aberrant alternative splicing of thyroid hormone receptor in a TSH-secreting pituitary tumor is a mechanism for hormone resistance. Mol Endocrinol 15, 1529–1538 (2001). [DOI] [PubMed] [Google Scholar]
- Master A. et al. Untranslated regions of thyroid hormone receptor beta 1 mRNA are impaired in human clear cell renal cell carcinoma. Biochim Biophys Acta 1802, 995–1005 (2010). [DOI] [PubMed] [Google Scholar]
- Puzianowska-Kuznicka M., Krystyniak A., Madej A., Cheng S. Y. & Nauman J. Functionally impaired TR mutants are present in thyroid papillary cancer. J Clin Endocrinol Metab 87, 1120–1128 (2002). [DOI] [PubMed] [Google Scholar]
- Rosen M. D. & Privalsky M. L. Thyroid hormone receptor mutations found in renal clear cell carcinomas alter corepressor release and reveal helix 12 as key determinant of corepressor specificity. Mol Endocrinol 23, 1183–1192 (2009). [DOI] [PMC free article] [PubMed] [Google Scholar]
- Suzuki H., Willingham M. C. & Cheng S. Y. Mice with a mutation in the thyroid hormone receptor beta gene spontaneously develop thyroid carcinoma: a mouse model of thyroid carcinogenesis. Thyroid 12, 963–969 (2002). [DOI] [PubMed] [Google Scholar]
- Zhu X. G., Zhao L., Willingham M. C. & Cheng S. Y. Thyroid hormone receptors are tumor suppressors in a mouse model of metastatic follicular thyroid carcinoma. Oncogene 29, 1909–1919 (2010). [DOI] [PMC free article] [PubMed] [Google Scholar]
- Martinez-Iglesias O. et al. Thyroid hormone receptor beta1 acts as a potent suppressor of tumor invasiveness and metastasis. Cancer Res 69, 501–509, doi: 10.1158/0008-5472.CAN-08-2198 (2009). [DOI] [PubMed] [Google Scholar]
- Barrera-Hernandez G., Park K. S., Dace A., Zhan Q. & Cheng S. Y. Thyroid hormone-induced cell proliferation in GC cells is mediated by changes in G1 cyclin/cyclin-dependent kinase levels and activity. Endocrinology 140, 5267–5274 (1999). [DOI] [PubMed] [Google Scholar]
- Davis F. B. et al. Acting via a cell surface receptor, thyroid hormone is a growth factor for glioma cells. Cancer Res 66, 7270–7275 (2006). [DOI] [PubMed] [Google Scholar]
- Hall L. C., Salazar E. P., Kane S. R. & Liu N. Effects of thyroid hormones on human breast cancer cell proliferation. J Steroid Biochem Mol Biol 109, 57–66 (2008). [DOI] [PubMed] [Google Scholar]
- Tsui K. H., Hsieh W. C., Lin M. H., Chang P. L. & Juang H. H. Triiodothyronine modulates cell proliferation of human prostatic carcinoma cells by downregulation of the B-cell translocation gene 2. Prostate 68, 610–619 (2008). [DOI] [PubMed] [Google Scholar]
- Chen R. N., Huang Y. H., Yeh C. T., Liao C. H. & Lin K. H. Thyroid hormone receptors suppress pituitary tumor transforming gene 1 activity in hepatoma. Cancer Res 68, 1697–1706 (2008). [DOI] [PubMed] [Google Scholar]
- Yen C. C. et al. Mediation of the inhibitory effect of thyroid hormone on proliferation of hepatoma cells by transforming growth factor-beta. J Mol Endocrinol 36, 9–21 (2006). [DOI] [PubMed] [Google Scholar]
- Jiang X. et al. Molecular cloning and expression analysis of evolutionarily conserved stathmin from Gekko japonicus spinal cord. Indian J Biochem Biophys 46, 289–293 (2009). [PubMed] [Google Scholar]
- Maucuer A., Moreau J., Mechali M. & Sobel A. Stathmin gene family: phylogenetic conservation and developmental regulation in Xenopus. J Biol Chem 268, 16420–16429 (1993). [PubMed] [Google Scholar]
- Rana S., Maples P. B., Senzer N. & Nemunaitis J. Stathmin 1: a novel therapeutic target for anticancer activity. Expert Rev Anticancer Ther 8, 1461–1470 (2008). [DOI] [PubMed] [Google Scholar]
- Belmont L. D. & Mitchison T. J. Identification of a protein that interacts with tubulin dimers and increases the catastrophe rate of microtubules. Cell 84, 623–631 (1996). [DOI] [PubMed] [Google Scholar]
- Horwitz S. B. et al. The microtubule-destabilizing activity of metablastin (p19) is controlled by phosphorylation. J Biol Chem 272, 8129–8132 (1997). [DOI] [PubMed] [Google Scholar]
- Johnsen J. I. et al. p53-mediated negative regulation of stathmin/Op18 expression is associated with G(2)/M cell-cycle arrest. Int J Cancer 88, 685–691 (2000). [DOI] [PubMed] [Google Scholar]
- Murphy M. et al. Transcriptional repression by wild-type p53 utilizes histone deacetylases, mediated by interaction with mSin3a. Genes Dev 13, 2490–2501 (1999). [DOI] [PMC free article] [PubMed] [Google Scholar]
- Nadeem L. et al. Cytoplasmic mislocalization of p27 and CDK2 mediates the anti-migratory and anti-proliferative effects of Nodal in human trophoblast cells. J Cell Sci 126, 445–453 (2013). [DOI] [PubMed] [Google Scholar]
- Frau C. et al. Local hypothyroidism favors the progression of preneoplastic lesions to hepatocellular carcinoma in rats. Hepatology 61, 249–259, doi: 10.1002/hep.27399 (2015). [DOI] [PubMed] [Google Scholar]
- Liao C. H. et al. Dickkopf 4 positively regulated by the thyroid hormone receptor suppresses cell invasion in human hepatoma cells. Hepatology 55, 910–920 (2012). [DOI] [PubMed] [Google Scholar]
- Hsieh S. Y. et al. Stathmin1 overexpression associated with polyploidy, tumor-cell invasion, early recurrence, and poor prognosis in human hepatoma. Mol Carcinog 49, 476–487 (2010). [DOI] [PubMed] [Google Scholar]
- Gan L. et al. Up-regulated expression of stathmin may be associated with hepatocarcinogenesis. Oncol Rep 23, 1037–1043 (2010). [DOI] [PubMed] [Google Scholar]
- Luo X. N., Mookerjee B., Ferrari A., Mistry S. & Atweh G. F. Regulation of phosphoprotein p18 in leukemic cells. Cell cycle regulated phosphorylation by p34cdc2 kinase. J Biol Chem 269, 10312–10318 (1994). [PubMed] [Google Scholar]
- Marklund U., Osterman O., Melander H., Bergh A. & Gullberg M. The phenotype of a “Cdc2 kinase target site-deficient” mutant of oncoprotein 18 reveals a role of this protein in cell cycle control. J Biol Chem 269, 30626–30635 (1994). [PubMed] [Google Scholar]
- Kang W. et al. Stathmin1 plays oncogenic role and is a target of microRNA-223 in gastric cancer. PLoS One 7, e33919, doi: 10.1371/journal.pone.0033919 (2012). [DOI] [PMC free article] [PubMed] [Google Scholar]
- Rubin C. I. & Atweh G. F. The role of stathmin in the regulation of the cell cycle. Journal of cellular biochemistry 93, 242–250, doi: 10.1002/jcb.20187 (2004). [DOI] [PubMed] [Google Scholar]
- Rowlands D. C. et al. Stathmin is expressed by the proliferating hepatocytes during liver regeneration. Clin Mol Pathol 48, M88–92 (1995). [DOI] [PMC free article] [PubMed] [Google Scholar]
- Chen Y. L. et al. The E2F transcription factor 1 transactives stathmin 1 in hepatocellular carcinoma. Ann Surg Oncol 20, 4041–4054 (2013). [DOI] [PubMed] [Google Scholar]
- Fellous A., Lennon A. M., Francon J. & Nunez J. Thyroid hormones and neurotubule assembly in vitro during brain development. Eur J Biochem 101, 365–376 (1979). [DOI] [PubMed] [Google Scholar]
- Verga Falzacappa C. et al. T(3) preserves ovarian granulosa cells from chemotherapy-induced apoptosis. J Endocrinol 215, 281–289 (2012). [DOI] [PubMed] [Google Scholar]
- Samuels H. H., Stanley F. & Casanova J. Depletion of L-3,5,3′-triiodothyronine and L-thyroxine in euthyroid calf serum for use in cell culture studies of the action of thyroid hormone. Endocrinology 105, 80–85 (1979). [DOI] [PubMed] [Google Scholar]
- Shih C. H. et al. Thyroid hormone receptor-dependent transcriptional regulation of fibrinogen and coagulation proteins. Endocrinology 145, 2804–2814 (2004). [DOI] [PubMed] [Google Scholar]
- Barnes D. M., Dublin E. A., Fisher C. J., Levison D. A. & Millis R. R. Immunohistochemical detection of p53 protein in mammary carcinoma: an important new independent indicator of prognosis? Human pathology 24, 469–476 (1993). [DOI] [PubMed] [Google Scholar]
- Liao C. H. et al. Positive regulation of spondin 2 by thyroid hormone is associated with cell migration and invasion. Endocr Relat Cancer 17, 99–111 (2010). [DOI] [PubMed] [Google Scholar]
Associated Data
This section collects any data citations, data availability statements, or supplementary materials included in this article.


