Abstract
Purpose:
Even though the use of color in the interpretation of medical images has increased significantly in recent years, the ad hoc manner in which color is handled and the lack of standard approaches have been associated with suboptimal and inconsistent diagnostic decisions with a negative impact on patient treatment and prognosis. The purpose of this study is to determine if the choice of color scale and display device hardware affects the visual assessment of patterns that have the characteristics of functional medical images.
Methods:
Perfusion magnetic resonance imaging (MRI) was the basis for designing and performing experiments. Synthetic images resembling brain dynamic-contrast enhanced MRI consisting of scaled mixtures of white, lumpy, and clustered backgrounds were used to assess the performance of a rainbow (“jet”), a heated black-body (“hot”), and a gray (“gray”) color scale with display devices of different quality on the detection of small changes in color intensity. The authors used a two-alternative, forced-choice design where readers were presented with 600 pairs of images. Each pair consisted of two images of the same pattern flipped along the vertical axis with a small difference in intensity. Readers were asked to select the image with the highest intensity. Three differences in intensity were tested on four display devices: a medical-grade three-million-pixel display, a consumer-grade monitor, a tablet device, and a phone.
Results:
The estimates of percent correct show that jet outperformed hot and gray in the high and low range of the color scales for all devices with a maximum difference in performance of 18% (confidence intervals: 6%, 30%). Performance with hot was different for high and low intensity, comparable to jet for the high range, and worse than gray for lower intensity values. Similar performance was seen between devices using jet and hot, while gray performance was better for handheld devices. Time of performance was shorter with jet.
Conclusions:
Our findings demonstrate that the choice of color scale and display hardware affects the visual comparative analysis of pseudocolor images. Follow-up studies in clinical settings are being considered to confirm the results with patient images.
Keywords: color imaging, color visualization, color display, color scale, functional imaging
1. INTRODUCTION
In medical imaging procedures, clinicians base their diagnoses and treatment decisions on the assessment of image data. In most cases, the final stage of the imaging process is the human interpretation of data using visualization approaches and display devices. In the past few years, the use of color in medical images has increased significantly1,2 in support of sophisticated visualization approaches. However, the ad hoc manner for handling color and the lack of standardization and common methodologies used to display medical images are often cited as contributing to suboptimal medical decisions with direct impact on patient treatment and prognosis.3–6 In this topic, a recent expert consensus paper concluded that more research is needed to quantify the associated variability and to develop standards and common practices.7
In addition, the advent of wide-scale implementations of easily accessed picture archive and communication systems (PACS) as well as the availability of wireless connectivity has increased the presence of telemedicine applications opening a range of new image reading options complementing dedicated clinical workstations.4,8,9 This has in turn created the need for understanding the suitability of handheld devices including laptops, tablets, and phones, which are gaining popularity in everyday consultation workup of medical professionals.3,4,10–14 Most current mobile phones and tablet devices have pixel densities and spatial resolution similar to the characteristics of medical-grade displays,15 while not being limited by memory or computational power connected to high bandwidth networks.4
However, consumer-grade devices and handheld image readers have several limitations. Among them, recent work has demonstrated limited primary stability leading to color gamut shrinkage16 underlining that proper calibration is necessary to guarantee stability of display characteristics over time and to ensure similar and consistent behavior between different devices. Currently, color management methods for characterizing and calibrating color displays for medical image interpretation are not common resulting in inconsistent presentation.3–6 Moreover, tablet and phone calibration methods bring about additional difficulties since most of these devices do not currently support ICC profiling or calibration tools and, most importantly, are typically used in environments with widely variable illumination.4,7,17–19 Although there has been no clinical evidence that color calibration increases diagnostic efficacy, some studies have demonstrated significant improvements in practitioner reading time.4,5 The small size of the screen has also been cited as a major drawback of using handheld devices for diagnostic imaging purposes although devices that support zooming in tools have been reported as having similar performance than medical devices when evaluating anatomical detail.4,17
One medical imaging modality of current interest that relies on color is the assessment of functional images.20–26 Even though significant effort is being directed at developing software for automatic image interpretation, computer-aided diagnosis (CAD) tools are still semiautomatic, and human reader studies are necessary for initial setup and validation as reported in a recent example27 on the development of an automatic segmentation methodology considering manual tracing as the gold standard.
Functional images are often read using a pseudocolor presentation. Pseudocolor is defined here as the display of color-coded scalar imaging data with no direct correlation with the actual color of the object being imaged. The technique is typically used as a means of highlighting image features of interest. Because color is used as an indication of the quantitative value in the image data, color output needs to be consistent across devices and images while maximizing the transfer of information from image to reader. An example of a pseudocolor application is perfusion studies based on magnetic resonance imaging (MRI) or computed tomography (CT) where color-coded maps are used for qualitative and quantitative assessment. Perfusion images have a critical role in the therapy decision tree for stroke patients and in noninvasive diagnosis, staging, and therapy response assessment of tumors.20–26 Typical clinical color-based assessment tasks include comparison between healthy and pathological areas and between the same area at different time points in a sequential study protocol. The usefulness of pseudocolor presentation has also been recently highlighted by Saba et al.,28 in the evaluation of noncontrast computed tomography imaging for possible carotid artery dissection. Using a receiver-operating characteristic approach, the authors concluded that the accuracy and interobserver agreement were improved when the traditional grayscale was changed to a color presentation.
Other studies regarding choice of color scales for medical images include Li and Burgess study on color scale performance in synthetic images resembling nuclear medicine imaging, CT and MRI. The authors found that the best signal detection performance was obtained when using the gray and heated body scale, and that detectability with the spiral scales was typically 20% lower.29 To our knowledge, no study addressing side by side comparison (different from signal detection task) using images mimicking functional MRI patterns has been published in the literature. The investigation reported in this paper is meant to serve as a pilot study for a follow up study in a clinical setting using real patient medical images.
Even though clinical decisions are increasingly made based on color visualization of medical images, there is to date no consensus over which color scale is more appropriate in representing data obtained with different medical imaging techniques in terms of diagnostic and quantitative task performance.
Clinicians base their selection on personal preferences for a given software platform and/or on institutionally adopted practices. In this paper, we report on a laboratory study on the effect of color scale and display device hardware on the ability of human readers to detect small intensity changes in images resembling a functional medical imaging modality. Using synthetic images that mimic the anatomical and functional structures found in perfusion studies, we describe a reader study aimed at determining changes in the ability of readers to discriminate small intensity differences using color visualization approaches. In addition, we report results in terms of a range of display hardware used in the visualization including a medical-grade display, a consumer-grade monitor, a tablet device, and a mobile phone.
2. METHODS
Perfusion MRI was selected as the basis for designing the synthetic patterns and the study paradigm as an example of a functional medical imaging modality that uses color maps and requires qualitative and quantitative determinations. Specifically, we used brain dynamic, contrast-enhanced MRI images as models for the design of synthetic patterns mimicking patient data.
2.A. Image generation
Synthetic images were obtained using the following expression: , where gc represents a clustered lumpy statistical background and30 gl and gw are lumpy31 and white noise backgrounds, respectively. The scaling factor α generates a difference in intensity between two otherwise identical patterns to form a trial pair. In the study, we used α values of 0, 0.05, 0.08, and 0.12 based on preliminary testing to obtain a 75% correct performance for an initial set of images. We denote by go a uniformly randomly sampled maximum intensity value between presets (p1 and p2) used to locate g within a range of the scale. The presets were determined to obtain two levels of intensity. The patterns were then mapped directly into a 256-level scale. The first level (denoted as low level or LL) randomized the maximum pattern intensity in the range between 0.25 and 0.4 of the maximum scale value. This LL pattern was designed to simulate areas of low perfusion typical of normal and hypoperfused white matter regions. The values for the second level (denoted as high level or HL) randomized the maximum value of the pattern between 0.8 and the maximum value in the scale. This HL pattern was chosen to represent areas of high perfusion rate typical of gray matter and some brain tumors. The synthetic pattern resembling magnetic resonance perfusion images obtained using a mixture of clustered lumpy, lumpy, and white noise statistical background mimic the characteristic spatial frequency content of perfusion MRI and its characteristic gradients.
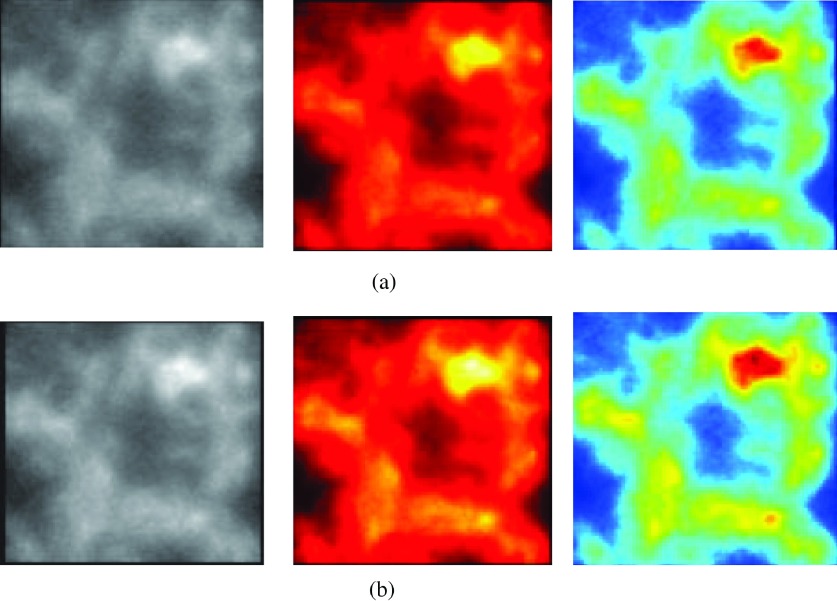
Sets of 4 images of each pattern with α values of 0, 0.05, 0.08, and 0.12 were generated using matlab (matlab R2014a version). An example of the synthetic patterns generated using our technique is showed in Fig. 1. The patterns used for our experiments resemble patterns found in real brain perfusion images through the manual selection of the weights cc, cl, and cw corresponding to the clustered lumpy, lumpy, and white noise layers of the random background image. All patterns were obtained using a unique set of weights. To provide a quantitative validation of our approach, twelve 80 × 80-pixel patches were manually selected from patient perfusion maps with high-grade glioma from The Cancer Imaging Archive’s (TCIA) public database.32 Areas representative of normal white and gray matter as well as tumor areas were included in this selection. The patches were fast Fourier transformed and radially averaged. The comparison for twelve synthetic patterns of the same size randomly selected from the generated experiment set indicates that the spatial frequency content of synthetic and patient brain perfusion MRI images is similar.
FIG. 1.
Example of the synthetic patterns used in this study. (a) α = 0 and (b) α = 0.12.
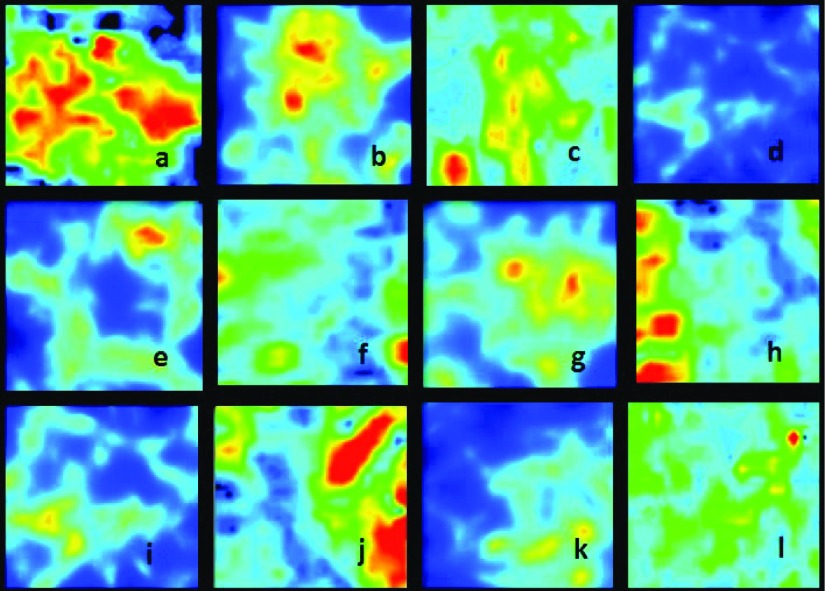
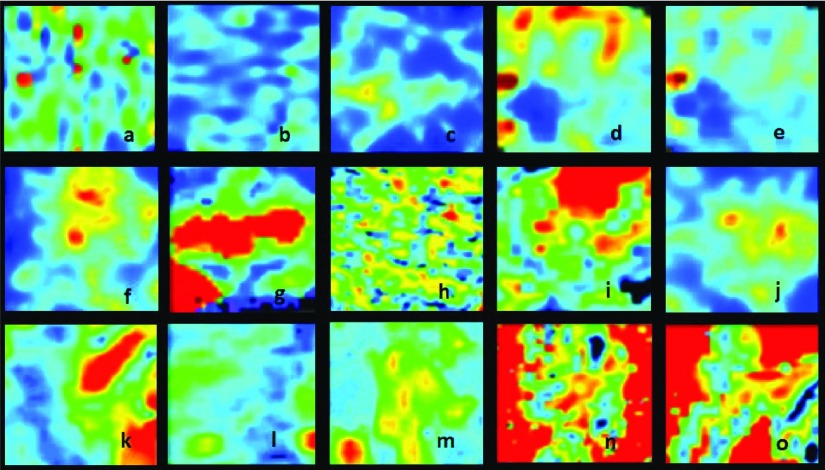
Although patterns are similar to perfusion MRI from other body regions and other functional imaging modalities by observation, further quantitative analyses are needed to quantify the similarity in order to generalize our findings. As preliminary evidence of the similarity between our synthetic images and patient images, we present a graphic comparison with brain perfusion images (Fig. 2) and with perfusion images from other organs (Fig. 3).
FIG. 2.
Synthetic [(b), (d), (e), (g), (i), and (k)] and patient [(a), (c), (f), (h), (j) and (l)] brain perfusion MRI images (Ref. 33).
FIG. 3.
Synthetic [(c), (f), and (j)] and perfusion MRI images from different body regions: breast [(a) and (b)], ovarium [(d) and (e)], prostate (g), liver [(h) and (i)], brain [(k), (l), and (m)], and kidney [(n) and (o)] (Refs. 34–38).
2.B. Study design and data analysis
Six patterns were selected from the synthetic images creating two groups of three patterns each. The first group resembled the appearance typical of white matter perfusion. They were assigned to test the low intensity level mimicking a task associated with the clinical assessment of a stroke patient. The second group was selected to visually mimic perfusion in gray matter or tumor areas to test high levels of intensity. The patterns had a size of 200 × 200 pixels to simulate the approximate size of perfusion imaging features when evaluated in the default settings of standard image processing platforms. The experimental user interface presented the reader with two patterns, side by side, in a two-alternative-forced-choice (2AFC) paradigm. The study and data analyses were coded using matlab. In addition, the patterns were displayed in a device of choice using a TCP/IP communication protocol for handheld devices. Each 2AFC trial displayed two images of the same spatial pattern, one with an α value of 0 and the other with an α value of 5%, 8%, or 12%. The right pattern was flipped along the vertical axis to simulate the clinical setting of comparing the two hemispheres of the brain as done in common practice when assessing brain perfusion studies.
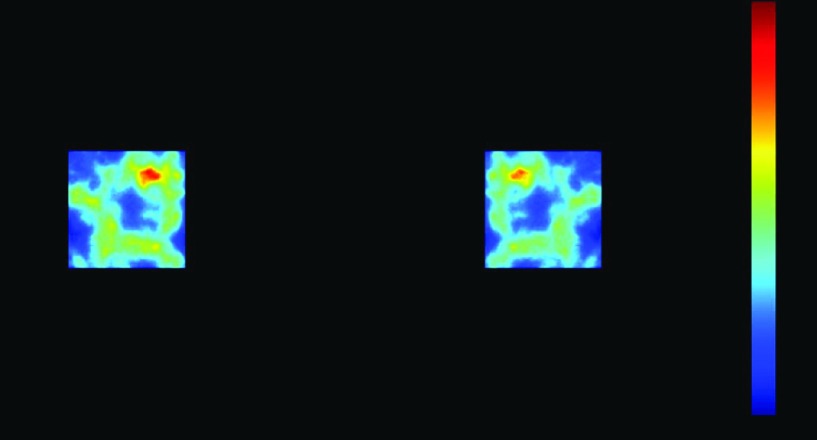
Readers were asked to use the keyboard to select the image with the highest intensity based on a reference colorbar which was available on the right side of the user interface during the entire experiment. They were trained to consider colors in the colorbar ranging from lowest (bottom) to highest (top) intensity.
A random white noise field was displayed for 500 ms to delete the retinal latent image between trial images. Figure 4 shows the user interface with an example 2AFC trial.
FIG. 4.
2AFC user interface for the study showing the mirrored synthetic patterns and the colorbar for reference.
2.C. Color scales and devices
Studies report that there is no universally suitable color scale and that the choice depends on the kind of data displayed.1 In his paper, Borland states that hue can be considered as a tool for absolute measurements such as categorization or localization within a range of values, while luminance can be a tool for relative measurements like revealing fine local detail and introducing perceptual ordering.39 Among the available scales, the rainbow-like palette is popular among medical imaging, prevalent in scientific publications, and the default color scale in most visualization toolkits.1,2 Colors in this scale are sorted following the order in the visible spectrum. It has been criticized for lacking natural perceptual order and uniformity, forcing readers to refer more frequently to the color bar and thus increasing time of interpretation, for obscuring details in data through its uncontrolled perceived luminance variation, especially in the green–cyan range where humans have lower perception of changes, and for actively misleading interpretation through the introduction of non-data-dependent gradients that tend to introduce false boundaries.1,40,41
Another scale that is commonly seen in medical imaging is the heated black-body, showing a linear increase in chroma, a close to linear increase in luminance and a smooth hue variation reproducing the order in which color changes in a heated black-body through red and yellow to white. Because of its perceptual order and use of color to avoid contrast effects, it has been considered a good choice for ultrasound images.42
Finally, the standard color scale in medical images remains the gray scale, often described as suitable for representing linear data due to its perceptual uniform linearity.
A grayscale (gray), a heated black-body (hot), and a rainbow-like palette (jet) were selected for our study. The red, green, and blue components of the jet, hot, and gray colormaps in matlab are depicted in Fig. 5. In each plot, the x-axis is the image data to visualize while the curves show the digital driving levels, integers between 0 and 255, for the red, green, and blue channels of a display pixel. The pixel value is sent to the display via the operating system, which may optionally apply color management. In this study, the color management was deactivated so the pixel values were sent from matlab to the display without manipulation.
FIG. 5.
Red, green, and blue components of the jet, hot, and gray colormaps in matlab. (a) Jet, (b) hot, and (c) gray.
As indicated in Fig. 5, the jet color map is composed by hue transitions from blue, green, and then red, similar to a rainbow. When driving a perfect sRBG (Ref. 43) display, the luminance is monotonically nondecreasing because green carries higher luminance than blue and red. On the other hand, hot is composed by gradually adding the red, green, and then blue component. The intended luminance of the hot colormap on a perfect sRGB display is supposed to be monotonically nondecreasing because every channel increases monotonically. The hue changes from red to yellow (red mixed with green), and then white (yellow mixed with blue). The gray color map is composed by transitioning from dark to bright with equal amount of the red, green, and blue components. The luminance increases monotonically and perceptually uniformly from dark to bright. The hue is neutral gray. Assuming a perfect display, the color maps can be converted into the CIELAB color space, as shown in Figs. 6 and 7 for observing their lightness, hue, and chroma attributes. Consider the CIELAB color space as a cylindrical coordinate system. The height (L∗) represents the lightness, the angular coordinate tan−1(a∗/b∗) indicates the hue, and the radial distance (a∗2 + b∗2)0.5 shows the chroma.44
FIG. 6.
Color path of matlab-designed scales measured on 4 displays. (a) Jet, (b) hot, and (c) gray.
FIG. 7.
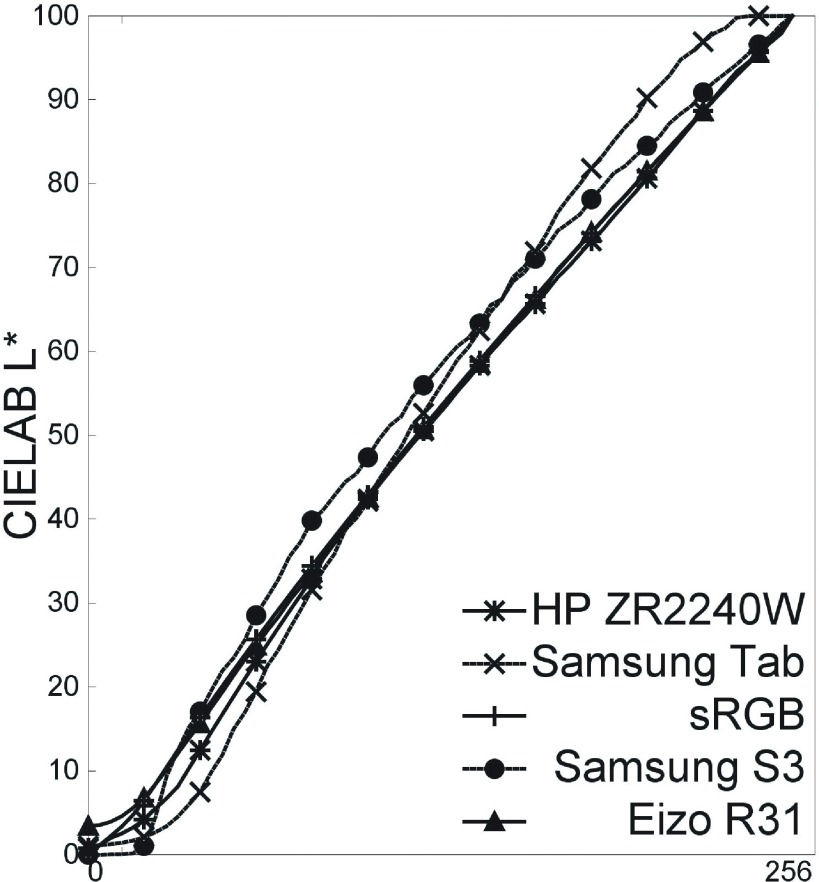
Measured CIELAB L∗ of matlab-designed gray on 4 displays.
We tested four display devices including a medical display (EIZO R31), a consumer-grade device (HP ZR2240W), a tablet (SAMSUNG Tab 10.1), and a phone (SAMSUNG S3) (see Table I for details on the specifications for each device). The color responses of all devices were fully measured as shown in Figs. 6 and 7.
TABLE I.
Principal characteristics of the devices included in the study.
| R31 | ZR2240W | Tab 10.1 | Phone S3 | |
|---|---|---|---|---|
| Pixel array | 2048 × 1536 | 1920 × 1080 | 1280 × 1024 | 1280 × 720 |
| Size (in.) | 20.8 | 21.5 | 10.1 | 4.8 |
| Pixel (mm) | 0.207 | 0.2475 | 0.170 | 0.109 |
| Lmin (cd/m2) | 1.05 | 1 | 0.471 | 0.174 |
| Lmax (cd/m2) | 271 | 250 | 280 | 341 |
| Ratio | 258 | 250 | 595 | 1962 |
| CIE x red | 0.6351 | 0.6319 | 0.5944 | 0.6728 |
| CIE y red | 0.3345 | 0.3304 | 0.3402 | 0.3265 |
| CIE x green | 0.2919 | 0.3068 | 0.3159 | 0.2177 |
| CIE y green | 0.6167 | 0.6232 | 0.5633 | 0.7239 |
| CIE x blue | 0.1446 | 0.1525 | 0.1491 | 0.1394 |
| CIE y blue | 0.1019 | 0.0729 | 0.1155 | 0.0508 |
2.D. Protocol
Experiments were divided in sessions that tested one color scale in one device. A split-plot design was used for the experiments to reduce the number of reader interpretations.45 Readers were distributed among the different color scale/device combinations depending on their availability to perform experiments. We used three color scales and four devices. Combinations using gray, jet, the medical device, and one of the handheld devices (Samsung S3) were assigned more often in an attempt to collect more data in those categories and thus increase power in the statistical analysis.
Seventeen readers participated in the study including two doctoral students, one radiology resident, one pathologist, and many computer science students. A description of the number of readers per combination of device and color scale can be found in Table II. The group included 11 male and 6 female readers with ages between 22 and 78. Two of the readers performed the complete set of experiments testing 4 display devices, each of them with three color scales. One reader tested all three color scales in one device, one reader did only one session, and the rest of them tested one device with two color scales.
TABLE II.
Split-plot design. Number of readers per device/color scale combination.
| R31 | ZR2240W | Tab 10.1 | Phone S3 | |
|---|---|---|---|---|
| Jet | 6 | 2 | 3 | 8 |
| Gray | 8 | 5 | 3 | 8 |
| Hot | 4 | 5 | 3 | 3 |
The complete experiment included twelve sessions which were performed in random order. Each session consisted of 600 2AFC trials (100 per level and per intensity) presented to the readers in random order. Readers were asked to take a 15-min break between sessions. The time of performance was recorded for each trial. The experiments were performed under controlled lighting conditions with an illuminance at the face of the devices of less than 5 lx. Experiments began with a 5-min adaptation period before trials. Also, readers were asked to adjust the viewing distance per device according to their preference and to keep it constant for the duration of the experiment. Handheld devices were supported by a fixed laboratory stand.
Readers were tested for color deficiencies using the Farnsworth–Munsell 100 Hue Color Vision Test.46 One of the participants showed mild color vision impairment; the results did not show any significant difference compared to those participants with normal color discrimination and thus were not removed from the pool of results for statistical analysis.
Data were statistically analyzed using the iMRMC tool which has been reported as the most suitable for the experimental design we selected.47
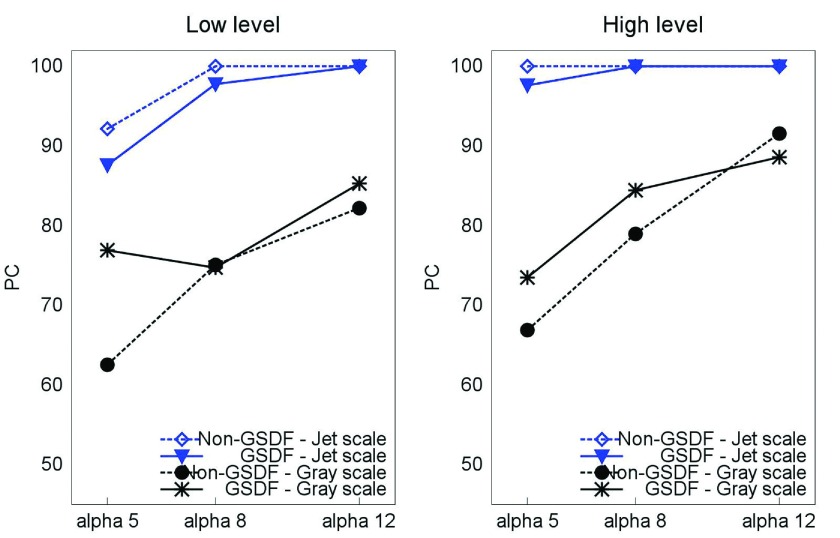
In addition, experiments run in the R31 medical display were performed under sRGB mode. One of the readers tested gray and jet using the sRGB and the GSDF modes to compare performance levels. All participants received training using a shorter version (20 images) of the 2AFC experiment prior to the beginning of the experiments. The results of the training session were analyzed and discussed with the readers previous to the real 2AFC tests. Those with impaired vision accuracy used their eyeglasses for the experiments. Readers were informed of the conditions of participation following the directives of the FDA RIHSC under a categorical exemption for studies involving no patient data.
3. RESULTS
3.A. Per image analysis
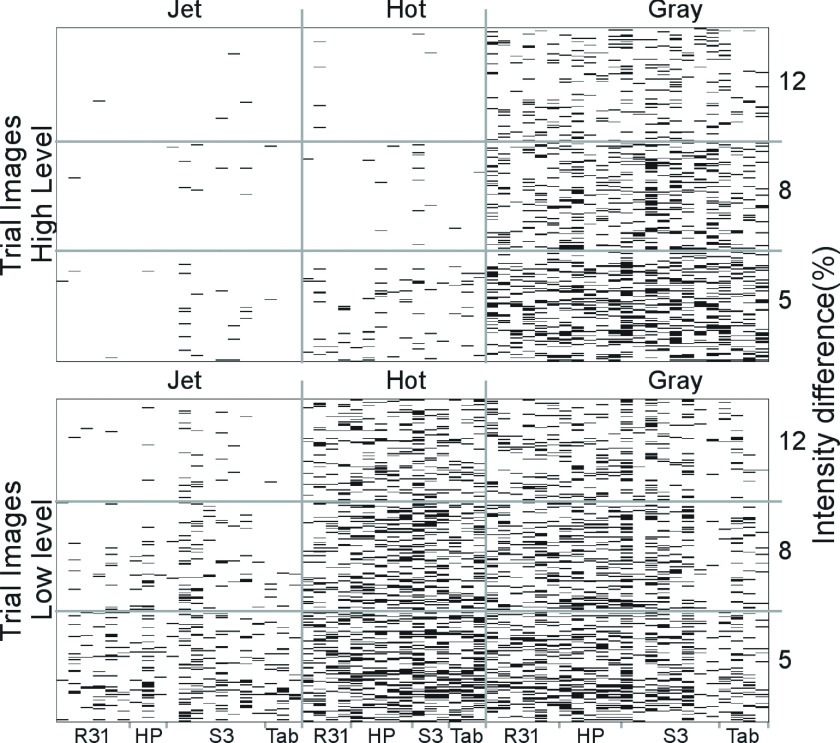
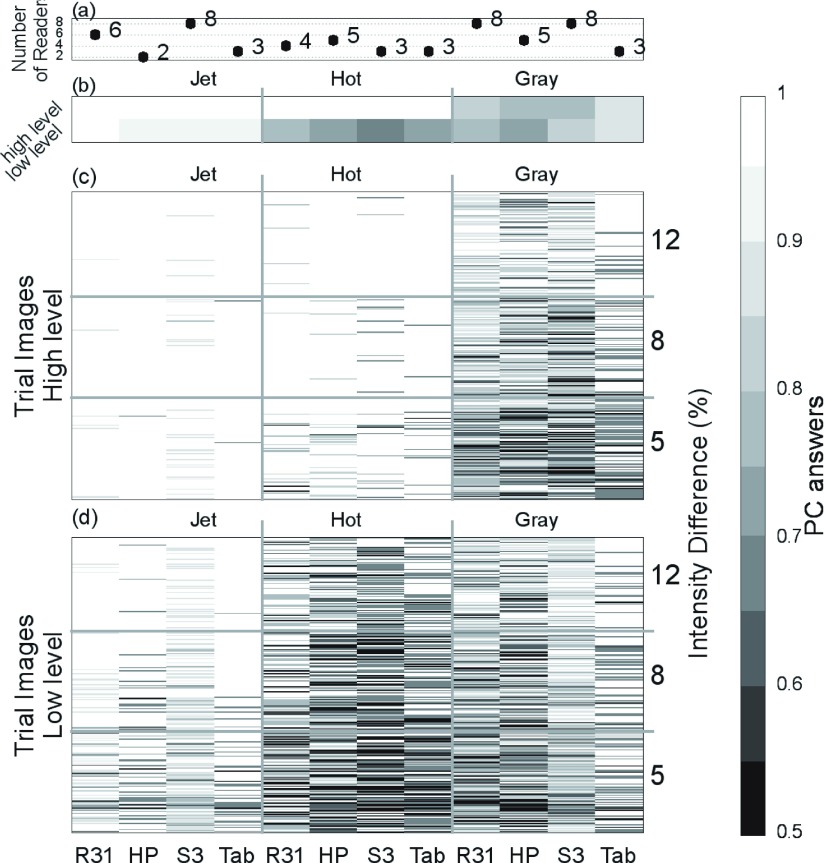
Responses for each trial image in every experiment are presented in Fig. 8 for a full view of the acquired data in the entire study. Since significant differences were found when testing HL and LL patterns, results are visualized for each one of these groups. Each column in the graph represents an individual experiment set, i.e., a combination of device and color scale. Each row corresponds to a 2AFC trial image sorted in order of intensity difference from bottom to top (0.05, 0.08, and 0.12, respectively). Black and white represent wrong and right answers, respectively. Significantly fewer mistakes are made using jet. As an example, for R31, the difference in performance between jet and gray in HL was 0.16 (p < 0.05, CI 0.0004, 0.31), and in LL Delta AUC was 0.18 (p < 0.05, CI 0.06, 0.3). Performance under a hot scale is comparable to gray in LL and to jet in HL. Gray performs similarly in both intensity levels. The average result for all readers for each device and color scale combination can be seen in Fig. 9. Similar performance is seen between devices, except when using gray in handheld devices.
FIG. 8.
Comprehensive set of all the experiment results. White represents correct answers and black wrong answers. Each column represents a reader session. The device and the color scale used are in the x and x2 axes labels, respectively. Each row represents a 2AFC trial, in ascending order of intensity difference (represented by alpha in the y2 axis). Performance in high level (top) and low level (bottom) are plotted separately. The number of readers per device and color scale combination varies.
FIG. 9.
Averaged results. (a) Number of readers per device/color scale combination. (b) Averaged PC of all readers in a combination in HL (top row) and LL (bottom row) intensity range. The device and the color scale used are labeled in the x and x2 axes, respectively. [(c) and (d)] Average PC across readers for each trial image in each combination for HL (c) and LL (d). Each row represents a 2AFC trial, in ascending order of intensity difference (represented by alpha in the y2 axis). Steps of gray were selected to represent the PC value, where black corresponds to 50% PC and white to 100% correct answers.
3.B. Effect of color scales
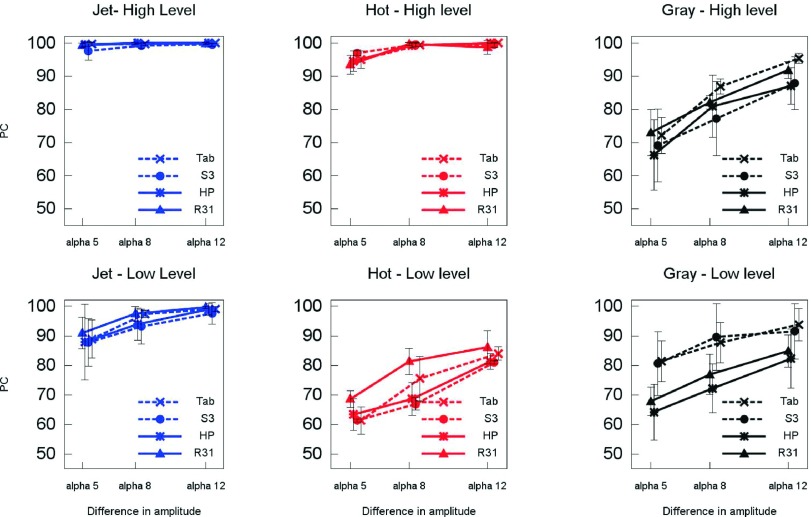
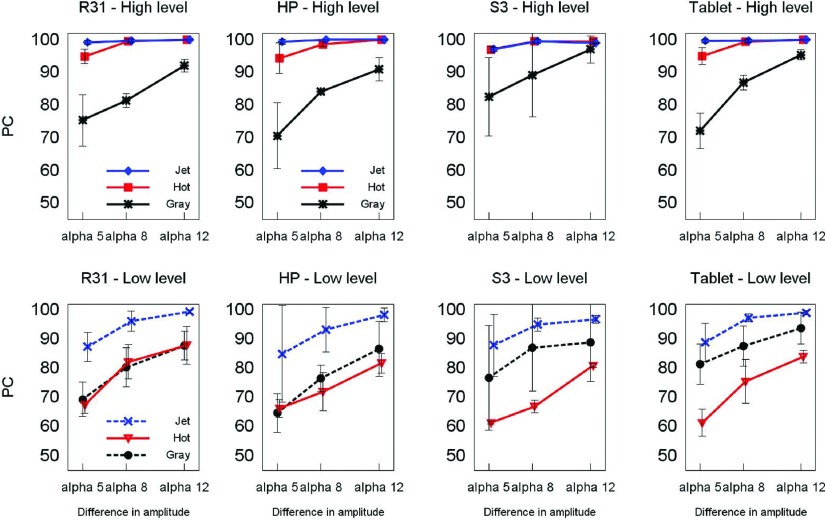
As expected, performance with all color scales decreased with lower differences in intensity between the two images in the trial. This behavior is more evident with gray and hot in the LL, where results show more than a 15% difference in performance as expressed by the percentage of correct (PC) answers. Results for jet and hot in HL are consistently higher with PC above 93%. Both jet and hot perform better than gray in HL independently of the device tested. This difference is not clearly observed in LL where there is more variability particularly with gray and especially in experiments using the tablet and phone. In LL, hot has a tendency to perform similarly or worse than gray which may be related to poor range of luminance and hue gradients (Fig. 10).
FIG. 10.
Percent correct (PC) for each device and scale and level. Error bars depict two standard deviations of the sample variability among readers that performed the experiment.
The statistical analysis performed on the reader data is conclusive for a number of comparisons. From all the possible comparisons between devices, scales, and intensity levels that this study investigated, the following resulted in a significant effect with positive confidence intervals (CI) using the iMRMC tool. The comparison of jet versus gray resulted in a significant effect in R31, S3, and Tablet for both intensity levels LL (CI 0.06, 0.3; 0.01, 0.13; and 0.06, 0.37, respectively) and HL (CI 0.0004, 0.31; 0.17, 0.26; and 0.11, 0.18, respectively). The study presented in this paper is not a definitive investigation of the effects of color visualization but rather an initial laboratory study to determine if these effects are worth considering in a follow-up study with a more clinically relevant task for a particular modality. In this context, our statistical analysis demonstrates that the results of the study warrant further investigations.
3.C. Effect of devices
Figure 11 shows similar performance across devices. Overall, results are consistent for all combinations of device and color scale with some variations that are confounded by the uncertainty in the calculated PC.
FIG. 11.
Percent correct (PC) for each device. Error bars depict two standard deviations of the sample variability among readers that performed the experiment.
In addition, we show results comparing the performance of a sRGB grayscale presentation and a GSDF OSD setting in the R31 display device (see Fig. 12). Although the results included in this paper are only for one reader, the data suggest that there is a small effect of the grayscale model used in the context of the visual task studied in these experiments.
FIG. 12.
Comparison between s grayscale and GSDF OSD setting in the R31 display device.
3.D. Differential performance
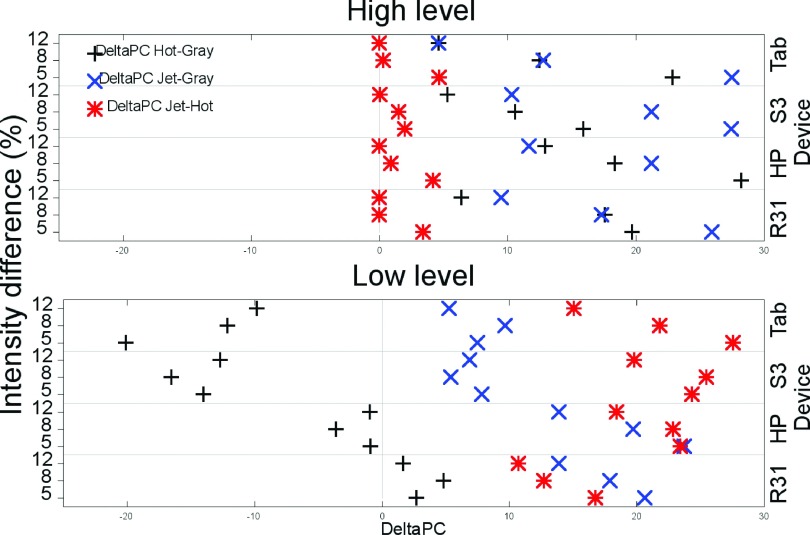
We further analyzed the data in terms of the performance of each reader with respect to the results of the same reader using a different color scale. Hot and gray were compared to jet considering performance with jet as a reference. Gray performance was compared against hot. Figure 13 shows the difference in percent correct between each reader’s performance (delta PC). Results near zero mean that both color scales have similar performance (as it is observed for jet and hot in HL). The more positive (or negative) the value, the better (or worse) the performance the scale had compared to the reference color scale. For all devices, readers had similar performance with jet and hot and better results with both of these color scales than with gray in HL. For LL, readers’ results using jet were better than gray and hot. For handheld devices, gray results in LL were better than those with hot.
FIG. 13.
Average differential performance with the different color scales for all experimental combinations.
3.E. Left-answer bias
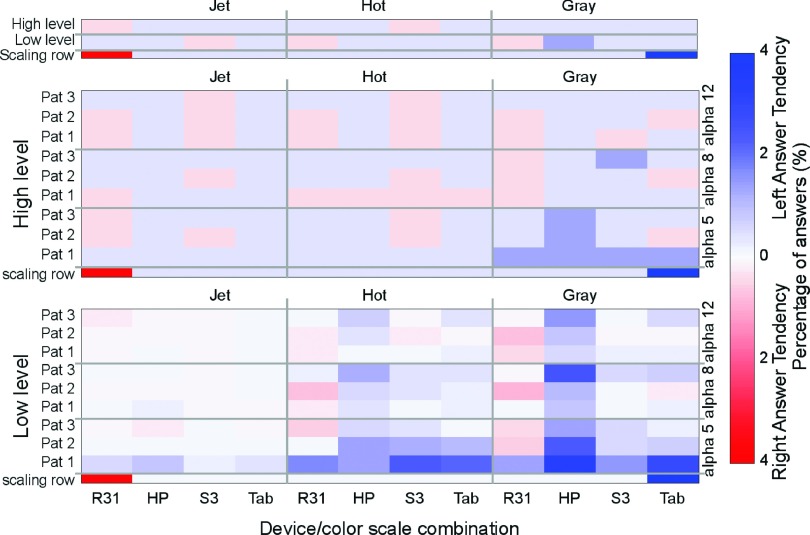
During the experiment, correct answers were uniformly randomized to be on the left or right side. We then expect to measure around 50% of wrong answers on each side. However, most readers seemed to preferentially select the left image as the correct answer. To address this possible bias, we calculated the subtraction of the corresponding answers (see Fig. 14). A result of zero means readers have the same number of wrong answers on the left side than on the right side, while positive values show a bias toward deciding the correct answer was on the left whereas it was on the right. Negative answers mean the opposite. The calculated bias seems to be salient in some devices and preferentially in the LL image sets with the gray scale.
FIG. 14.
Average left-answer bias of readers while testing the different device/color scales combinations. Scaling rows are only for defining the presentation of the color bar range.
3.F. Effect on decision time
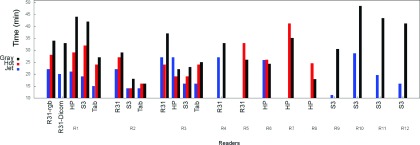
A secondary outcome of this study is the difference in performance time observed with different color scales and devices (see Fig. 15). Experiments with jet were completed consistently in less time than with other color scales. This finding is consistent with results from Li29 and Krupinski.5
FIG. 15.
Time to complete the study for different device/color scale combinations.
4. DISCUSSION
In spite of the numerous drawbacks described for rainbow color scales, jet appears to be the most suitable for functional image data sets. Our results show a noticeably better performance of jet compared to gray in all intensity levels and with all devices. These results can explain the popularity of jet in medical imaging despite having been reported as inadequate.1,40,41 A possible explanation for the differential performance is the better contrast perception between hues than perceived brightness of human vision, which would make smaller intensity differences easier to detect with jet. The same applies to the different performance of hot in the two levels of intensity. In LL, hot behaves similar to gray, which could relate to the poor perceived contrast between black and red, and the little change in luminance in this range of the color scale. On the other hand, in the HL, contrast between reds and yellows, together with higher levels of luminance, improves hot performance and makes it comparable to that of jet.
Even though results cannot be generalized to all handheld devices, performance with the tablet and the phone used in our study was comparable to that of the medical and the consumer-level display device. The better performance using gray in handheld devices may be attributed to the deviation seen in their luminance mapping, which results in an improved local contrast between darker grays and makes it easier to detect smaller differences in amplitude. Another possible explanation could be the smaller screen size in the handheld devices, which made trial images in the 2AFC interface appear smaller and closer to each other affecting the reader’s strategy. Size of screen in mobile devices has been described as a disadvantage for medical image interpretation, although devices with the possibility of zooming in and out have shown similar performance than medical devices when evaluating anatomical detail.4 Our study did not provide the reader with the possibility of zoom; however, the kind of task involved only contrast discrimination and this task might have been even facilitated since the small size of the entire trial image might have fit within the foveal area of the retina. Less saccadic eye movements between both trial images and a better general impression of the patterns might have helped in the comparison improving the results for gray. In this context, eye tracking would be a valuable complement for future work on this topic since the readers’ pattern of interpretation might shed light on the reason for this and other observed differences. In addition, the physical size of the patterns was not kept the same across devices. This change in the field of view and therefore in the angular frequencies involved might have implications for the strategy the subjects used during the task (i.e., a smaller search area in the handheld devices).
With respect to the time of performance, jet has been criticized for lacking perceptual order and increasing reading times because of more frequent color key consultation. However, our results are not consistent with that observation. Jet appears to make differences in intensity between trial images more evident than the other color scales tested and readers take less time to make a decision. Eye tracking could be useful for the interpretation of these results here as well.
One key difference between medical-grade and consumer-grade monitors is the typically more accurate control of the look-up tables for visualization and improved features including lower spatial noise48 and improved temporal response.49–51 However, in this study, the characteristics of the display hardware were not the focus of the experiments. For instance, the design of the study did not include any steps to compensate differences in the absolute range of luminance that the devices delivered. The wide range of luminance observed among the devices does not allow the results to extrapolate conclusions regarding the suitability of any of the devices for the specific tasks considered in the study. The results of this study need not be interpreted as a direct hardware comparison but as a comparison of visualization approaches in the context of the use of color scales. However, it has to be noted that the manner in which display devices deliver the color output depends significantly on the technological characteristics of the hardware. For instance, display devices based on liquid crystal technology suffer from spectral leakage in the dark regions of the scale particularly at off-normal viewing directions. On the other hand, the saturation quality of some of the organic light-emitting devices found in today’s handheld devices offer a wider, more saturated gamut and a darker black level for a higher dynamic range. These differences among the devices used in the study and the results obtained warrant further investigation of the effect of technology of the hardware on the effect of color on quantitative visual tasks similar to those studied in this work. Finally, the devices used in this study have been set up with in-factory calibration. While some of the preset hardware calibrations have been shown to be accurate,52 they provide an inconsistent presentation in terms of luminance range and color characteristics conferring a variability to the devices that impede us from a direct performance comparison. Overall, the three color scales perform better in HL. This raises the concern of a perceived response that is not consistent across the scale which is often a desired property of a medical image visualization system.
Regarding the left answer tendency, one possible explanation for our findings is that the reference color bar was on the right side. Especially in trials in LL, the luminance of the color key could have made readers underestimate or somehow compensate the luminance of the right image, thus making the left image appear perceptually brighter. This difference appears more evident in the HP device which could be explained by off-normal leakage in the liquid crystal.
A weakness of this exploratory study is that the cells in our split-plot design were not balanced. Depending on their availability, readers were assigned experiments with different color scale/device combinations. Gray, jet, the medical device, and one of the handheld devices (S3) were assigned more often to increase the power in the statistical analysis of those comparisons. However, as pointed out by Obuchowski,45 a reduction in the number of readers per experimental condition does not lead to a significant effect on study power. In our study, all experimental conditions contained 600 pairs of images.
Finally, it is important to note that the side by side comparison in this laboratory study of flipped symmetric images in the 2AFC experiment resembles to some degree clinical tasks involved in assessing symmetric organs such as brain, breast, or prostate, comparing a region of interest in both sides to search for asymmetries in color intensity indicative of hypoperfused areas or tumor presence.
5. CONCLUSION
In our study, the jet color scale consistently outperformed the hot and gray scales in all levels of the color range and for all devices tested when evaluating synthetic images mimicking functional MRI. Hot has a noticeable difference in performance in the different intensity levels being comparable to jet in HL and worse than gray in LL. Similar performance was observed for the medical display, the consumer-grade monitor, the tablet, and the phone, using jet and hot. Interestingly, performance with gray was better with the handheld devices. In addition, time of performance was shorter with jet.
Our findings demonstrate that the choice of color scale and display hardware affects the visual comparative analysis of pseudocolor images. Follow-up studies with patient images are needed to confirm the results in a clinical setting.
ACKNOWLEDGMENTS
Image data used in this research were obtained from The Cancer Imaging Archive (cancerimagingarchive.net) sponsored by the Cancer Imaging Program, DCTD/NCI/NIH. The authors acknowledge useful discussion with T. Kimpe. The authors would like to thank J. Wang, C.-L. Wu, B. Ghammraoui, C. Graff, and D. Sharma for their valuable assistance in the programming of this study and N. Yesupriya, F. Zafar, B. Ghammraoui, K. Kontson, Y. Fang, M. I. Iacono, E. Lucano, M. Robinowitz, C. Scully, A. Seff, D. Narayanan, T. Fraychineaud, Y. Wang, H. Roth, and L. Galeotti for their participation as readers for this study, and the Radiology Department, Universidad de la República, Montevideo, Uruguay, for allowing Dr. Zabala’s internship at the FDA. This project was financially supported by an appointment to the Research Participation Program at the Center for Devices and Radiological Health administered by Oak Ridge Institute for Science and Education through an interagency agreement between the U.S. Department of Energy and the U.S. Food and Drug Administration. Funding for this project was provided in part by a CRADA between CDRH and BARCO.
REFERENCES
- 1.Borland D. and Taylor R. M. II, “Rainbow color map (still) considered harmful,” IEEE Comput. Graphics Appl. 27, 14–17 (2007). 10.1109/MCG.2007.323435 [DOI] [PubMed] [Google Scholar]
- 2.Griggs B., “The end of rainbow? An exploration of color in scientific visualization,” Thesis,University of Oregon, 2014. [Google Scholar]
- 3.Pantanowitz L., “Digital images and the future of digital pathology,” Journal of Pathology Informatics 1(15) (2010). 10.4103/2153-3539.68332 [DOI] [PMC free article] [PubMed] [Google Scholar]
- 4.Krupinski E. A., “Human factors and human-computer considerations in teleradiology and telepathology,” in Healthcare (Multidisciplinary Digital Publishing Institute, Switzerland, 2014), Vol. 2, pp. 94–114. [DOI] [PMC free article] [PubMed] [Google Scholar]
- 5.Krupinski E. A., Silverstein L. D., Hashmi S. F., Graham A. R., Weinstein R. S., and Roehrig H., “Observer performance using virtual pathology slides: Impact of LCD color reproduction accuracy,” J. Digital Imaging 25, 738–743 (2012). 10.1007/s10278-012-9479-1 [DOI] [PMC free article] [PubMed] [Google Scholar]
- 6.Pinco J., Goulart R. A., Otis C. N., Garb J., and Pantanowitz L., “Impact of digital image manipulation in cytology,” Arch. Pathol. Lab. Med. 133, 57–61 (2009). [DOI] [PubMed] [Google Scholar]
- 7.Badano A. et al. , “Consistency and standardization of color in medical imaging: A consensus report,” J. Digital Imaging 28(1), 41–52 (2015). 10.1007/s10278-014-9721-0 [DOI] [PMC free article] [PubMed] [Google Scholar]
- 8.ESR, “ESR white paper on teleradiology: An update from the teleradiology subgroup,” Insights Imaging5, 1–8 (2014) 10.1007/s13244-013-0307-z [DOI] [PMC free article] [PubMed]
- 9.Silva E. III et al. , “ACR white paper on teleradiology practice: A report from the task force on teleradiology practice,” J. Am. Coll. Radiol. 10, 575–585 (2013). 10.1016/j.jacr.2013.03.018 [DOI] [PubMed] [Google Scholar]
- 10.Alamoudi A. O., Haque S., Srinivasan S., and Mital D. P., “A preliminary comparison of using handheld devices in promoting the healthcare performance within a radiology department in terms of diagnostic accuracy and workflow efficiency,” Int. J. Med. Eng. Inf. 6, 355–364 (2014). [Google Scholar]
- 11.Food and Drug Administration, Mobile medical applications: Guidance for Industry and Food and Drug Administration staff, 2013.
- 12.Toomey R. J., Ryan J. T., McEntee M. F., Evanoff M. G., Chakraborty D. P., McNulty J. P., Manning D. J., Thomas E. M., and Brennan P. C., “The diagnostic efficacy of hand-held devices for emergency radiological consultation,” Am. J. Roentgenol. 194, 469–474 (2010). 10.2214/AJR.09.3418 [DOI] [PMC free article] [PubMed] [Google Scholar]
- 13.Raman B., Raman R., Raman L., and Beaulieu C. F., “Radiology on handheld devices: Image display, manipulation, and pacs integration issues,” Radiographics 24, 299–310 (2004). 10.1148/rg.241035127 [DOI] [PubMed] [Google Scholar]
- 14.Berkowitz S. J., Kung J. W., Eisenberg R. L., Donohoe K., Tsai L. L., and Slanetz P. J., “Resident ipad use: Has it really changed the game?,” J. Am. Coll. Radiol. 11, 180–184 (2014). 10.1016/j.jacr.2013.04.017 [DOI] [PubMed] [Google Scholar]
- 15.Yamazaki A., Wu C.-L., Cheng W.-C., and Badano A., “Spatial resolution and noise in organic light-emitting diode displays for medical imaging applications,” Opt. Express 21, 28111–28133 (2013). 10.1364/OE.21.028111 [DOI] [PubMed] [Google Scholar]
- 16.Cheng W.-C., Wu C.-L., and Badano A., “Evaluating color shift in liquid crystal displays with the primary stability metrics,” inColor and Imaging Conference (Society for Imaging Science and Technology, 2013), Vol. 2013(1), pp. 143–147. [Google Scholar]
- 17.Rodrigues M., Visvanathan A., Murchison J., and Brady R., “Radiology smartphone applications; current provision and cautions,” Insights Imaging 4, 555–562 (2013). 10.1007/s13244-013-0274-4 [DOI] [PMC free article] [PubMed] [Google Scholar]
- 18.Liu P., Zafar F., and Badano A., “The effect of ambient illumination on handheld display image quality,” J. Digital Imaging 27, 12–18 (2014). 10.1007/s10278-013-9636-1 [DOI] [PMC free article] [PubMed] [Google Scholar]
- 19.Zafar F., Choi M., Wang J., Liu P., and Badano A., “Visual methods for determining ambient illumination conditions when viewing medical images in mobile display devices,” J. Soc. Inf. Disp. 20, 124–132 (2012). 10.1889/JSID20.3.124 [DOI] [Google Scholar]
- 20.Kim B. J., Kang H. G., Kim H.-J., Ahn S.-H., Kim N. Y., Warach S., and Kang D.-W., “Magnetic resonance imaging in acute ischemic stroke treatment,” J. Stroke 16, 131–145 (2014). 10.5853/jos.2014.16.3.131 [DOI] [PMC free article] [PubMed] [Google Scholar]
- 21.Schaefer P., Pulli B., Copen W., Hirsch J., Leslie-Mazwi T., Schwamm L., Wu O., González R., and Yoo A., “Combining MRI with NIHSS thresholds to predict outcome in acute ischemic stroke: Value for patient selection,” Am. J. Neuroradiol. 36, 259–264 (2014). 10.3174/ajnr.a4103 [DOI] [PMC free article] [PubMed] [Google Scholar]
- 22.R. F. Barajas, Jr. and Cha S., “Benefits of dynamic susceptibility-weighted contrast-enhanced perfusion MRI for glioma diagnosis and therapy,” CNS Oncol. 3, 407–419 (2014). 10.2217/cns.14.44 [DOI] [PMC free article] [PubMed] [Google Scholar]
- 23.Hegde J. V., Mulkern R. V., Panych L. P., Fennessy F. M., Fedorov A., Maier S. E., and Tempany C., “Multiparametric MRI of prostate cancer: An update on state-of-the-art techniques and their performance in detecting and localizing prostate cancer,” J. Magn. Reson. Imaging 37, 1035–1054 (2013). 10.1002/jmri.23860 [DOI] [PMC free article] [PubMed] [Google Scholar]
- 24.Martens M. H. et al. , “Can perfusion MRI predict response to preoperative treatment in rectal cancer?,” Radiother. Oncol. 114, 218–223 (2014). 10.1016/j.radonc.2014.11.044 [DOI] [PubMed] [Google Scholar]
- 25.Karahaliou A., Vassiou K., Arikidis N. S., Skiadopoulos S., Kanavou T., and Costaridou L., “Assessing heterogeneity of lesion enhancement kinetics in dynamic contrast-enhanced MRI for breast cancer diagnosis,” Br. J. Radiol. 83, 296–309 (2010). 10.1259/bjr/50743919 [DOI] [PMC free article] [PubMed] [Google Scholar]
- 26.Akbari H., Macyszyn L., Da X., Wolf R. L., Bilello M., Verma R., O’Rourke D. M., and Davatzikos C., “Pattern analysis of dynamic susceptibility contrast-enhanced MR imaging demonstrates peritumoral tissue heterogeneity,” Radiology 273, 502–510 (2014). 10.1148/radiol.14132458 [DOI] [PMC free article] [PubMed] [Google Scholar]
- 27.Rosado-Toro J. A., Barr T., Galons J.-P., Marron M. T., Stopeck A., Thomson C., Thompson P., Carroll D., Wolf E., Altbach M. I., and Rodr’iguez J. J., “Automated breast segmentation of fat and water MR images using dynamic programming,” Acad. Radiol. 22, 139–148 (2015). 10.1016/j.acra.2014.09.015 [DOI] [PMC free article] [PubMed] [Google Scholar]
- 28.Saba L., Argiolas G. M., Raz E., Sannia S., Suri J. S., Siotto P., Sanfilippo R., Montisci R., Piga M., and Wintermark M., “Carotid artery dissection on non-contrast CT: Does color improve the diagnostic confidence?,” Eur. J. Radiol. 83, 2288–2293 (2014). 10.1016/j.ejrad.2014.09.001 [DOI] [PubMed] [Google Scholar]
- 29.Li H. and Burgess A. E., “Evaluation of signal detection performance with pseudocolor display and lumpy backgrounds,” Proc. SPIE 3036, 143–149 (1997). 10.1117/12.271286 [DOI] [Google Scholar]
- 30.Castella C., Kinkel K., Descombes F., Eckstein M. P., Sottas P.-E., Verdun F. R., and Bochud F. O., “Mammographic texture synthesis: Second-generation clustered lumpy backgrounds using a genetic algorithm,” Opt. Express 16, 7595–7607 (2008). 10.1364/OE.16.007595 [DOI] [PubMed] [Google Scholar]
- 31.Rolland J. P. and Barrett H. H., “Effect of random background inhomogeneity on observer detection performance,” J. Opt. Soc. Am. A 9, 649–658 (1992). 10.1364/JOSAA.9.000649 [DOI] [PubMed] [Google Scholar]
- 32.Clark K. et al. , “The cancer imaging archive (TCIA): Maintaining and operating a public information repository,” J. Digital Imaging 26, 1045–1057 (2013). 10.1007/s10278-013-9622-7 [DOI] [PMC free article] [PubMed] [Google Scholar]
- 33.Provenzale J. M., Mukundan S., and Barboriak D. P., “Diffusion-weighted and perfusion MR imaging for brain tumor characterization and assessment of treatment response,” Radiology 239, 632–649 (2006). 10.1148/radiol.2393042031 [DOI] [PubMed] [Google Scholar]
- 34.Fournier L. S., Oudard S., Thiam R., Trinquart L., Banu E., Medioni J., Balvay D., Chatellier G., Frija G., and Cuenod C. A., “Metastatic renal carcinoma: Evaluation of antiangiogenic therapy with dynamic contrast-enhanced CT,” Radiology 256, 511–518 (2010). 10.1148/radiol.10091362 [DOI] [PubMed] [Google Scholar]
- 35.Kim J. H., Lee J. M., Park J. H., Kim S. C., Joo I., Han J. K., and Choi B. I., “Solid pancreatic lesions: Characterization by using timing bolus dynamic contrast-enhanced MR imaging assessmenta preliminary study,” Radiology 266, 185–196 (2013). 10.1148/radiol.12120111 [DOI] [PubMed] [Google Scholar]
- 36.Donati O. F., Jung S. I., Vargas H. A., Gultekin D. H., Zheng J., Moskowitz C. S., Hricak H., Zelefsky M. J., and Akin O., “Multiparametric prostate MR imaging with T2-weighted, diffusion-weighted, and dynamic contrast-enhanced sequences: Are all pulse sequences necessary to detect locally recurrent prostate cancer after radiation therapy?,” Radiology 268, 440–450 (2013). 10.1148/radiol.13122149 [DOI] [PMC free article] [PubMed] [Google Scholar]
- 37.Huang W. et al. , “Discrimination of benign and malignant breast lesions by using shutter-speed dynamic contrast-enhanced MR imaging,” Radiology 261, 394–403 (2011). 10.1148/radiol.11102413 [DOI] [PMC free article] [PubMed] [Google Scholar]
- 38.Sala E. et al. , “Advanced ovarian cancer: Multiparametric MR imaging demonstrates response-and metastasis-specific effects,” Radiology 263, 149–159 (2012). 10.1148/radiol.11110175 [DOI] [PubMed] [Google Scholar]
- 39.David Borland A. H., “Visualization viewpoints collaboration-specific color-map design,” IEEE Comput. Graphics Appl. 31(4), 7–11 (2011). 10.1109/MCG.2011.55 [DOI] [PubMed] [Google Scholar]
- 40.Rogowitz B. and Treinish L. A., “Data visualization: The end of the rainbow,” IEEE Spectrum 35, 52–59 (1998). 10.1109/6.736450 [DOI] [Google Scholar]
- 41.Marchak F. M., Cleveland W. S., Rogowitz B. E., and Wickens C. D., “The psychology of visualization,” in Proceedings of the 4th Conference on Visualization’93 (IEEE Computer Society, San Jose, CA, 1993), pp. 351–354. [Google Scholar]
- 42.Pizer S. M. and Zimmerman J. B., “Color display in ultrasonography,” Ultrasound Med. Biol. 9, 331–345 (1983). 10.1016/0301-5629(83)90086-8 [DOI] [PubMed] [Google Scholar]
- 43.IEC, “Multimedia systems and equipment - Colour measurement and management - Part 2-1: Colour management - Default RGB colour space - sRGB,” Technical Report No. IEC 61966-2-1 (IEC, 1999).
- 44.Fairchild M. D., Color Appearance Models, 3rd ed. (Wiley-IS & T, Chichester, UK, 2013). [Google Scholar]
- 45.Obuchowski N. A., “Reducing the number of reader interpretations in mrmc studies,” Acad. Radiol. 16, 209–217 (2009). 10.1016/j.acra.2008.05.014 [DOI] [PubMed] [Google Scholar]
- 46.Farnsworth D., “The Farnsworth-Munsell 100-Hue and Dichotomous Tests for Color Vision,” J. Opt. Soc. Am. 33, 568–574 (1943). 10.1364/JOSA.33.000568 [DOI] [Google Scholar]
- 47.Gallas B. D., “One-shot estimate of mrmc variance: Auc,” Acad. Radiol. 13, 353–362 (2006). 10.1016/j.acra.2005.11.030 [DOI] [PubMed] [Google Scholar]
- 48.Badano A., Gagne R. M., Jennings R. J., Drilling S. E., Imhoff B. R., and Muka E., “Noise in flat-panel displays with subpixel structure,” Med. Phys. 31, 715–723 (2004). 10.1118/1.1656529 [DOI] [PubMed] [Google Scholar]
- 49.Liang H., Park S., Gallas B. D., Badano A., and Myers K. J., “Assessment of temporal blur reduction methods using a computational observer that predicts human performance,” J. Soc. Inf. Display 38, 967–970 (2007). 10.1889/1.2785466 [DOI] [Google Scholar]
- 50.Liang H., Park S., Gallas B. D., Myers K. J., and Badano A., “Image browsing in slow medical liquid crystal displays,” Acad. Radiol. 15, 370–382 (2008). 10.1016/j.acra.2007.10.017 [DOI] [PubMed] [Google Scholar]
- 51.Badano A., “Effect of slow display on detectability when browsing large image datasets,” J. Soc. Inf. Display 17, 891–896 (2009). 10.1889/JSID17.11.891 [DOI] [Google Scholar]
- 52.Wu C.-L., Badano A., and Cheng W.-C., “30.3: Comparison of on-screen display-based and ICC profile-based calibration for OLED displays,” SID Symp. Dig. Tech. Pap. 44, 376–379 (2013). 10.1002/j.2168-0159.2013.tb06225.x [DOI] [Google Scholar]


