Significance
EBV infection causes African Burkitt's lymphoma; Hodgkin's disease; lymphomas in immune suppressed people, including HIV infected people; nasopharyngeal carcinoma; and ∼10% of gastric carcinomas. We recently found EBV super-enhancer (ESE) to be critical for lymphoblastoid cell (LCL) growth and survival. We now identified an ESE constituent, enhancer RNA (eRNA), that is important for ESE function. These eRNAs were activated by viral transactivator, EBV nuclear antigen 2 (EBNA2). MYC oncogene ESE eRNAs were able to enhance ESE activation of MYC expression and are essential for LCL growth. Targeting ESE eRNAs may lead to new therapeutics for EBV-associated malignancies.
Keywords: Epstein–Barr virus, super-enhancer, eRNA, MYC
Abstract
Epstein–Barr virus (EBV) super-enhancers (ESEs) are essential for lymphoblastoid cell (LCL) growth and survival. Reanalyses of LCL global run-on sequencing (Gro-seq) data found abundant enhancer RNAs (eRNAs) being transcribed at ESEs. Inactivation of ESE components, EBV nuclear antigen 2 (EBNA2) and bromodomain-containing protein 4 (BRD4), significantly decreased eRNAs at ESEs −428 and −525 kb upstream of the MYC oncogene transcription start site (TSS). shRNA knockdown of the MYC −428 and −525 ESE eRNA caused LCL growth arrest and reduced cell growth. Furthermore, MYC ESE eRNA knockdown also significantly reduced MYC expression, ESE H3K27ac signals, and MYC ESEs looping to MYC TSS. These data indicate that ESE eRNAs strongly affect cell gene expression and enable LCL growth.
Epstein–Barr virus (EBV), the first human DNA tumor virus, was discovered in African Burkitt's lymphoma cells, more than 50 y ago (1). EBV infection causes Burkitt's lymphoma, Hodgkin’s lymphoma, post-transplant lymphoproliferative disorder (PTLD), AIDS-associated lymphomas, nasopharyngeal carcinomas, and gastric cancers (2). In vitro, EBV transforms human primary B lymphocytes into lymphoblastoid cell lines (LCLs), which express six EBV nuclear antigens (EBNAs) and three latent membrane proteins (LMPs), noncoding RNAs, and miRNAs (2). Genetic studies identified EBNA1, EBNALP, EBNA2, EBNA3A, EBNA3C, and LMP1 to be essential for continuous LCL proliferation (3–7). LCLs express the same viral latency program as some EBV-associated malignancies, they are therefore useful models of EBV-mediated oncogenesis.
Recent studies have highlighted the mechanisms through which EBV establishes and maintains LCL growth and survival. EBNA2 up-regulates the key oncogene MYC, thereby promoting infected B-cell proliferation (8–11). EBNA3A and EBNA3C repress the CDKN2A loci, thereby preventing cell senescence (12–14), whereas LMP1 activation of NF-κB suppresses apoptosis (15). EBNA2 is the principal EBV transcription factor (TF) that activates the expression of all of the viral latency genes and many cell genes (16, 17). EBNA2 is tethered to DNA through cell TFs. Its C-terminal transactivation domain recruits basal transcription machinery and activates gene transcription (11, 18–20). EBNALP coactivates with EBNA2 by removing repressors (21, 22). EBNA3C binds to the p14ARF promoter and represses CDKN2A expression (23, 24), whereas EBNA3A binds to sites further upstream of CDKN2B (25). Genome-wide analyses found most EBNAs and NF-κB components bound to enhancer sites. Although each EBNA and NF-κB subunit is independent and functionally nonredundant, EBNA2, EBNALP, EBNA3A, EBNA3C, and the five LMP1-activated NF-κB subunits converge at 187 EBV super-enhancer (ESE) sites that have extraordinary broad and high H3K27ac ChIP-seq signals, characteristic of super-enhancers (26). ESEs are linked to key oncogenes including MYC and MIR155. ESEs are also linked to genes critical for B-cell functions, including IKZF3, RUNX3, and OCA-B. ESEs are co-occupied by many cell TFs, including EBF, SPI-1, PAX5, ETS1, IRF4, and BATF (26). However, only EBNA2, RBPJ, NFATc, STAT5, RNA polymerase II (Pol II), and H3K27ac ChIP-seq signals differentiate ESEs from typical enhancers. Conditional inactivation of ESE constituents, EBNA2, NF-κB, or inhibition of epigenetic reader, BRD4, represses ESE target gene expression and stops LCL growth. EBV typical enhancers (ETE), with all associated EBV transcription factors or NF-κB subunits, have significantly less H3K27ac and Pol II signals. Their associated genes are expressed at lower levels (26).
Enhancer RNAs (eRNAs) are newly identified noncoding RNAs transcribed from active enhancers by Pol II (27). eRNAs can stabilize TF associations with their cognate sequences (28). This interaction generates a positive feedback loop, which ensures transcription. eRNAs can also facilitate enhancer-promoter looping, thus allowing assembly of larger transcription complexes, and enabling higher-level transcription from promoters (29). We now describe a component of ESE i.e., eRNAs, that are essential for MYC expression and LCL growth.
Results
eRNA Expression at ESEs and ETEs.
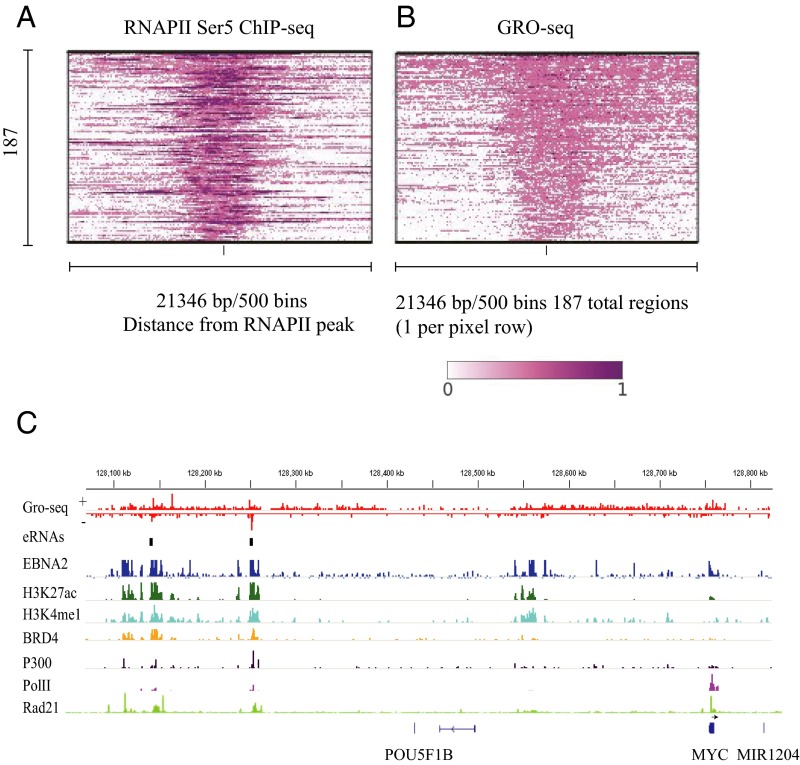
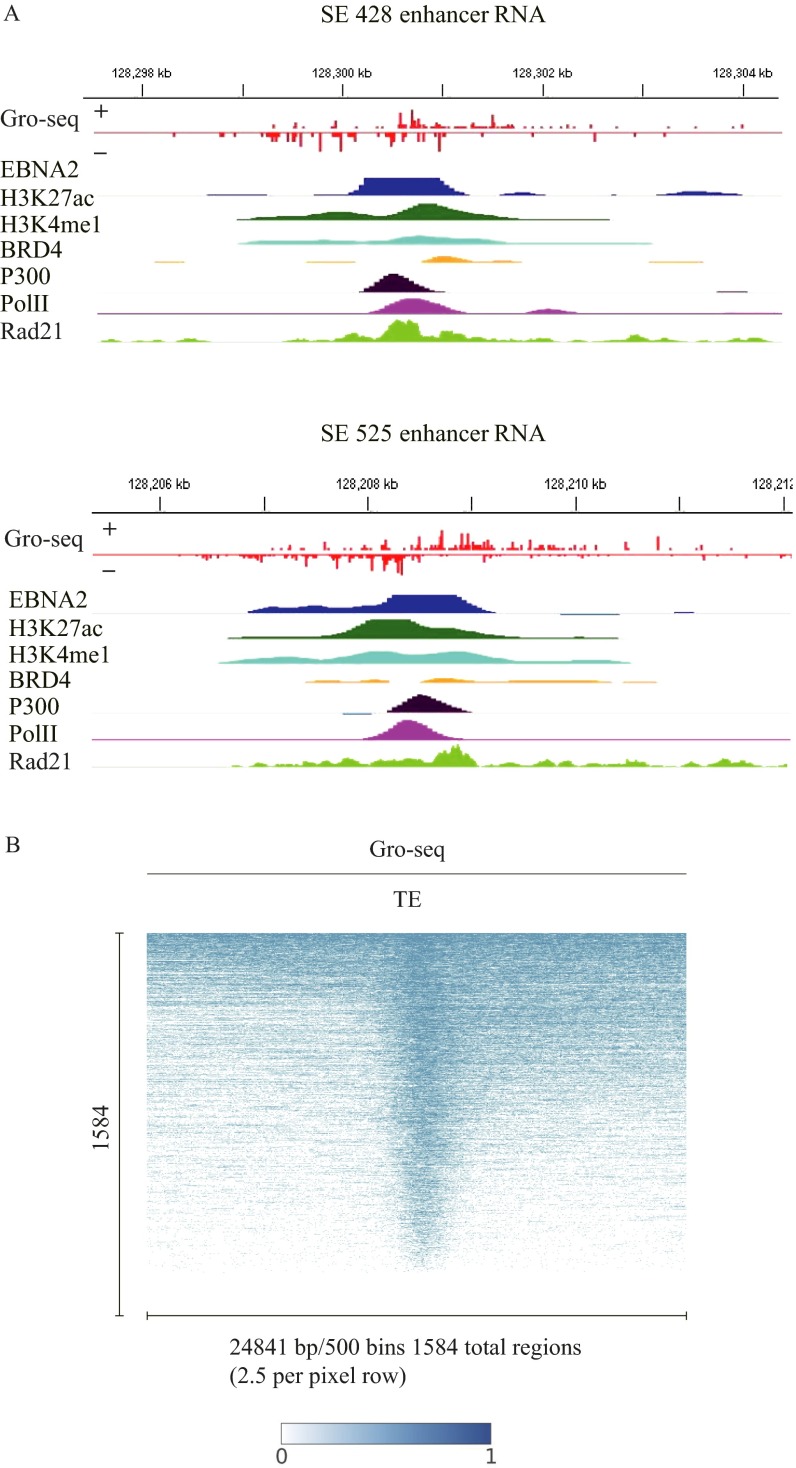
ESEs have high signals for TFs associated with high-level transcription, such as EBNA2, which has a strong transactivation domain and active histone modifications, including H3K27ac, H3k4me1, and H3K4me3. ESEs also have high signals for p300, BRD4, and Pol II (26). RNA Pol II is frequently paused without active transcription elongation. Paused Pol II can be activated by cyclin-dependent kinases mediating phosphorylation of serine 5 of the C-terminal domain (CTD), thus releasing paused Pol II to enable transcription elongation (30). We first analyzed the Encyclopedia of DNA Elements (ENCODE) GM12878 LCL Pol II CTD Ser5 ChIP-seq data. Abundant Pol II CTD Ser5 ChIP-seq signals were evident throughout the ESEs (Fig. 1A), suggesting that Pol II at ESEs is engaged in active transcription elongation. To determine whether eRNA is being transcribed from ESEs, we reanalyzed GM12878 LCL GRO-seq data generated by Core et al. (31). GRO-seq assesses global nascent RNA transcription. Sequencing reads were first mapped to the human genome and visualized on an Integrative Genomics Viewer genome browser (32). Abundant, bidirectional RNA transcripts were mapped to ESEs (Fig. 1B). The mapped transcripts covered most ESEs on both forward and reverse strands. We further examined the MYC ESEs, −428 and −525 kb upstream of the MYC TSS (Fig. 1C and Fig. S1A). High and broad GRO-seq eRNA signals on both strands of these ESEs. The eRNA signals co-occurred with wide and tall H3K27ac signals. These two ESEs also have strong EBNA2, Pol II, p300, and BRD4 signals. The vast majority of the eRNA signals fell within the H3K27ac peaks. High EBNA2 signals also overlapped with the tallest eRNA peaks. These data indicate that EBNA2 may be a driving TF that up-regulates MYC ESE eRNA transcription.
Fig. 1.
ESE eRNA expression. (A) ChIP-seq signals of phosphorylated RNA Pol II CTD Ser5 at 187 ESEs. Each row represents one ESE. The average window of ESEs were 21,346 bp. (B) ESE eRNA expression levels at 187 ESEs as determined by LCL GRO-seq. GM12878 LCL GRO-seq data were analyzed and visualized by following ref. 47. The minimum value is 0, whereas the maximum value is 1, and the signal is normalized accordingly from max to min in the scale of 1–0. (C) Global view of EBNA2, H3K27ac, H3K4me1, BRD4, P300, Pol II, and RAD21 ChIP-seq signals and GRO-seq signals of eRNA expression from both forward and reverse strands at the MYC locus (∼650 kb).
Fig. S1.
eRNA expression at MYC locus and EBV typical enhancers. (A) EBNA2, H3K27ac, H3K4me1, BRD4, P300, Pol II, and RAD21 ChIP-seq signals and GRO-seq signals of eRNA expression from both forward and reverse strands at the −428 MYC ESE and −525 MYC ESE. (B) ETE eRNA expression levels at 1,584 ETEs as determined by LCL GRO-seq. GM12878 LCL GRO-seq data were analyzed and visualized by following ref. 46. The minimum value is 0, whereas the maximum value is 1, and the signal is normalized accordingly from max to min in the scale of 1–0.
We also examined the eRNA transcript levels at ETEs. Most ETEs also had high eRNA transcript levels (Fig. S1B).
BRD4 Inactivation Reduced MYC ESEs eRNAs.
BRD4 is an important ESE constituent and an epigenetic reader that binds to H3K27ac. Upon binding to H3K27ac, BRD4 recruits P-TEFb to phosphorylate the Pol II CTD Ser5 to enable transcript elongation (33). The small molecule inhibitor, JQ1, blocks BRD4 association with H3K27ac to suppress transcription. LCLs treated with JQ1 have much reduced MYC expression resulting in cell growth arrest (26).
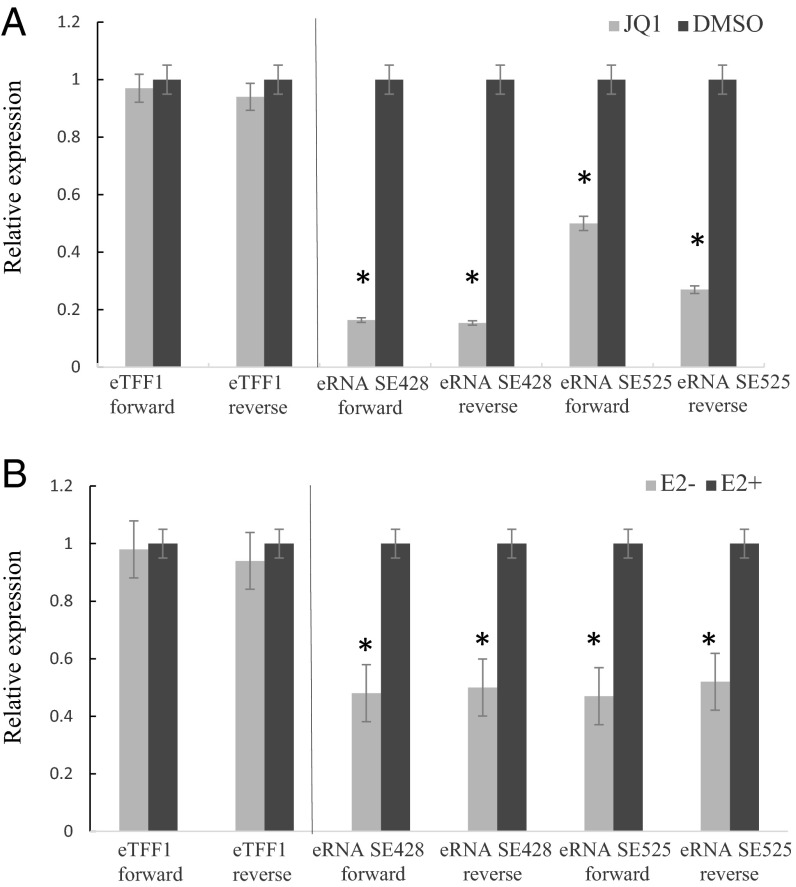
To evaluate the effects of JQ1 treatment on eRNA transcription, GM12878 LCLs were treated with 500 nM JQ1 or DMSO control for 24 h. Total RNAs were prepared. Quantitative RT-PCR (qRT-PCR) primers were designed to detect eRNAs from positive or negative strands of the MYC −428 and −525 ESEs. eTFF1 was used as a negative control (31). eRNAs were assessed by qRT-PCR. Compared with DMSO-treated LCLs, the MYC −428 and −525 ESE eRNA levels were significantly reduced (P < 0.01) by JQ1 treatment. The reduction ranged from >80% to ∼40% (Fig. 2A). These data indicate that ESE eRNA transcription is sensitive to BRD4 perturbation and that BRD4 is important for eRNA expression.
Fig. 2.
MYC ESE eRNA expression depends on BRD4 and EBNA2. (A) Twenty-four hours after 500 nM JQ1 or vehicle treatment of LCLs, qRT-PCR was used to quantitate MYC ESE eRNAs. RNA levels were first normalized with GAPDH. MYC ESE eRNA levels were shown relative to control TFF1 eRNA, which was set to 1. Error bar indicated SD of triplicate data from three independent experiments. Student's t test, *P < 0.01. (B) Total RNA was extracted from conditional EBNA2HT LCLs, grown under permissive (E2+) or nonpermissive (E2-) conditions for 72 h, and the RNA expression levels were measured by qRT-PCR. RNA levels were first normalized to GAPDH. MYC ESE eRNA levels were shown relative to control TFF1 eRNA, which was set to 1. Error bar indicated SD of triplicate data from three independent experiments. Student's t test, *P < 0.01.
MYC ESE eRNAs Were EBNA2 Dependent.
The average EBNA2 ChIP-seq signal is ∼twofold higher at ESEs than ETEs (26). EBNA2 is tethered to cell DNA mostly through RBPJ (11). EBNA2 is similar to its cell counterpart, Notch, which induces RBPJ DNA binding (22). RBPJ ChIP-seq signals also distinguish ESEs from ETEs (26). Because EBNA2 ChIP-seq peaks mostly overlapped with MYC ESE eRNAs, we tested whether EBNA2 inactivation reduces MYC ESE eRNA levels. We used conditional EBNA2 LCLs wherein EBNA2 is fused to the hormone binding domain of a modified estrogen receptor hormone binding domain that is only responsive to 4-hydroxytamoxifen (4HT) (34). In the presence of 4HT, the LCLs grows normally, whereas in the absence of 4HT, EBNA2 is translocated to the cytoplasm, where it is degraded, causing the LCLs to stop growing. EBNA2HT LCLs were grown in the presence or absence of 4HT for 3 d. Total RNAs were prepared from these cells. qRT-PCR was used to quantitate the abundance of MYC −428 and −525 ESE eRNA from both positive and negative strands. EBNA2 inactivation significantly reduced these eRNA by ∼50% (P < 0.01) (Fig. 2B). These data indicate that EBNA2 can activate the expression of MYC ESE eRNAs.
shRNA Knockdown of MYC ESE eRNAs Reduced LCL Growth.
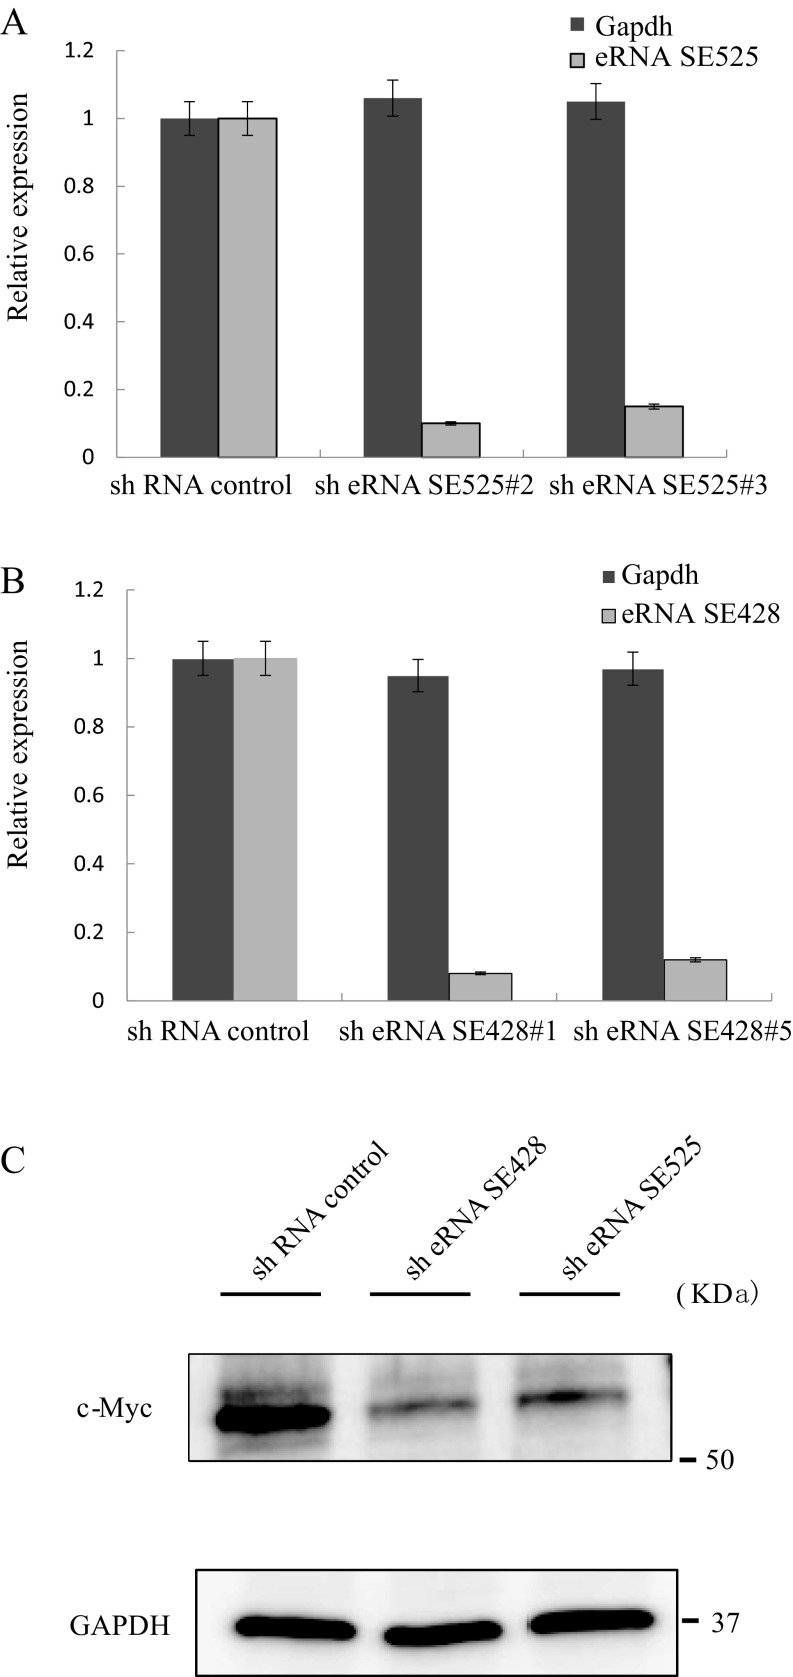
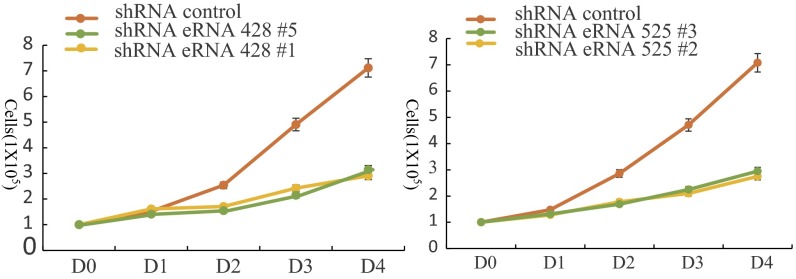
shRNA was used to knock down MYC ESE eRNAs to further assess their roles in LCL growth and survival. GM12878 LCLs were transduced with lentiviruses expressing two independent shRNAs targeting the MYC −428 and −525 ESE eRNAs. After lentivirus transduction, LCLs were selected with puromycin to eliminate untransduced cells. LCLs were then seeded at 1 × 10⁵/mL. Three days after the cells were seeded, total RNAs were prepared and qRT-PCR was used to determine the effect of shRNA knockdown on MYC −428 and −525 ESE eRNAs expression levels. shRNA knockdown reduced both −525 and −428 ESE eRNAs by >80% (Fig. S2A). Cell numbers were counted daily after seeding. LCLs transduced with the control nontargeting shRNA grew normally, doubling daily. LCLs transduced with shRNAs targeting the MYC −428 and −525 eRNA grew much slower (Fig. 3).
Fig. S2.
shRNA knockdown of ESE eRNAs decreases eRNA level and induces LCL growth arrest. (A) qRT-PCR was used to determine the levels of MYC ESE eRNAs following shRNA knockdown. qPCR was normalized against GAPDH, and the level in LCLs treated with shControl was set at 1. Error bars indicated SE. (B) Cell cycle distribution of LCLs transduced with control shRNA or shRNA targeting MYC ESE eRNAs. Three days after puromycin selection, cells were fixed and stained with propidium iodide. Cell cycle profiles were acquired by using FACS. (C) Western blot analysis of MYC expression in LCL cells treated with control shRNA or shRNA against SE428 or SE525 eRNA. GAPDH blotting was used as loading controls.
Fig. 3.
shRNA knockdown of MYC ESE eRNA reduces LCL growth. GM12878 LCLs were transduced with lentivirus shRNA targeting forward- or reverse-strand ESE eRNAs. After puromycin selection, cells were seeded at 1 × 10⁵/mL and counted daily.
We also evaluated the LCL cell cycle profile at day 3 following shRNA knockdown by propidium iodide (PI) staining and FACS analyses. MYC ESE eRNA shRNA knockdown reduced LCLs in S phase and increased LCLs in G1/G0 and G2 phase (Fig. S2B and Table S1), suggesting that MYC ESE eRNA are important LCL cell cycle progression. The growth arrest occurred in both in G1/G0 and G2 phase, similar to EBNA2 inactivation (10). MYC ESE eRNA shRNA knockdown also slightly increased the cells in sub-G1 phase.
Table S1.
shRNA knock down of ESE eRNA arrested LCLs in G1 and G2 phase
| shRNA constructs | G1% | S % | G2% | <G1% | >G2% |
| shRNA control | 47.9 | 35.1 | 14.3 | 1.46 | 1.07 |
| shRNA ESE428 | 60.5 | 17.4 | 18.4 | 2.14 | 1.82 |
| shRNA ESE 525 | 58.7 | 18.2 | 18.3 | 2.6 | 1.42 |
shRNA Knockdown of MYC ESE eRNA Reduced MYC Expression.
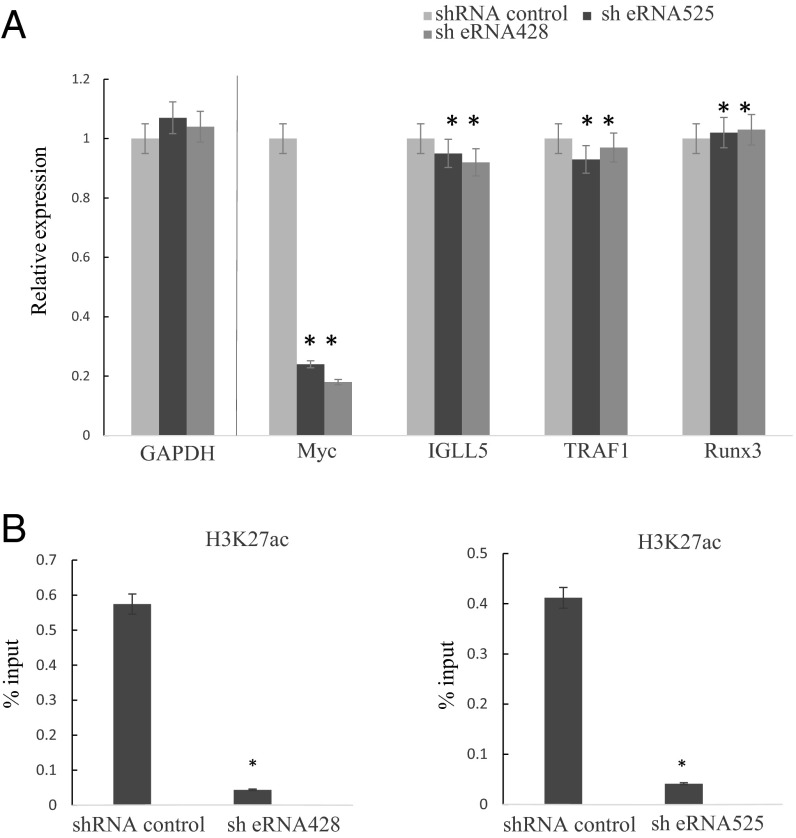
To determine whether MYC ESE eRNA knockdown caused LCL growth arrest is due to reduced MYC expression, qRT-PCR was used to evaluate MYC mRNA levels following MYC ESE eRNA knockdown. Three days after puromycin selection, MYC mRNA levels were determined by qRT-PCR. MYC −428 and −525 ESE eRNA knockdown significantly reduced MYC expression by >70% (P < 0.01) (Fig. 4A). In contrast, shRNA knockdown had no effect on a negative control, GAPDH, expression. MYC ESE shRNA knockdown also did not affect the expression of other ESE targets, including IGLL5, TRAF1, and RUNX3. This finding indicated that the MYC ESE eRNAs were specific for up-regulating their target, MYC. Western blot was used to determine the MYC protein levels after shRNA knockdown of MYC ESE eRNAs (Fig. S2C). shRNA knockdown also greatly reduced MYC protein level.
Fig. 4.
shRNA knockdown of MYC ESE eRNAs reduces MYC expression and ESE H3K27ac. (A) MYC mRNA expression levels from LCLs transduced with shRNA targeting MYC ESE eRNAs or control shRNA were determined by qRT-PCR. Expression levels were normalized against GAPDH, which were set to 1. (B) LCLs transduced with shRNA targeting MYC ESE eRNAs or control shRNA were fixed with 1% formaldehyde and lyzed. After sonication and dilution, lysates were precipitated with antibody against H3K27ac or control antibody overnight. Captured DNAs were reverse cross-linked and purified with Qiagen PCR purification column. qPCR was used to quantitate the precipitated DNA. A standard cure of input DNA was used to determine the enrichment. Error bar indicated SD from three experiments. *P < 0.05.
shRNA Knockdown of MYC ESE eRNA Reduced H3K27ac Signals at the MYC ESEs.
Because H3K27ac signals correlate with transcription, we examined the effect of eRNA knockdown on MYC ESE H3K27ac signals by ChIP-quantitative PCR (qPCR). Three days after puromycin selection following MYC ESE shRNA or control shRNA knockdown, ChIP assays were done by using antibody against H3K27ac or a control anti-HA antibody. qPCR with primers specific for the −525 and −428 MYC ESEs were used to quantitate immune precipitated DNA and were normalized against input control. H3K27ac ChIPed ∼0.6% and ∼0.4% of −428 and −525 ESE input DNA from control shRNA-treated cells. shRNA knockdown of −428 and −525 ESE eRNA reduced ESE H3K27ac signals by more than 80% (P < 0.05) (Fig. 4B). Anti-HA antibody ChIPed only background level DNA. These data indicate that MYC ESE eRNAs were important for maintaining high ESE H3K27ac levels and high enhancer activity.
shRNA Knockdown of MYC ESE eRNA Reduced MYC ESE Looping to the MYC TSS.
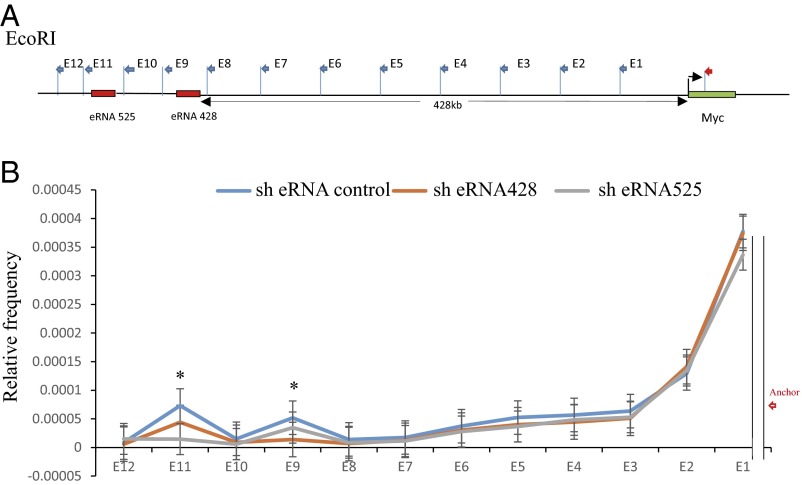
The MYC −428 and −525 ESEs loop to MYC TSS and up-regulate MYC expression as shown by chromatin conformation capture (3C), fluorescent in situ hybridization (FISH) (11), captured 3C followed by deep sequencing (C Hi-C) (35), and circularized chromatin conformation capture followed by deep-sequencing (4C-seq) (36) in LCLs. To determine whether the MYC ESE eRNAs are important for MYC ESE looping to the MYC TSS, 3C qPCR assays were done in LCLs transduced with control shRNA or shRNA targeting ESE eRNAs. LCLs were fixed with formaldehyde to cross-link protein–DNA or protein–protein complexes and then lyzed in lysis buffer. Cell lysates were digested with EcoRI. After extensive dilution, DNA fragments were ligated overnight. After reverse cross-linking, purified DNAs were amplified by qPCR with a fixed anchor primer (Fig. 5B, indicated in red) at the MYC TSS and 12 primers near EcoRI sites in the MYC enhancer, ranging from −60 to −565 kb upstream of MYC (Fig. 5A). The PCR efficiencies of different primer sets were normalized against BAC DNA. Primers nearest to the anchor had higher interaction frequencies and the interaction frequency was reduced to the background at the seventh and eighth primers. The interaction frequencies increased again at the −428 and −525 ESE and then fell to background levels again (Fig. 5B). The −525 ESE eRNA knockdown significantly reduced −525 ESE looping to the MYC TSS (P < 0.02) but had a slight effect on the −428 ESE looping to MYC TSS. Similarly, the −428 ESE eRNA knockdown greatly diminished the −428 ESE looping to MYC TSS (P < 0.02) with lesser effect on −525 ESE looping to MYC TSS. These data indicate that MYC ESE eRNAs are important for MYC ESE looping to MYC TSS (Fig. 5B).
Fig. 5.
shRNA knockdown of MYC ESE eRNAs reduces MYC ESEs looping to MYC TSS. (A) Illustration of the MYC locus and the positions of the primers used in chromatin conformation capture assays. The anchor primer was marked in red. (B) 3C analysis of the long-range interactions between the MYC TSS and MYC −428 and −525 ESEs. LCLs were first transduced with shRNA targeting MYC ESE eRNAs or shRNA control. LCLs transduced with shRNA lentiviruses were cross-linked, and the genomic DNAs were digested with EcoRI. The digested DNAs were ligated in diluted condition and treated with proteinase K. qPCR was used to quantitate the ligation products. The efficiencies of all of the primer pairs were normalized against the ligation products from BAC DNA covering the same genomic region. The relative frequency of ligation was determined by qPCR. Chimera DNA (ligation product) were measured by using an anchor primer near MYC TSS site and a set of primer spanning the whole genomic region (chromosome 8: 128176039–128680342). GAPDH was used to normalize the DNA from three different cells. The normalized interaction frequencies in LCLs depleted for −525 MYC ESE eRNA (black lines), - depleted for 428 MYC ESE eRNA (orange lines), or control shRNA-treated cells (blue line) are shown. The frequencies of interactions were determine from two independent experiments and measured in triplicates. Looping events were detected between the promoter regions and distal enhancer regions at E9 and E11 sites in control shRNA-treated cells. Error bar indicated SD. *P < 0.02.
Discussion
Super-enhancers (SEs) have critically important roles in differentiation, development, and oncogenesis. SEs frequently control oncogenes in tumors, and mutations in cancer genome can result in new SE formation (37, 38). EBV SEs are important for LCL growth and survival (26). Here, we identify eRNAs as an ESE constituent.
ESEs are co-occupied by many TFs, chromatin remodeling proteins, and basal TFs. The broad and high ESE H3K27ac and Pol II signals indicate high-level transcription at ESEs. The high phosphorylated Pol II Ser5 signals indicate efficient transcription elongation at ESEs. The presence of abundant eRNA transcripts from these ESEs was further validated by GRO-seq and qRT-PCR. In GRO-seq experiments, the nascent transcripts detected are usually short because the run-on lasts only 10 min. Therefore, it is difficult to fine map the eRNA transcription start and termination sites by using this assay. We tried to use Northern blots to determine the size of the MYC ESE eRNAs, and we could not detect specific signals. It is possible that the eRNAs are small and unstable, thus not readily detectable by conventional molecular biology assays.
eRNA can modestly enhance TF DNA binding through a “trapping” mechanism (28). YY1 can bind to both DNA and nascent RNA transcribed from enhancers (39). Inhibition of transcription can reduce YY1 DNA binding (28). EBV encoded small nonpolyadenylated RNA EBER2 can increase PAX5 binding to the EBV terminal repeat sequence (40). Another ESE constituent, SPI1, is also known to bind to both DNA and RNA (41). ESE eRNAs are likely to act similarly to facilitate or stabilize ESE formation. Arginine-rich motifs are known to bind RNA (42). The major EBV super-enhancer component, EBNA2, has an arginine-glycine repeat domain at amino acids 337–354. PolyG agarose beads efficiently bind to wild-type EBNA2 but not EBNA2 deleted for amino acids 337–354 (43), indicating that the EBNA2 arginine-glycine repeat can bind to RNAs. Therefore, it is highly likely that this domain can also interact with eRNAs.
We also find ESE eRNAs to be important for enhancer-promoter looping at the MYC locus. Enhancer-promoter looping allows enhancers from a distance to contact a promoter and enable assembly of large transcription activation complexes at promoters. DNA looping factors facilitate enhancer-promoter looping. Cohesin family members, e.g., RAD21, SMC2, and SMC3, are critically important for these loops. eRNAs can bind to RAD21 and stabilize enhancer-promoter looping (44). Both −525 and −428 MYC ESEs have significant ChIP-seq signals for RAD21. The MYC TSS also has significant RAD21 signals. Therefore, RAD21 can bring remote enhancers to the TSS of their target genes (45).
Because ESEs are much bigger enhancer clusters formed by large protein, DNA, and RNA complexes, they are more sensitive to perturbations. BRD4 inactivation had a much bigger impact on SEs than TEs (46). BRD4 inactivation also halted LCL growth and reduced ESE targeted MYC expression (26, 46). We now find that inactivation of the ESE constituent eRNA by shRNA greatly reduced LCL growth, suggesting that eRNAs are therapeutic targets. shRNAs, siRNAs, and locked nucleic acids can effectively degrade RNAs. Their applications to controlling EBV transformed cell growth should be further evaluated.
Experimental Procedures
Cell Culture and Treatment.
GM12878 LCLs, or conditional EBNA2HT LCLs, were grown in RPMI medium 1640 supplemented with 10% FBS, 2 mM l-glutamine with penicillin, and streptomycin. EBNA2HT LCLs were grown in the presence of 4-HT.
shRNA Knockdowns.
Oligos for shRNA targeting eRNAs were inserted into pLKO.1. vector. Lentivirus was prepared from 293T cells transfected with these plasmids and packaging plasmid and VSV-G pseudo typing plasmid. Virus-containing media was collected 48 h after transfection, passed through a 0.45-μm filter (Corning). One millimeter of the lentiviral supernatants were used to infect 6× 10⁵ LCL cells. Forty-eight hours after infection, cells were selected in 3 μg/mL puromycin for another 48 h. Cells were then seeded at 1 × 10⁵/mL in fresh media. Hairpin sequence are listed in Table S2.
Table S2.
shRNA sequence
| Target | shRNA sequence |
| eRNA428#1 | CCGGGCACACCTCATGCTTCCAACTCTCGAGAGTTGGAAGCATGAGGTGTGCTTTTTG |
| eRNA428#5 | CCGGTGTGCCGGATACCTCATATATCTCGAGATATATGAGGTATCCGGCACATTTTTG |
| eRNA525#2 | CCGGGCAAGTCCATAACCACTAACTCTCGAGAGTTAGTGGTTATGGACTTGCTTTTTG |
| eRNA525#3 | CCGGCTGAACCCTCAGTTTATAATACTCGAGTATTATAAACTGAGGGTTCAGTTTTTG |
RNA Isolation and qRT-PCR.
Three days after the cells were seeded in fresh media, total RNA were prepared by using TRIzol (Invitrogen). qRT-PCR was done by using Power SYBR Green RNA-to-CT1-Step Kit (Applied Biosystems) and normalized against GAPDH. qPCR primers are listed in Table S3.
Table S3.
Primers used for qRT-PCR assays
| Primer names | Primer sequences |
| Tff1 F1 sense strand | GTTTGTGACCCAGGCATCTT |
| Tff1 R1 sense strand | CAGGGTCCTGTCATTGTGTG |
| Tff1 F2 antisense strand | AGGGGATGTGTGTGAGAAGG |
| Tff1 R2 antisense strand | GCTTCGAGACAGTGGGAGTC |
| eRNA428 sense strand | GAAAGGAAGTGGGGGCTCTT |
| eRNA428 sense strand | AAGGGCTCAACAGTGAGTGC |
| eRNA428 antisense strand | ACCAAGCCTGATCACAGCAA |
| eRNA428 antisense strand | GAGCTGCACCCAGGACTTTA |
| eRNA525 sense strand | GCTCAGCTGGAGAAACAAAAAGAG |
| eRNA525 sense strand | TATCTGGGGGCAGATTACCCA |
| eRNA525 antisense strand | AATCAGACCTGGTAATTGGCCT |
| eRNA525 antisense strand | TTGCACTGGAGAAGATGGGTG |
| Myc F | AGAGTTTCATCTGCGACCCG |
| Myc R | AAGCCGCTCCACATACAGTC |
| GAPDH F | GCATCCTGGGCTACACTGAG |
| GAPDH R | GTCAAAGGTGGAGGAGTGGG |
| TRAF1 F | GATCCTCCTGTATGCTGGGC |
| TRAF1 R | ACTCTTCCTCCACCTGCTGA |
| RUNX3 F | CGTCTTCCTTTCCTCGTGCT |
| RUNX3 R | GCCCAAAGTGGGTACAGACA |
| Igll5 F | GACAGAGCCAATGGACTGGG |
| Igll5 R | ATTGGCCTTCAGGTTCAGGG |
GRO-seq Analysis and Visualization.
Gro-seq reads were mapped to the human genome hg19 by using bowtie with default parameters. The Sam file generated from mapping was then processed by samtools to create a sorted Bam file. The sorted Bam files were used to make a Bedgraph by running genomeCoverageBed–bg on sense or antisense strand separately. The BedGraph values were then divided by the number of million of mappable reads. The two files (both strands) were concatenated back together through igvtools sorting. Igvtools tile was used to create a TDF file for visualization.
Those transcripts >5 kb away from the 5′ or 3′ ends of annotated genes were defined as “intergenic transcripts.” eRNAs was identified based on the characters of intergenic transcripts (length <9 kb), which originated from both strands, produced in opposite directions as a divergent pair, or overlapped a transcript originating from one strand of DNA only (unpaired).
ChIP.
Cells (2 × 10⁶) were fixed with 1% formaldehyde for each ChIP assay. The cells were then lyzed, and lysates were sonicated. The soluble chromatin was diluted and incubated with 2-μg antibodies for H3K27ac (Abcam) or anti-HA as negative control (Abcam). Specific immunocomplexes were precipitated with protein A beads. Beads were extensively washed. After reverse cross-linking, DNA was purified by using QIAquick Spin columns (Qiagen). qPCR quantified the DNA from ChIP assay and normalized it to the percent of input DNA. Primers used are listed in Table S4.
Table S4.
Primers used for ChIP qPCR assays
| ChIP qPCR primer | Primer sequences |
| seRNA428 F | CATGACATGGCCCACAAGGT |
| seRNA428 R | CTAGCCTCATTCCTGCTCTCC |
| seRNA525 F | TGAACTGGTTTTGTCTGCCC |
| seRNA525 R | GTTGAGCTAGCACCCACCAC |
Chromatin Conformation Capture.
Cells were cross-linked with 1% formaldehyde for 10 min at room temperature. Fixed chromatin from 1 × 10⁷ cells was digested with 600 units of EcoRI (NEB) at 37 °C overnight. Ligation was done with incubation of 800 units of T4 DNA ligase (NEB) for 24 h at 16 °C. For each samples, 30 μL of proteinase K were added and reverse decross-linked at 65 °C overnight. DNA was then purified by phenol-chloroform extraction and ethanol precipitation. Then 3C products were quantified by qPCR.
For qPCR, the ΔCt method was used to analyze the data. GAPDH Ct values was used to normalize the difference between different cell lines. The quantities of the amplicons were normalized against BAC DNA. Primer sequences for qPCR are listed in Table S5.
Table S5.
Primers used for 3C assays
| 3c PCR primers-Myc | Primer sequences |
| E12-128176039 | GACACCTGTTGACCCAGATAGA |
| E11-128208831 | TCACCTACCTTCCCAGTCTCT |
| E10-128256336 | AGGGAAGAAATCCTATTAAGCCT |
| E9-128302776 | ACTCTAGCAGATGATTCTTTGTG |
| E8-128349689 | TCATGCACAAAGGAGGCAAT |
| E7-128391894 | GTTTACAATCTGGCCCCAAT |
| E6-128442095 | AACTGACACTCTGGTATATCTCCT |
| E5-128492229 | GGTGTCTTGGCTAGCTTAGC |
| E4-128538718 | AGAACTCAGGCTCAGAAAGC |
| E3-128587440 | AAACCCAGAAATCATGGAGGC |
| E2-128634265 | TTCCCAGTAGTGTCATCTAACATG |
| E1-128680342 | GTTTGTGTGGCATGCTGAAG |
| Anchor-128741351 | AAATTCTTCAGTTGACCCCCA |
Acknowledgments
We thank Dr. B. Gewurz for helpful discussions. E.K. is supported by National Cancer Institute (NCI) Grants R01CA047006, R01CA170023, and R01CA085180; E.K. and B.Z. are supported by National Institute of Allergy and Infectious Diseases Grant R01AI123420; and K.M.K. is supported by NCI Grant R01CA082036 and National Institute of Dental and Craniofacial Research Grants R01DE025208 and R01DE024971. H.Z. is a Leukemia and Lymphoma Society Fellow.
Footnotes
The authors declare no conflict of interest.
This article contains supporting information online at www.pnas.org/lookup/suppl/doi:10.1073/pnas.1616697113/-/DCSupplemental.
References
- 1.Epstein MA, Achong BG, Barr YM. Virus particles in cultured lymphoblasts from Burkitt’s Lymphoma. Lancet. 1964;1(7335):702–703. doi: 10.1016/s0140-6736(64)91524-7. [DOI] [PubMed] [Google Scholar]
- 2.Longnecker R, Kieff E, Cohen JI. 2013. Epstein-Barr Virus (Lippincott Williams & Wilkins, Philadelphia) 8th Ed, pp 1898–1959.
- 3.Cohen JI, Wang F, Mannick J, Kieff E. Epstein-Barr virus nuclear protein 2 is a key determinant of lymphocyte transformation. Proc Natl Acad Sci USA. 1989;86(23):9558–9562. doi: 10.1073/pnas.86.23.9558. [DOI] [PMC free article] [PubMed] [Google Scholar]
- 4.Hammerschmidt W, Sugden B. Genetic analysis of immortalizing functions of Epstein-Barr virus in human B lymphocytes. Nature. 1989;340(6232):393–397. doi: 10.1038/340393a0. [DOI] [PubMed] [Google Scholar]
- 5.Kaye KM, Izumi KM, Kieff E. Epstein-Barr virus latent membrane protein 1 is essential for B-lymphocyte growth transformation. Proc Natl Acad Sci USA. 1993;90(19):9150–9154. doi: 10.1073/pnas.90.19.9150. [DOI] [PMC free article] [PubMed] [Google Scholar]
- 6.Mannick JB, Cohen JI, Birkenbach M, Marchini A, Kieff E. The Epstein-Barr virus nuclear protein encoded by the leader of the EBNA RNAs is important in B-lymphocyte transformation. J Virol. 1991;65(12):6826–6837. doi: 10.1128/jvi.65.12.6826-6837.1991. [DOI] [PMC free article] [PubMed] [Google Scholar]
- 7.Tomkinson B, Robertson E, Kieff E. Epstein-Barr virus nuclear proteins EBNA-3A and EBNA-3C are essential for B-lymphocyte growth transformation. J Virol. 1993;67(4):2014–2025. doi: 10.1128/jvi.67.4.2014-2025.1993. [DOI] [PMC free article] [PubMed] [Google Scholar]
- 8.Alfieri C, Birkenbach M, Kieff E. Early events in Epstein-Barr virus infection of human B lymphocytes. Virology. 1991;181(2):595–608. doi: 10.1016/0042-6822(91)90893-g. [DOI] [PubMed] [Google Scholar]
- 9.Kaiser C, et al. The proto-oncogene c-myc is a direct target gene of Epstein-Barr virus nuclear antigen 2. J Virol. 1999;73(5):4481–4484. doi: 10.1128/jvi.73.5.4481-4484.1999. [DOI] [PMC free article] [PubMed] [Google Scholar]
- 10.Kempkes B, et al. B-cell proliferation and induction of early G1-regulating proteins by Epstein-Barr virus mutants conditional for EBNA2. EMBO J. 1995;14(1):88–96. doi: 10.1002/j.1460-2075.1995.tb06978.x. [DOI] [PMC free article] [PubMed] [Google Scholar]
- 11.Zhao B, et al. Epstein-Barr virus exploits intrinsic B-lymphocyte transcription programs to achieve immortal cell growth. Proc Natl Acad Sci USA. 2011;108(36):14902–14907. doi: 10.1073/pnas.1108892108. [DOI] [PMC free article] [PubMed] [Google Scholar]
- 12.Maruo S, et al. Epstein-Barr virus nuclear antigens 3C and 3A maintain lymphoblastoid cell growth by repressing p16INK4A and p14ARF expression. Proc Natl Acad Sci USA. 2011;108(5):1919–1924. doi: 10.1073/pnas.1019599108. [DOI] [PMC free article] [PubMed] [Google Scholar]
- 13.Skalska L, White RE, Franz M, Ruhmann M, Allday MJ. Epigenetic repression of p16(INK4A) by latent Epstein-Barr virus requires the interaction of EBNA3A and EBNA3C with CtBP. PLoS Pathog. 2010;6(6):e1000951. doi: 10.1371/journal.ppat.1000951. [DOI] [PMC free article] [PubMed] [Google Scholar]
- 14.Skalska L, et al. Induction of p16(INK4a) is the major barrier to proliferation when Epstein-Barr virus (EBV) transforms primary B cells into lymphoblastoid cell lines. PLoS Pathog. 2013;9(2):e1003187. doi: 10.1371/journal.ppat.1003187. [DOI] [PMC free article] [PubMed] [Google Scholar]
- 15.Cahir-McFarland ED, Davidson DM, Schauer SL, Duong J, Kieff E. NF-kappa B inhibition causes spontaneous apoptosis in Epstein-Barr virus-transformed lymphoblastoid cells. Proc Natl Acad Sci USA. 2000;97(11):6055–6060. doi: 10.1073/pnas.100119497. [DOI] [PMC free article] [PubMed] [Google Scholar]
- 16.Wang F, Kikutani H, Tsang SF, Kishimoto T, Kieff E. Epstein-Barr virus nuclear protein 2 transactivates a cis-acting CD23 DNA element. J Virol. 1991;65(8):4101–4106. doi: 10.1128/jvi.65.8.4101-4106.1991. [DOI] [PMC free article] [PubMed] [Google Scholar]
- 17.Wang F, Tsang SF, Kurilla MG, Cohen JI, Kieff E. Epstein-Barr virus nuclear antigen 2 transactivates latent membrane protein LMP1. J Virol. 1990;64(7):3407–3416. doi: 10.1128/jvi.64.7.3407-3416.1990. [DOI] [PMC free article] [PubMed] [Google Scholar]
- 18.Grossman SR, Johannsen E, Tong X, Yalamanchili R, Kieff E. The Epstein-Barr virus nuclear antigen 2 transactivator is directed to response elements by the J kappa recombination signal binding protein. Proc Natl Acad Sci USA. 1994;91(16):7568–7572. doi: 10.1073/pnas.91.16.7568. [DOI] [PMC free article] [PubMed] [Google Scholar]
- 19.Ling PD, Rawlins DR, Hayward SD. The Epstein-Barr virus immortalizing protein EBNA-2 is targeted to DNA by a cellular enhancer-binding protein. Proc Natl Acad Sci USA. 1993;90(20):9237–9241. doi: 10.1073/pnas.90.20.9237. [DOI] [PMC free article] [PubMed] [Google Scholar]
- 20.Tong X, Wang F, Thut CJ, Kieff E. The Epstein-Barr virus nuclear protein 2 acidic domain can interact with TFIIB, TAF40, and RPA70 but not with TATA-binding protein. J Virol. 1995;69(1):585–588. doi: 10.1128/jvi.69.1.585-588.1995. [DOI] [PMC free article] [PubMed] [Google Scholar]
- 21.Harada S, Kieff E. Epstein-Barr virus nuclear protein LP stimulates EBNA-2 acidic domain-mediated transcriptional activation. J Virol. 1997;71(9):6611–6618. doi: 10.1128/jvi.71.9.6611-6618.1997. [DOI] [PMC free article] [PubMed] [Google Scholar]
- 22.Portal D, et al. EBV nuclear antigen EBNALP dismisses transcription repressors NCoR and RBPJ from enhancers and EBNA2 increases NCoR-deficient RBPJ DNA binding. Proc Natl Acad Sci USA. 2011;108(19):7808–7813. doi: 10.1073/pnas.1104991108. [DOI] [PMC free article] [PubMed] [Google Scholar]
- 23.Jiang S, et al. Epstein-Barr virus nuclear antigen 3C binds to BATF/IRF4 or SPI1/IRF4 composite sites and recruits Sin3A to repress CDKN2A. Proc Natl Acad Sci USA. 2014;111(1):421–426. doi: 10.1073/pnas.1321704111. [DOI] [PMC free article] [PubMed] [Google Scholar]
- 24.Ohashi M, et al. The EBNA3 family of Epstein-Barr virus nuclear proteins associates with the USP46/USP12 deubiquitination complexes to regulate lymphoblastoid cell line growth. PLoS Pathog. 2015;11(4):e1004822. doi: 10.1371/journal.ppat.1004822. [DOI] [PMC free article] [PubMed] [Google Scholar]
- 25.Schmidt SC, et al. Epstein-Barr virus nuclear antigen 3A partially coincides with EBNA3C genome-wide and is tethered to DNA through BATF complexes. Proc Natl Acad Sci USA. 2015;112(2):554–559. doi: 10.1073/pnas.1422580112. [DOI] [PMC free article] [PubMed] [Google Scholar]
- 26.Zhou H, et al. Epstein-Barr virus oncoprotein super-enhancers control B cell growth. Cell Host Microbe. 2015;17(2):205–216. doi: 10.1016/j.chom.2014.12.013. [DOI] [PMC free article] [PubMed] [Google Scholar]
- 27.Kim TK, et al. Widespread transcription at neuronal activity-regulated enhancers. Nature. 2010;465(7295):182–187. doi: 10.1038/nature09033. [DOI] [PMC free article] [PubMed] [Google Scholar]
- 28.Sigova AA, et al. Transcription factor trapping by RNA in gene regulatory elements. Science. 2015;350(6263):978–981. doi: 10.1126/science.aad3346. [DOI] [PMC free article] [PubMed] [Google Scholar]
- 29.Pnueli L, Rudnizky S, Yosefzon Y, Melamed P. RNA transcribed from a distal enhancer is required for activating the chromatin at the promoter of the gonadotropin α-subunit gene. Proc Natl Acad Sci USA. 2015;112(14):4369–4374. doi: 10.1073/pnas.1414841112. [DOI] [PMC free article] [PubMed] [Google Scholar]
- 30.Yu M, et al. RNA polymerase II-associated factor 1 regulates the release and phosphorylation of paused RNA polymerase II. Science. 2015;350(6266):1383–1386. doi: 10.1126/science.aad2338. [DOI] [PMC free article] [PubMed] [Google Scholar]
- 31.Core LJ, et al. Analysis of nascent RNA identifies a unified architecture of initiation regions at mammalian promoters and enhancers. Nat Genet. 2014;46(12):1311–1320. doi: 10.1038/ng.3142. [DOI] [PMC free article] [PubMed] [Google Scholar]
- 32.Robinson JT, et al. Integrative genomics viewer. Nat Biotechnol. 2011;29(1):24–26. doi: 10.1038/nbt.1754. [DOI] [PMC free article] [PubMed] [Google Scholar]
- 33.Itzen F, Greifenberg AK, Bösken CA, Geyer M. Brd4 activates P-TEFb for RNA polymerase II CTD phosphorylation. Nucleic Acids Res. 2014;42(12):7577–7590. doi: 10.1093/nar/gku449. [DOI] [PMC free article] [PubMed] [Google Scholar]
- 34.Zhao B, et al. RNAs induced by Epstein-Barr virus nuclear antigen 2 in lymphoblastoid cell lines. Proc Natl Acad Sci USA. 2006;103(6):1900–1905. doi: 10.1073/pnas.0510612103. [DOI] [PMC free article] [PubMed] [Google Scholar]
- 35.Mifsud B, et al. Mapping long-range promoter contacts in human cells with high-resolution capture Hi-C. Nat Genet. 2015;47(6):598–606. doi: 10.1038/ng.3286. [DOI] [PubMed] [Google Scholar]
- 36.Wood CD, et al. MYC activation and BCL2L11 silencing by a tumour virus through the large-scale reconfiguration of enhancer-promoter hubs. eLife. 2016;5:5. doi: 10.7554/eLife.18270. [DOI] [PMC free article] [PubMed] [Google Scholar]
- 37.Whyte WA, et al. Master transcription factors and mediator establish super-enhancers at key cell identity genes. Cell. 2013;153(2):307–319. doi: 10.1016/j.cell.2013.03.035. [DOI] [PMC free article] [PubMed] [Google Scholar]
- 38.Mansour MR, et al. Oncogene regulation. An oncogenic super-enhancer formed through somatic mutation of a noncoding intergenic element. Science. 2014;346(6215):1373–1377. doi: 10.1126/science.1259037. [DOI] [PMC free article] [PubMed] [Google Scholar]
- 39.Jeon Y, Lee JT. YY1 tethers Xist RNA to the inactive X nucleation center. Cell. 2011;146(1):119–133. doi: 10.1016/j.cell.2011.06.026. [DOI] [PMC free article] [PubMed] [Google Scholar]
- 40.Lee N, Moss WN, Yario TA, Steitz JA. EBV noncoding RNA binds nascent RNA to drive host PAX5 to viral DNA. Cell. 2015;160(4):607–618. doi: 10.1016/j.cell.2015.01.015. [DOI] [PMC free article] [PubMed] [Google Scholar]
- 41.Hallier M, Tavitian A, Moreau-Gachelin F. The transcription factor Spi-1/PU.1 binds RNA and interferes with the RNA-binding protein p54nrb. J Biol Chem. 1996;271(19):11177–11181. doi: 10.1074/jbc.271.19.11177. [DOI] [PubMed] [Google Scholar]
- 42.Bayer TS, Booth LN, Knudsen SM, Ellington AD. Arginine-rich motifs present multiple interfaces for specific binding by RNA. RNA. 2005;11(12):1848–1857. doi: 10.1261/rna.2167605. [DOI] [PMC free article] [PubMed] [Google Scholar]
- 43.Tong X, Yalamanchili R, Harada S, Kieff E. The EBNA-2 arginine-glycine domain is critical but not essential for B-lymphocyte growth transformation; the rest of region 3 lacks essential interactive domains. J Virol. 1994;68(10):6188–6197. doi: 10.1128/jvi.68.10.6188-6197.1994. [DOI] [PMC free article] [PubMed] [Google Scholar]
- 44.Li W, et al. Functional roles of enhancer RNAs for oestrogen-dependent transcriptional activation. Nature. 2013;498(7455):516–520. doi: 10.1038/nature12210. [DOI] [PMC free article] [PubMed] [Google Scholar]
- 45.Zhang N, et al. A handcuff model for the cohesin complex. J Cell Biol. 2008;183(6):1019–1031. doi: 10.1083/jcb.200801157. [DOI] [PMC free article] [PubMed] [Google Scholar]
- 46.Chapuy B, et al. Discovery and characterization of super-enhancer-associated dependencies in diffuse large B cell lymphoma. Cancer Cell. 2013;24(6):777–790. doi: 10.1016/j.ccr.2013.11.003. [DOI] [PMC free article] [PubMed] [Google Scholar]
- 47.Lai F, Gardini A, Zhang A, Shiekhattar R. Integrator mediates the biogenesis of enhancer RNAs. Nature. 2015;525(7569):399–403. doi: 10.1038/nature14906. [DOI] [PMC free article] [PubMed] [Google Scholar]


