


Abstract
Interest to the left-handed DNA conformation has been recently boosted by the findings that a number of proteins contain the Zα domain, which has been shown to specifically recognize Z-DNA. The biological function of Zα is presently unknown, but it has been suggested that it may specifically direct protein regions of Z-DNA induced by negative supercoiling in actively transcribing genes. Many studies, including a crystal structure in complex with Z-DNA, have focused on the human ADAR1 Zα domain in isolation. We have hypothesized that the recognition of a Z-DNA sequence by the ZαADAR1 domain is context specific, occurring under energetic conditions, which favor Z-DNA formation. To test this hypothesis, we have applied atomic force microscopy to image ZαADAR1 complexed with supercoiled plasmid DNAs. We have demonstrated that the ZαADAR1 binds specifically to Z-DNA and preferentially to d(CG)n inserts, which require less energy for Z-DNA induction compared to other sequences. A notable finding is that site-specific Zα binding to d(GC)13 or d(GC)2C(GC)10 inserts is observed when DNA supercoiling is insufficient to induce Z-DNA formation. These results indicate that ZαADAR1 binding facilities the B-to-Z transition and provides additional support to the model that Z-DNA binding proteins may regulate biological processes through structure-specific recognition.
INTRODUCTION
Left-handed Z-DNA is a high-energy conformation of DNA that can form in alternating purine–pyrimidine (RY) tracts under conditions of negative supercoiling (1–3). The level of supercoiling required to form Z-DNA depends on the sequence and length of the RY tract (4). Sequences of alternating d(C–G) form Z-DNA most easily, while runs of d(A–T) and sequences without purine–pyrimidine repeats form Z-DNA poorly. Although ∼50% of supercoils in Escherichia coli cells are restrained by wrapping DNA around histone-like proteins, sufficient supercoiling exists to maintain a high constitutive percentage of Z-DNA-forming sequences as Z-DNA (5–9). The percentage of Z-DNA can be modulated by varying the level of DNA supercoiling that can occur during transcription (3,6,7). Experiments using permeabilized nuclei have also demonstrated the transcription-dependent formation of Z-DNA in eukaryotic cells (10,11).
A group of proteins which specifically recognize Z-DNA have recently been identified. The human RNA-editing enzyme dsRNA adenosine deaminase (ADAR1) was the first protein identified to interact with Z-DNA (12). The N-terminus of ADAR1 contains a bipartite domain termed Zαβ, which has been shown to specifically interact with left-handed nucleic acids. Zαβ is composed of two homologous domains of ∼80 amino acids, Zα and Zβ, which are separated by a tandem-repeated 49 amino acid linker (13). The ADAR1 Zα subdomain (the isolated domain is designated ZαADAR1) has been extensively studied, and a crystal structure of ZαADAR1 complexed with a Z-DNA fragment has elucidated the details of the interaction (14). It is hypothesized that during transcription, the DNA is driven into the Z-conformation by the increased negative supercoiling and this recruits or facilitates binding of ADAR1. Thus, localized to the site of message production, ADAR1 could edit the nascent RNA transcript (15). ZαADAR1 has been shown to also interact with left-handed Z-RNA; it has been hypothesized that ADAR1 might recognize left-handed Z-RNA in the cytoplasm of virally infected cells for a role in hypermutation, a cellular viral defense mechanism (8).
Since the discovery of the Zα domain, this motif has been identified in two other classes of proteins. The mouse and human tumor stroma and activated macrophage proteins, DLM-1, have Zα and Zβ domains, similar to ADAR1 (16). The function of DLM-1 is presently unclear, but a crystal structure study has shown that the ZαDLM1 domain is nearly identical to ZαADAR1 and interacts with Z-DNA (17). Additionally, a number of orthopox viruses (vaccinia, variola, orf and yabba) encode a 25 kDa protein known as E3, which contains the Zα domain (18). E3's function is to antagonize the interferon-induced protein kinase, PKR, during viral infections and attenuate the interferon response. An NMR structure of ZαE3L has confirmed that this domain is also similar to the archetypal ZαADAR1 (19). Functional studies have shown that ZαE3L interacts with left-handed nucleic acids, and this recognition may have a role in its inhibitory effects on the interferon system (20).
We have previously studied the interaction between negatively supercoiled DNA and the Zα peptide and demonstrated high-affinity binding of dimeric ZαADAR1 to Z-DNA (21). Plasmid pDHg16 containing a d(CG)13 insert shows unwinding of the DNA helix when complexed with ZαADAR1 peptide, which is consistent with the decrease in plasmid electrophoretic mobility. At the highest concentration of ZαADAR1 (2.3 μM), there is a dramatic drop in DNA supercoiling. These effects correlate with Zα-induced changes in the winding number of the plasmid DNA. This observation supports a model where the Z-DNA binding domains target ADAR1 to regions of negative supercoiling in actively transcribing genes. In this situation, Zα binding would be dependent upon the local level of negative superhelicity rather than the presence of any particular sequence. It suggests that the targeting of ADAR1 to a gene is most likely to occur when levels of negative supercoiling are sufficient to initiate Z-DNA formation, and is less likely to depend on the affinity of ADAR1 for a particular sequence. Studies on B-DNA-binding proteins have focused on sequence-specific recognition. In contrast, the binding of ZαADAR1 depends solely upon the conformational properties of a particular sequence rather than its precise base composition. Thus, recognition of a sequence by ZαADAR1 is context specific, occurring under energetic conditions that favor Z-DNA formation.
To test this hypothesis, we have performed a systematic study on the interaction of the ZαADAR1 peptide with supercoiled plasmid DNA. We have demonstrated that ZαADAR1 binds specifically to Z-DNA and preferentially to d(CG)n inserts, which require less energy for Z-DNA induction, compared to other sequences. Topoisomers of two plasmids with d(GC)13 and d(GC)2C(GC)10 inserts were used to vary negative supercoiling energy. A notable finding is that site-specific ZαADAR1 binding to the d(GC)13 or d(GC)2C(GC)10 inserts is observed when DNA supercoiling is insufficient to induce Z-DNA formation. These results indicate that ZαADAR1-binding facilities the B-to-Z transition. These findings also suggest that the potential regulation of biological processes by ZαADAR1 takes place through the recognition of specific conformations rather than defined nucleotide sequences.
MATERIALS AND METHODS
Plasmid DNA
All plasmids were pUC8 derivatives. Plasmid pFA6 (control) contains a diametrically placed 106 bp inverted repeat and a 106 bp A-tract (22) and was used for creating plasmids pZC6 and pZA6. Plasmid pZC6 (∼3.3 kb) was created from plasmid pFA6 by replacing the 106 bp A-tract with a d(GC)2C(GC)10 insert. As a result, it contains a 106 bp inverted repeat in the EcoRI site of the polylinker, and a d(GC)2C(GC)10 insert diametrically opposite this site. Plasmid pZA6 was made from plasmid pFA6 by replacing the 106 bp inverted repeat with a d(GC)13 insert. As a result, it contains a d(GC)13 insert in the EcoRI site of the polylinker, and a 106 bp A-tract at a diametrically opposite location in the plasmid. The constructs are schematically shown in Figure 1 and indicate the insertion sites for the Z-DNA-forming sequences, as well as the sequence of the inverted repeat which forms the cruciform. Topoisomer samples of specific superhelical densities were generated by incubating supercoiled plasmids with topoisomerase extracted from HeLa cells in the presence of eight different concentrations of ethidium bromide (EtBr). Such samples contain six to seven topoisomers and thus are characterized by a mean supercoiling density (<σ>) or mean linking number difference (<ΔLk>). These parameters are given in Table 1.
Figure 1.
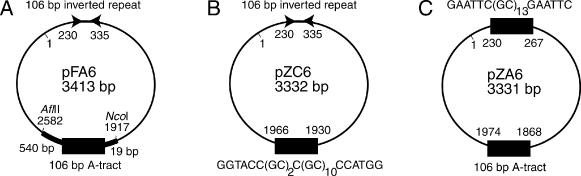
Positioning of the DNA structural elements in the supercoiled plasmids. (A) Parental plasmid pFA6 (22) which is used as a control contains a 106 bp inverted repeat including terminal EcoRI sites (GAATTCCCAA TTGATAGTGG TAAAACTACA TTAGCAGAGG GGCCCGATAT TTATAAATAT CGGGCCCCTC TGCTAATGTA GTTTTACCAC TATCAATTGG GAATTC) between nucleotide positions 230 and 335. A fragment of plasmid pA5N5i (42) has been cloned between the AflII and NcoI sites so that a106 bp permanently curved A-tract sequence is placed exactly opposite to the cruciform-forming inverted repeat. (B) A cruciform and Z-DNA-forming plasmid pZC6 was created from pFA6 by replacing the 106 bp A-tract between the BamHI and NsiI sites with a Z-DNA-forming sequence, (GC)2C(GC)10. (C) Plasmid pZA6 is capable of forming the Z-DNA structure diametrically opposite the curved A-tract and was created by replacing the inverted repeat sequence between the EcoRI sites with a Z-DNA-forming sequence (GC)13. The nucleotide positions of the key structural elements are indicated.
Table 1. Mean values of the linking numbers differences (<−ΔLk>) and supercoiling densities (<−σ>) for topoisomer samples t0 to t7 of plasmids pZC6 and pZA6.
| Sample | pZC6 | pZA6 | ||
|---|---|---|---|---|
| <−ΔLk> | <−σ> | <−ΔLk> | <−σ> | |
| t0 | 0 | 0 | 0 | 0 |
| t1 | 4 | 0.013 | 4 | 0.013 |
| t2 | 8 | 0.025 | 8 | 0.025 |
| t3 | 12 | 0.038 | 12 | 0.038 |
| t4 | 15 | 0.048 | 16 | 0.05 |
| t5 | 19 | 0.06 | 20 | 0.063 |
| t6 | 22 | 0.069 | 23 | 0.073 |
| t7 | 25 | 0.079 | 26 | 0.085 |
Two-dimensional agarose gels
Cruciform and Z-DNA formation were detected by a two-dimensional (2D) agarose gel analyses. A mixture of eight topoisomer samples (2 μg) was pre-incubated at 50°C in Topo-TAE buffer (40 mM Tris–HCl, pH 8.3, 5 mM NaOAc and 1 mM EDTA) for 2 h to promote complete structural transitions, and then loaded onto a 1.5% agarose gel. The sample was run for 24 h in the first direction at 4.6 V/cm in Topo-TAE buffer at 4°C. Afterwards, the gel was soaked for 4 h in Topo-TAE buffer containing 10 μg/ml of chloroquine and run in the second direction at ∼21°C (room temperature) for 19 h at 4.1 V/cm. Finally, the gel was soaked in water to remove the chloroquine, stained with EtBr and photographed.
Protein expression and purification
Recombinant ZαADAR1 (residues L133–G209 of human ADAR1) was cloned, expressed and purified as described previously (13) with minor modifications. Briefly, an N-terminal (His)6-tagged construct of the protein was expressed from plasmid pET28a in NovaBlue(DE3) E.coli (Novagen) by isopropyl-β-d-thiogalactopyranoside induction, and after 3 h the cells were harvested by centrifugation and lysed using a French pressure cell. The resulting lysate was centrifuged for 30 min at 25 000 g, and the supernatant solution incubated with 7 ml of Ni-NTA resin (Qiagen) for ∼30 min. Following this incubation, the resin was collected by centrifugation and was batch washed three times with Buffer A [20 mM Tris–HCl, pH 8, 150 mM NaCl, 10 mM imidazole and 1 mM phenylmethylsulfonyl fluoride (PMSF)] and transferred to a 20 × 1 cm disposable column. The resin was washed with approximately 5 column volumes of Buffer B (20 mM Tris–HCl, pH 8, 1 M NaCl 10 mM imidazole and 1 mM PMSF), Buffer C (20 mM Tris–HCl, pH 8, 150 mM NaCl, 30 mM imidazole and 1 mM PMSF) and the protein eluted with Buffer D (20 mM Tris–HCl, pH 8, 150 mM NaCl, 200 mM imidazole and 1 mM PMSF). The elution fractions were analyzed by SDS–PAGE, pooled and dialyzed overnight against 20 mM HEPES, pH 7.5, 20 mM NaCl, 1 mM EDTA at 4°C in the presence of thrombin, which cleaves the (His)6 tag. The resulting dialysate was then loaded onto a Mono-S HR5/5 cation exchange column (Amersham Biosciences) and eluted with a linear gradient of NaCl from (20 mM to 0.5 M) in 20 mM HEPES (pH 7.5). The resulting fractions were pooled, concentrated and dialyzed into 10 mM HEPES, pH 7.5, 20 mM NaCl, and quantitated, then stored at −20°C. ZαADAR1 (formerly called Zα77) has a molecular weight of 8987 g/mol.
Reaction
Fifty nanograms of plasmid DNAs was incubated for 15 min with 107 ng of Zα peptide in 5 μl of HEN-200 buffer (10 mM HEPES, pH 7.9, 1 mM EDTA and 200 mM NaCl) at room temperature (DNA/ZαADAR1 peptide molar ratio of 1:500). The reaction was mixed 1:1 (v/v) with 0.2% glutaraldehyde in HEN-200 buffer. Following 15 min incubation, the reaction was terminated by a 10- to 15-fold dilution into TEN-200 buffer (10 mM Tris–HCl, pH 7.6, 1 mM EDTA and 200 mM NaCl,) and then deposited onto aminopropyl silatrane (APS)-mica. Control samples were prepared similarly, without ZαADAR1 peptide. A separate negative control was performed in the presence of ZαADAR1 with plasmid pFA6, which has the inverted repeat and A-tract inserts but lacks any d(GC)n sequence.
Atomic force microscopy
The mica surface was modified with 167 μM solution of APS in water prior to sample deposition. Procedures for mica modification and sample deposition have been described previously (23,24). Briefly, DNA samples (3–5 μl) were placed onto APS-mica for 2 min, and the mica was rinsed with deionized water (Continental Water System Co., San Antonio, TX) and dried with argon. Images were acquired in air using a MultiMode SPM NanoScope III system (Veeco/Digital Instruments, Santa Barbara, CA) operating in the tapping mode using TappingMode Etched Silicon Probes (TESP probes) (Veeco/Digital Instruments, Inc.). Images were processed and measurements were performed with the Femtoscan software (Advanced Technologies Center, Moscow, Russia).
RESULTS AND DISCUSSION
Plasmid design and Z-DNA formation
Two different plasmid designs were used and are schematically shown in Figure 1. In plasmid pZC6, the sequence d(GC)2C(GC)10 was inserted diametrically opposite to a 106 bp inverted repeat which forms a cruciform at low superhelical density (7). The cruciform serves as a convenient marker for mapping the ZαADAR1-binding position in the plasmid. However, cruciform extrusion removes about 10 negative supercoils from the DNA and must be taken into consideration when calculating superhelical density (7,25,26). Another plasmid, pZA6, has d(GC)13 inserted diametrically opposite to an intrinsically curved DNA region consisting of phased A5-tracts, d(CGCGGCAAAAACGGCCAAAAA), instead of the inverted repeat. This strongly curved sequence occupies an apical location in supercoiled DNA and promotes organization of DNA into a plectonemic supercoil (22). Analyses using 2D agarose gel electrophoresis showed that Z-DNA formation occurs in both plasmids. In plasmid pZA6, a clear discontinuity in the mobility of topoisomers occurs at ΔLk = −12 (σ = −0.038) (Figure 2A). The relaxation of 4.2 superhelical turns in topoisomer −12 corresponds to the transition of d(GC)13 from B-DNA into the left-handed Z conformation (27). Actually, the expected level of relaxation is 4.6 turns. Considering the unwinding retardation in topoisomer −13 (or −14), 5.2 turns have been unwound. These values are consistent with the B-to-Z transition and the additional unwinding in topoisomer −13 may represent additional unwinding at the B–Z junctions. The 2D gel pattern for topoisomers of pZC6 is more complex (Figure 2B). This plasmid contains 106 bp of inverted repeat, which forms a cruciform extrusion at ΔLk = −11, removing about 10 negative superhelical turns. The second transition occurs at ΔLk = −23 (σ = −0.075) which corresponds to the transition into the Z-form, when negative supercoiling re-accumulates. The later transition removes about four superhelical turns in plasmid pZC6, which is consistent with the B-to-Z transition in the d(GC)2C(GC)10 insert.
Figure 2.
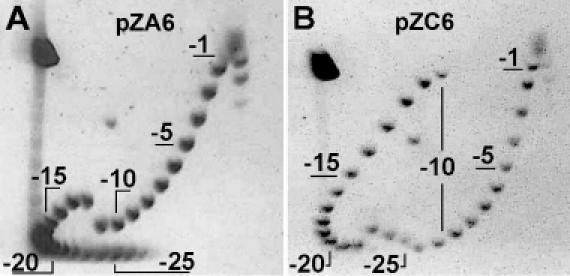
Two-dimensional electrophoresis of plasmid topoisomers: (A) pZA6, (B) pZC6. Eight topoisomer samples were mixed and pre-incubated for 2 h at 50°C in Topo-TAE buffer (see text for details) before loading onto a 1.5% agarose gel. The gel was run at 4°C for 24 h at 4.6 V/cm in first dimension, soaked for 4 h in Topo-TAE buffer with 10 μg/ml chloroquine and run in the second dimension at room temperature for 19 h at 4.1 V/cm. A few individual topoisomers are numbered.
ZαADAR1 binding detected by atomic force microscopy
Zα binds specifically to the Z-DNA segment
Atomic force microscopy (AFM) studies were performed with preparations of topoisomer samples of plasmids pZC6 and pZA6 with various mean supercoiling densities (see Table 1 and Materials and Methods for details). Plasmids were incubated with an excess of ZαADAR1 peptide (1:500 molar ratio of DNA/protein) and then fixed with 0.1% glutaraldehyde before deposition on APS-mica. Control samples were prepared in the same manner but without the ZαADAR1 protein. Topoisomer samples, with superhelical density sufficient to initiate the B-to-Z-DNA transition in the d(GC)n inserts of pZC6 and pZA6, were used to verify the recognition of Z-DNA by ZαADAR1 peptide. AFM images of pZA6 sample t5 (<σ> = −0.063) and pZC6 sample t7 (<σ> = −0.079) incubated with ZαADAR1 are shown in Figure 3A and D, respectively. The common feature of these images is the appearance of bright ‘blobs’ (denoted with short wide arrows). These features are often elongated and are not due to the intersections of DNA strands in supercoiled plasmids. These blobs were not observed in control samples prepared in the absence of the ZαADAR1 peptide (data not shown). They were also not observed with plasmid pFA6, which does not contain a Z-DNA-forming region, nor with samples t0 (mean ΔLk = 0), in the presence of ZαADAR1. Such samples typically had no protein bound or have multiple small blobs as shown in Figure 3B. Collectively, these results indicate that the elongated blobs are the ZαADAR1 proteins bound to Z-DNA. Importantly, only one blob per plasmid was formed, suggesting that ZαADAR1 has only one recognition site per plasmid, presumably the d(GC)n insert. ZαADAR1-targeting of the d(GC)2C(GC)10 insert in plasmid pZC6 was confirmed by the measurements of the distance between the cruciform and the position of the blob. The contour length of DNA strand could be traced rather easily in this sample because most of the DNA supercoils are removed after cruciform extrusion and the B-to-Z transition is initiated by interaction with ZαADAR1. The histogram for sample t5 of plasmid pZC6 (Figure 4) shows that the distance between the central position of cruciform and the position of DNA–peptide complex in both directions is the same (504 ± 27 nm, n = 30 molecules) indicating that the recognition site is diametrically opposite the inverted repeat and thus coincides with the position of the d(GC)2C(GC)10 insert.
Figure 3.
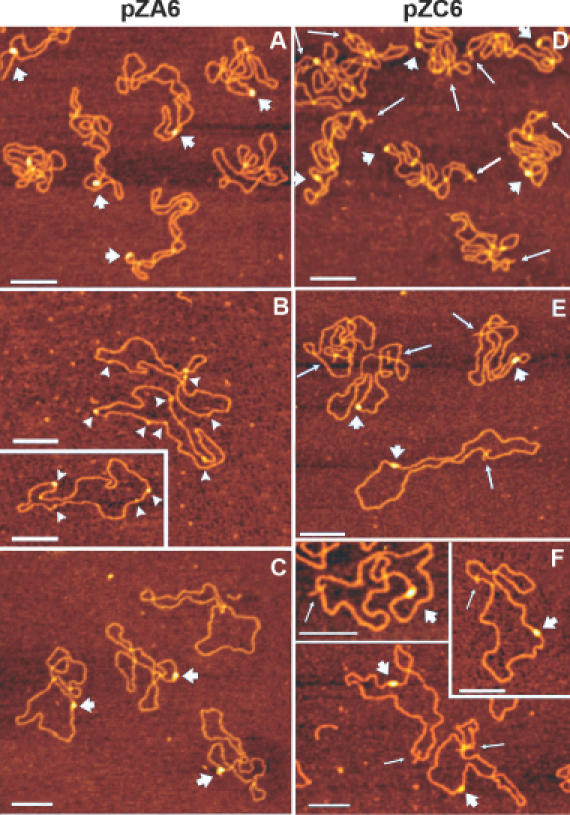
AFM images of topoisomer samples t5 (A), t0 (B) and t2 (C) of plasmid pZA6 and samples t7 (D), t5 (E) and t4 (F) of plasmid pZC6 after incubation with the ZαADAR1 protein. Short wide arrows show the position of specific ZαADAR1–Z-DNA complexes, and long narrow arrows show the position of cruciform in plasmid pZC6. Arrowheads in plate B are pointed to non-specific complexes of ZαADAR1 with the least supercoiled DNA (sample t0) seen as small blobs. Bars are100 nm on all images.
Figure 4.
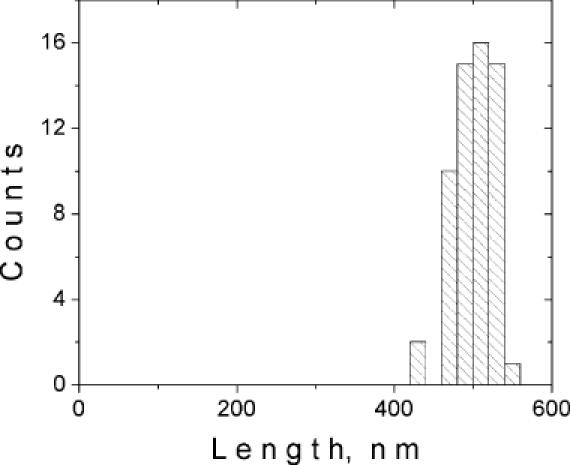
The distribution of distances, measured in both directions, between the ZαADAR1–DNA complex and cruciform in molecules of sample t5 plasmid pZC6. Measurements are carried out for a total of 30 molecules. The mean distance is 504 ± 26 nm and the contour length of the whole plasmid is ∼1 μm without cruciform arms.
Evaluation of the molecular mass of the ZαADAR1 complex with DNA was carried out using streptavidin as an internal standard (28). Measurement of the volume for the DNA–peptide complex compared with the volume of streptavidin monomers (66 kDa), followed by conversion to mass, was calculated to be 70 ± 5 kDa, suggesting that about eight monomers of ZαADAR1 are bound to Z-DNA in this position. These data agree with the number of ZαADAR1 peptides expected to bind to Z-DNA formed by the d(GC)2C(GC)10 or d(GC)13 inserts, based on crystallographic results (14). The ZαADAR1-d(CG)3 crystal structure shows that the size of the binding site is ∼6 bp with each symmetry-related ZαADAR1 subunit occupying one strand of this left-handed DNA. The B-to-Z transition is highly cooperative and if complete Z-DNA transformation occurs in the 25-26 bp sequences, four pairs of ZαADAR1 proteins would be expected to bind to these Z-DNA regions.
Rough estimates of the size of the region bound by protein can be obtained from the AFM images. The protein–DNA complex region has an ellipsoidal shape with no visible periodicity over the long axis, suggesting that ZαADAR1 monomers tightly coat the entire length of the d(GC)n sequence. The long axis of the ellipsoid above the DNA filament is 19 ± 2 nm; however, this value incorporates the dilation effect due to a finite size of the AFM probe (29). In our AFM images, 2 nm wide DNA molecules appear as filaments with widths of 7 ± 1 nm, suggesting that the overall tip dilation effect for objects of the same height as the DNA is ∼5 nm. The height of the DNA–protein complex is about 2.5 times that of the DNA height, so the thickness of the protein shell of the complex is approximately 1.5 times of the DNA height. Extrapolation of the dilation effect to this height in the framework of a spherical tip approximation gives us the dilation value of ∼9 nm for the long ellipse axis of the blob. Hence, the length of DNA target region coated with protein is ∼10 ± 2 nm. This estimate is close to the 9 nm expected for the left-handed conformation of d(GC)13 insert (14,30,31).
Zα facilitates the formation of Z-DNA
We tested the hypothesis that binding of ZαADAR1 induces the formation of Z-DNA even when the energy of supercoiling is insufficient to stabilize this conformation (8). For these experiments, we analyzed ZαADAR1 binding to plasmids with levels of DNA supercoiling too low to support the formation of Z-DNA.
According to the 2D electrophoresis (Figure 2), the B-to-Z transition in plasmid pZC6 occurs at superhelical density σ = −0.075, which is close to the mean supercoiling density of topoisomer sample t7 (Table 1). Meanwhile, we observed ZαADAR1–Z-DNA complex formation in samples t4 (<σ> = −0.048, Figure 3E) and t5 (<σ> = −0.06; Figure 3F) of plasmid pZC6. DNA molecules with one complex per plasmid are clearly seen in the AFM images of these samples (Figure 3E and F). These AFM data indicate that ZαADAR1 binds to the d(GC)n region of plasmid pZC6, and the morphologies of the blobs are similar to those imaged with the topoisomer sample t7 with elevated superhelical densities (Figure 3D).
Similar analyses were performed with plasmid pZA6 in which the B-to-Z transition occurs at σ = −0.038 (Figure 2A). The mean supercoiling density of the topoisomer sample t2 (<σ> = −0.025) is insufficient for Z-DNA formation. However, ∼50% of plasmids in sample t2 have blobs with one recognition site per molecule, indicating a specific ZαADAR1 complexing (Figure 3C). These data suggest that ZαADAR1 binds selectively to regions in plasmids, which are capable of undergoing a B-to-Z transition, even when the supercoiling free energy is too low to support the spontaneous formation of Z-DNA.
The formation of Z-DNA removes about 1.8 negative supercoils per 10 bp in supercoiled DNA (27,32). To measure the change of DNA supercoiling induced by the formation of Z-DNA upon interaction with ZαADAR1, we performed systematic analyses of the same topoisomer DNA samples before and after protein binding. We determined the number of nodes observed in plasmids in the presence and absence of ZαADAR1. The data for topoisomer preparations t2, t3 and t5 of plasmid pZA6 are shown as histograms in Figure 5A, B and C, respectively. Each sample is characterized by the distribution of the number of nodes, and the values (∼4–6) are consistent with the presence of six to seven topoisomers (see Materials and Methods). The number of nodes for naked t2 DNA samples varies between 5 and 10, but this distribution is shifted to much lower numbers (2–5) when ZαADAR1 is added. We determined that the difference in the mean number of nodes for this sample is 4.5 and this value correlates well with the 4.5 drop in ΔLk upon the formation of Z-DNA determined by 2D electrophoresis data, and is in good agreement with an expected decrease of superhelical density in the d(GC)2C(GC)10 sequence upon B-to-Z transition [Figure 2 and (27)]. Note that there is very little overlap between both distributions in Figure 5A. Sample t3 (Figure 5B) has more nodes initially (the mean number on nodes is 8.5), and the distribution shifts to as low as 5.0 nodes as the protein is added. In the more supercoiled sample t5, the effect of ZαADAR1 is qualitatively similar, but the shift is much less. The difference in the mean number of nodes for this sample is 2.4 (Figure 5C); which is half of that for sample t2. Similar results were obtained for three different preparations of plasmid pZC6 (Figure 5D and E). The analysis shows that ZαADAR1 reduces about 4.5 nodes in samples t4 and t5, whereas the difference is about 2.1 in the more tightly supercoiled sample t7. Collectively, these data support the hypothesis that binding of ZαADAR1 induces the formation of Z-DNA even when the energy of supercoiling is insufficient to stabilize this alternative DNA conformation.
Figure 5.
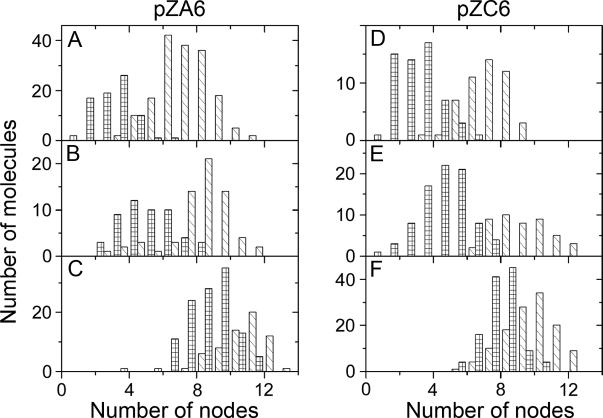
Histograms for the number of nodes in topoisomer samples t2 (A), t3 (B) and t5 (C) of plasmid pZA6 and in samples t4 (D), t5 (E) and t7 (F) of plasmid pZC6 incubated with ZαADAR1 protein (grids) and without protein (stripes).
The data for plasmids pZA6 and pZC6 are summarized and shown graphically in Figure 6A and B, respectively. In this figure, the difference in the mean number of nodes between the naked plasmids and the complexes is plotted against the mean linking number difference for each topoisomer sample. For both plasmids, the number of nodes decreases by 4.5 to 4.6 in the samples which cannot form Z-DNA in the absence of peptide (sample t2 for pZA6 and samples t4 and t5 for pZC6). This value is close to the results obtained for the B-to-Z transition observed by 2D gel electrophoresis (Figure 2), corroborating the assumption that ZαADAR1 binding facilitates the formation of the left-handed conformation. The difference in the number of nodes decreases for sample t3 (plasmid pZA6), which has the mean supercoiling close to the B-to-Z transition point (Figure 2A). Such a sample contains roughly equal amounts of topoisomers with and without Z-DNA, so the decrease in the number of nodes for sample t3 compared with sample t2 is consistent with the increase of the population of topoisomers capable of spontaneous formation of Z-DNA. There is an insignificant difference in the number of nodes for tightly supercoiled samples; this can be explained by the presence of a small percentage of topoisomers with superhelical densities insufficient for Z-DNA formation.
Figure 6.
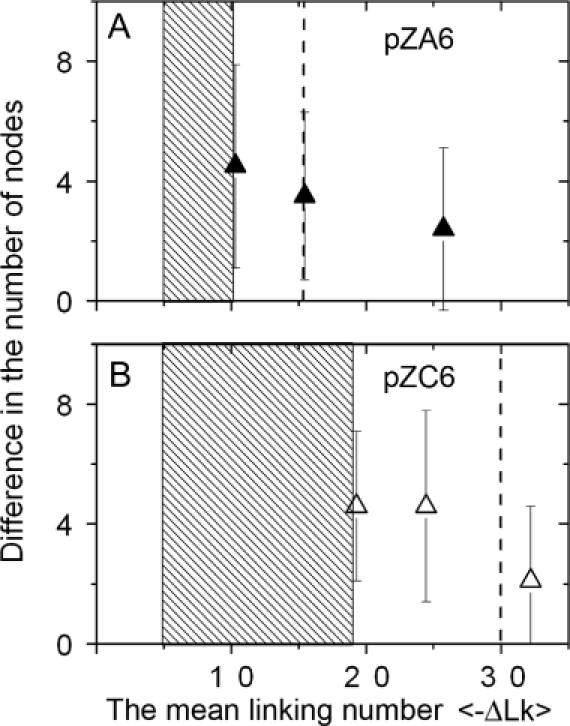
Protein-mediated B-to-Z transition in plasmids pZA6 and pZC6. The dependence of the difference in the number of nodes on the mean value of the linking number difference values (<ΔLk>). The data for the topoisomer samples t2, t3 and t5 of plasmid pZA6 and t4, t5 and t7 of plasmid pZC6 are shown in frames A (filled triangles) and B (open triangles) respectively. The data and error bars for each data point were calculated based on the distributions of the number of nodes shown in Figure 5. Dashed rectangular boxes indicate estimated transition ranges for complexes of ZαADAR1 protein with corresponding plasmids. Vertical dashed lines on the plots correspond to the B-to-Z transition point for naked DNA samples. The linking number values were adjusted to 200 mM NaCl.
We used data for B-to-Z transitions with naked plasmids (Figure 2) and for the ZαADAR1–Z-DNA complexes taken from Figures 5 and 6 to obtain quantitative estimates for the energetic effect of ZαADAR1 on the B-to-Z transition. However, the buffer solutions for 2D gel electrophoresis were different from those used for the AFM experiments (5 mM NaCl versus 200 mM NaCl). Low ionic strength is required to achieve reliable separation of topoisomers on 2D gels, and supercoiled DNA molecules adopt irregular shapes under these conditions (33), whereas high ionic strength is needed to decrease effective DNA diameter and thus facilitate the formation of supercoiled DNA with a plectonemic shape (25,26,33,34). It was shown that substantially higher DNA supercoiling is needed for the Z-DNA formation at high ionic strength (35–37). Alternating d(CG)n regions flip into the Z-conformation at supercoiling densities of σ = −0.056 at 5 mM Na+, whereas σ = −0.072 is needed to stabilize Z-DNA at 200 mM Na+ (35). This effect is explained by the dependence of DNA supercoiling density on ionic conditions (34,38), and direct measurements of the changes in ΔLk values caused by the differences in ionic conditions (34) are in good quantitative agreement with results by Singleton et al. (35). We have taken into account the effect of ionic conditions on DNA supercoiling in our analyses.
In Figure 6, we plotted differences in the mean number of nodes (calculated using the histograms in Figure 5) against the mean value of the linking number difference for a specific topoisomer sample determined by 2D gel electrophoresis. These values for plasmids pZA6 and pZC6 are depicted as filled and open triangles, respectively. The <ΔLk> values were adjusted to the high ionic strength conditions using the data obtained by Singleton et al. (35). At low salt conditions (2D electrophoresis), we observed B-to-Z transitions for plasmid pZA6 at the linking number difference ΔLk = −12 (σ = −0.038). Using the data of Singleton et al. (35), we calculated that the transition point at high ionic strength is ΔLk = −15.4. Similar analyses showed that the B-to-Z transition point for plasmid pZC6 at 200 mM is ΔLk = −29.6. The ΔLktransition values for the B-to-Z transition for both plasmids without the protein adjusted to high ionic strength conditions are indicated in Figure 6 by dotted vertical lines. For plasmid pZA6, we observed the strongest effect of ZαADAR1 for sample t2, but this effect declines in samples t3 and t5 due to the spontaneous formation of Z-DNA. We did not observe the formation of specific complexes of ZαADAR1 for sample t1, so we assume that the B-to-Z transition in the presence of ZαADAR1 takes place in the range of DNA supercoiling between ΔLk values −5 and −10 corresponding to mean DNA supercoiling parameters for samples t1 and t2. Note that each sample analyzed by AFM contains a set of topoisomers; therefore, due to this uncertainty we characterized the protein-mediated B-Z transition by a range of ΔLk values. This transition range for plasmid pZA6 is shown in Figure 6A as shaded box. The ΔLk transition area for the complex is far left of the B-to-Z transition point for naked DNA, corresponding to ΔLk = −15.4 for high ionic strength conditions. There is a little overlap between the histograms for sample t2 (Figure 5A) and the change in the number of nodes correlates with a B-to-Z transition within the insert, so it is reasonable to assign the B-to-Z transition point in the presence of the protein to the mean supercoiling density for this sample. Using the differences in ΔLk for the complex and the naked DNA, one can calculate the energy difference between the two DNA states and obtain the energetic effect of ZαADAR1 has on the B-to-Z transition. We used a well-known expression to calculate the free energy of DNA supercoiling, ΔG = 1.11 RT/N (ΔLk)2 kcal/mol (34), where N is the length of the plasmid in base pairs, R is the gas constant and T is the temperature (K). We used the data for sample t2, which is the rightmost point of the transition interval for complex formation. This means that the data will provide us with the lowest energetic estimates for the protein-mediated B-to-Z transition. The calculations indicated that the free energy difference for supercoiling at ΔLk= −15.4 and −10.3 corresponds to ∼5.3 kcal/mol. According to AFM volume measurements, eight monomers of ZαADAR1 bind to the d(CG)n insert, and hence the energetic effect of one ZαADAR1 unit is ∼0.66 kcal/mol. This value is slightly higher than thermal energy at room temperature. Given that ATP hydrolysis is not involved in either DNA recognition or the B-to-Z-transition for ZαADAR1, this estimate seems reasonable. Note that these values are rough estimates because our data were obtained using samples that have broad distributions of ΔLk. The availability of individual topoisomers will allow us to conduct these analyses more accurately.
Similar analysis can be applied to plasmid pZC6 (Figure 6B). We did not observe the protein binding for the t1 sample of this plasmid too, so the B-to-Z transition range in the presence of ZαADAR1 is between the ΔLk values corresponding to the supercoiling parameters of samples t1 and t4 that is shaded in Figure 6B. Using the same argument as described above, we assigned the B-to-Z transition point for the protein–DNA complexes to sample t4. According to Figure 6B, the transition points in 200 mM Na+ for naked DNA and the complex with ZαADAR1 are 29.6 and 19.3, respectively. The difference in ΔLk numbers is 10.3, which is two times higher than the estimates obtained above for pZA6 plasmid, leading to a conclusion that the facilitating effect of ZαADAR1 is enhanced in this plasmid. A possible explanation of this large difference is that plasmid pZC6 can undergo two competing transitions—the formation of a cruciform within the inverted repeat region and a B-to-Z transition within the (CG)n region (27). In naked DNA, the formation of the cruciform is slightly more favorable than Z-DNA (Figure 2). The formation of the cruciform is observed at ΔLk = −11, whereas ΔLk = −13 is needed for the formation of Z-DNA in pZA6 plasmid. We have found that ZαADAR1 binding lowers the barrier for Z-DNA formation, so apparently Z-DNA can be formed at the expense of cruciform dissociation. Indeed, we have observed a decrease in the number of plasmids with a cruciform when the ZαADAR1–Z-DNA complexes are formed.
In conclusion, the AFM results clearly show that ZαADAR1 has a very high binding specificity for the left-handed DNA. Continuous coverage of the Z-DNA target by ZαADAR1 is likely due to the cooperative protein binding concomitant with the induction of the Z-conformation. Importantly, ZαADAR1 substantially facilitates the formation of Z-DNA at superhelical densities insufficient for spontaneous transitions of the d(CG)n regions into the left-handed conformation. The estimated energetic contribution by ZαADAR1 for the B-to-Z transition in the d(CG)n region of the plasmid of 5.3 kcal/mol (0.66 kcal/mol per ZαADAR1) is reasonable based on previous results. Studies by Brown and coworkers (8) demonstrated that ZαADAR1 could actively induce the Z-conformation in d(CG)6 and r(CG)6 oligonucleotides with activation energies of 24.1 ± 0.8 kcal/mol for the DNA duplex and 38.1 ± 0.5 kcal/mol for RNA duplex, respectively. Additionally, as the length of the oligonucleotide increases (up to ∼25 bp) the activation energy required for the B-to-Z transition decreases (B. A. Brown, unpublished data). This length dependence has previously been documented in d(CG)n polymers as a function of salt concentration and in plasmids containing d(CG)n inserts as a function of supercoiling (39–41). The crystal structure of ZαADAR1 bound to d(CG)3 shows that it recognizes Z-conformation nucleic acids by the two most distinct features which differ from B-DNA: the zig-zag phosphate backbone and the syn conformation of a purine nucleotide. Specifically, ZαADAR1 binds to the backbone of about five nucleotides and one guanosine nucleotide in the syn orientation, using a combination of electrostatic and van der Waals interactions (14). ZαADAR1 occupies ∼6 bp of Z-DNA (or Z-RNA) as a dimer, but each protein only interacts with one strand of the left-handed duplex, and the two proteins do not contact one another. Typically, the induction of Z-conformation by ZαADAR1 is a stochastic process, and longer purine–pyrimidine sequences would require more protein to facilitate the B-to-Z transition. In weakly supercoiled plasmids, the binding of ZαADAR1 is apparently effective enough to drive the B-to-Z transition to completion at lower concentrations than would typically be required in linear oligonucleotides or non-supercoiled plasmids. However, when ample ZαADAR1 is present, it uniformly binds to all possible sites.
Acknowledgments
ACKNOWLEDGEMENTS
We thank L. Shlyakhtenko for helpful suggestions during the work and useful comments to the manuscript. The work was partially supported by the grant GM 62235 (Y.L.L.).
REFERENCES
- 1.Klysik J., Stirdivant,S.M., Larson,J.E., Hart,P.A. and Wells,R.D. (1981) Left-handed DNA in restriction fragments and a recombinant plasmid. Nature, 290, 672–677. [DOI] [PubMed] [Google Scholar]
- 2.Peck L.J., Nordheim,A., Rich,A. and Wang,J.C. (1982) Flipping of cloned d(pCpG)n·d(pCpG)n DNA sequences from right- to left-handed helical structure by salt, Co(III), or negative supercoiling. Proc. Natl Acad. Sci. USA, 79, 4560–4564. [DOI] [PMC free article] [PubMed] [Google Scholar]
- 3.Liu L.F. and Wang,J.C. (1987) Supercoiling of the DNA template during transcription. Proc. Natl Acad. Sci. USA, 84, 7024–7027. [DOI] [PMC free article] [PubMed] [Google Scholar]
- 4.Ho P.S., Ellison,M.J., Quigley,G.J. and Rich,A. (1986) A computer aided thermodynamic approach for predicting the formation of Z-DNA in naturally occurring sequences. EMBO J., 5, 2737–2744. [DOI] [PMC free article] [PubMed] [Google Scholar]
- 5.Sinden R.R. and Kochel,T.J. (1987) Reduced 4,5′,8-trimethylpsoralen cross-linking of left-handed Z-DNA stabilized by DNA supercoiling. Biochemistry, 26, 1343–1350. [DOI] [PubMed] [Google Scholar]
- 6.Rahmouni A.R. and Wells,R.D. (1989) Stabilization of Z DNA in vivo by localized supercoiling. Science, 246, 358–363. [DOI] [PubMed] [Google Scholar]
- 7.Zheng G.X., Kochel,T., Hoepfner,R.W., Timmons,S.E. and Sinden,R.R. (1991) Torsionally tuned cruciform and Z-DNA probes for measuring unrestrained supercoiling at specific sites in DNA of living cells. J. Mol. Biol., 221, 107–122. [DOI] [PubMed] [Google Scholar]
- 8.Brown B.A. II, Lowenhaupt,K., Wilbert,C.M., Hanlon,E.B. and Rich,A. (2000) The zalpha domain of the editing enzyme dsRNA adenosine deaminase binds left-handed Z-RNA as well as Z-DNA. Proc. Natl Acad. Sci. USA, 97, 13532–13536. [DOI] [PMC free article] [PubMed] [Google Scholar]
- 9.Lukomski S. and Wells,R.D. (1994) Left-handed Z-DNA and in vivo supercoil density in the Escherichia coli chromosome. Proc. Natl Acad. Sci. USA, 91, 9980–9984. [DOI] [PMC free article] [PubMed] [Google Scholar]
- 10.Wittig B., Wolfl,S., Dorbic,T., Vahrson,W. and Rich,A. (1992) Transcription of human c-myc in permeabilized nuclei is associated with formation of Z-DNA in three discrete regions of the gene. EMBO J., 11, 4653–4663. [DOI] [PMC free article] [PubMed] [Google Scholar]
- 11.Wolfl S., Martinez,C., Rich,A. and Majzoub,J.A. (1996) Transcription of the human corticotropin-releasing hormone gene in NPLC cells is correlated with Z-DNA formation. Proc. Natl Acad. Sci. USA, 93, 3664–3668. [DOI] [PMC free article] [PubMed] [Google Scholar]
- 12.Herbert A., Alfken,J., Kim,Y.G., Mian,I.S., Nishikura,K. and Rich,A. (1997) A Z-DNA binding domain present in the human editing enzyme, double-stranded RNA adenosine deaminase. Proc. Natl Acad. Sci. USA, 94, 8421–8426. [DOI] [PMC free article] [PubMed] [Google Scholar]
- 13.Schwartz T., Lowenhaupt,K., Kim,Y.G., Li,L., Brown,B.A.,II, Herbert,A. and Rich,A. (1999) Proteolytic dissection of Zab, the Z-DNA-binding domain of human ADAR1. J. Biol. Chem., 274, 2899–2906. [DOI] [PubMed] [Google Scholar]
- 14.Schwartz T., Rould,M.A., Lowenhaupt,K., Herbert,A. and Rich,A. (1999) Crystal structure of the Zalpha domain of the human editing enzyme ADAR1 bound to left-handed Z-DNA. Science, 284, 1841–1845. [DOI] [PubMed] [Google Scholar]
- 15.Herbert A. and Rich,A. (1999) Left-handed Z-DNA: structure and function. Genetica, 106, 37–47. [DOI] [PubMed] [Google Scholar]
- 16.Fu Y., Comella,N., Tognazzi,K., Brown,L.F., Dvorak,H.F. and Kocher,O. (1999) Cloning of DLM-1, a novel gene that is up-regulated in activated macrophages, using RNA differential display. Gene, 240, 157–163. [DOI] [PubMed] [Google Scholar]
- 17.Schwartz T., Behlke,J., Lowenhaupt,K., Heinemann,U. and Rich,A. (2001) Structure of the DLM-1-Z-DNA complex reveals a conserved family of Z-DNA-binding proteins. Nature Struct. Biol., 8, 761–765. [DOI] [PubMed] [Google Scholar]
- 18.Kim Y.G., Muralinath,M., Brandt,T., Pearcy,M., Hauns,K., Lowenhaupt,K., Jacobs,B.L. and Rich,A. (2003) A role for Z-DNA binding in vaccinia virus pathogenesis. Proc. Natl Acad. Sci. USA, 100, 6974–6979. [DOI] [PMC free article] [PubMed] [Google Scholar]
- 19.Kahmann J.D., Wecking,D.A., Putter,V., Lowenhaupt,K., Kim,Y.G., Schmieder,P., Oschkinat,H., Rich,A. and Schade,M. (2004) The solution structure of the N-terminal domain of E3L shows a tyrosine conformation that may explain its reduced affinity to Z-DNA in vitro. Proc. Natl Acad. Sci. USA, 101, 2712–2717. [DOI] [PMC free article] [PubMed] [Google Scholar]
- 20.Kim Y.G., Lowenhaupt,K., Oh,D.B., Kim,K.K. and Rich,A. (2004) Evidence that vaccinia virulence factor E3L binds to Z-DNA in vivo: Implications for development of a therapy for poxvirus infection. Proc. Natl Acad. Sci. USA, 101, 1514–1518. [DOI] [PMC free article] [PubMed] [Google Scholar]
- 21.Herbert A., Schade,M., Lowenhaupt,K., Alfken,J., Schwartz,T., Shlyakhtenko,L.S., Lyubchenko,Y.L. and Rich,A. (1998) The Zalpha domain from human ADAR1 binds to the Z-DNA conformer of many different sequences. Nucleic Acids Res., 26, 3486–3493. [DOI] [PMC free article] [PubMed] [Google Scholar]
- 22.Oussatcheva E.A., Pavlicek,J., Sankey,O.F., Sinden,R.R., Lyubchenko,Y.L. and Potaman,V.N. (2004) Influence of global DNA topology on cruciform formation in supercoiled DNA. J. Mol. Biol., 338, 735–743. [DOI] [PubMed] [Google Scholar]
- 23.Shlyakhtenko L.S., Potaman,V.N., Sinden,R.R., Gall,A.A. and Lyubchenko,Y.L. (2000) Structure and dynamics of three-way DNA junctions: atomic force microscopy studies. Nucleic Acids Res., 28, 3472–3477. [DOI] [PMC free article] [PubMed] [Google Scholar]
- 24.Shlyakhtenko L.S., Gall,A.A., Filonov,A., Cerovac,Z., Lushnikov,A. and Lyubchenko,Y.L. (2003) Silatrane-based surface chemistry for immobilization of DNA, protein–DNA complexes and other biological materials. Ultramicroscopy, 97, 279–287. [DOI] [PubMed] [Google Scholar]
- 25.Shlyakhtenko L.S., Hsieh,P., Grigoriev,M., Potaman,V.N., Sinden,R.R. and Lyubchenko,Y.L. (2000) A cruciform structural transition provides a molecular switch for chromosome structure and dynamics. J. Mol. Biol., 296, 1169–1173. [DOI] [PubMed] [Google Scholar]
- 26.Shlyakhtenko L.S., Potaman,V.N., Sinden,R.R. and Lyubchenko,Y.L. (1998) Structure and dynamics of supercoil-stabilized DNA cruciforms. J. Mol. Biol., 280, 61–72. [DOI] [PubMed] [Google Scholar]
- 27.Sinden R. (1994) DNA Structure and Function. Academic Press, San Diego, CA. [Google Scholar]
- 28.Ratcliff G.C. and Erie,D.A. (2001) A novel single-molecule study to determine protein–protein association constants. J. Am. Chem. Soc., 123, 5632–5635. [DOI] [PubMed] [Google Scholar]
- 29.Lyubchenko Y.L., Oden,P.I., Lampner,D., Lindsay,S.M. and Dunker,K.A. (1993) Atomic force microscopy of DNA and bacteriophage in air, water and propanol: the role of adhesion forces. Nucleic Acids Res., 21, 1117–1123. [DOI] [PMC free article] [PubMed] [Google Scholar]
- 30.Schwartz T., Shafer,K., Lowenhaupt,K., Hanlon,E., Herbert,A. and Rich,A. (1999) Crystallization and preliminary studies of the DNA-binding domain Za from ADAR1 complexed to left-handed DNA. Acta Crystallogr. D Biol. Crystallogr., 55, 1362–1364. [DOI] [PubMed] [Google Scholar]
- 31.Schade M., Turner,C.J., Kuhne,R., Schmieder,P., Lowenhaupt,K., Herbert,A., Rich,A. and Oschkinat,H. (1999) The solution structure of the Zalpha domain of the human RNA editing enzyme ADAR1 reveals a prepositioned binding surface for Z-DNA. Proc. Natl Acad. Sci. USA, 96, 12465–12470. [DOI] [PMC free article] [PubMed] [Google Scholar]
- 32.Peck L.J., Wang,J.C., Nordheim,A. and Rich,A. (1986) Rate of B to Z structural transition of supercoiled DNA. J. Mol. Biol., 190, 125–127. [DOI] [PubMed] [Google Scholar]
- 33.Lyubchenko Y.L. and Shlyakhtenko,L.S. (1997) Visualization of supercoiled DNA with atomic force microscopy in situ. Proc. Natl Acad. Sci. USA, 94, 496–501. [DOI] [PMC free article] [PubMed] [Google Scholar]
- 34.Rybenkov V.V., Vologodskii,A.V. and Cozzarelli,N.R. (1997) The effect of ionic conditions on DNA helical repeat, effective diameter and free energy of supercoiling. Nucleic Acids Res., 25, 1412–1418. [DOI] [PMC free article] [PubMed] [Google Scholar]
- 35.Singleton C.K., Klysik,J., Stirdivant,S.M. and Wells,R.D. (1982) Left-handed Z-DNA is induced by supercoiling in physiological ionic conditions. Nature, 299, 312–316. [DOI] [PubMed] [Google Scholar]
- 36.O'Connor T., Kilpatrick,M.W., Klysik,J., Larson,J.E., Martin,J.C., Singleton,C.K., Stirdivant,S.M., Zacharias,W. and Wells,R.D. (1983) Left-handed Z-DNA helices in polymers, restriction fragments, and recombinant plasmids. J. Biomol. Struct. Dyn., 1, 999–1009. [DOI] [PubMed] [Google Scholar]
- 37.Nordheim A. and Rich,A. (1983) The sequence (dC-dA)n X (dG-dT)n forms left-handed Z-DNA in negatively supercoiled plasmids. Proc. Natl Acad. Sci. USA, 80, 1821–1825. [DOI] [PMC free article] [PubMed] [Google Scholar]
- 38.Gebe J.A., Delrow,J.J., Heath,P.J., Fujimoto,B.S., Stewart,D.W. and Schurr,J.M. (1996) Effects of Na+ and Mg2+ on the structures of supercoiled DNAs: comparison of simulations with experiments. J. Mol. Biol., 262, 105–128. [DOI] [PubMed] [Google Scholar]
- 39.Ivanov V.I. and Minyat,E.E. (1981) The transitions between left- and right-handed forms of poly(dG–dC). Nucleic Acids Res., 9, 4783–4798. [DOI] [PMC free article] [PubMed] [Google Scholar]
- 40.Pohl F.M. (1983) Salt-induced transition between two double-helical forms of oligo (dC-dG). Cold Spring Harb. Symp. Quant. Biol., 47 (Pt 1), 113–117. [DOI] [PubMed] [Google Scholar]
- 41.O'Connor T.R., Kang,D.S. and Wells,R.D. (1986) Thermodynamic parameters are sequence-dependent for the supercoil-induced B to Z transition in recombinant plasmids. J. Biol. Chem., 261, 13302–13308. [PubMed] [Google Scholar]
- 42.Tsen H. and Levene,S.D. (1997) Supercoiling-dependent flexibility of adenosine-tract-containing DNA detected by a topological method. Proc. Natl Acad. Sci. USA, 94, 2817–2822. [DOI] [PMC free article] [PubMed] [Google Scholar]