


Abstract
Microarray technology is extensively used in biological research. The applied technologies vary greatly between laboratories, and outstanding questions remain regarding the degree of correlation among approaches. Recently, there has been a drive toward ensuring high-quality microarray data by the implementation of MIAME (Minimal Information About a Microarray Experiment) guidelines and an emphasis on ensuring public-availability to all datasets. However, despite its current widespread use and availability, very little is known about the extent to which application of the different technologies influences the outcome of transcriptional profiles and differential expression. The results among the handful of published studies are conflicting. Here, we present a comprehensive evaluation encompassing different reporter systems (short oligonucleotides, long oligonucleotides and cDNAs), labelling techniques and hybridization protocols. We used four oligonucleotide and two cDNA platforms to compare gene expression between two sample types. We determined the overall consistency (reproducibility) within each platform, and correlation among replicates within and between technologies. We find that the top performing platforms show low levels of technical variability that result in an increased ability to detect differential expression. Most importantly, we show the top four platforms are highly correlated with biological, rather than technological, differences accounting for the majority of variation in the data.
INTRODUCTION
DNA microarrays provide powerful tools for the global characterization of gene expression. The technology is evolving rapidly and there are now numerous high-density platforms available. The platform choices differ in probe content, design, deposition technology, as well as labelling and hybridizing protocols. Possible choices of probe types include spotted cDNA sequences or PCR products, several hundred to thousand base pairs in length, short (25–30mer) oligonucleotides or longer (60–70mer) oligonucleotide reporters. Furthermore, reporters can be either contact-spotted using pins, ink jet-deposited or synthesized directly on a number of different slide matrices. Manufacturers advocate many different protocols to ensure specificity, sensitivity and reproducibility. Labelling methods vary from in vitro transcribed cRNA or directly labelled cDNA targets coupled with fluorescent cyanine dyes to secondarily labelled biotin-/streptavidin-conjugated targets. Finally, experimental approaches used to generate expression profiles can be carried out in one-colour (one labelled target per array) or two-colours (two separately labelled targets for each array). All of these approaches have their own advantages and disadvantages with respect to many factors from starting amount of probe required through to cost, time, and data acquisition and transformation (1).
Despite widespread use, there have been few studies examining the quality of data produced by, or the correlation among, different platforms and approaches. The results demonstrating concordance (2–6) or discordance (7–11) between technologies are conflicting. Furthermore, the majority of these studies are also limited in scope as they generally compare two or three technologies.
The present study examines six popular approaches for generating expression data from DNA microarrays, including two cDNA platforms, three short oligonucleotides and one long oligonucleotide platform. Gene expression profiles were compared between Muta™Mouse whole lung tissue and an immortalized lung cell line (FE1) derived from Muta™Mouse lung (12), all against a universal reference RNA standard. We test the hypothesis that gene expression profiles will be determined by biology rather than technology, evaluate the quality, reproducibility and sensitivity of data produced by each of the platforms, and determine the correlation among technologies.
METHODS AND MATERIALS
Sample collection
Muta™Mouse lung epithelial cells (FE1) were cultured in a 1:1 mixture of DMEM:F12 nutrient mixture supplemented with 2% (v/v) fetal bovine serum (FBS), 2 mM glutamine, 100 U/ml penicillin G, 100 μg/ml streptomycin sulphate and 1 ng/ml murine epidermal growth factor (Invitrogen Life Technologies, Burlington, ON, Canada). All incubations were carried out at 37°C, 95% humidity and 5% CO2. Total RNA from three replicates of confluent cells (5-10 day incubation after 100% confluence) was isolated using TriZol® LS reagent (Invitrogen Life Technologies) and RNEasy Mini columns (Qiagen, Mississauga, ON, Canada). The transgenic mouse strain (Muta™Mouse), from which the cell line was derived, was bred locally and maintained under conditions approved by the Health Canada Animal Care Committee. Animals were euthanized by cervical dislocation, and saline-perfused lungs from five mature males were homogenized using a PCR Tissue Homogenizer (Omni International, London Scientific, London, ON, Canada). Total RNA was extracted in TriZol® reagent followed by clean up using RNEasy columns. High RNA quality was verified using an Agilent Bioanalyzer (Agilent Technologies, Palo Alto, CA). The same three FE1 cell line replicates and two of the lung tissue replicates were used for all six platforms (Figure 1).
Figure 1.
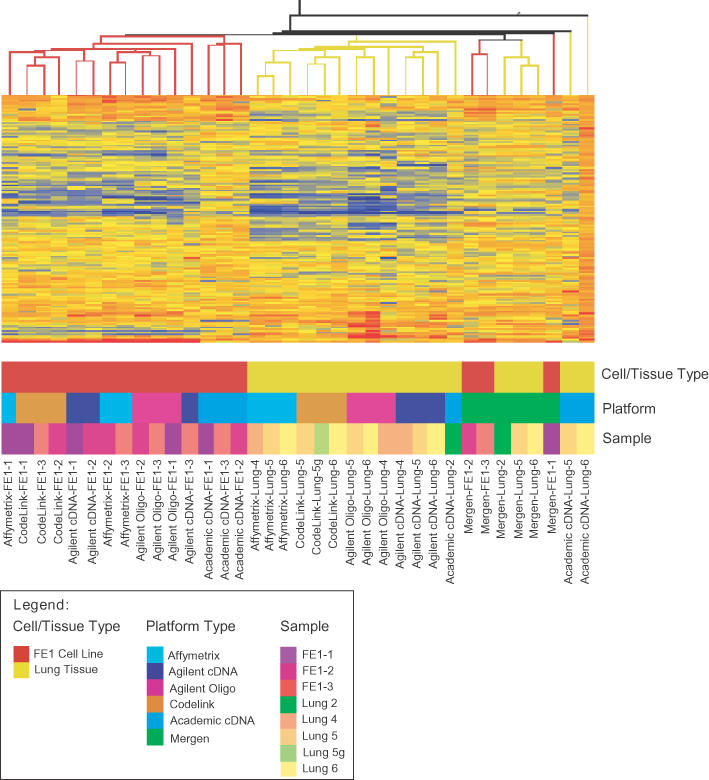
Cluster analysis was performed in GeneSpring using standard correlation on genes in common across all platforms.
Probe labelling and hybridization
Two cDNA arrays and four oligonucleotide arrays were examined (Table 1). For one-colour arrays (Table 1), total RNA from three biological replicates of each sample type and three replicates of universal mouse reference RNA (Stratagene, La Jolla, CA) were amplified, labelled and hybridized according to the manufacturer's recommendations (for a total of nine microarray hybridizations per platform). For two-colour platforms, cDNA or cRNA probes were hybridized against reference RNA according to the manufacturer's specifications with corresponding dye swaps (for a total of 12 microarray hybridizations per platform). Labelled probes were made immediately prior to hybridization for all platforms. Both cDNA arrays (Academic and Agilent Incyte) required optimization of hybridization (a pre-hybridization step was added to reduce background for the academic arrays; 3× SSC, 0.1% SDS, 2 μg/ml BSA at 65°C for 45 min) and wash protocols (Agilent cDNA; added 1× SSC, 0.1% SDS wash at 40°C for 5 min and 0.06× SSC at room temperature for 5 min) to acquire useful data over the manufacturer's protocol. All other arrays were hybridized overnight and washed according to the manufacturer's specifications. All arrays except Affymetrix were scanned on a VersArray ChipReader (Bio-Rad Laboratories Ltd, Waterloo, ON, Canada). We found improved image quality for academic cDNA chips with the manufacturer's hybridization and wash conditions using an HS4800 liquid handling system (TECAN, Research Triangle Park, NC) compared to manual hybridizations (C. Yauk, L. Berndt, A. Williams and G. Douglas, submitted for publication). Therefore, we used data acquired from the automated station in the subsequent analyses. Affymetrix arrays were outsourced to the Ontario Genomics Innovation Centre (Ontario Health Research Institute, Ottawa, Canada; http://www.ottawagenomecenter.ca/services/affymetrix_services/affymetrix_services_page).
Table 1. Mean correlation and variance among biological replicates (all three pairwise comparisons) within platforms and cell types were calculated.
| Microarray technology | Reporter | FE1 | LUNG | Differential expression using SAMb | |||
|---|---|---|---|---|---|---|---|
| Generalized variance (95% CI)a | Mean correlation (95% CI)a | Generalized variance (95% CI) | Mean correlation (95% CI) | FE1 > lung | Lung > FE1 | ||
| U74Av2 GeneChip (Affymetrix)d. Number of reporters = 15 099 | 25mer oligonucleotide probe sets printed by photolithography (16) | 0.025 (0.017, 0.035) | 0.879 (0.855, 0.900) | 0.008 (0.005, 0.012) | 0.932 (0.913, 0.943) | 299 (1.93%)c | 176 (1.02%) |
| Codelink Uniset I Bioarrays (Amersham BioSciences)d. Number of reporters = 10 012 | Single spotted 30mer oligonucleotides (17) | 0.033 (0.023, 0.045) | 0.856 (0.832, 0.877) | 0.040 (0.028, 0.052) | 0.880 (0.861, 0.901) | 461 (4.6%) | 294 (2.94%) |
| 22K Mouse development (Agilent Technologies)e. Number of reporters = 20 000 | Single 60mer oligonucleotides synthesized in situ (2) | 0.056 (0.042, 0.075) | 0.840 (0.812, 0.861) | 0.068 (0.046, 0.090) | 0.825 (0.793, 0.852) | 205 (1.01%) | 157 (0.77%) |
| 10K Incyte (Agilent Technologies)e. Number of reporters = 8737 | Spotted cDNA | 0.083 (0.060, 0.112) | 0.751 (0.708, 0.789) | 0.114 (0.090, 0.145) | 0.772 (0.741, 0.799) | 41 (0.43%) | 15 (0.16%) |
| NIA 15K cDNA clone set (Academic)e. Number of reporters = 15 264 | Spotted cDNA (http://www.microarrays.ca/products/types.html) | 0.138 (0.104, 0.179) | 0.764 (0.726, 0.799) | 0.523 (0.427, 0.641) | 0.389 (0.272, 0.474) | 20 (0.13%) | 0 (0.00%) |
| MO3 ExpressChip (Mergen Ltd.)d. Number of reporters = 9248 | Single spotted 30mer oligonucleotides | 0.256 (0.217, 0.294) | 0.493 (0.440, 0.543) | 0.029 (0.022, 0.037) | 0.888 (0.875, 0.903) | 0 (0.00%) | 0 (0.00%) |
SAM was used to determine the number of genes differentially expressed between the cell line and lung.
aNon-parametric Bootstrap percentile confidence intervals (895 genes, 2000 bootstraps) were obtained for each estimate.
bDelta of 3.0 and ignoring fold change on all genes within a platform detected in two of the six biological samples.
cProportion of whole chip.
dOne-colour array only.
eTwo-colour arrays (sample versus reference RNA; dye swaps performed).
Normalization and statistical analysis
Raw intensity measurements and present/absent calls (present when spot is significantly above the local background) were derived in ImaGene 2.0 (BioDiscoveries Inc., Marina Del Rey, CA, USA). All data are available through ArrayExpress (http://www.ebi.ac.uk/arrayexpress/). Gene intensity derivation and pre-normalization was carried out in d-Chip for Affymetrix arrays (13). Median signal intensities for all arrays were normalized in GeneSpring 6.1 (Silicon Genetics, RedWood City, CA) using LOWESS and combined with dye swaps (one data point per sample type producing a normalized ratio to reference) for two-colour arrays and per chip to the 50th percentile and to reference samples for one-colour arrays (producing a normalized ratio to reference). UniGene identifiers (updated gene list from February 4, 2004) were used to find common genes across platforms. This list contained 895 genes, with 821 genes with complete records (i.e. no missing values or no signal on the reference channel). Of these, there were 66 genes that were flagged as present on all platforms. Data were post-normalized by shifting the log2(ratio) by the median value, and scaling the variability to the geometric average of the median absolute deviation from each array. Post-normalizing standardizes the data, removes location and scale differences between platforms. These normalized data were used for comparisons across all platforms when genes in common were used.
Correlation matrices for each sample type within platforms were generated for common genes using SAS 8.2 (SAS Institute Inc, Cary, NC). The determinant of the correlation matrix is presented as a measure of the generalized variance of the standardized variables. This statistic is one method to assign a single numerical value for the variation expressed within the platform.
Significance analysis of microarrays [SAM; (14)] was applied to determine the number of genes that were differentially expressed between the FE1 cell line and the Muta™Mouse whole lung on genes that were called present in at least two of the six samples. Delta was set to 3.0 for all platform comparisons, ignoring fold change for all SAM analyses.
Cross-platform comparisons based on common genes were made using Pearson product-moment correlations of the average log2(ratio) (FE1:Reference or Lung:Reference) in SAS 8.2 (SAS Institute Inc.). This analysis was carried out in four ways. First, the data were plotted using all genes that were common between two platforms. The second analysis plotted the average expression between the two platforms using only those genes that were flagged as present. The third and fourth comparisons were similar to the first two except that only genes that were common among all platforms were used (942 and 490 genes, respectively; in this analysis, genes with one or two missing values within a platform were included). Canonical correlation (15) was also used to analyse the relationship between all the pairwise combinations of the platforms. This analysis focuses on identifying a pair of linear combinations of samples within platforms that have the largest correlation between the two canonical variables.
A condition tree was performed in GeneSpring 6.1 (Silicon Genetics) using a standard correlation to examine the overall clustering of gene expression data and its relationship to the parameters platform type, sample number and biological sample (FE1 versus lung) for genes in common across all platforms. Factor Analysis (15) was used to describe the covariance relationships among the platforms and tissue types and was conducted on the 821 genes that were in common across the six platforms.
RESULTS
Platform variability and sensitivity
Correlation matrices within sample types (within FE1 or within lung) for each platform were generated for common genes to determine the correlation among replicates within a platform (reproducibility); the determinant of the correlation matrix represents a measure of the generalized variance of the standardized variables. The generalized variance is near zero when two or more of the variables are highly correlated and is near one when the correlations between replicates are very low. We expect low levels of variation and high correlation among FE1 samples as all replicates were produced at the same time under identical culturing conditions. Therefore, a platform that tends to be more reproducible will have a generalized variance near zero. Affymetrix, Agilent oligonucleotide and Codelink oligonucleotide arrays showed the lowest generalized variance among replicates in both FE1 and lung, varying from 0.008 to 0.068 (Table 1). In contrast, the range of variance for the academic cDNA and MO3 arrays increase to 0.255 and 0.523, indicating that these platforms showed higher variance within gene variability across replicates for the same samples. MO3 data were highly variable possibly due to sub-optimal hybridization conditions. The same nine samples were also sent to Mergen for hybridization but yielded similar findings (data not shown). We examined mean correlation among biological replicates within each platform type. Both FE1 and lung biological replicates of Affymetrix, Agilent and CodeLink arrays were highly correlated (from 0.76 to 0.93) compared to the academic cDNA and MO3 platforms (Table 1).
Differential expression between the FE1 and lung samples was determined using SAM (14). More genes were found to be differentially regulated using Codelink, Affymetrix and Agilent oligonucleotide arrays (Table 1) than the other three platforms. There was a significant difference in the number of changing genes detected between the platforms (Fisher's exact value, P < 0.001 for all comparisons). This difference was consistent when only genes in common across all platforms (895 genes based on UniGene ID) were used in SAM (Table 2). The two cDNA platforms and the MO3 platform did not show any genes differentially expressed of the 895 examined. We show that among the genes showing a significant response, there is a fair amount of overlap in the platforms (Table 2). Arrays showing low variance among replicates and high sensitivity will have an increased ability to detect differential expression. High variance limited the ability of MO3 and the academic cDNA arrays to detect differences among biological samples using SAM.
Table 2. SAM analysis on all genes in common by UniGene across the platforms.
| |
Affymetrix versus Agilent oligonucleotide |
Affymetrix versus Codelink |
Agilent oligonucleotide versus Codelink |
||||||
|---|---|---|---|---|---|---|---|---|---|
| Total in Affymetrix | Total in Agilent | Number in common | Total in Affymetrix | Total in Codelink | Number in common | Total in Agilent | Total in Codelink | Number in common | |
| Overexpressed | 35 | 8 | 5 | 35 | 18 | 12 | 8 | 18 | 4 |
| Underexpressed | 38 | 20 | 9 | 38 | 6 | 3 | 20 | 6 | 1 |
SAM was carried out using a delta of 3.0 and ignoring fold change. The cDNA and the MO3 platforms did not show any genes exhibiting differential expression at this conservative cut-off. Numbers in common indicate how many genes were found to be differentially expressed on both of the platforms.
Cross-platform comparisons
Pearson product-moment correlations of the average log2(ratio) (FE1:Reference or Lung:Reference) for ‘present’ genes were generated for platform pairs. Reasonably high correlations were found for Affymetrix, CodeLink and Agilent despite very different types of reporters and spotting protocols (2,16,17) (Table 3) for both (i) genes in common and present between the pairs of platforms and (ii) genes that are common and present on all platforms. Academic cDNA and MO3 showed lower correlations against all other platforms, most probably due to the higher variance associated with these microarrays. Canonical correlation was also used to analyse the relationship between pairwise combinations of the platforms. The canonical correlations by tissue type showed very similar correlations to Pearson product-moment correlations (Table 4).
Table 3. Pearson product-moment correlations: pairwise comparison of genes giving detectable signals that were common between (a) the two platforms or (b) across all platforms.
| Cell line lung | Agilent oligonucleotide | Affymetrix U74Av2 | Codelink oligonucleotide | Agilent cDNA | Academic cDNA | Mergen oligonucleotide |
|---|---|---|---|---|---|---|
| (a) Genes in common and ‘present’ for pairwise platform comparisons | ||||||
| Agilent oligonucleotide | – | 0.70 (3682)a | 0.72 (3868) | 0.70 (3056) | 0.45 (5723) | 0.49 (2644) |
| Affymetrix U74Av2 | 0.75 (3349) | – | 0.73 (2634) | 0.66 (1990) | 0.58 (2524) | 0.45 (2092) |
| Codelink Uniset I | 0.74 (3225) | 0.69 (2529) | – | 0.74 (2908) | 0.58 (3044) | 0.48 (2503) |
| Agilent cDNA | 0.73 (4118) | 0.72 (1972) | 0.71 (2740) | – | 0.62 (2614) | 0.50 (1785) |
| Academic cDNA | 0.44 (3864) | 0.52 (2392) | 0.49 (2787) | 0.56 (2454) | – | 0.43 (1728) |
| MO3 | 0.49 (2177) | 0.46 (1919) | 0.46 (2160) | 0.48 (1601) | 0.39 (1523) | – |
| (b) Genes in common and present across all platforms (490 in total) | ||||||
| Agilent oligonucleotide | – | 0.79 | 0.78 | 0.80 | 0.64 | 0.43 |
| Affymetrix U74Av2 | 0.72 | – | 0.75 | 0.74 | 0.61 | 0.40 |
| Codelink Uniset I | 0.78 | 0.75 | – | 0.74 | 0.57 | 0.38 |
| Agilent cDNA | 0.74 | 0.65 | 0.73 | – | 0.63 | 0.39 |
| Academic cDNA | 0.63 | 0.61 | 0.58 | 0.62 | – | 0.35 |
| MO3 | 0.46 | 0.45 | 0.46 | 0.46 | 0.38 | – |
Above the diagonal are mean correlation scores among replicates of the FE1 cell line and below are mean correlations among lung samples.
aNumber of genes used in the analysis.
Table 4. Canonical correlations for pairwise combinations of the platforms.
| Cell line lung | Agilent oligonucleotide | Affymetrix U74Av2 | Codelink oligonucleotide | Agilent cDNA | Academic cDNA | Mergen oligonucleotide |
|---|---|---|---|---|---|---|
| Agilent oligonucleotide | – | 0.74 (23 610) | 0.71 (23 253) | 0.70 (23 413) | 0.34 (19 824) | 0.49 (24 461) |
| Affymetrix U74Av2 | 0.70 (23 514) | – | 0.70 (24 414) | 0.74 (24 822) | 0.53 (24 497) | 0.54 (24 982) |
| Codelink Uniset I | 0.72 (23 128) | 0.72 (24 384) | – | 0.67 (23 082) | 0.49 (23 657) | 0.53 (24 289) |
| Agilent cDNA | 0.69 (23 333) | 0.67 (24 821) | 0.71 (23 103) | – | 0.52 (23 666) | 0.49 (24 806) |
| Academic cDNA | 0.47 (19 597) | 0.60 (24 469) | 0.57 (23 614) | 0.61 (23 638) | – | 0.46 (25 250) |
| MO3 | 0.50 (24 355) | 0.49 (24 932) | 0.52 (24 263) | 0.52 (24 791) | 0.47 (25 228) | – |
Above the diagonal are mean correlation scores among replicates of the FE1 cell line and below are mean correlations among lung samples.
A condition tree of the common genes was performed using standard correlation to examine microarray clustering (Figure 1). The main branch split the FE1 and lung samples into two groups with MO3 and academic cDNA slides visible as outliers. Within the main branches, platform types clustered together. The structure of the tree was supported by a factor analysis. Covariance relationships among platforms were examined; the top six factors accounted for 76.6% of the variability (Table 5). The first two factors represented cell type, FE1 and lung, respectively. Factors three to six represented individual platforms (MO3, Affymetrix, academic cDNA and Codelink, respectively).
Table 5. Factor analysis examining the variables that account for variability in the dataset.
| Factors | Variable represented | Variance explained | Cumulative proportion of total sample variance (%) |
|---|---|---|---|
| Factor 1 | FE1 | 9.18 | 25.5 |
| Factor 2 | Lung | 7.94 | 47.6 |
| Factor 3 | MO3 | 3.71 | 57.9 |
| Factor 4 | Affymetrix U74Av2 | 2.55 | 65.0 |
| Factor 5 | Academic cDNA | 2.48 | 71.9 |
| Factor 6 | Codelink Uniset | 1.68 | 76.6 |
DISCUSSION
As efforts build to make publicly available microarray data compulsory for many journals, questions remain regarding the importance of technology choice in evaluating the data generated and comparing among experiments from different laboratories. The objective of this comparative study is to elucidate whether gene expression profiles are more influenced by biology or by artefacts of technology. We present a comprehensive evaluation of six platform types ranging from two-colour cDNA spotted arrays to short in situ synthesized oligonucleotide chips, and characterize variability, sensitivity and correlation among these platforms.
We first evaluated variance among replicates within each of the platforms and found low levels of variance and high correlation among replicates for four platforms: Agilent oligonucleotide, Agilent cDNA, Codelink Uniset and Affymetrix U74Av2 (Table 1). Using SAM, we found significant differences among platform types in their ability to detect differential expression between the two very different cell types (Tables 1 and 2). The most differential gene expression was found using CodeLink Uniset, Affymetrix U74Av2 and Agilent mouse development microarrays. All of these platforms are oligonucleotide rather than cDNA-based (Agilent development chips were hybridized in two-colour arrays while the former two were one-colour arrays). The increased ability to detect the differential expression likely results from a combination of low variance within replicates and high sensitivity to fluctuations in messenger copy number. The MO3 platform is also composed of short oligonucleotide sequences. However, due in part to sub-optimal hybridization, the MO3 data were highly variable (Table 1). This increased variance limited the ability of this platform to detect differences between biological samples using SAM. The cDNA platforms showed lower variability than the MO3 platform, and variance of cDNA platforms was more similar to the top three oligonucleotide platforms. It has previously been suggested that cDNA are less sensitive than the oligonucleotide platforms, which may lead to an apparent decreased response of genes (2,3). Validating exercises using northern blotting and RT–PCR against cDNA or oligonucleotide platforms support the observations found in this study (3,10). Finally, there was a remarkable degree of overlap in the genes that were found to be differentially expressed among the Affymetrix, Agilent oligonucleotide and Codelink platforms (Table 2) when applying SAM only to genes in common across all platforms. This redundancy among platforms is an independent validation of the response of these genes, and is indicative of consistencies in the detection of differential expression among these technologies.
In the past year, different statistical strategies have been introduced to analyse expression data across arrays regardless of platform, protocol and hybridization procedures. The theoretical argument is that a sufficiently powerful mathematical method should successfully cope with comparisons across technologies. For example, Culhane et al. (18) described a multivariate method of analysis called co-inertia analysis. This application identifies trends, or co-relationships, in multiple datasets that contain the same samples. It finds successive axes from two datasets with maximum covariance. Using a panel of 60 tumour cell lines, they demonstrated the utility of the approach in examining consensus and divergence between gene expression profiles from Affymetrix and cDNA arrays, and show a high correlation between the two platforms. Wright et al. (19) introduced a statistical method based on a linear predictor score applied to hierarchical clustering results. They were able to classify samples into subgroups based on data obtained from spotted cDNA microarrays and used the calculated predictor to discover these same subgroups within a second set of samples profiled using oligonucleotide chips. The data suggest that biological condition, rather than technological approach, determines expression profiles.
In this study, we performed Pearson product-moment correlations on common genes across six platforms, based on comparisons of UniGene identity for the reporter. The resulting correlation coefficients provide a simple indicator of agreement between platform pairs. Recently, a study by Mecham et al. (20) demonstrates that correlation among platforms can be significantly increased by matching probes based on sequence rather than gene name or UniGene number. As some companies are still not making probe sequence information available, we were not able to carry out this type of analysis. Nevertheless, using our statistical calculations, oligonucleotide arrays appear to be highly correlated with each other and moderately correlated with Agilent cDNA chips (Table 3a and b). We also performed canonical correlations similar to those performed by Culhane et al. (18) as described above and found very similar results (Table 4). Therefore, the two different approaches yield nearly identical findings. Furthermore, we demonstrate, using a standard condition tree, that tissue type primarily accounts for the measured differences in gene expression among microarray slides regardless of platform type (Figure 1). The condition tree shows FE1 and lung samples split on two main branches, with MO3 and academic cDNA platforms falling outside these clusters. Within these main branches, biological replicates cluster within a platform type. The structure of the cluster analysis is supported by the factor analysis showing the top responding factors to be the two tissue types (Table 5). Within tissue types the primary determinant of clustering is platform, with biological replicates primarily grouping together within a platform. The data support the hypothesis that for broad comparisons between two sample types, run on different commercial and homemade platforms at different times, the primary determinants of microarray gene expression changes result from true biological differences, rather than artefacts of platform choice. These data are encouraging given the diversity of platforms used in the literature and suggest that datasets among laboratories may be more comparable than suggested previously (7).
Technological differences may influence the results of transcriptional profiling and are important to consider while using published results. However, given high-quality arrays and the appropriate normalization, the primary factor determining variance is biological rather than technological. Such a finding is reassuring with respect to comparison of data from different microarray platforms, and lends credence to large efforts aimed at obtaining and curating gene expression data in order for laboratories around the world to compare and share results. The findings are critical to the usefulness of publicly available databases like ArrayExpress run through the European Bioinformatics Institute (http://www.ebi.ac.uk/microarray/index.html).
Acknowledgments
ACKNOWLEDGEMENTS
Thanks to T. Ramsay and I. Curran for their helpful comments on the manuscript. This research was funded by the Canadian Regulatory System for Biotechnology and the Health Canada Genomics R&D fund.
REFERENCES
- 1.Barrett J.C., Kawasaki,E.S., Culhane,A.C., Perriere,G., Higgins,D.G., Kamb,A., Ramaswami,M., Li,C., Hung Wong,W., White,P.A. et al. (2003) Microarrays: the use of oligonucleotides and cDNA for the analysis of gene expression. Drug Discov. Today, 8, 134–141. [DOI] [PubMed] [Google Scholar]
- 2.Hughes T.R., Mao,M., Jones,A.R., Burchard,J., Marton,M.J., Shannon,K.W., Lefkowitz,S.M., Ziman,M., Schelter,J.M., Meyer,M.R. et al. (2001) Expression profiling using microarrays fabricated by an ink-jet oligonucleotide synthesizer. Nat. Biotechnol., 19, 342–347. [DOI] [PubMed] [Google Scholar]
- 3.Li J., Pankratz,M. and Johnson,J.A. (2002) Differential gene expression patterns revealed by oligonucleotide versus long cDNA arrays. Toxicol. Sci., 69, 383–390. [DOI] [PubMed] [Google Scholar]
- 4.Kane M.D., Jatkoe,T.A., Stumpf,C.R., Lu,J., Thomas,J.D. and Madore,S.J. (2000) Assessment of the sensitivity and specificity of oligonucleotide (50mer) microarrays. Nucleic Acids Res., 28, 4552–4557. [DOI] [PMC free article] [PubMed] [Google Scholar]
- 5.Wang H.Y., Malek,R.L., Kwitek,A.E., Greene,A.S., Luu,T.V., Behbahani,B., Frank,B., Quackenbush,J. and Lee,N.H. (2003) Assessing unmodified 70-mer oligonucleotide probe performance on glass-slide microarrays. Genome Biol., 4, R5. [DOI] [PMC free article] [PubMed] [Google Scholar]
- 6.Yuen T., Wurmbach,E., Pfeffer,R.L., Ebersole,B.J. and Sealfon,S.C. (2002) Accuracy and calibration of commercial oligonucleotide and custom cDNA microarrays. Nucleic Acids Res., 30, e48. [DOI] [PMC free article] [PubMed] [Google Scholar]
- 7.Kuo W.P., Jenssen,T.K., Butte,A.J., Ohno-Machado,L. and Kohane,I.S. (2002) Analysis of matched mRNA measurements from two different microarray technologies. Bioinformatics, 18, 405–412. [DOI] [PubMed] [Google Scholar]
- 8.Kothapalli R., Yoder,S.J., Mane,S. and Loughran,T.P.,Jr (2002) Microarray results: how accurate are they? BMC Bioinformatics, 3, 22. [DOI] [PMC free article] [PubMed] [Google Scholar]
- 9.Tan P.K., Downey,T.J., Spitznagel,E.L.,Jr, Xu,P., Fu,D., Dimitrov,D.S., Lempicki,R.A., Raaka,B.M. and Cam,M.C. (2003) Evaluation of gene expression measurements from commercial microarray platforms. Nucleic Acids Res., 31, 5676–5684. [DOI] [PMC free article] [PubMed] [Google Scholar]
- 10.Rogojina A.T., Orr,W.E., Song,B.K. and Geisert,E.E.,Jr (2003) Comparing the use of Affymetrix to spotted oligonucleotide microarrays using two retinal pigment epithelium cell lines. Mol. Vis., 9, 482–496. [PMC free article] [PubMed] [Google Scholar]
- 11.Mah N., Thelin,A., Lu,T., Nikolaus,S., Kuhbacher,T., Gurbuz,Y., Eickhoff,H., Kloppel,G., Lehrach,H., Mellgard,B. et al. (2004) A comparison of oligonucleotide and cDNA-based microarray systems. Physiol. Genomics, 16, 361–370. [DOI] [PubMed] [Google Scholar]
- 12.White P.A., Douglas,G.R., Gingerich,J., Parfett,C., Shwed,P., Seligy,V., Soper,L., Berndt,L., Bayley,J., Wagner,S. et al. (2003) Development and characterization of a stable epithelial cell line from Muta Mouse lung. Environ. Mol. Mutagen., 42, 166–184. [DOI] [PubMed] [Google Scholar]
- 13.Li C. and Hung Wong,W. (2001) Model-based analysis of oligonucleotide arrays: model validation, design issues and standard error application. Genome Biol., 2, RESEARCH0032. [DOI] [PMC free article] [PubMed] [Google Scholar]
- 14.Tusher V.G., Tibshirani,R. and Chu,G. (2001) Significance analysis of microarrays applied to the ionizing radiation response. Proc. Natl Acad. Sci. USA, 98, 5116–5121. [DOI] [PMC free article] [PubMed] [Google Scholar]
- 15.Johnson R.A. and Wichern,D.W. (2002) Applied Multivariate Statistical Analysis, 5th edn. Prentice Hall, Upper Saddle River, NJ. [Google Scholar]
- 16.Lipshutz R.J., Fodor,S.P., Gingeras,T.R. and Lockhart,D.J. (1999) High density synthetic oligonucleotide arrays. Nature Genet., 21, 20–24. [DOI] [PubMed] [Google Scholar]
- 17.Ramakrishnan R., Dorris,D., Lublinsky,A., Nguyen,A., Domanus,M., Prokhorova,A., Gieser,L., Touma,E., Lockner,R., Tata,M. et al. (2002) An assessment of Motorola CodeLink microarray performance for gene expression profiling applications. Nucleic Acids Res., 30, e30. [DOI] [PMC free article] [PubMed] [Google Scholar]
- 18.Culhane A.C., Perriere,G. and Higgins,D.G. (2003) Cross-platform comparison and visualisation of gene expression data using co-inertia analysis. BMC Bioinformatics, 4, 59. [DOI] [PMC free article] [PubMed] [Google Scholar]
- 19.Wright G., Tan,B., Rosenwald,A., Hurt,E.H., Wiestner,A. and Staudt,L.M. (2003) A gene expression-based method to diagnose clinically distinct subgroups of diffuse large B cell lymphoma. Proc. Natl Acad. Sci. USA, 100, 9991–9996. [DOI] [PMC free article] [PubMed] [Google Scholar]
- 20.Mecham B.H., Klus,G.T., Strovel,J., Augustus,M., Byrne,D., Bozso,P., Wetmore,D.Z., Mariani,T.J., Kohane,I.S. and Szallasi,Z. (2004) Sequence-matched probes produce increased cross-platform consistency and more reproducible biological results in microarray-based gene expression measurements. Nucleic Acids Res., 32, e74. [DOI] [PMC free article] [PubMed] [Google Scholar]