

Abstract
Purpose
To provide further insight into the role of proliferation and other cellular processes in chemosensitivity and resistance, we evaluated the association of a diverse set of gene expression signatures with response to neoadjuvant chemotherapy (NAC) in breast cancer.
Experimental Design
Expression data from primary breast cancer biopsies for 1419 patients in 17 studies prior to NAC were identified and aggregated using common normalization procedures. Clinicopathologic characteristics including response to NAC were collected. Scores for 125 previously published breast cancer-related gene expression signatures were calculated for each tumor.
Results
Within each receptor-based subgroup or PAM50 subtype, breast tumors with high proliferation signature scores were significantly more likely to achieve pCR to NAC. To distinguish ‘proliferation-associated’ from ‘proliferation-independent’ signatures, we used correlation and linear modeling approaches. Most signatures associated with response to NAC were proliferation-associated: 90.5% (38/42) in ER+/HER2- and 63.3% (38/60) in triple-negative breast cancer (TNBC). Proliferation-independent signatures predictive of response to NAC in ER+/HER2- breast cancer were related to immune activity, while those in TNBC comprised a diverse set of signatures, including immune, DNA damage, signaling pathways (PI3K, AKT, Ras, EGFR), and ‘stemness’ phenotypes.
Conclusion
Proliferation differences account for the vast majority of predictive capacity of gene expression signatures in neoadjuvant chemosensitivity for ER+/HER2- breast cancers and, to a lesser extent, TNBCs. Immune activation signatures are proliferation-independent predictors of pCR in ER+/HER2- breast cancers. In TNBCs, significant proliferation-independent signatures include gene sets that represent a diverse set of cellular processes.
Keywords: Breast cancer, gene expression profiling, cell cycle mechanisms of anticancer drug action, neoadjuvant chemotherapy, gene expression signatures
Introduction
In spite of remarkable progress in targeted therapeutics in breast cancer, including hormonal and HER2-directed therapies, chemotherapy continues to play a critical role in the management of over one third of all women with breast cancer.(1-3) Neoadjuvant chemotherapy (NAC) is associated with improved rates of conversion from mastectomy to breast conservation and also offers prognostic information: in a large meta-analysis, patients who achieved pCR following NAC had improved disease-free and overall survival relative to those with residual disease.(4) In addition, NAC provides a window through which to evaluate the intrinsic chemosensitivity of breast cancer, as patients receive no treatments prior to NAC and there is a discrete endpoint – pathologic complete response (pCR) or residual disease (RD).
Gene expression signatures are sets of genes whose expression patterns associate with a specific biological process or phenotype. Over 15 years ago, Perou and colleagues used gene expression profiling to describe molecular subtypes within breast cancer that initially correlated with overall survival and ultimately were shown to reflect sensitivity to NAC.(5-8) Studies of gene expression signatures by Desmedt, Sotiriou, and colleagues over the past decade revealed the importance of proliferation and other biologic processes, including immune activation, in breast cancer prognosis and response to NAC.(9-11) Recent prospective data from the TAILORx and MINDACT studies demonstrate the importance of signature-based genomic predictors (OncotypeDX and MammaPrint, respectively) in clinical decision-making for breast cancer.(12, 13) While these studies and many others demonstrate the utility of gene expression signatures, most evaluate only one or a small number of signatures, making cross-study comparison of signatures difficult due to sample and methodological differences. Systematically interrogating multiple individual gene expression signatures could provide insight into the complex network of pathways and processes involved in chemosensitivity and resistance.(14-16)
In this patient-level meta-analysis, we assembled publicly available mRNA microarray gene expression data from over 1400 breast cancer biopsies obtained prior to NAC, the largest dataset of its type to date. We collected study-reported response to NAC defined as pCR versus RD as well as patient clinicopathologic characteristics. With this large clinically annotated dataset, we interrogatated pathways involved in response to chemotherapy by evaluating and comparing 125 published breast cancer-related gene expression signatures implicated in chemosensitivity and resistance. We demonstrate that proliferation accounts for the vast majority of the predictive power of gene signatures within each subset of breast cancer and identify proliferation-independent signatures predictive of response to NAC, including immune signatures in ER+/HER2- breast cancers and signaling pathway signatures in triple-negative breast cancers.
Methods
Microarray Data
Using Preferred Reporting Items for Systematic Reviews and Meta-Analyses (PRISMA) guidelines, two gene expression repositories – the National Center for Biotechnology Information Gene Expression Omnibus (NCBI GEO; (17)) and the European Molecular Biology Laboratory/European Bioinformatics Institute (ArrayExpress; (18)) – were queried for available gene expression datasets; date of last query was May 1, 2015. Using the search terms “breast cancer” AND (neoadjuvant OR chemotherapy OR residual), we identified 22 studies with 2407 patient records (Figure 1.). Only studies with microarray gene expression data from Affymetrix (U133 and U133Plus2.0 arrays) and Agilent platforms were included to limit cross-platform variability. Individual samples were excluded if biopsy was obtained after NAC, if the patient received HER2-directed therapy (e.g. trastuzumab), or if pathologic response data were not available. Duplicate records were removed by careful review of GEO annotation and any records with Pearson correlation coefficient of one. In total, 1417 records from 17 studies were included for analysis (Table 1., Supplementary Table 1., NCBI GEO accession numbers GSE8465, GSE16446, GSE18728, GSE19697, GSE20194, GSE20271, GSE21974, GSE21997, GSE22093, GSE22226, GSE22358, GSE22513, GSE23988, GSE25066, GSE28796, GSE32646). Raw Affymetrix microarray data were processed with RMA normalization and Agilent microarray data was subjected to Lowess-normalization and log2 transformation. Samples were batch-median centered by study to allow cross-study comparison.(19, 20) To determine intrinsic breast cancer subtype, the ‘Bioclassifier’ package from Parker and colleagues (21) was used with no additional calibration parameters given that each dataset was relatively balanced with respect to ER-status by pathology: 49% and 58% ER-positive for Affymetrix and Agilent datasets, respectively (Table 2.).(7) Receptor status by gene expression was determined using the genefu package in R.(22) Triple-negative breast cancer (TNBC) subtype was determined using the TNBCtype tool (23) after re-normalizing data within TNBCs per recommended procedures.(24, 25) The ESTIMATE package was used to calculate estimated tumor purity using R version 2.15.3.(26)
Figure 1. Study Approach.
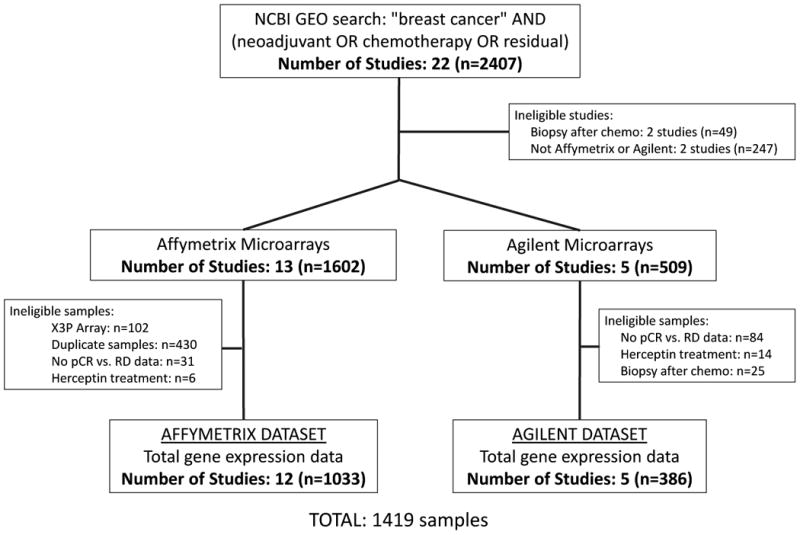
Study and sample identification schema. pCR, pathologic complete response; RD, residual disease.
Table 1. Studies Identified for Analysis.
| Affymetrix Dataset | |||||||
|---|---|---|---|---|---|---|---|
| Dataset (NCBI GEO) | Date of GEO | Cases in dataset | Evaluable | Chemotherapy | Response Definition | Platform | Reference (PMID) |
| GSE4779 | 12/19/08 | 102 | 0 | FEC | Breast only | Affymetrix Human X3P Array | 19122658 |
| GSE18728 | 10/30/09 | 61 | 19 | Docetaxel-capecitabine | Breast only | Affymetrix U133 Plus 2.0 Array | 20012355 |
| GSE19697 | 10/30/09 | 24 | 24 | Epirubicin-docetaxel | Breast or lymph nodes | Affymetrix U133 Plus 2.0 Array | 19967557 |
| GSE16446 | 1/26/10 | 120 | 85 | Epirubicin | Breast or lymph nodes | Affymetrix U133 Plus 2.0 Array | 21422418 |
| GSE20194 | 2/4/10 | 278 | 277 | TFAC | Breast or lymph nodes | Affymetrix U133A Array | 21978456 |
| GSE22513 | 6/23/10 | 28 | 28 | Paclitaxel with radiation | Breast or lymph nodes | Affymetrix U133 Plus 2.0 Array | 20068102 |
| GSE20271 | 10/15/10 | 178 | 178 | FAC/TFAC | Breast or lymph nodes | Affymetrix U133A Array | 20829329 |
| GSE22093 | 12/31/10 | 103 | 97 | FEC/FAC | Breast or lymph nodes | Affymetrix U133A Array | 21191116 |
| GSE23988 | 2/7/11 | 61 | 61 | FEC-T | Breast or lymph nodes | Affymetrix U133A Array | 21191116 |
| GSE28796 | 4/22/11 | 24 | 12 | Docetaxel | Breast or lymph nodes | Affymetrix U133 Plus 2.0 Array | 21633166 |
| GSE25066 | 5/11/11 | 508 | 79 | Anthracycline-taxane | Breast or lymph nodes | Affymetrix U133A Array | 21558518 |
| GSE25066 | 5/11/11 | NA | 58 | Anthracycline-taxane | Breast or lymph nodes | Affymetrix U133A Array | 21558518 |
| GSE32646 | 3/20/12 | 11 5 | 11 5 | P-FEC | Breast or lymph nodes | Affymetrix U133 Plus 2.0 Array | 22320227 |
| Affymetrix Total | 1602 | 1033 | |||||
| Agilent Dataset | |||||||
|---|---|---|---|---|---|---|---|
| Dataset (NCBI GEO) | Date of GEO | Cases in dataset | Evaluable | Chemotherapy | Response Definition | Platform | Reference (PMID) |
| GSE8465 | 1/12/08 | 46 | 35 | GD-GC | Breast only | Agilent-012097 Human 1A Microarray (V2) G4110B | 18382427 |
| GSE21974 | 5/25/10 | 57 | 32 | EC-T | Breast or lymph nodes | Agilent-014850 Whole Human Genome Microarray G4112F | 21769435 |
| GSE22358 | 3/18/11 | 158 | 95 | Docetaxel-capecitabine | Breast only | Agilent 1X44K Custom Array | 21373875 |
| GSE21997 | 5/27/11 | 98 | 94 | Doxorubicin vs. docetaxel | Breast or lymph nodes | Agilent Custom Array | 21465170 |
| GSE22226 | 1/13/12 | 150 | 130 | AC-T | Breast or lymph nodes | Agilent-012391 Whole Human Genome Microarray G4112A | 22198468 |
| Agilent Total | 509 | 386 | |||||
Chemotherapy Abbreviations: FEC: 5-FU, epirubicin, cyclophosphamide; FEC-T: 5-FU, epirubicin, cyclophosphamide, paclitaxel; TFAC: paclitaxel, 5-FU, doxorubicin, cyclophosphamide; TFAC: paclitaxel, 5-FU, doxorubicin, cyclophosphamide; PFEC: paclitaxel, 5-FU, epirubicin, cyclophosphamide; EC-T: epirubicin/cyclophosphamide followed by docetaxel; AC-T: doxorubicin/cyclophosphamide followed by docetaxel; GD-GC: Gemcitabine/doxorubicin followed by gemcitabine/cisplatin.
Table 2. Patient Characteristics.
| Affymetrix Dataset | Agilent Dataset | Total | |
|---|---|---|---|
| Characteristic | n=1033 (%) | n=386 (%) | n=1419 (%) |
| Age | |||
| <50 | 461 (49) | 116 (52) | 577 (49) |
| >50 | 488 (51) | 108 (48) | 596 (51) |
| Histologic Grade | |||
| Grade: 1 | 60 (7) | 29 (8) | 89 (7) |
| Grade: 2 | 347 (40) | 178 (49) | 525 (42) |
| Grade: 3 | 469 (54) | 156 (43) | 625 (50) |
| ER Status | |||
| ER pos | 508 (49) | 218 (58) | 726 (52) |
| ER neg | 521 (51) | 160 (42) | 681 (48) |
| HER2 Status | |||
| HER2 pos | 135 (12) | 72 (20) | 207 (14) |
| HER2 neg | 993 (88) | 292 (80) | 1285 (86) |
| Clinical Subtype | |||
| ER | 465 (49) | 183 (48) | 648 (49) |
| HER2 | 135 (14) | 91 (24) | 226 (17) |
| TNBC | 340 (36) | 106 (28) | 446 (34) |
| PAM50 Subtype | |||
| LumA | 280 (27) | 108 (28) | 388 (27) |
| LumB | 197 (19) | 82 (21) | 279 (20) |
| Her2 | 124 (12) | 38 (10) | 162 (11) |
| Normal | 95 (9) | 48 (12) | 143 (10) |
| Basal | 337 (33) | 110 (28) | 447(32) |
| Anthracycline | |||
| Anthracycline: Yes | 970 (94) | 250 (65) | 1220 (86) |
| Anthracycline: No | 63 (6) | 134 (35) | 197 (14) |
| Alkylator | |||
| Alkylator: Yes | 1037 (93) | 160 (42) | 1197 (80) |
| Alkylator: No | 84 (7) | 224 (56) | 308 (20) |
| Taxane | |||
| Taxane: Yes | 765 (74) | 291 (76) | 1056 (75) |
| Taxane: No | 268 (26) | 93 (24) | 361 (25) |
| Combination Chemotherapy | |||
| Anthra + Tax +/- Alk | 722 (76) | 156 (45) | 156 (41) |
| Anthra +/- Alk | 183 (19) | 53 (15) | 57 (15) |
| Taxane Only | 43 (5) | 4 (1) | 136 (35) |
| Anthtra + Plat | 0 | 136 (39) | 35 (9) |
Abbreviations: Anthra, Anthracycline; Tax, Taxane; Alk, Alkylator; Plat, Platinum.
Patient and Tumor Characteristics
Patient-specific data was obtained from NCBI GEO and Array Express including response to NAC, age, grade, pathologic receptor status (ER, PR, and HER2), and chemotherapy regimen (Table 2.). Response was categorized as pCR or RD based on study-specific definitions of endpoint. Most studies defined response by breast and axilla, though four studies reported breast-only response (Table 1. and Supplementary Table 1.). Pathologic receptor status was ‘positive’ or ‘negative’ based on study-specific definitions. For ER or PR immunohistochemistry (IHC), 0 was defined as ‘negative’ and 2-3 defined as ‘positive’, while IHC of 1 was considered indeterminate. A FISH HER2/CEP17 ratio of greater than 2.0 was defined as positive. Chemotherapy was patient-specified in 15 studies and based on the associated publication in two studies.
Gene Expression Signatures
Gene expression signatures were compiled from published studies describing a variety of processes implicated in chemosensitivity or resistance (11, 15) and from curated databases, including MSigDB(27) and GeneSigDB.(28) We included only signatures that were defined from mammary or breast cancer cell lines, breast cancer samples, or had been previously validated in breast cancer expression datasets. Signatures were categorized based on the proposed phenotype characterized by that signature (Figure 2A.). To establish a single value for each signature, we calculated the mean of the gene expression values identified as ‘up’ in each signature based on the original publication. As a sensitivity analysis, we evaluated those signatures that had both ‘up’ and ‘down’ genes (32/125 signatures; 25.6%) and calculated the mean of the ‘down’ genes subtracted from the mean of the ‘up’ genes. Bidirectional signature scores were highly correlated with scores calculated using only ‘up’ genes (median Pearson's r of 0.7412). Based on these data, we pursued subsequent analyses using only ‘up’ genes. We also included ‘random’ signatures of varying sizes (5, 10, 50, 100, 500 genes) composed of genes selected randomly from the transcriptome, termed ‘RANDOM.GENOME’ or genes randomly selected from the list of genes present in any signature, termed ‘RANDOM.SAMPLE.’ Signature nomenclature, categorization, reference/PMID, and full gene lists are provided (Supplementary Table S2.) as well as code for analyses in R (Supplemental Data).
Figure 2. Gene Expression Signatures.
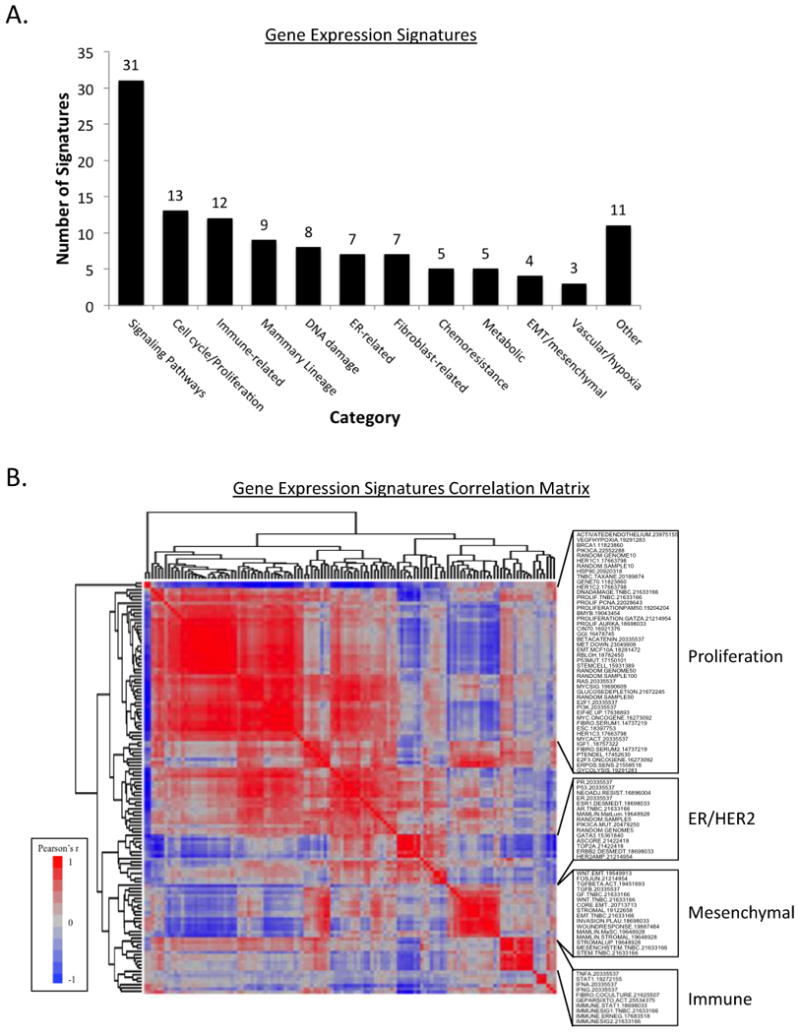
A. Gene expression signatures included in analysis categorized by reported target or phenotype.
B. Correlation matrix of 125 signatures. Heatmap of Pearson's correlation coefficient of pairwise correlation of each signature, clustered by association. ER, estrogen receptor; EMT, epithelial-to-mesenchymal transition.
Normal Mammary Epithelium Acinar Morphogenesis Assay
MCF-10A mammary epithelial cells were cultured in MatriGel™ as described previously and total mRNA was previously isolated from triplicate samples and hybridized onto Affymetrix gene chips U133A and U133B.(29) Raw gene expression data was RMA processed then batch median centered. The proportion of proliferating cells was previously determined by detecting total DNA content via FACS at each time point.(30)
Identification of Proliferation-Independent Signatures
To determine proliferation-associated versus proliferation-independent signatures, we performed a proliferation adjustment using the method proposed by Venet, et al.(31) Briefly, a linear model was constructed using the proliferation signature value for each sample fitted to the expression of each gene using the ‘lm’ function in R (version 3.1.3). Each expression measurement was then substituted by the sum of its residual and mean expression across the dataset. This approach was performed using two independent proliferation signatures, the 11-gene PAM50 proliferation index(32) and the 131-gene PCNA signature.(31) Venn diagrams were created using BioVenn.(33)
Evaluation of Proliferation-Immune ‘Meta-Signature’
To determine if we could improve predictive performance by combining signatures, we developed a proliferation-immune ‘meta-signature’ consisting of 18 genes – 11 from the PAM50 proliferation signature (BIRC5, CCNB1, CDC20, NUF2, CEP55, KNTC2, MKI67, PTTG1, RRM2, TYMS, and UBEC2) and 7 from the GeparSixto immune activation signature (CXCL9, CCL5, CD8A, CD80, CXCL13, IGKC, CD21).(32, 34) To evaluate the performance of this ‘meta-signature’, we combined ER+/HER2- cases from both Affymetrix and Agilent datasets (total n=642) and we randomly partitioned the combined ER+/HER2- dataset into equal training/validation subsets (n=321) then calculated the association of the ‘Proliferation-Immune’ meta-signature and the other 125 signatures via t-test. We repeated this approach for 1000 iterations then calculated an average FDR p-value for each signature as a measure of consistent performance.
Statistical Analysis
All microarray data processing and statistical analyses were performed in R version 3.1.3. Contrasts in patient and tumor characteristics were evaluated using Pearson chi-squared tests. Correlation among gene expression signatures was calculated using Pearson's coefficient, and hierarchical clustering was performed using average linkage. The association of signatures to continuous and categorical factors was evaluated using Student's t-test and analysis of variance, respectively. The association of individual genes significantly associated with NAC response were identified using ‘limma’ package and by t-test.(35) All calculations of association with response were multiple-testing corrected using Benjamini–Hochberg procedure for false discovery rate.
Results
Patient and Tumor Characteristics
This meta-analysis includes microarray expression data from breast cancer biopsies obtained prior to NAC from 1419 breast cancer samples in 17 studies (Figure 1., Table 1., and Supplementary Table S1.). The data were divided into two independent datasets based on microarray platform for validation purposes: an ‘Affymetrix Dataset’ (12 studies with 1033 total samples) and an ‘Agilent Dataset’ (5 studies with 386 total samples). The two datasets were relatively balanced with respect to age, grade, pathologic ER and HER2 receptor status, and clinical subtype (Table 2.). HER2+ breast cancers were relatively under-represented relative to general incidence as we excluded those patients who received HER2-directed therapy, while TNBCs were relatively over-represented given that patients with TNBC are more likely to receive neoadjuvant chemotherapy. The chemotherapeutic agents that these patients received are similar to those agents that are currently administered in most centers. Clinicopathologic characteristics known to be associated with response to NAC - including tumor grade, receptor status, receptor-based subtype, and PAM50 status - were all significantly associated with response to NAC in both the Affymetrix and Agilent datasets (all p<0.05; Supplementary Table S3.).
A Large Proportion of Gene Expression Signatures Correlate Highly with Proliferation
We evaluated 125 gene expression signatures representing the expression patterns of a diverse set of pathways and cellular processes implicated in chemosensitivity and resistance in the 1033 breast cancers samples in the Affymetrix dataset (Figure 2A.). Pairwise correlation of the calculated values for each published signature in every sample and subsequent unsupervised clustering demonstrates that independently-derived signatures reveal marked redundancy (Figure 2B.). The largest cluster is comprised of 46 signatures (46/125 signatures; 36.8%) with five well-established proliferation signatures at the center of the cluster (10, 15, 24, 31, 32). The 46 signatures in this group each demonstrate a strong correlation to the 11-gene PAM50 proliferation signature(32) (Pearson's r >0.40 for all associations; p<1×10-45) and will be considered ‘proliferation-associated’ by correlation. Although only 11 signatures were designed to represent proliferation or cell cycle (Figure 2A.), the pairwise correlation data suggest that a large proportion of published signatures, irrespective of described signature target nonetheless correlate highly with proliferation. Several other distinct clusters were evident, centering around ER and HER2-related signatures, mesenchymal-related signatures, and immune-related signatures (Figure 2B.). This supports prior evidence of significant redundancy among published gene expression signatures.(11, 36)
Proliferation Signatures Are Sensitive Over a Range of Mammary Cell Proliferative States
To explore gene expression-based proliferation signatures in greater detail, we evaluated proliferation gene expression signatures in a 3D culture model of immortalized normal mammary epithelial cells that undergo a programmed proliferation arrest, transitioning from a high proliferation state (30-35% in G2-S phase on days 2-5) to a low proliferation state (approximately 5% in G2-S phase days 12-15; Figure 3A.). We assessed the proportion of proliferating cells daily over a 15-day time-course and compared this with five well-established proliferation signatures, calculated from RNA collected in triplicate each day (Figure 3A.).(10, 15, 24, 31, 32) The five proliferation signatures show a strong inter-signature correlation (Pearson's r > 0.97 for all associations) and each has a strong correlation with proportion of proliferating cells (Pearson's r > 0.88 for all associations). These in vitro results indicate that the five proliferation signatures, derived from patient tumor expression data, reproducibly measure cellular proliferation of mammary epithelial cells.
Figure 3. Gene Expression-Based Proliferation Signatures and Response to Neoadjuvant Chemotherapy.
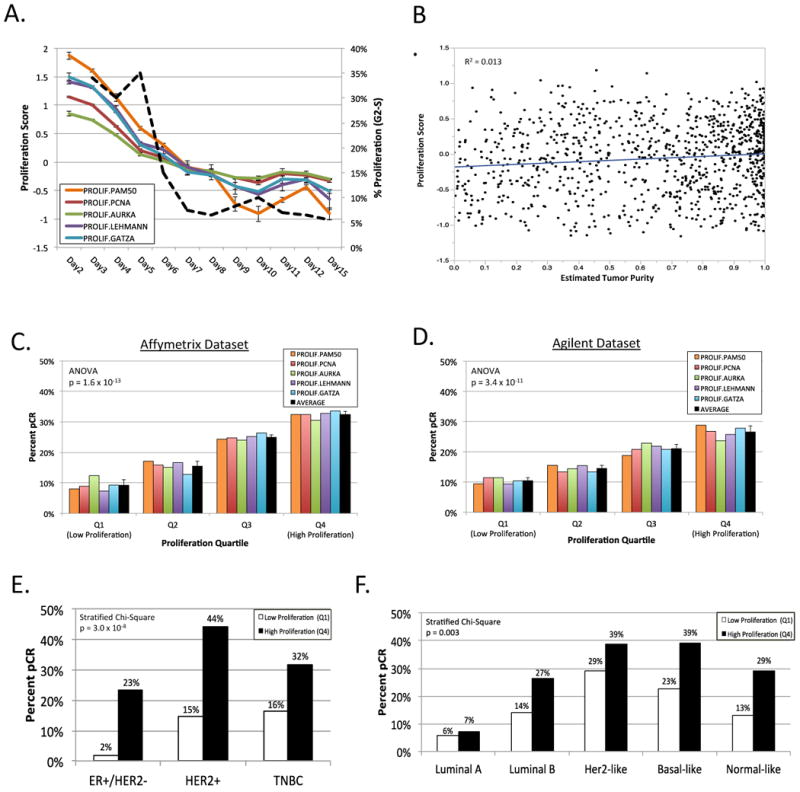
A. 15-day time course experiment of MCF10A immortalized mammary epithelial cells in 3D in vitro culture. Proliferation signature value for five proliferation signatures(10, 15, 24, 31, 32) indicated in color with error bars representing standard deviation. Percent proliferating cells (in G2-S phase) by DNA content in dashed black line. B. Comparison of 11-gene PAM50 proliferation signature(32) with estimated tumor purity; line indicates best fit. C. & D. Percent pathologic complete response (pCR) by proliferation quartile for each of five proliferation signatures in Affymetrix dataset (C.) and Agilent dataset (D.). Error bars indicate standard deviation. E. & F. Percent pCR within subgroups of breast cancer by low proliferation (quartile 1) versus high proliferation (quartile 4) by receptor-based subtype (E.) or PAM50 subtype (F.). TNBC, triple-negative breast cancer.
Tumor biopsies often capture non-tumor cells that could impact the proliferation score, for example low proliferative fibroblasts or high proliferative immune cells. We calculated tumor purity for each sample using a method that infers the fraction of stromal and immune cells in tumor samples, shown to correlate with tumor purity based on DNA copy number.(26) Estimated tumor purity demonstrated no relationship with the 11-gene PAM50 proliferation score(32) across all samples (R2 = 0.013; Figure 3B.).
Response to Neoadjuvant Chemotherapy is Strongly Associated With Proliferation
We evaluated the five proliferation signatures described above in 1419 breast tumors. More highly proliferative tumors were associated with a greater proportion of pCR to NAC in both the Affymetrix and Agilent datasets (Figure 3C. and 3D.; ANOVA p=1.6×10⁻¹³ and p=3.2×10⁻¹¹, respectively). Within individual breast cancer subgroups, the highest proliferative quartile of tumors via the 11-gene PAM50 proliferation index were associated with a greater proportion of pCR in all receptor-based (ER+/HER2-, HER2+, TNBC; Figure 3E.) and PAM50 (Luminal A, Luminal B, Her2-like, Basal-like, Normal-like; Figure 3F.) subgroups. This association was highly statistically significant by stratified Chi-Square: p = 3.0 × 10⁻⁸ and p=0.003, respectively (Supplementary Table S4A.). As a sensitivity analysis, we also compared proliferation above/below median; higher proliferation remained significantly associated with a greater proportion of pCR for both receptor-based subgroups (p = 0.0004) and PAM50 subgroups (p=0.047; Supplementary Table S4B.). Additionally, we evaluated proliferation and pCR rate among the TNBC subtypes from Lehmann and colleagues using proliferation above/below median.(24) Five of the TNBC subtypes demonstrated higher pCR rates for highly proliferative tumors (basal-like 2, immunomodulator, luminal AR, mesenchymal, unselected) while two did not (basal-like 1, mesenchymal stem-like). Given the limited number of tumors within each TNBC subtype, it is not surprising that the trend for proliferation correlating with pCR within the TNBC subtypes did not reach statistical significance (stratified Chi-Square p=0.22; Supplementary Table S4B.).
To evaluate the performance of proliferation signatures versus individual genes, we evaluated three individual genes commonly associated with proliferation: MKI67, PCNA, and AURKA. Comparing each individual proliferation gene with each of the five proliferation signatures demonstrates robust correlation across all comparisons (median Pearson's r = 0.79, range 0.59-0.88; Supplemental Figure S1A.). We stratified the expression of each gene into quartiles calculated across subtypes or within subtypes as an attempt to approximate a tissue-based biomarker (e.g. 0, 1+, 2+, 3+). Each individual marker of proliferation was significantly associated with pCR; however the 11-gene PAM50 signature outperformed (lower stratified Chi-square p-value) each individual gene in comparisons where quartiles are defined within subtypes. In analysis across subtypes, the 11-gene PAM50 signature outperformed MKI67 and AURKA and was comparable to PCNA (p=4.3×10⁻⁵ vs. 1.3×10⁻⁵, respectively), suggesting that expression-based proliferation signatures have the potential to be more robust biomarkers than individual genes (Supplemental Figure S1B/C.).
Most Signatures Highly Associated with Response are Proliferation-Associated
We evaluated the significance of association of each of the 125 gene expression signatures with response to NAC (pCR vs. RD; ; Supplementary Table S5A-H.). The signatures associated with response were highly overlapping between Affymetrix and validation Agilent datasets: among all breast cancers, 88.9% (48/54) of statistically significant (FDR p<0.05) signatures in the smaller Agilent dataset were also significant in the Affymetrix dataset. To investigate the potential impact of median center normalization by study, multivariate analysis of signatures with study as a covariate demonstrated that very few signatures that shifted from significant to not significant (or vice-versa): 1.6% in ER+/HER2-, 5.6% in TNBC, and 4.8% in basal-like (Supplementary Figure S2A-C.).
Among receptor-based ER+/HER2- breast cancers (Figure 4A.), four of the five most highly associated signatures were proliferation signatures(14, 24, 31, 32) and the fifth a STAT1 signature(37); all five signatures were positively correlated to pCR. For TNBC (Figure 4B.), the five signatures most highly associated with response included a signature of E2F1 activity,(14) an expression-based predictor of chemosensitivity,(38) a PI3K signature,(14) a PTEN deletion signature,(39) and the ‘mature luminal’ mammary lineage signature(40); the ‘mature luminal’ signature was positively correlated with RD while the other four signatures with pCR. Thirty signatures were predictive of response in both ER+/HER2- and triple-negative breast cancers, while sixteen signatures were predictive in both triple-negative and basal-like breast cancers (Supplementary Figure S3A.). Within each of the PAM50 subgroups, multiple signatures had nominal p-values less than 0.05 for association with response to NAC (Supplementary Tables S5D-H.). However, after correcting for multiple testing at a false-discovery threshold of 0.05, signatures remain statistically significant only in basal-like (17 signatures) and normal-like (2 signatures) subgroups. The ranked statistical significance, direction of association, and grouping for all signatures is provided in Supplementary Table S5A-H.
Figure 4. Signatures Associated with Response to Neoadjuvant Chemotherapy: Proliferation-Associated versus Proliferation-Independent.
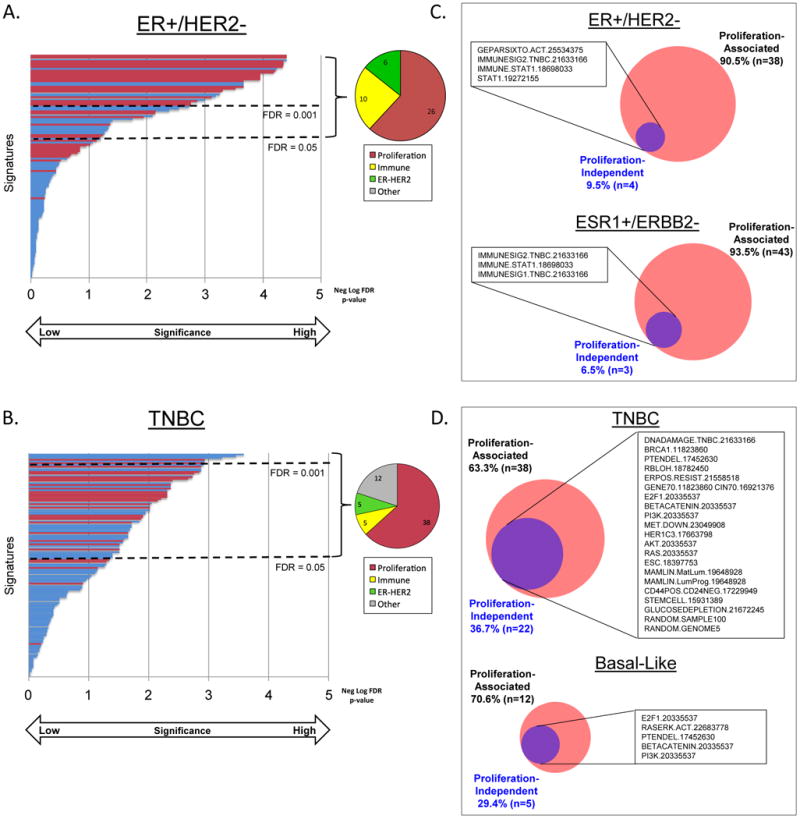
A. & B. 125 gene expression signatures ordered from top to bottom by significance of association with response to neoadjuvant chemotherapy in estrogen receptor-positive/HER2-negative (ER+/HER2-; A.), and triple-negative breast cancer (TNBC; B.). Proliferation-associated signatures by correlation to the 11-gene PAM50 proliferation signature (32) (Pearson's r >0.40) indicated in red. Pie graphs indicate proportion of signatures significantly associated with response (FDR p<0.05) by correlation matrix-based signature category (Figure 2B.) C. & D. Venn diagrams of the number of signatures significantly associated with response in original dataset (red) versus proliferation-normalized dataset (purple). ESR1+/ERBB2- indicates tumors positive for ESR1 gene expression and negative for ERBB2 gene expression. TNBC, triple-negative breast cancer.
To investigate the contribution of proliferation relative to other processes, we compared pCR rates of the five ‘pure’ proliferation signatures with the most highly significant five signatures in the proliferation cluster (‘proliferation-associated’), five signatures that were significantly associated with response but anti-correlated to proliferation, and five immune signatures that were ‘proliferation-independent.’ When all breast cancers are stratified into quartiles by signature score, ‘pure’ proliferation and ‘proliferation-associated’ signatures revealed a very similar pCR increase from approximately 10% pCR at the lowest signature level to approximately 35% pCR at the highest signature level with a parallel rise in average proliferation score (Supplemental Figure S3C/D.). The five proliferation anti-correlated signatures demonstrate a decline in pCR rate with a parallel – but less dramatic – decline in proliferation score (Supplemental Figure S3E.). Five immune signatures reflected a pCR rate increased with higher immune signature with minimal change in average proliferation score (Supplemental Figure S3F.).
Proliferation-Associated Versus Proliferation-Independent Signatures Delineate Neoadjuvant Chemotherapy Response
We evaluated proliferation-associated versus proliferation-independent signatures by two distinct approaches: 1) correlation to the 11-gene PAM50 signature and 2) linear modeling and residualization to adjust total gene expression data for proliferation.(31) For the correlation approach, we considered signatures in the proliferation cluster as ‘proliferation-associated’ (Figure 2B.; Pearson's r >0.40 to the 11-gene PAM50 proliferation signature, p<1×10-45), with the remaining signatures ‘proliferation-independent.’ In the linear modeling approach, those signatures that were significantly associated with response after proliferation normalization were considered ‘proliferation-independent.’ As a sensitivity analysis, we evaluated linear-modeling-based normalization using two separate proliferation signatures, the 11-gene PAM50 proliferation index(32) and the 131-gene PCNA proliferation signature(31). Non-proliferation signatures were largely unaffected by normalization via either signature. (Supplementary Figure S2D.)
Using the correlation approach, ‘proliferation-associated’ signatures accounted for the majority of the signatures that achieved statistical significance: 26/42 (61.9%) in ER+/HER2- breast cancers, and 38/60 (63.3%) in TNBCs (Figure 4A and 4B., red bars). Among signatures that were not ‘proliferation-associated’ by correlation, in ER+/HER2- breast cancers most were related to immune activation (10/16; 62.5%)(10, 14, 20, 24, 34, 37, 41) while in TNBC the signature phenotypes were diverse, including signaling pathways, immune, DNA damage, and mesenchymal phenotype.
Using the linear modeling approach, in ER+/HER2- breast cancer nearly all signatures significantly associated with response were ‘proliferation-associated’ (38/42; 90.5%). The four ‘proliferation-independent’ signatures were related to immune activation: a signature of immune genes predictive in the GeparSixto trial,(34) an immune signature from TNBC subtypes,(24) and two STAT1 signatures (Figure 4C.).(10, 37) As a sensitivity analysis, we also evaluated ER+ tumors defined by gene expression (ESR1-positive/ERBB2-negative) and found only 3 ‘proliferation-independent’ signatures, which were likewise immune-related and overlapping with those in ER+/HER2-.(10, 24) In luminal A or B breast cancers, eight of the 21 signatures with nominal p-values less than 0.05 for association with response to NAC were likewise immune signatures (Supplementary Table S5D. & S5E.). We repeated our approach using the 131-gene PCNA signature-normalized data and the results demonstrated an overlapping list of proliferation-independent immune activation signatures (Supplementary Figure S2E.). At the individual gene level, we found that >95% of individual genes significantly associated with response for both ER+/HER2- and ESR1+/ERBB2- were proliferation-associated using either proliferation normalized dataset (Supplementary Figure S2F. and S2G.).
Among TNBCs, 63.3% (38/60) of signatures significantly associated with pCR were ‘proliferation-associated’ using the linear modeling approach. The 22 (36.7%) ‘proliferation-independent’ signatures comprised a variety of processes, including DNA damage/chromosomal instability/mutation, signaling pathways (including PI3K, AKT, Ras, EGFR), ‘stemness’ signatures, prognostic/predictive signatures, and two signatures of randomly selected genes (Supplementary Table S5C.). Signatures made up of random genes from across the genome have been shown to be prognostic in breast cancer previously.(31) At the individual gene level, the proportion of significant genes that were ‘proliferation-independent’ in TNBCs was 22.5%-32.4%, similar to the proportion of signatures (Supplementary Figure S2F/G.). Additional sensitivity analyses in PAM50-defined basal-like breast cancer reveal a comparable proportion and overlapping ‘proliferation-independent’ signatures and genes associated with response (Figure 4D., Supplementary Figure S2F/G.).
Based on evidence that immune signatures are a proliferation-independent predictor of pCR in ER+/HER2- disease, we developed a proliferation-immune ‘meta-signature’ as a proof-of-concept application of these data. This proliferation-immune ‘meta-signature’ consists of 18 genes – 11 that comprise the PAM50 proliferation signature and 7 that comprise the GeparSixto immune activation signature.(10, 32) We combined ER+/HER2- cases from both Affymetrix and Agilent datasets (total n=642) and iteratively evaluated the performance of the proliferation-immune ‘meta-signature’ in randomly assigned, equally sized (n=321) training/validation subsets. Over 1000 iterations, the proliferation-immune ‘meta-signature’ signature demonstrated a stronger association with pCR than any other individual signature in ER+/HER2- breast cancers (Supplementary Figure S3G.).
Discussion
We compiled gene expression data from 1419 breast cancer biopsies obtained prior to NAC excluding patients who received HER2-directed therapy, the largest data set of its kind, and calculated 125 gene expression signatures for each sample. We demonstrate that proliferation signatures are highly associated with pCR in all subgroups of breast cancer. These proliferation signatures reflect a broad range of proliferation in an in vitro model of mammary epithelial cell proliferation. We further demonstrate that proliferation differences account for the majority of variation in chemosensitivity in ER+/HER2- breast cancer and remains important - but less so - in TNBCs. Importantly, we provide an approach to distinguish proliferation-related from proliferation-independent gene expression signatures and identify immune-related signatures as an important proliferation-independent predictor of sensitivity to neoadjuvant chemotherapy in ER+/HER2- breast cancer. An eighteen gene combined proliferation-immune ‘meta-signature’ performed better than all other signatures in predicting response to neoadjuvant chemotherapy in ER+/HER2- breast cancers.
Proliferation has long been implicated as a critical mediator of sensitivity to chemotherapy(42, 43) as well as a predictor of long-term outcome (22, 31, 36), but the extent to which proliferation accounts for chemosensitivity relative to other processes is not well understood. Our findings reinforce the overwhelming importance of proliferation in response to chemotherapy in tumors: even within each PAM50 subgroup, which are defined in part by 11 proliferation-related genes, higher proliferative tumors are more likely to achieve pCR. The association of proliferation with chemosensitivity varies based on the subgroup, more prominent in higher proliferative subgroups (e.g. basal-like more than luminal A). These data support multivariate analyses in a prior gene expression study of an overlapping dataset(11) and work from Prat and colleagues on the PAM50 subtypes and Prosigna assay in NAC.(44, 45) A recent study retrospectively evaluated proliferation and PAM50 subtype in CALGB 9741, a clinical trial evaluating adjuvant dosing strategies of doxorubicin, cyclophosphamide, and paclitaxel in node-positive breast cancer patients.(46) A trend toward better prognosis for dose-dense chemotherapy with higher proliferation score suggests that the proliferation-chemosensitivity association may also be impacted by dosing. Most prognostic multi-gene expression assays used clinically are already heavily weighted toward proliferation-related genes, including OncotypeDX, Mammaprint, and Prosigna.(7, 47, 48) As novel signatures are defined, reported, or brought into clinical practice, demonstrating predictive or prognostic significance above and beyond existing proliferation signatures could serve a benchmark for identifying novel, clinically relevant signatures.
In this study, using a linear modeling approach to identify proliferation-associated signatures and genes we find that the majority of the predictive capacity for response to neoadjuvant chemosensitivity within ER+ breast cancer is associated with proliferation: 90% of signatures and >95% of individual genes significantly associated with response to NAC can be attributed to proliferation. The striking degree to which proliferation accounts for predictive capacity of gene expression is supported by stratifying into the ER+ PAM50 subtypes, luminal A and B, which are distinguished primarily based on proliferation. No signatures remained statistically significant for association with response to NAC in either luminal A or B after multiple-testing correction. Within TNBCs, proliferation remains important but accounts for a lesser extent of variation in response: approximately 65% of signatures and individual genes associated with response to NAC are proliferation-associated by our linear modeling approach. The smaller proportion of ‘proliferation-associated’ signatures in TNBCs may reflect less variation in proliferation among TNBCs relative to other breast cancer subtypes.(24) The differences between ER+/HER2- and TNBC, as well as among PAM50 subtypes, suggest that subgroup-specific genomic predictors are more likely to provide optimal prediction of chemosensitivity and resistance.
A crucial next step is to understand what impacts chemosensitivity outside of proliferation. Our data suggest that immune activity plays a crucial role in response to NAC as multiple distinct immune signatures are associated with response to NAC, particularly in ER+/HER2- breast cancers, an observation that may have been masked in historical analyses by effects of proliferation.(16) These signatures appear to primarily reflect immune activation, as they are comprised of activating cytokines, chemokines, and immune response genes (Supplementary Table S1.). In transcriptional analyses of tumor biopsies, it is difficult to discern whether these signatures reflect tumor cell-intrinsic expression differences or, alternately, transcriptional programs of infiltrating lymphocytes. Tumor infiltrating lymphocytes (TILs), evidence of immune activation, have been shown to be a predictive marker of response to NAC primarily in HER2+ and TNBC breast cancer but to date the association has been less robust in ER+/HER2- breast cancers.(49, 50) We are currently evaluating the underlying cause or driver of these immune signatures.
From a clinical perspective, predictive markers of pCR are needed as we increasingly consider patients for NAC. This study supports expanded use of expression-based proliferation signatures, given our data regarding suggesting enhanced predictive capacity of proliferation signatures relative to individual proliferation gene expression, two prior studies demonstrating greater prognostic value of the 11-gene proliferation score than tissue-based Ki-67 staining,(32, 51) and ongoing debate regarding the reproducibility of immunohistochemical proliferation markers in clinical care.(52-55) The combination of a proliferation signature and an immune activation signature into a single ‘meta-signature’ demonstrated a higher predictive capacity than any other individual signature in ER+/HER2- breast cancers. More robust predictors for ER+/HER2- breast cancers would particularly useful those patients with ‘intermediate’ scores in proliferation-based assays like OncotypeDX or MammaPrint.
Our findings implicate many processes other than proliferation in neoadjuvant chemosensitivity in TNBC and basal-like breast cancer. Sequencing of paired TNBC samples before and after NAC revealed few recurrent chemoresistance-related mutations, suggesting that mutations alone do not explain chemoresistance, potentially implicating transcriptional differences.(56) Proliferation-independent signatures predictive of response in our analysis include DNA damage/chromosomal instability, signaling pathway activation (PI3K, AKT, Ras, EGFR), and ‘stemness’ phenotypes. Signaling pathway activation signatures may appear paradoxical, as these are known to induce proliferation, but this analysis suggests that proliferation-independent components of these pathways also drive an association with response to chemotherapy in TNBCs. The phosphoinositide 3-kinase (PI3K) pathway is particularly of interest in TNBCs given evidence of activating PIK3CA mutations in the luminal AR subtype as well as pathway activation frequently by PTEN loss in non-luminal TNBCs. (24, 57, 58) Multiple immune signatures were associated with pCR in TNBCs, however, none remained statistically significant after proliferation adjustment. Despite the absence of a robust association between proliferation and immune signatures in TNBCs (Pearson's r2 <0.08 for all associations, data not shown), we are investigating potential links between DNA damage, proliferation, and immune signatures as a possible explanation. Collectively, these data add to our growing understanding of the particularly complex nature of chemosensitivity in TNBC and suggest that stratifying TNBCs based on gene expression signatures may improve prediction of response to NAC in addition to existing expression-based tools/subgroups that rely heavily on proliferation.
Although pooled analyses of clinical trials have not validated the proportion of patients who achieve a pCR as a surrogate endpoint for event-free or overall survival, NAC remains valuable in clinical practice and as a research platform. Predictive markers of pCR are needed as we increasingly consider patients for NAC.(4) These data support consideration of expanded use of expression-based proliferation signatures, possibly in conjunction with immunohistochemical proliferation markers (e.g. mitotic index, Ki-67, or PCNA).(53-55) In ER+/HER2- disease, incorporating markers of immune activation may provide more robust gene expression-based predictors of response and help discern likelihood of response for those with ‘intermediate’ proliferation. In TNBC, this study provides candidate cellular processes that could be integrated into a unified tool or stratification approach to improve chemotherapy response prediction in this challenging subgroup.
Study Limitations
Our study should be interpreted in the context of several limitations. The inclusion criteria of the 17 trials varied and definition of pathologic complete response was primarily, but not exclusively, both breast and axillae. In addition, we defined response as pCR versus RD but analyzing by Miller-Payne(59) or RCB(60) may add information, particularly as there is evidence that RCB-1 may have similar long-term outcomes as RCB-0.(60) Although the chemotherapy agents used in the studies included are similar to those we use for standard of care today, there was variability in regimen and dosing. We focused our analysis exclusively on response to NAC and cannot extrapolate to the adjuvant or metastatic settings, although those analyses are ongoing. There are also general limitations to gene expression data, including failure to capture protein level effects (e.g. apoptotic/BH3 proteins).
Conclusions
In this gene expression-based meta-analysis, proliferation differences account for the majority of predictive capacity of gene expression signatures in neoadjuvant chemosensitivity for ER+/HER2- breast cancers and, to a lesser extent TNBCs. In ER+/HER2- breast cancer, proliferation-independent signatures predictive of response were all related to immune activation. In TNBC, sensitivity and resistance to neoadjuvant chemotherapy is complex and associated with a diverse set of proliferation-associated and proliferation-independent signatures.
Supplementary Material
Statement of Translational Relevance.
Expression-based signatures and genomic predictors are increasingly incorporated into clinical practice to predict benefit from chemotherapy. We evaluated 125 published gene expression signatures in a patient-level meta-analysis of gene expression data from breast cancer biopsies prior to neoadjuvant chemotherapy (NAC) to understand the contribution of proliferation and other processes in patient response to NAC. The majority of signatures associated with pathologic complete response (pCR) are proliferation-associated within each receptor-based or PAM50 breast cancer subgroup. However, proliferation-independent signatures offer important insights into additional biological processes that contribute to chemosensitivity and resistance. Specifically, multiple distinct immune signatures are associated with response to NAC independent of proliferation in ER+/HER2- breast cancers while a diverse set of signatures predict response to NAC independent of proliferation in triple-negative breast cancers. We provide proof-of-concept that integrating proliferation and immune signatures results in a more robust biomarker for neoadjuvant chemosensitivity in ER+/HER2- breast cancer.
Acknowledgments
Financial Support: Financial support provided by Susan G. Komen for the Cure PDF14299961 (D.G. Stover), Breast Cancer Alliance FS45312 (J.S. Brugge), and Breast Cancer Research Foundation (J.S. Brugge).
Footnotes
Conflicts of Interest: The authors have no conflicts of interest to report.
References
- 1.Lyratzopoulos G, Abel GA, Barbiere JM, Brown CH, Rous BA, Greenberg DC. Variation in advanced stage at diagnosis of lung and female breast cancer in an English region 2006-2009. British journal of cancer. 2012;106:1068–75. doi: 10.1038/bjc.2012.30. [DOI] [PMC free article] [PubMed] [Google Scholar]
- 2.Carey LA, Perou CM, Livasy CA, Dressler LG, Cowan D, Conway K, et al. Race, breast cancer subtypes, and survival in the Carolina Breast Cancer Study. Jama. 2006;295:2492–502. doi: 10.1001/jama.295.21.2492. [DOI] [PubMed] [Google Scholar]
- 3.Siegel R, DeSantis C, Virgo K, Stein K, Mariotto A, Smith T, et al. Cancer treatment and survivorship statistics, 2012. CA: a cancer journal for clinicians. 2012;62:220–41. doi: 10.3322/caac.21149. [DOI] [PubMed] [Google Scholar]
- 4.Cortazar P, Zhang L, Untch M, Mehta K, Costantino JP, Wolmark N, et al. Pathological complete response and long-term clinical benefit in breast cancer: the CTNeoBC pooled analysis. Lancet. 2014;384:164–72. doi: 10.1016/S0140-6736(13)62422-8. [DOI] [PubMed] [Google Scholar]
- 5.Perou CM, Sorlie T, Eisen MB, van de Rijn M, Jeffrey SS, Rees CA, et al. Molecular portraits of human breast tumours. Nature. 2000;406:747–52. doi: 10.1038/35021093. [DOI] [PubMed] [Google Scholar]
- 6.Sorlie T, Perou CM, Tibshirani R, Aas T, Geisler S, Johnsen H, et al. Gene expression patterns of breast carcinomas distinguish tumor subclasses with clinical implications. Proceedings of the National Academy of Sciences of the United States of America. 2001;98:10869–74. doi: 10.1073/pnas.191367098. [DOI] [PMC free article] [PubMed] [Google Scholar]
- 7.Parker JS, Mullins M, Cheang MC, Leung S, Voduc D, Vickery T, et al. Supervised risk predictor of breast cancer based on intrinsic subtypes. Journal of clinical oncology : official journal of the American Society of Clinical Oncology. 2009;27:1160–7. doi: 10.1200/JCO.2008.18.1370. [DOI] [PMC free article] [PubMed] [Google Scholar]
- 8.Liedtke C, Mazouni C, Hess KR, Andre F, Tordai A, Mejia JA, et al. Response to neoadjuvant therapy and long-term survival in patients with triple-negative breast cancer. Journal of clinical oncology : official journal of the American Society of Clinical Oncology. 2008;26:1275–81. doi: 10.1200/JCO.2007.14.4147. [DOI] [PubMed] [Google Scholar]
- 9.Gingras I, Desmedt C, Ignatiadis M, Sotiriou C. CCR 20th Anniversary Commentary: Gene-Expression Signature in Breast Cancer-Where Did It Start and Where Are We Now? Clinical cancer research : an official journal of the American Association for Cancer Research. 2015;21:4743–6. doi: 10.1158/1078-0432.CCR-14-3127. [DOI] [PubMed] [Google Scholar]
- 10.Desmedt C, Haibe-Kains B, Wirapati P, Buyse M, Larsimont D, Bontempi G, et al. Biological processes associated with breast cancer clinical outcome depend on the molecular subtypes. Clinical cancer research : an official journal of the American Association for Cancer Research. 2008;14:5158–65. doi: 10.1158/1078-0432.CCR-07-4756. [DOI] [PubMed] [Google Scholar]
- 11.Ignatiadis M, Singhal SK, Desmedt C, Haibe-Kains B, Criscitiello C, Andre F, et al. Gene modules and response to neoadjuvant chemotherapy in breast cancer subtypes: a pooled analysis. Journal of clinical oncology : official journal of the American Society of Clinical Oncology. 2012;30:1996–2004. doi: 10.1200/JCO.2011.39.5624. [DOI] [PubMed] [Google Scholar]
- 12.Sparano JA, Gray RJ, Makower DF, Pritchard KI, Albain KS, Hayes DF, et al. Prospective Validation of a 21-Gene Expression Assay in Breast Cancer. The New England journal of medicine. 2015;373:2005–14. doi: 10.1056/NEJMoa1510764. [DOI] [PMC free article] [PubMed] [Google Scholar]
- 13.Piccart M, Rutgers EJ, van 't Veer LJ, Slaets L, Delaloge S, Viale G, et al. Proceedings of the 107th Annual Meeting of the American Association for Cancer Research. Philadelphia (PA): AACR; 2016. Primary analysis of the EORTC 10041/ BIG 3-04 MINDACT study: a prospective, randomized study evaluating the clinical utility of the 70-gene signature (MammaPrint) combined with common clinical-pathological criteria for selection of patients for adjuvant chemotherapy in breast cancer with 0 to 3 positive nodes [abstract] New Orleans LA. Abstract nr CT039; 2016. [Google Scholar]
- 14.Gatza ML, Lucas JE, Barry WT, Kim JW, Wang Q, Crawford MD, et al. A pathway-based classification of human breast cancer. Proceedings of the National Academy of Sciences of the United States of America. 2010;107:6994–9. doi: 10.1073/pnas.0912708107. [DOI] [PMC free article] [PubMed] [Google Scholar]
- 15.Gatza ML, Silva GO, Parker JS, Fan C, Perou CM. An integrated genomics approach identifies drivers of proliferation in luminal-subtype human breast cancer. Nature genetics. 2014;46:1051–9. doi: 10.1038/ng.3073. [DOI] [PMC free article] [PubMed] [Google Scholar]
- 16.Wolf DM, Lenburg ME, Yau C, Boudreau A, van 't Veer LJ. Gene co-expression modules as clinically relevant hallmarks of breast cancer diversity. PloS one. 2014;9:e88309. doi: 10.1371/journal.pone.0088309. [DOI] [PMC free article] [PubMed] [Google Scholar]
- 17.NCBI Gene Expression Omnibus (GEO) Available from: http://www.ncbi.nlm.nih.gov/geo/
- 18.ArrayExpress. Available from: http://www.ebi.ac.uk/arrayexpress/
- 19.Irizarry RA, Hobbs B, Collin F, Beazer-Barclay YD, Antonellis KJ, Scherf U, et al. Exploration, normalization, and summaries of high density oligonucleotide array probe level data. Biostatistics. 2003;4:249–64. doi: 10.1093/biostatistics/4.2.249. [DOI] [PubMed] [Google Scholar]
- 20.Sims AH, Smethurst GJ, Hey Y, Okoniewski MJ, Pepper SD, Howell A, et al. The removal of multiplicative, systematic bias allows integration of breast cancer gene expression datasets - improving meta-analysis and prediction of prognosis. BMC medical genomics. 2008;1:42. doi: 10.1186/1755-8794-1-42. [DOI] [PMC free article] [PubMed] [Google Scholar]
- 21.UNC Microarray Database. Available from: https://genome.unc.edu/pubsup/breastGEO/
- 22.Haibe-Kains B, Desmedt C, Loi S, Culhane AC, Bontempi G, Quackenbush J, et al. A three-gene model to robustly identify breast cancer molecular subtypes. Journal of the National Cancer Institute. 2012;104:311–25. doi: 10.1093/jnci/djr545. [DOI] [PMC free article] [PubMed] [Google Scholar]
- 23.TNBCtype: A Subtyping Tool for Triple-Negative Breast Cancer. doi: 10.4137/CIN.S9983. Available from: http://cbc.mc.vanderbilt.edu/tnbc/ [DOI] [PMC free article] [PubMed]
- 24.Lehmann BD, Bauer JA, Chen X, Sanders ME, Chakravarthy AB, Shyr Y, et al. Identification of human triple-negative breast cancer subtypes and preclinical models for selection of targeted therapies. The Journal of clinical investigation. 2011;121:2750–67. doi: 10.1172/JCI45014. [DOI] [PMC free article] [PubMed] [Google Scholar]
- 25.Chen X, Li J, Gray WH, Lehmann BD, Bauer JA, Shyr Y, et al. TNBCtype: A Subtyping Tool for Triple-Negative Breast Cancer. Cancer informatics. 2012;11:147–56. doi: 10.4137/CIN.S9983. [DOI] [PMC free article] [PubMed] [Google Scholar]
- 26.Yoshihara K, Shahmoradgoli M, Martinez E, Vegesna R, Kim H, Torres-Garcia W, et al. Inferring tumour purity and stromal and immune cell admixture from expression data. Nature communications. 2013;4:2612. doi: 10.1038/ncomms3612. [DOI] [PMC free article] [PubMed] [Google Scholar]
- 27.Subramanian A, Tamayo P, Mootha VK, Mukherjee S, Ebert BL, Gillette MA, et al. Gene set enrichment analysis: a knowledge-based approach for interpreting genome-wide expression profiles. Proceedings of the National Academy of Sciences of the United States of America. 2005;102:15545–50. doi: 10.1073/pnas.0506580102. [DOI] [PMC free article] [PubMed] [Google Scholar]
- 28.Culhane AC, Schroder MS, Sultana R, Picard SC, Martinelli EN, Kelly C, et al. GeneSigDB: a manually curated database and resource for analysis of gene expression signatures. Nucleic acids research. 2012;40:D1060–6. doi: 10.1093/nar/gkr901. [DOI] [PMC free article] [PubMed] [Google Scholar]
- 29.Schmelzle T, Mailleux AA, Overholtzer M, Carroll JS, Solimini NL, Lightcap ES, et al. Functional role and oncogene-regulated expression of the BH3-only factor Bmf in mammary epithelial anoikis and morphogenesis. Proceedings of the National Academy of Sciences of the United States of America. 2007;104:3787–92. doi: 10.1073/pnas.0700115104. [DOI] [PMC free article] [PubMed] [Google Scholar]
- 30.Worster DT, Schmelzle T, Solimini NL, Lightcap ES, Millard B, Mills GB, et al. Akt and ERK control the proliferative response of mammary epithelial cells to the growth factors IGF-1 and EGF through the cell cycle inhibitor p57Kip2. Science signaling. 2012;5:ra19. doi: 10.1126/scisignal.2001986. [DOI] [PMC free article] [PubMed] [Google Scholar]
- 31.Venet D, Dumont JE, Detours V. Most random gene expression signatures are significantly associated with breast cancer outcome. PLoS computational biology. 2011;7:e1002240. doi: 10.1371/journal.pcbi.1002240. [DOI] [PMC free article] [PubMed] [Google Scholar]
- 32.Nielsen TO, Parker JS, Leung S, Voduc D, Ebbert M, Vickery T, et al. A comparison of PAM50 intrinsic subtyping with immunohistochemistry and clinical prognostic factors in tamoxifen-treated estrogen receptor-positive breast cancer. Clinical cancer research : an official journal of the American Association for Cancer Research. 2010;16:5222–32. doi: 10.1158/1078-0432.CCR-10-1282. [DOI] [PMC free article] [PubMed] [Google Scholar]
- 33.Hulsen T, de Vlieg J, Alkema W. BioVenn - a web application for the comparison and visualization of biological lists using area-proportional Venn diagrams. BMC genomics. 2008;9:488. doi: 10.1186/1471-2164-9-488. [DOI] [PMC free article] [PubMed] [Google Scholar]
- 34.Denkert C, von Minckwitz G, Brase JC, Sinn BV, Gade S, Kronenwett R, et al. Tumor-infiltrating lymphocytes and response to neoadjuvant chemotherapy with or without carboplatin in human epidermal growth factor receptor 2-positive and triple-negative primary breast cancers. Journal of clinical oncology : official journal of the American Society of Clinical Oncology. 2015;33:983–91. doi: 10.1200/JCO.2014.58.1967. [DOI] [PubMed] [Google Scholar]
- 35.Gordon K, Smyth JM, Hamish S, Scott Use of within-array replicate spots for assessing differential expression in microarray experiments. Bioinformatics. 2005;21:2067–75. doi: 10.1093/bioinformatics/bti270. [DOI] [PubMed] [Google Scholar]
- 36.Wirapati P, Sotiriou C, Kunkel S, Farmer P, Pradervand S, Haibe-Kains B, et al. Meta-analysis of gene expression profiles in breast cancer: toward a unified understanding of breast cancer subtyping and prognosis signatures. Breast cancer research : BCR. 2008;10:R65. doi: 10.1186/bcr2124. [DOI] [PMC free article] [PubMed] [Google Scholar]
- 37.Rody A, Holtrich U, Pusztai L, Liedtke C, Gaetje R, Ruckhaeberle E, et al. T-cell metagene predicts a favorable prognosis in estrogen receptor-negative and HER2-positive breast cancers. Breast cancer research : BCR. 2009;11:R15. doi: 10.1186/bcr2234. [DOI] [PMC free article] [PubMed] [Google Scholar]
- 38.Hatzis C, Pusztai L, Valero V, Booser DJ, Esserman L, Lluch A, et al. A genomic predictor of response and survival following taxane-anthracycline chemotherapy for invasive breast cancer. Jama. 2011;305:1873–81. doi: 10.1001/jama.2011.593. [DOI] [PMC free article] [PubMed] [Google Scholar]
- 39.Saal LH, Johansson P, Holm K, Gruvberger-Saal SK, She QB, Maurer M, et al. Poor prognosis in carcinoma is associated with a gene expression signature of aberrant PTEN tumor suppressor pathway activity. Proceedings of the National Academy of Sciences of the United States of America. 2007;104:7564–9. doi: 10.1073/pnas.0702507104. [DOI] [PMC free article] [PubMed] [Google Scholar]
- 40.Lim E, Vaillant F, Wu D, Forrest NC, Pal B, Hart AH, et al. Aberrant luminal progenitors as the candidate target population for basal tumor development in BRCA1 mutation carriers. Nature medicine. 2009;15:907–13. doi: 10.1038/nm.2000. [DOI] [PubMed] [Google Scholar]
- 41.Teschendorff AE, Miremadi A, Pinder SE, Ellis IO, Caldas C. An immune response gene expression module identifies a good prognosis subtype in estrogen receptor negative breast cancer. Genome biology. 2007;8:R157. doi: 10.1186/gb-2007-8-8-r157. [DOI] [PMC free article] [PubMed] [Google Scholar]
- 42.Philips FS, Schwartz HS, Sternberg SS. Pharmacology of mitomycin C. I. Toxicity and pathologic effects. Cancer research. 1960;20:1354–61. [PubMed] [Google Scholar]
- 43.Smith WW, Wilson SM, Fred SS. Kinetics of stem cell depletion and proliferation: effects of vinblastine and vincristine in normal and irradiated mice. Journal of the National Cancer Institute. 1968;40:847–54. [PubMed] [Google Scholar]
- 44.Prat A, Lluch A, Albanell J, Barry WT, Fan C, Chacon JI, et al. Predicting response and survival in chemotherapy-treated triple-negative breast cancer. British journal of cancer. 2014;111:1532–41. doi: 10.1038/bjc.2014.444. [DOI] [PMC free article] [PubMed] [Google Scholar]
- 45.Prat A, Galvan P, Jimenez B, Buckingham W, Jeiranian HA, Schaper C, et al. Prediction of Response to Neoadjuvant Chemotherapy Using Core Needle Biopsy Samples with the Prosigna Assay. Clinical cancer research : an official journal of the American Association for Cancer Research. 2015 doi: 10.1158/1078-0432.CCR-15-0630. [DOI] [PubMed] [Google Scholar]
- 46.Liu MC, Pitcher BN, Mardis E, Davies S, Friedman PN, Snider JE, et al. PAM50 gene signatures and breast cancer prognosis with adjuvant anthracycline- and taxane-based chemotherapy: correlative analysis of C9741 (Alliance) Breast Cancer. 2016;2 doi: 10.1038/npjbcancer.2015.23. [DOI] [PMC free article] [PubMed] [Google Scholar]
- 47.Paik S, Shak S, Tang G, Kim C, Baker J, Cronin M, et al. A multigene assay to predict recurrence of tamoxifen-treated, node-negative breast cancer. The New England journal of medicine. 2004;351:2817–26. doi: 10.1056/NEJMoa041588. [DOI] [PubMed] [Google Scholar]
- 48.van't Veer LJ, Bernards R. Enabling personalized cancer medicine through analysis of gene-expression patterns. Nature. 2008;452:564–70. doi: 10.1038/nature06915. [DOI] [PubMed] [Google Scholar]
- 49.Loi S, Sirtaine N, Piette F, Salgado R, Viale G, Van Eenoo F, et al. Prognostic and predictive value of tumor-infiltrating lymphocytes in a phase III randomized adjuvant breast cancer trial in node-positive breast cancer comparing the addition of docetaxel to doxorubicin with doxorubicin-based chemotherapy: BIG 02-98. Journal of clinical oncology : official journal of the American Society of Clinical Oncology. 2013;31:860–7. doi: 10.1200/JCO.2011.41.0902. [DOI] [PubMed] [Google Scholar]
- 50.Denkert C, Loibl S, Noske A, Roller M, Muller BM, Komor M, et al. Tumor-associated lymphocytes as an independent predictor of response to neoadjuvant chemotherapy in breast cancer. Journal of clinical oncology : official journal of the American Society of Clinical Oncology. 2010;28:105–13. doi: 10.1200/JCO.2009.23.7370. [DOI] [PubMed] [Google Scholar]
- 51.Martin M, Prat A, Rodriguez-Lescure A, Caballero R, Ebbert MT, Munarriz B, et al. PAM50 proliferation score as a predictor of weekly paclitaxel benefit in breast cancer. Breast cancer research and treatment. 2013;138:457–66. doi: 10.1007/s10549-013-2416-2. [DOI] [PMC free article] [PubMed] [Google Scholar]
- 52.Andre F, Arnedos M, Goubar A, Ghouadni A, Delaloge S. Ki67--no evidence for its use in node-positive breast cancer. Nature reviews Clinical oncology. 2015;12:296–301. doi: 10.1038/nrclinonc.2015.46. [DOI] [PubMed] [Google Scholar]
- 53.Andre F, Khalil A, Slimane K, Massard C, Mathieu MC, Vignot S, et al. Mitotic index and benefit of adjuvant anthracycline-based chemotherapy in patients with early breast cancer. Journal of clinical oncology : official journal of the American Society of Clinical Oncology. 2005;23:2996–3000. doi: 10.1200/JCO.2005.08.046. [DOI] [PubMed] [Google Scholar]
- 54.Chakravarthy AB, Kelley MC, McLaren B, Truica CI, Billheimer D, Mayer IA, et al. Neoadjuvant concurrent paclitaxel and radiation in stage II/III breast cancer. Clinical cancer research : an official journal of the American Association for Cancer Research. 2006;12:1570–6. doi: 10.1158/1078-0432.CCR-05-2304. [DOI] [PubMed] [Google Scholar]
- 55.Burcombe R, Wilson GD, Dowsett M, Khan I, Richman PI, Daley F, et al. Evaluation of Ki-67 proliferation and apoptotic index before, during and after neoadjuvant chemotherapy for primary breast cancer. Breast cancer research : BCR. 2006;8:R31. doi: 10.1186/bcr1508. [DOI] [PMC free article] [PubMed] [Google Scholar]
- 56.Balko JM, Giltnane JM, Wang K, Schwarz LJ, Young CD, Cook RS, et al. Molecular profiling of the residual disease of triple-negative breast cancers after neoadjuvant chemotherapy identifies actionable therapeutic targets. Cancer discovery. 2014;4:232–45. doi: 10.1158/2159-8290.CD-13-0286. [DOI] [PMC free article] [PubMed] [Google Scholar]
- 57.Cancer Genome Atlas N. Comprehensive molecular portraits of human breast tumours. Nature. 2012;490:61–70. doi: 10.1038/nature11412. [DOI] [PMC free article] [PubMed] [Google Scholar]
- 58.Shah SP, Roth A, Goya R, Oloumi A, Ha G, Zhao Y, et al. The clonal and mutational evolution spectrum of primary triple-negative breast cancers. Nature. 2012;486:395–9. doi: 10.1038/nature10933. [DOI] [PMC free article] [PubMed] [Google Scholar]
- 59.Ogston KN, Miller ID, Payne S, Hutcheon AW, Sarkar TK, Smith I, et al. A new histological grading system to assess response of breast cancers to primary chemotherapy: prognostic significance and survival. Breast. 2003;12:320–7. doi: 10.1016/s0960-9776(03)00106-1. [DOI] [PubMed] [Google Scholar]
- 60.Symmans WF, Peintinger F, Hatzis C, Rajan R, Kuerer H, Valero V, et al. Measurement of residual breast cancer burden to predict survival after neoadjuvant chemotherapy. Journal of clinical oncology : official journal of the American Society of Clinical Oncology. 2007;25:4414–22. doi: 10.1200/JCO.2007.10.6823. [DOI] [PubMed] [Google Scholar]
Associated Data
This section collects any data citations, data availability statements, or supplementary materials included in this article.