Summary
P2X receptors are trimeric, non-selective cation channels activated by ATP that play important roles in cardiovascular, neuronal and immune systems. Despite their central function in human physiology and as potential targets of therapeutic agents, there are no structures of human P2X receptors. Mechanisms of receptor desensitization and ion permeation, principles of antagonism, and complete structure of the pore-forming transmembrane domains remain unclear. We report x-ray crystal structures of human P2X3 receptor in apo/resting, agonist-bound/open-pore, agonist-bound/desensitized and antagonist-bound closed states. The open state structure harbors an intracellular motif we term the “cytoplasmic cap”, that stabilizes the open state of the ion channel pore and creates lateral, phospholipid-lined cytoplasmic fenestrations for water and ion egress. Competitive antagonists TNP-ATP and A-317491 stabilize the apo/resting state and reveal the interactions responsible for competitive inhibition. These structures illuminate the conformational rearrangements underpinning P2X receptor gating and provide a foundation for development of new pharmacologic agents.
Introduction
Integral membrane proteins that recognize extracellular nucleotides were defined in 1976 and termed purinergic receptors1–3. Two families of purinergic receptors have since been established: ligand-gated P2X receptor ion channels4 and G-protein coupled P2Y receptors5. Found throughout eukaryotes6, in humans P2X receptors are expressed in a wide variety of cells and modulate processes as diverse as platelet activation, smooth muscle contraction, synaptic transmission, nociception, inflammation, hearing and taste7,8, making P2X receptors important pharmacological targets9.
Seven mammalian P2X receptor subtypes, denoted P2X1-P2X7, form homo and heterotrimeric complexes4,10,11. All subtypes share a common topology containing intracellular termini, two trans-membrane helices forming the ion channel, and a large extracellular domain containing the orthosteric ATP binding site11,12. Whereas all P2X receptors are non-selective cation channels permeable to Na+ and Ca2+ and activated by ATP13, the pharmacology of receptor subtypes varies with respect to sensitivity to ATP analog agonists and to small molecule antagonists. Thus, while 2’-3’-O-(2,4,6,-trinitrophenyl) adenosine 5’-triphosphate (TNP-ATP) is the prototypical nanomolar-affinity antagonist at P2X1,3 receptors, it binds 1000-fold less tightly to P2X4 receptors9,14. The kinetics of ion channel gating also vary by subtype, with P2X2,4,5,7 receptors showing slow and incomplete desensitization and P2X1,3 undergoing rapid and nearly complete desensitization15,16.
Membrane proximal regions within the cytoplasmic termini play important roles in receptor desensitization17–25, but a detailed molecular mechanism of desensitization is unknown. Proposed mechanisms are similar to the “hinged lid” or “ball and chain” models described for voltage-gated sodium and shaker potassium channels, respectively, with a distinct but unidentified desensitization gate21,26. To date, there are no structures of a P2X receptor in the desensitized state and currently available structures of the zebra fish P2X4 receptor (zfP2X4) in apo and open state conformations do not visualize cytoplasmic residues27–29. There is also concern that the available structure of zfP2X4 bound to ATP27 may not represent a physiologic state because the truncated crystallization construct, lacking both terminal domains, might distort pore architecture12,30–32. A recent NMR study suggests that TNP-ATP inhibits activation by closing the extracellular fenestrations to ion access, rather than by stabilizing a closed-pore conformation33. To understand the molecular mechanisms underlying activation and antagonism of P2X receptors, we crystallized the human P2X3 (hP2X3) receptor in an apo/resting state, an agonist-bound/open-pore state, an agonist-bound/closed-pore/ desensitized state, and two competitive antagonist-bound states.
Crystallization and Structure Determination
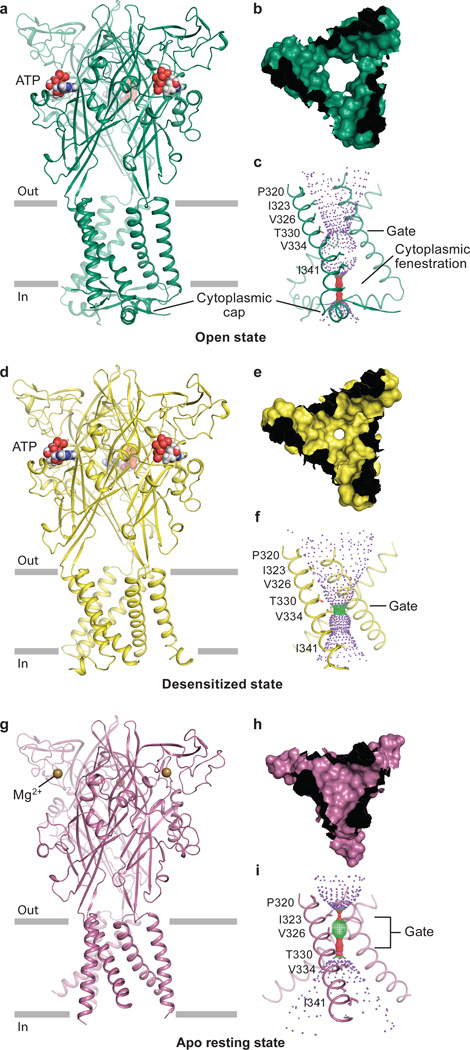
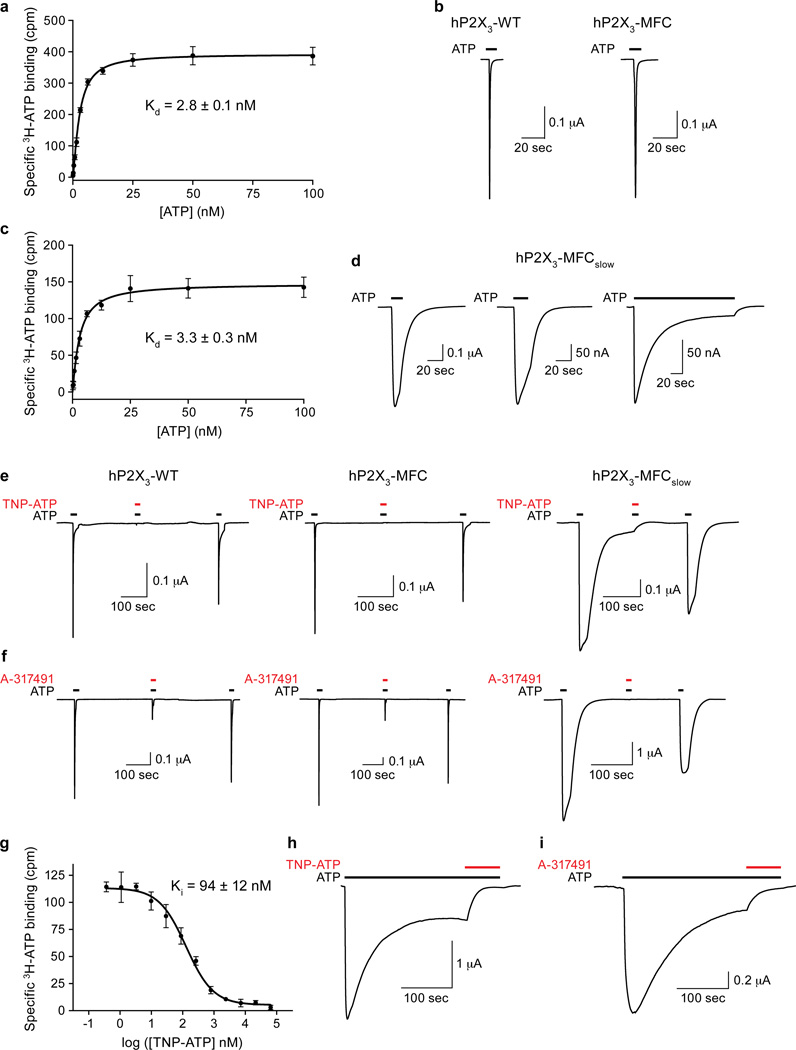
The hP2X3 crystallization construct spans residues D6 to T364 and is defined as hP2X3-MFC. It binds ATP with a Kd of 2.8 nM and has wild-type gating properties, assessed by scintillation proximity assays (SPA)34 and two-electrode voltage clamp (TEVC; Extended Data Fig. 1a–b), respectively. Notably, hP2X3-MFC demonstrates fast desensitization kinetics, the hallmark of homotrimeric P2X3 receptors35,36. Three rat P2X2-specific amino acid substitutions21 were made at homologous residues in the N-terminus of hP2X3 to generate hP2X3-MFC-T13P/S15V/V16I (or hP2X3-MFCslow), a construct with high affinity for ATP (Extended Data Fig. 1c) and with slow and incomplete desensitization (Extended Data Fig. 1d). The structure of the ATP-bound/open-pore state (Fig. 1a–c) was obtained using hP2X3-MFCslow while hP2X3-MFC was used to determine the structure of the ATP-bound/closed-pore, desensitized state (Fig. 1d–f).
Figure 1. Architecture and pore structure for major conformational states of the gating cycle of hP2X3.
Cartoon representation of each hP2X3 structure shown parallel to the membrane as a side view, perpendicular to the membrane from the extracellular side as a surface representation, and the ion permeation pathway, respectively, are drawn for open state (a-c), desensitized state (d-f), and apo state (g-i). Each conformational state is color-coded unless otherwise noted: open state in green, desensitized state in yellow, and apo state in red-purple. For the pore size plots, different colors represent different radii, as calculated by the program HOLE: red < 1.15 Å, green between 1.15 – 2.30 Å, and purple > 2.30 Å.
We further crystallized hP2X3-MFCslow in an apo/resting state (Fig. 1g–i) and in complex with two high-affinity P2X3 competitive antagonists, TNP-ATP14,37 and A-31749138. Both antagonists inhibit ATP-induced currents from hP2X3-MFC and hP2X3-MFCslow expressed in oocytes, and TNP-ATP displaces radioactive ATP from detergent solubilized hP2X3-MFCslow (Extended Data Fig. 1e–g). Prolonged application of ATP to oocytes expressing hP2X3-MFCslow results in a residual current that is blocked by the competitive antagonists, suggesting that a fraction of these receptors do not desensitize (Extended Data Fig. 1h–i). The hP2X3 structures were refined to good crystallographic statistics and stereochemistry (Extended Data Table 1).
Overall Architecture
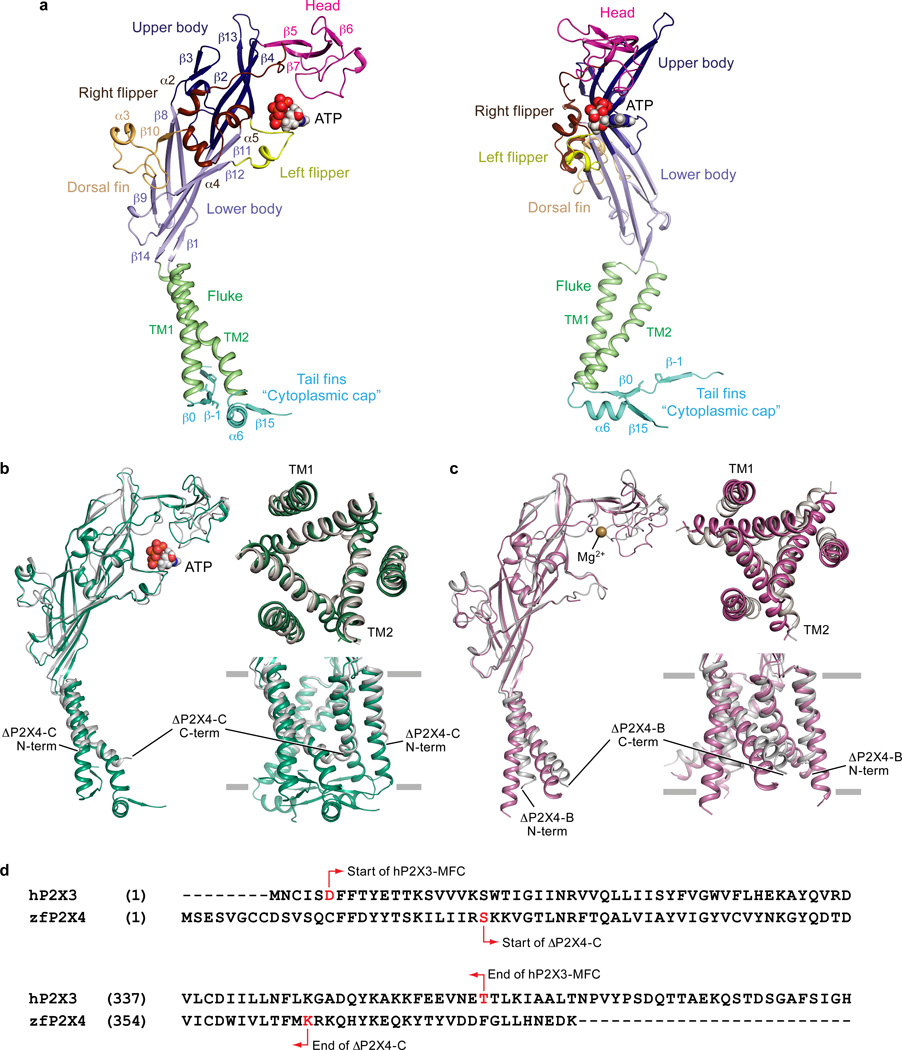
The hP2X3 structures hew to the iconic trimeric P2X receptor architecture27–29, possessing a large hydrophilic extracellular domain, six α-helices forming the transmembrane (TM) domain, and intracellular termini (Fig. 1). Each protomer resembles the shape of a dolphin27,29 (Extended Data Fig. 2a). The open state structure of hP2X3 contains ATP in the ligand-binding pocket and an open pore (Fig. 1a–c) while the desensitized state structure has ATP in the pocket but a closed pore (Fig. 1d–f). Although the extracellular domain and binding pocket of the desensitized and open states of hP2X3 are similar, there are striking differences in the TM domain and at the gate (Extended Data Fig. 3). Both hP2X3 structures have TM domains that are of sufficient length to cross a lipid bilayer, and the desensitized state structure has a pore architecture not previously observed for any P2X structure. The open state structure of hP2X3 visualizes cytoplasmic residues not present in the open state structure of zfP2X427 (Extended Data Fig. 2b) and forms a domain termed the ‘cytoplasmic cap’ (Fig. 1a,c).
The apo structure of hP2X3 has an empty ligand-binding pocket and a closed pore (Fig. 1g–i). An alignment to the apo structure of zfP2X429 reveals several unique features of the hP2X3 apo structure, including a more complete TM domain, different residues defining the pore constriction, and a Mg2+ ion bound in the head domain (Extended Data Fig. 2c). Comparison between the hP2X3 structures and previously published zfP2X4 structures emphasizes the longer TMs and the cytoplasmic domain of hP2X3 (Extended Data Fig. 2b,c,d). Competitive antagonists TNP-ATP and A-317491 occupy the orthosteric ligand-binding pocket and the ion channel pore is closed (Extended Data Fig. 4).
Ion Channel Pore
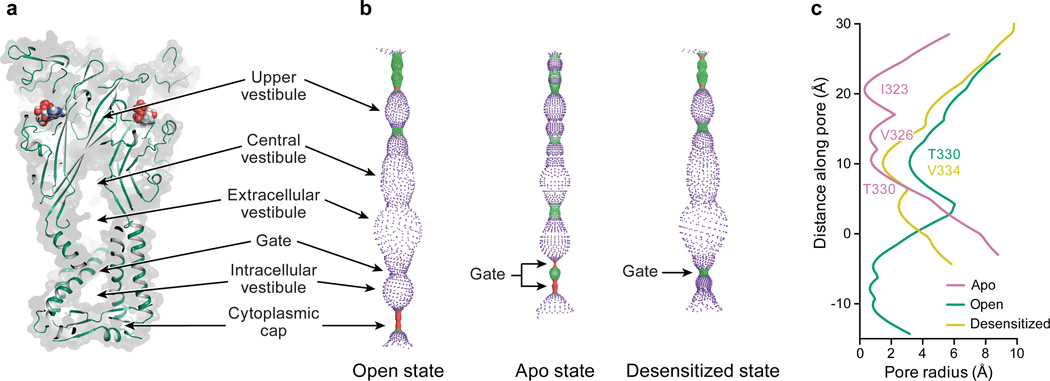
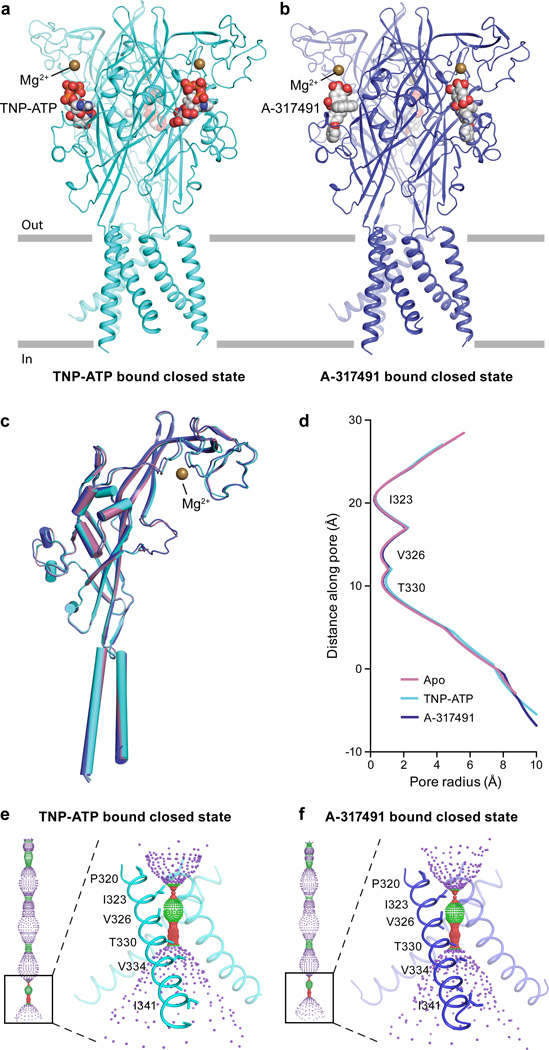
To determine the functional state of each hP2X3 structure, we analyzed the conformation of the ion channel pore, together with alterations in the size and shape of cavities, vestibules and fenestrations throughout the receptor (Extended Data Fig. 3a,b). TM helix 2 (TM2) lines the pore lumen, with residues I323, V326, T330, and V334 facing the pore (Fig. 1c,f,i)27,29,39. I323 defines the extracellular boundary of the gate in the apo state (gate #1, pore radius = 0.29 Å), while T330 defines the cytoplasmic boundary (gate #2, pore radius = 0.71 Å) (Extended Data Fig. 3c). A third residue, V326, also contributes to the pore occlusion. These openings are too narrow to pass dehydrated Na+ ions40 and define the ion channel as closed (Fig. 1h,i). The solvent accessible surface, dimensions, and residues lining the gate for both antagonist-bound structures are similar to the apo state structure, demonstrating that these competitive antagonists stabilize an apo/resting-like state of the receptor (Extended Data Fig. 4c–f).
The open state structure of hP2X3 has a continuous pore through the TM domain with a minimum radius of 3.2 Å (Extended Data Fig. 3c), large enough to pass partially hydrated Na+ ions41, defining the ion channel gate as open (Fig. 1b,c). Compared to the apo structure, I323 and V326 have been translated upward toward the extracellular surface and rotated outward, away from the pore’s center to open the pore. T330, which defined the cytoplasmic boundary of the closed gate in the apo state, now defines the narrowest region of the pore in the open state. In hP2X3, T330 and S331 are the only hydrophilic residues lining the middle of the pore. For rat P2X2 receptor, a threonine residue at the equivalent position to T330 of hP2X3 has been implicated in ion selectivity42, suggesting T330 might interact with permeating cations.
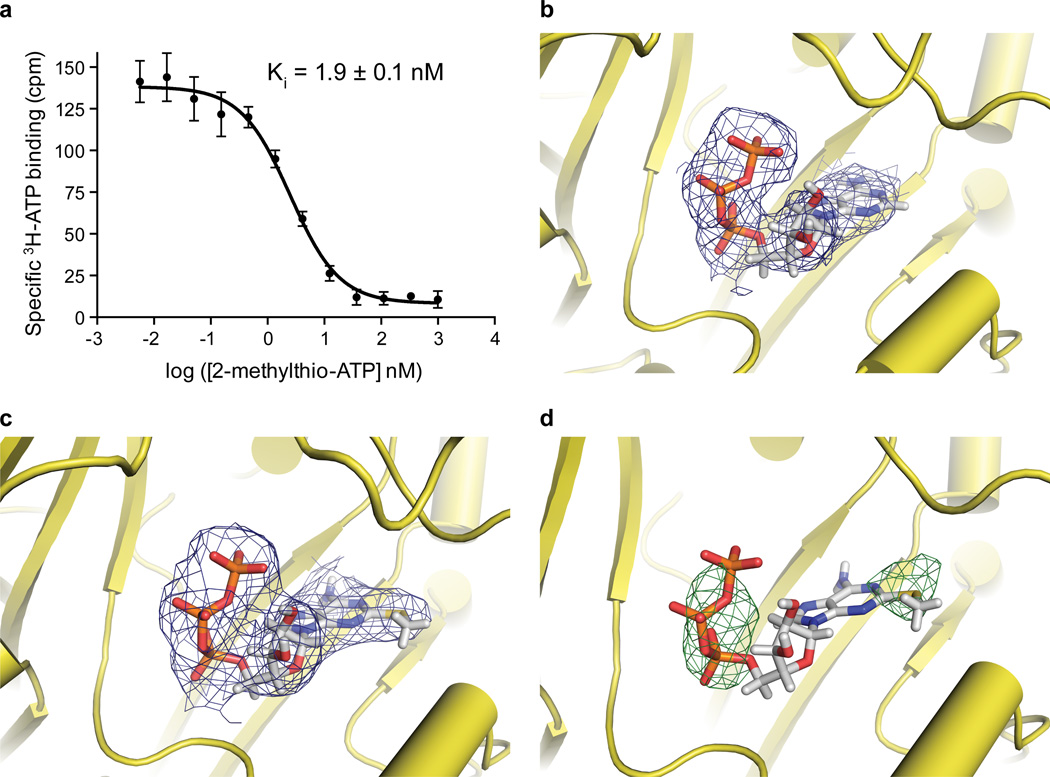
A single residue, V334, defines the constriction site of the desensitized state with a pore radius of 1.5 Å, too narrow to pass hydrated Na+ ions (Fig. 1e,f and Extended Data Fig. 3c). From the open to the desensitized states, V334 translates ‘upward’ toward the extracellular surface and rotates inward to block the pore. To test if this structure was truly an agonist-bound, closed state, we soaked the crystals with the P2X3 agonist 2-(methylthio)adenosine 5′-triphosphate (2-methylthio-ATP) and collected diffraction data (Extended Data Table 1 and 2). These soaked crystals retained the same receptor and pore structure but had an anomalous sulfur signal in the binding pocket consistent with 2-methylthio-ATP, providing evidence that the structure represents an agonist-bound, closed pore desensitized state (Extended Data Fig. 5).
Channel Opening
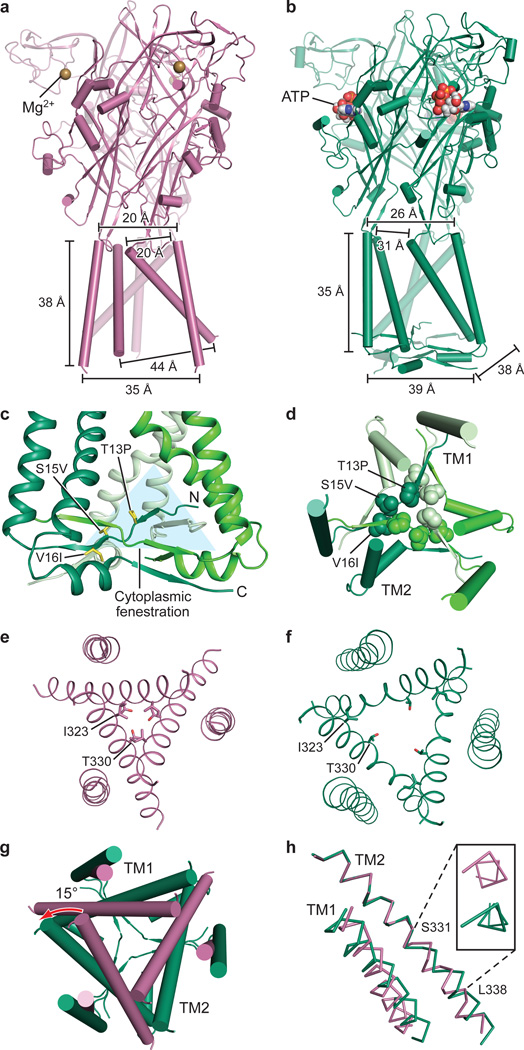
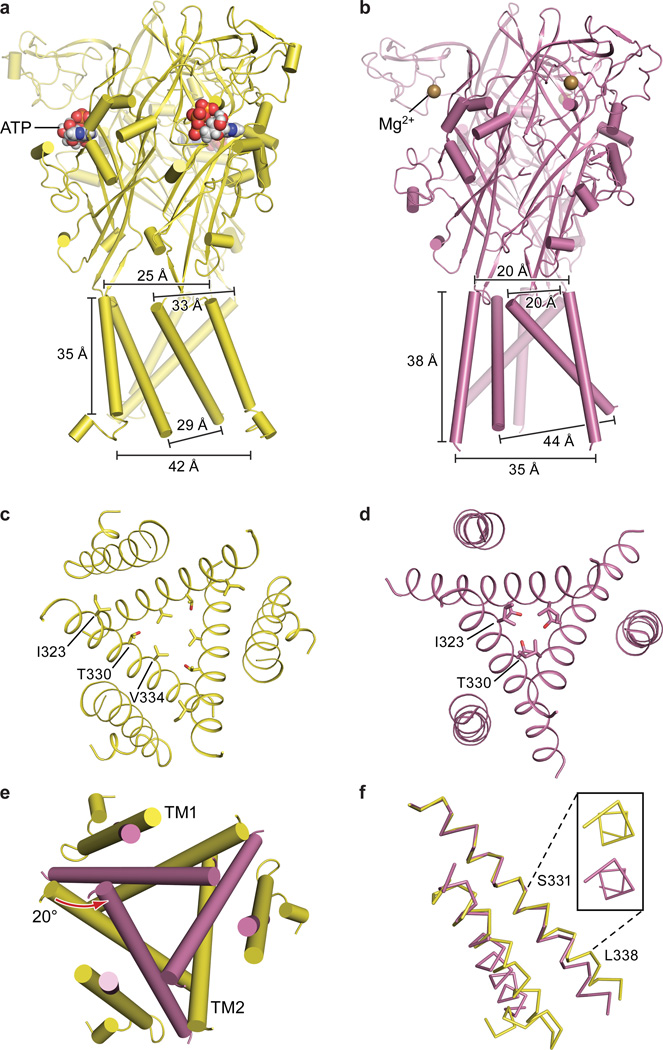
Comparing apo and open state structures of hP2X3 demonstrates the extensive structural differences between these two conformational states, emphasizing the role of the “cytoplasmic cap” in stabilizing the open state (Fig. 2a,b). Comprising the cytoplasmic cap are elements of secondary structure from both termini including two sequential β-strands from the N-terminus and a β-strand from the C-terminus (Fig. 2c, Extended Data Fig. 2a). The tertiary structure of the cytoplasmic cap is defined by a network of three β-sheets that sit “beneath” the TM domain, “capping” the cytoplasmic surface of the pore. The C-terminal β-strand of each protomer interacts with the N-terminal β-strands of each of the other two protomers to form a small β-sheet (Fig. 2c,d). Each of the three β-sheets incorporates one β-strand from each of the three protomers, illustrating how domain swapping knits receptor subunits together on the cytoplasmic side of the membrane. The cytoplasmic cap is only observed in the ATP-bound open state structure, indicating that the cap-forming elements are flexible and disordered in the apo state. Indeed, the three mutations that slow desensitization and were used to capture the open state of hP2X3 provide main chain conformational rigidity and make key hydrophobic interactions stabilizing the structure of the cap (Fig. 2c,d). Because these three substitutions are derived from the equivalent wild-type residues in the slowly desensitizing P2X2 receptor, we suggest that the transient formation and stability of the cytoplasmic cap plays a central role in P2X receptor gating and provides a structural scaffold for the open state that is likely disassembled in the apo and desensitized states.
Figure 2. Apo to open state transition.
a,b, Apo state (a) and open state (b) shown parallel to the membrane. The open state structure of hP2X3 visualizes a novel cytoplasmic motif, termed the “cytoplasmic cap”. c, The cytoplasmic cap is composed of domain-swapped β strands from each protomer above which are triangular-shaped “cytoplasmic fenestrations”. Each protomer is colored in a different shade of green. The T13P/S15V/V16I mutations are shown in one protomer as yellow sticks. d, Top down view from the cytoplasmic surface shows the residues in the T13P/S15V/V16I motif form a hydrophobic core. e,f, Top-down view of the pore comparing the apo state (e) to the open state (f). g, Relative conformational changes in the pore, shown from the extracellular surface, between the apo (red-purple) and open (green) states after aligning the upper body domain of the trimer demonstrates pore opening. h, Alignment of TM2 in apo vs. open states reveals a change in helical pitch to a 310-helix in the open state. The inset shows the view along the axis of the TM2 helix, observed from the cytoplasmic surface.
ATP binding induces cleft closure between the head and dorsal fin domains while pushing the left flipper domain “outward”27,43. These structural rearrangements are transmitted to the lower body, resulting in an outward “flexing” movement of the β1, β9, β11 and β14 strands. Because the β1 and β14 strands are directly coupled to the TM1 and TM2 helices, respectively (Extended Data Fig. 2a and Fig. 2a,b), their outward flexing “pulls” on the extracellular portion of the TM domains, causing the helices to expand outward, opening the pore27,44.
Views from the extracellular side of the membrane, comparing the pore for apo and open states, show the molecular basis for channel opening (Fig. 2e,f,g). When the lower body “flexes” and pulls on TM2, the helix rotates counterclockwise by ~15°. This outward rotation of TM2 promotes the translation of I323, the residue defining the extracellular gate of the apo state, “upward” by ~6.3 Å toward the extracellular surface and reorients it away from the pore center. The residue defining the cytoplasmic gate of the apo state, T330, also moves “upward” by 5.3 Å and rotates away from the pore center (Fig. 2e,f,g).
In zfP2X4, the movement of TM2 to open the channel was described as a purely rigid-body transformation27. For hP2X3, however, in addition to a rigid-body translation, there is a transition in TM2 from α-helix to a 310-helix centered within the sequence G333-V334-G335 (Fig. 2h). The change in helical pitch allows for movements of TM2 associated with channel opening and desensitization. We suggest that formation of the cytoplasmic cap fixes the cytoplasmic portion of TM2 in place, forcing the helix to ‘stretch’ to a 310 conformation, thus facilitating pore opening.
Channel Desensitization
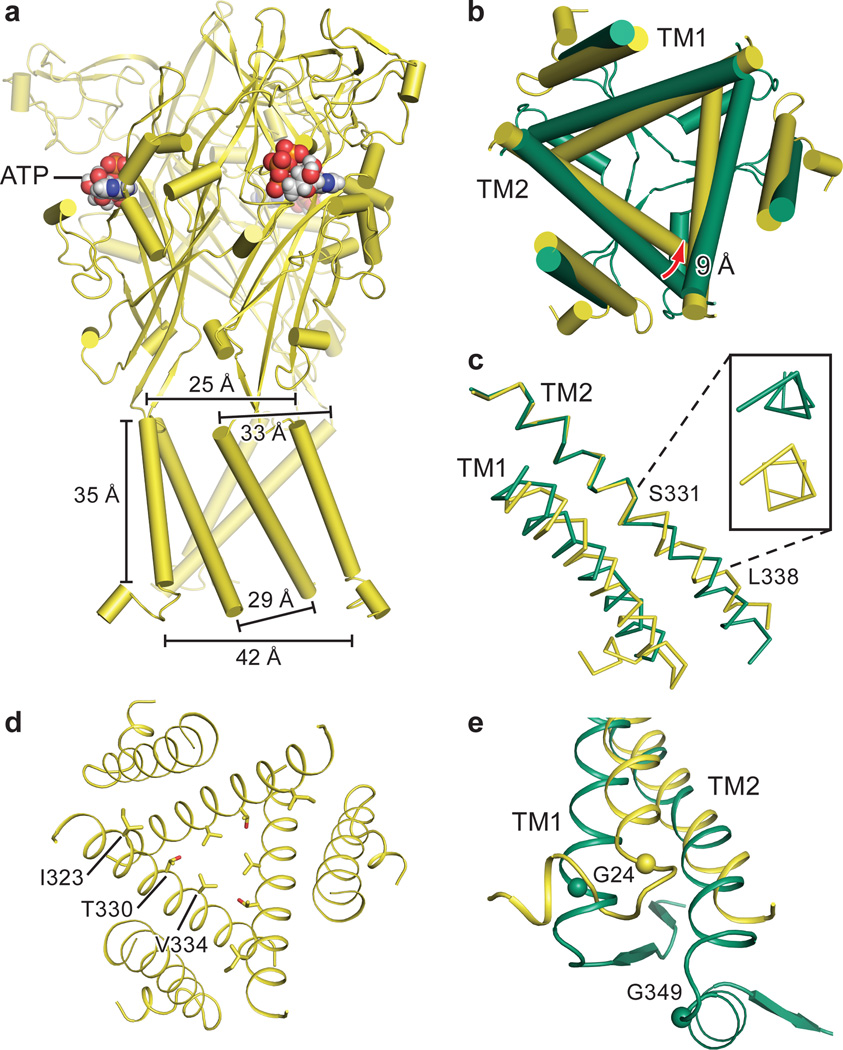
The TM domains and pore architecture between the desensitized and open states are different at the cytoplasmic surface (Fig. 2b and Fig. 3a). During the transition to the desensitized state, the cytoplasmic portion of TM2 rotates ~9° and the short 310-helix formed in the open state reverts to an α-helix (Fig. 3b,c), resulting in the upward translation toward the extracellular surface (4.4 Å) and inward rotation of V334. This movement in all three protomers closes the pore with V334 redefining a constriction site deeper in the membrane bilayer than the constriction site for the apo state (Fig. 3c,d and Extended Data Fig. 3c).
Figure 3. Open to desensitized state transition.
a, Structure of the desensitized state shown parallel to the membrane. b, Alignment of TM2 in open vs. desensitized states reveals the 310-helix in the open state reverts to an α-helix in the desensitized state. The inset shows the view along the axis of the TM2 helix, observed from the cytoplasmic surface. c, Top down view of the conformational changes in the pore between the open state (green) and the desensitized state (yellow) highlights that the transition to the desensitized state is accompanied by TM2 movement at the cytoplasmic side. d, Top-down view of the pore in the desensitized state. e, The Cα atoms of conserved G24 in TM1 of all P2X receptors and G349 in TM2 of hP2X3 are shown as spheres.
The transition of TM2 to an ideal helix to close the pore in the desensitized state is not the reverse of the conformational change that opened the pore. The formation of the 310-helix occurred as a result of stretching the top half of TM2 upward toward the extracellular surface while its cytoplasmic surface was essentially fixed in place, anchored by the cytoplasmic cap. However, the transition from open to desensitized state reverts TM2 to an ideal helix by ‘recoiling’ the cytoplasmic half of the helix upward. The return of the cytoplasmic half of TM2 to an α-helix resembles the recoiling of a spring after it has been stretched from above and then released from below. For this recoil movement to occur, the cytoplasmic cap must break or become destabilized to release the ‘anchor’ and initiate desensitization.
The N-terminus in the desensitized state is directed away from the pore, opposite to the direction of the backbone in the open state, suggesting the structure of cytoplasmic residues between these two conformations is different (Fig. 3e). This finding supports the model of a transient cytoplasmic cap forming in the open state but rupturing during receptor desensitization. Interestingly, P2X receptors have a conserved N-terminal glycine21 (G24 in P2X3) and many subtypes including hP2X3 have a glycine in the C-terminus (G349 in hP2X3) that could act as a hinge45,46 and provide the flexibility necessary to allow such dynamic conformational changes between functional states (Fig. 3e), as well as the conformational flexibility necessary to ‘reset’ the receptor to the apo state (Extended Data Fig. 6).
Molecular Basis for Competitive Antagonism
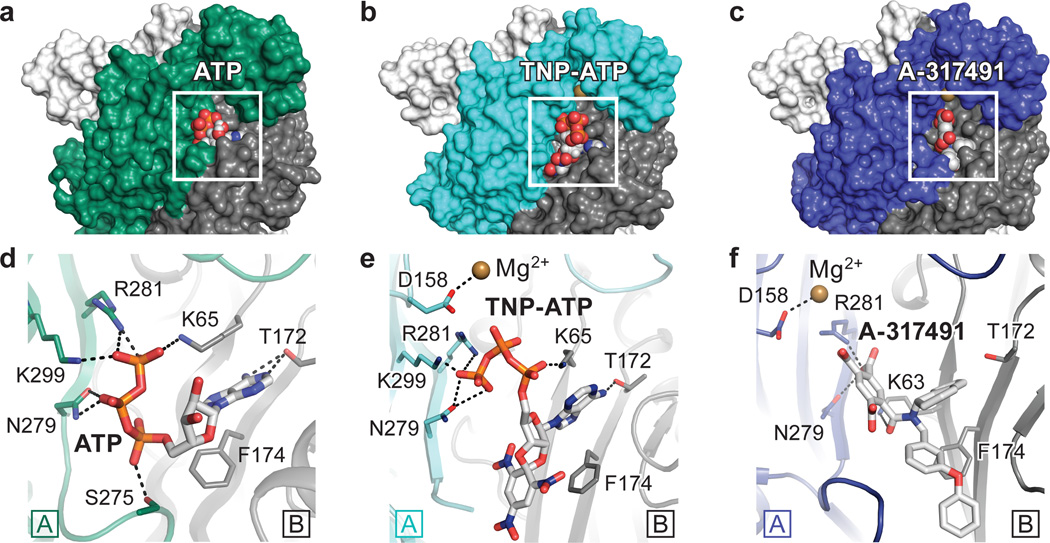
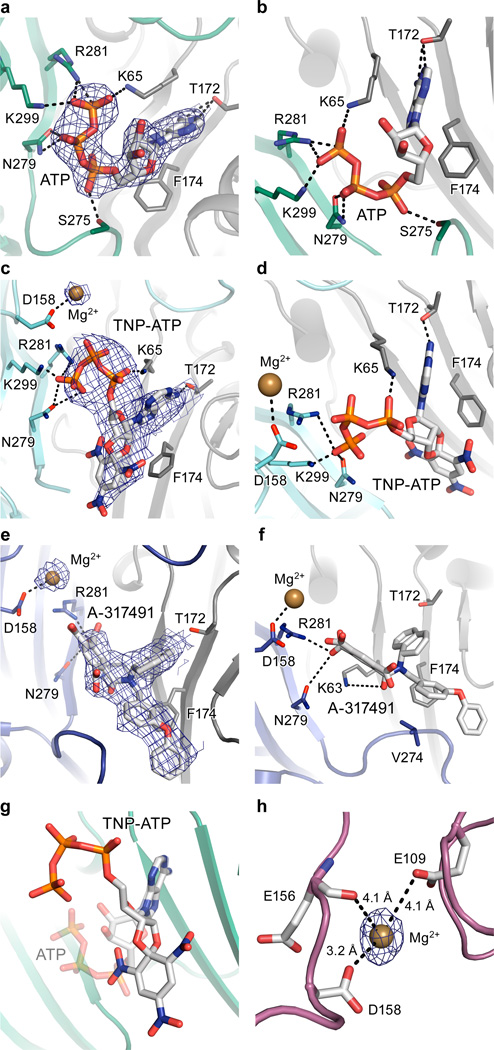
We determined the structure of hP2X3 bound to two classes of P2X receptor competitive antagonists, TNP-ATP14,37 and A-31749138. Both ATP and the antagonists occupy the orthosteric ligand-binding pocket, located at the interface between two protomers (Fig. 4 and Extended Data Fig. 7a–f). The most striking difference between ATP and the competitive antagonists is deeper penetration of the latter into the binding cleft. While ATP adopts a U-shape, both TNP-ATP and A-317491 bind in a Y-shape, with the trinitrophenyl moiety of TNP-ATP and the phenoxy-benzyl moiety of A-317491 acting as the “trunk” (Fig. 4).
Figure 4. Orthosteric ligand-binding site.
a,b,c, Surface representation of the binding pocket for the ATP-bound, open state (a), the TNP-ATP bound, closed state (b), and the A-317491 bound, closed state (c) of hP2X3. The orthosteric ligands bind in a cleft at an interface between two protomers, with protomer A shown in green for ATP-bound, open state or cyan for TNP-ATP bound, closed state, or blue for A-317491 bound, closed state. Protomer B is shown in gray and protomer C is shown in white. d,e,f, Close-up view of the binding pocket showing key interactions made by ATP (d), TNP-ATP (e), and A-317491 (f). ATP-binding residues make interactions with TNP-ATP and A-317491, notably R281, N279, and K65 and T172 (for TNP-ATP).
In the binding pocket, TNP-ATP occupies a different orientation than ATP. For ATP, the C2 and C3 carbons of the ribose group and the γ-phosphate point ‘up’, away from the cleft of the binding pocket, while for TNP-ATP, these atoms point ‘down’, facing into the cleft (Fig. 4d,e and Extended Data Fig. 7g). These differences change how a number of side chain residues interact with the phosphate moieties. For example, K65 makes an ionic interaction with the γ-phosphate of ATP but with the α-phosphate of TNP-ATP. As a result of the different ligand poses, the ribose group of TNP-ATP sits deeper into the cleft of the binding pocket made by the “left flipper” of protomer A and the “dorsal fin” of protomer B. The trunk in both TNP-ATP and A-317491 forms hydrophobic interactions with F174, but ATP does not sit deep enough to interact with this residue. By more deeply occupying the space in the cleft between protomers, TNP-ATP and A-317491 prevent the ATP-induced “upward” movement of the ‘dorsal fin’ of protomer B to close the binding cleft, precluding the conformational changes necessary for channel opening. TNP-ATP is the prototypical antagonist at P2X1,3 receptors but binds significantly less tightly to P2X2,4,7 receptors9,14. TNP-ATP makes significant interactions with K65, D158, T172, F174, N279, R281, and K299 (Fig. 4e). D158 and F174 are not conserved among all P2X family members yet both are present in P2X1,3, suggesting the subtype specificity of TNP-ATP is mediated, in part, through these residues.
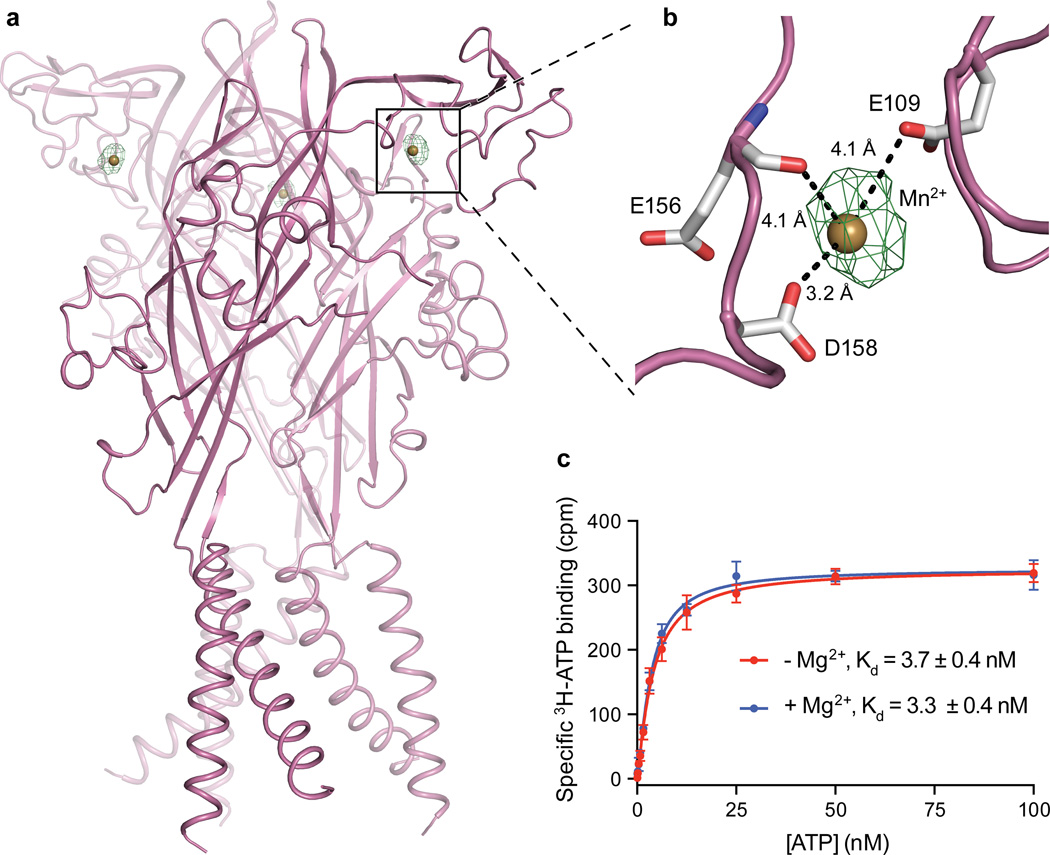
The apo structure of hP2X3 and both antagonist structures contain a Mg2+ ion in the head domain, near the ligand-binding pocket (Extended Data Fig. 7h and Fig. 4e,f), in a different region than previously predicted47. Anomalous difference Fourier maps derived from crystals grown in MnCl2 instead of MgCl2 support the conclusion that the density feature is a Mg2+ ion (Extended Data Fig. 8a,b and Extended Data Table 2). Because of the proximity of Mg2+ to the ATP binding site, we asked if Mg2+ could influence ATP binding affinity, as it has been shown to modulate receptor recovery from desensitization48. However, the presence of Mg2+ does not alter the affinity of hP2X3 for ATP (Extended Data Fig. 8c).
Ion Access and Permeation
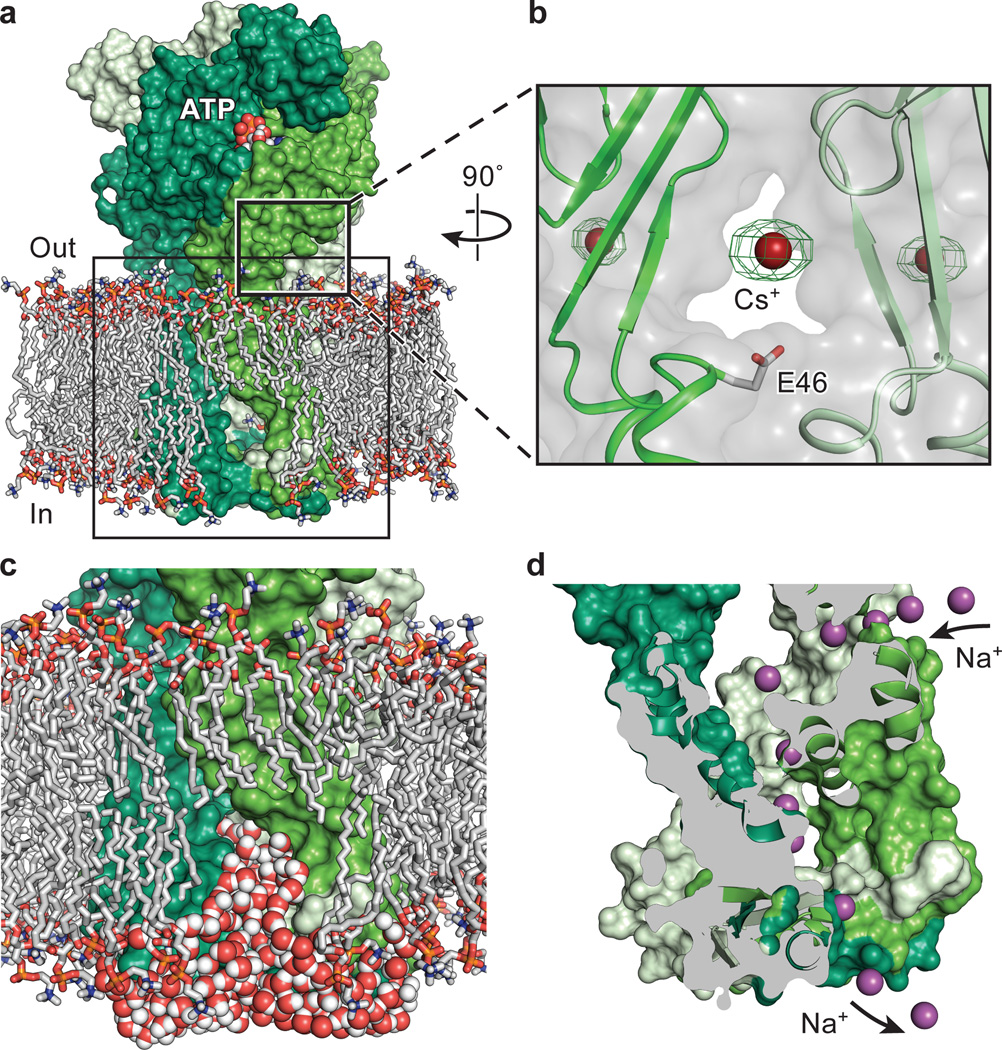
On the basis of the P2X4 receptor structure29, we suggested that ions enter the channel pore from the extracellular milieu via three lateral fenestrations located directly above the TM domains at the extracellular vestibule (Extended Data Fig. 3a,b)49,50. To investigate how ions enter the channel and identify monovalent cation binding sites, we grew apo hP2X3-MFCslow in the presence of CsCl instead of NaCl and probed for anomalous scattering from Cs+ ions. An anomalous signal was present in a cavity made by the extracellular vestibule, consistent with Na+ ions entering through the lateral fenestrations (Figure 5a,b and Extended Data Table 2).
Figure 5. Extracellular and cytoplasmic fenestrations.
a, The equilibrated, membrane-bound model of the open state of hP2X3 with the protein shown in surface representation and each protomer in a different shade of green. POPC lipid tails are silver. For the head groups, oxygen is in red, nitrogen in blue, and phosphorous in orange. b, An anomalous peak (5.0 σ) for a Cs+ ion at the entrance of the extracellular vestibule, near E46, which is located at the extracellular end of TM1. This experiment was performed on apo state crystals of hP2X3-MFCslowc, Cytoplasmic fenestrations enable water-filled rivulets, juxtaposed between the protein and lipid membrane, to function as pathways for ion egress into the cytoplasm. Several lipids have been removed in (a) and (c) to allow visualization of the cytoplasmic fenestrations. d, Snapshot of an independent Na+ ion permeation event as Na+ enters through the extracellular fenestrations and egresses through the cytoplasmic fenestrations. Na+ ions are shown as purple spheres.
The egress of ions from the pore of the hP2X3 open state structure to the cytoplasm cannot occur along the 3-fold axis of the receptor because the orifice along this axis is too small (Extended Data Fig. 3c). However, the cytoplasmic cap and TM2 helices from adjacent protomers form the borders of a triangular-shaped cytoplasmic fenestration, apparently within the boundary of the lipid membrane, that could represent a path of ion egress (Fig. 2c). To probe whether these fenestrations are plausible routes for ion egress we carried out molecular dynamic (MD) simulations using the open state of the receptor in a POPC lipid bilayer (Fig. 5a,c,d). Hydration patterns in the TM region reveal the putative pathway for ions. Water molecules pass through the open pore but do not exit from the bottom surface of the cytoplasmic cap. Instead, water exits the protein lumen through the cytoplasmic fenestrations (Fig. 5c). Polar lipid head groups line the protein at the fenestrations and likely assist in water permeation. Independent Na+ permeation events were observed through all three cytoplasmic fenestrations suggesting that Na+ ions enter via lateral extracellular fenestrations and egress through lateral cytoplasmic fenestrations (Fig 5d).
Gating Cycle
Initiation of P2X receptor gating begins with the binding of ATP between two subunits, induction of cleft closure and, through structural coupling, an outward “flexing” of the lower body domain (Supplementary Videos 1–3 and Fig. 6). Because the β-sheets of the lower body domain are directly coupled to the TM helices, their outward movement ‘pulls’ on the cytoplasmic portions of the TM domains. This conformational change at the extracellular domain induces three major structural changes in the TM and cytoplasmic domains during the transition from the apo to open state: a counterclockwise rotation of TM2 to open the pore in an iris-like movement, a change in helical pitch for a turn of TM2 from an α-helix to a 310-helix and finally, formation of the “cytoplasmic cap”, which anchors the cytoplasmic surface of the TM domains, and provides “cytoplasmic fenestrations” through which ions exit the pore.
Figure 6. The gating cycle.
A cartoon model summarizing the mechanisms of activation, desensitization, ion permeation/egress and antagonist action at P2X receptors.
Transition from the open to the desensitized state has two major features: the cytoplasmic cap unfolds or disassembles, and TM2 “recoils” upward, reverting the short stretch of 310-helix to an α-helix, allowing the pore to close at a new constriction site, located deeper within the membrane bilayer. In this way, the transition of TM2 from the open state to the desensitized state resembles the recoiling of a spring that has been stretched from above and subsequently released from below. We refer to this as the “helical recoil” model of receptor desensitization and suggest that the structure of the cytoplasmic cap stabilizes the open state, with its stability tuning the rate and extent of receptor desensitization. The role of the cytoplasmic cap in receptor function is not surprising since residues in both termini of P2X receptors have long been implicated in modulating desensitization22,23,25.
Conclusion
The structures of all iconic functional states of hP2X3 highlight how the ion pathway changes from the apo to open to desensitized states. For the first time, we visualize the full-length TM domains and characterize the structural role that the intracellular residues play in P2X receptor gating. Our structures reveal how the “cytoplasmic cap” anchors the TM domain to allow for a change in helical pitch in TM2 upon channel opening and provides a phospholipid-lined pathway for ions to laterally exit the pore. We hypothesize that the cytoplasmic cap undergoes a folding/unfolding transition during channel gating and its stability sets the rate of receptor desensitization, with the fast-desensitizing P2X receptors subtypes having a relatively less stable cap domain and the slow and incompletely desensitizing subtypes having a more stable cap domain. Competitive antagonists TNP-ATP and A-317491 bind to the orthosteric site and stabilize the apo state of the receptor. The structures of hP2X3 represent each of the major conformational states in the receptor gating cycle and illuminate the molecular mechanisms behind P2X receptor activation, desensitization and inhibition.
METHODS
Receptor Constructs
The initial construct for the human P2X3 (hP2X3) receptor was engineered based on the crystallization construct for the open state structure of zfP2X4 (ΔP2X4-C)27 and had 19 residues removed from the N-terminus and 49 residues removed from the C-terminus (hP2X3-ΔN19ΔC49). Although this receptor construct bound ATP with nanomolar affinity in radio-ligand binding assays, it showed no functional gating properties, as assessed by two-electrode voltage clamp experiments. Therefore, we systematically added residues back to both the N- and C-termini to obtain a functional hP2X3 construct. The return of 14 residues to the N-terminus and 16 residues to the C-terminus yielded hP2X3-ΔN5ΔC33, referred to as hP2X3-MFC. To increase the likelihood of obtaining an open state conformation of the receptor, three rat P2X2-specific amino acid substitutions (P19/V21/I22) were made at the corresponding positions in the N-terminus of human P2X3 to confer the slowly desensitizing receptor phenotype21, referred to as hP2X3-ΔN5ΔC33-T13P/S15V/V16I or hP2X3-MFCslow.
Expression, Membrane Preparation, Protein Purification
The hP2X3-MFC and hP2X3-MFCslow proteins were expressed in HEK293S GNTI− cells as N-terminal EGFP fusions with an octa-histidine affinity tag and a thrombin cleavage sequence using the baculovirus-mediated gene transduction of mammalian cells51. HEK293S GNTI− cells in suspension were grown to a density of 3.0 ×10⁶ ml−1 and then infected by P2 BacMam virus. After growth at 37 °C for 16 hours, sodium butyrate was added to 10 mM final concentration and the cells were shifted to 30 °C for an additional 72 hours. Cells were then harvested, washed with PBS buffer and resuspended in TBS (50 mM Tris, pH 8.0 and 150 mM NaCl). The cells were broken by sonication in the presence of protease inhibitors (1 mM PMSF, 0.05 mg/mL aprotinin, 2 µg/mL pepstatin A, and 2 µg/mL leupeptin) and the membrane fraction was isolated by ultracentrifugation.
Pelleted membranes were resuspended in TBS buffer + 15% glycerol, homogenized and solubilized in 40 mM dodecyl-β-D-maltopyranoside, referred to as C12M. The solubilized fraction was isolated by ultra-centrifugation and incubated with TALON resin at 4 °C for 1–2 hours. After packing into an XK-16 column, the column was washed with 12 column volumes of buffer (TBS buffer plus 1 mM C12M, 30 mM imidazole and 5% glycerol) before being eluted with buffer containing 250 mM imidazole, pH 8.0. Fractions were pooled together and the pH was lowered to 6.5 by the addition of 500 mM MES, pH 6.5. Protein was then digested with thrombin (1:25, w/w) and Endo H (1:3, w/w) at room temperature for ~16 hours. Digested protein was concentrated and clarified by ultracentrifugation. Supernatant was injected onto a Superdex 200 10/300 GL column pre-equilibrated with 20 mM HEPES, pH 7.0, 100 mM NaCl, and 0.5 mM C12M to isolate trimeric receptor using size-exclusion chromatography (SEC). Monodisperse fractions were collected and hP2X3 was concentrated to 2–3 mg/mL prior to crystallization. For crystallization experiments designed to locate Na+ binding sites using the anomalous signal from Cs+ ions, SEC was performed with 100 mM CsCl instead of 100 mM NaCl.
For apo state and antagonist-bound structures, membranes were subjected to a dialysis step prior to purification in order to ensure removal of endogenous ATP. To do this, cell membranes were homogenized and transferred into an 8 – 10 kDa molecular weight cut off cellulose ester dialysis tubing and dialyzed in 150× volume of buffer containing 50 mM Tris pH 9.5, 1 M NaCl, 5% glycerol with buffer exchanges occurring once or twice per day over the course of six days. Dialyzed membranes were then solubilized and the protein was purified, as described above.
Crystallization and Structure Determination
All crystals were obtained with protein at 2–3 mg/mL and set up at 4 °C in hanging drop vapor diffusion method by mixing 1:1 (v/v) ratio with reservoir buffer. Crystals typically grew after 2–3 weeks.
Crystallization of Apo State
Initial experiments to crystallize hP2X3 in the apo state did not include a high salt dialysis step during purification. Structures obtained without dialysis contained a strong density in the binding pocket, consistent with the size, shape, and orientation of ATP, and thus were in fact not apo states of the receptor. We attributed the observed density to endogenous, cellular ATP, which presumably bound during cell lysis and stayed bound throughout the purification. Introducing a high salt dialysis step (see above) allowed for the removal of endogenous ATP and the structure determination of a true apo state of the receptor. Purified hP2X3-MFCslow obtained from dialyzed membranes was set up with reservoir buffer containing 25% PEG 400, 100 mM MES, pH 6.85, and 50 mM MgCl2. Crystals were cryo-protected by increasing the concentration of PEG 400 to 36% before freezing in liquid nitrogen. For experiments designed to locate putative Mg2+ binding sites, crystallization of apo receptor was performed with 50 mM MnCl2 substituted in place of 50 mM MgCl2.
TNP-ATP Soaking Experiments
TNP-ATP was added to the drop of apo hP2X3-MFCslow receptor crystals to a final concentration of 1–2 mM and allowed to soak for 24 hours prior to harvesting. Cryo-protection was performed by increasing the concentration of PEG 400 to 36% before freezing in liquid nitrogen.
Crystallization of A-317491-bound State
Purified hP2X3-MFCslow obtained from dialyzed membranes was supplemented with 3–4 mM A-317491 and set up in reservoir buffer containing 20% PEG 400, 100 mM glycine, pH 8.5 and 150 mM MgCl2. Crystals were cryo-protected by increasing the concentration of PEG 400 to 36% before freezing in liquid nitrogen.
Crystallization of ATP-bound, Closed Pore State
Purified hP2X3-MFC was supplemented with 0.25 mM TNP-ATP and set up in reservoir buffer containing 21% PEG 400, 100 mM Tris, pH 8.0, 325 mM sodium acetate, and 100 mM NaCl. Crystals were cryo-protected by transfer to well buffer supplemented with 25% ethylene glycol before freezing in liquid nitrogen. Under these conditions, TNP-ATP acted as an additive to facilitate crystallization of hP2X3 bound to endogenous ATP. No crystals could be grown when TNP-ATP was added to true apo protein where the endogenous ATP had been removed by extensive dialysis (see above).
2-methylthio-ATP Soaking Experiments
Crystals of hP2X3-MFC grown under the ATP-bound, closed pore conditions were subjected to soaking with either 2-methylthio ATP or TNP-ATP. Crystals were harvested from their drops individually using loops and transferred to a 5 µL drop of reservoir solution plus either 0.5 mM TNP-ATP or 0.5 mM 2-methylthio-ATP and 0.5 mM C12M. The crystals were allowed to soak in the drop for 48 hours and crystals that survived were transferred to a second 5 uL drop of reservoir solution with 0.5 mM soaking ligand and 0.5 mM C12M. The crystals were then harvested after 96 hours by transfer into reservoir buffer with 0.5 mM ligand, 0.5 mM C12M and 25% ethylene glycol as the cryo-protectant.
Crystallization of ATP-bound Open Pore State
Purified hP2X3-MFCslow was supplemented with 0.25 mM TNP-ATP and set up in reservoir buffer containing 20% PEG 400 and 50 mM ADA, pH 6.5. Crystals were cryo-protected by increasing the concentration of PEG 400 to 36% before freezing in liquid nitrogen.
Structure Determination
X-ray data sets were collected at the Advanced Light Source (beam line 5.0.2) and at the Advanced Photon Source (beam line 24-ID-C). Images were integrated with XDS52 and scaled with AIMLESS in the CCP4 suite53. For both the TNP-ATP soaked structure and the A-317491-bound structure, diffraction data were further processed by micro-diffraction analysis54. For the apo state structure, anisotropic scaling was performed with F/σF = 3.0 as the cut-off criterion using the UCLA anisotropy server55. All structures were solved by molecular replacement using the Phaser package in PHENIX56,57. The first hP2X3 structure solved in this study used the apo state zfP2X4 structure as the search model29. All subsequent structures, however, used hP2X3 models as search models. Models were built and refined using tools in the CCP453, COOT58, and PHENIX59 packages. Stereochemistry was evaluated using MolProbity60.
Two-Electrode Voltage Clamp
RNAs encoding hP2X3-MFC and hP2X3-MFCslow were transcribed from pCDNA3.1× plasmids using the mMessage mMachine T7 Ultra kit. Xenopus oocytes were then injected with 5–10 ng of RNA and incubated at 18 °C for 1–2 days in a solution containing 96 mM NaCl, 2 mM KCl, 1 mM MgCl2, 1.8 mM CaCl2, 5 mM HEPES, pH 7.5 and 250 µg ml−1 amikacin. Current recordings were made in a buffer containing 90 mM NaCl, 1 mM KCl, 2 mM MgCl2, and 10 mM HEPES, pH 7.4. Recording electrode pipettes (1–2.5 MΩ) were filled with 3 M KCl. Oocytes were voltage clamped at −60 mV. Traces were recorded with ATP at 1 µM concentration with or without co-application of antagonist, either TNP-ATP or A-317491, at 2 µM. Analog data were filtered at 50 Hz and digitized at > 1 kHz. The Axoclamp 2B amplifier and pClamp 10 software were used for data acquisition.
Radioligand-Binding Experiments
Scintillation proximity assays (SPA) were performed on detergent-solubilized hP2X3-MFC and hP2X3-MFCslow receptors34, purified without tag cleavage from dialyzed membranes. ATP affinity experiments were carried out using polyvinyltoluene copper (PVT-Cu) beads at 0.5 mgml−1, 3H-labelled ATP (1:4 ratio, hot 3H-ATP: cold ATP), and 10 nM GFP-His8-hP2X3 protein in PBS buffer, pH 8.0, 0.3% BSA, and 0.2 mM C12M. The background, nonspecific counts were determined by measuring the SPA signal in the presence of 10 µM TNP-ATP. Experiments to test the effect of magnesium ions on ATP affinity were performed in a sulfate buffer (10 mM Tris, pH 8.0, 137 mM NaCl, 2.7 mM KCl, 10 mM sodium sulfate, 1.8 mM potassium sulfate) with and without 25 mM MgCl2.
Ki inhibition studies were carried out using polyvinyltoluene copper (PVT-Cu) beads at 0.5 mgml−1, 10 nM total ATP (2 nM 3H-labelled ATP: 8 nM cold ATP), and 10 nM GFP-His8-hP2X3 protein in PBS buffer, pH 8.0, 0.3% BSA, and 0.15 mM C12M. Counts were recorded with increasing concentration of cold competitive antagonist. The SPA signal was counted at various time points after gentle agitation (15 minutes) at room temperature. Assay plates were read using a MicroBeta counter. Data were fitted using a standard single site competition equation, and KI values were calculated from the IC50 values using the Cheng-Prusoff equation. All data points are obtained from triplicate experiments.
Molecular Dynamics Simulations
Simulation Setup
The open state of hP2X3 was used as the initial structure for the simulations. Protonation states of the titratable residues were assigned based on pKa calculations using PROPKA 3.161–63 at pH 7. Accordingly, all the glutamate and aspartate residues were modeled in their default (unprotonated) form. Protein was placed into a POPC lipid bilayer using the replacement method in CHARMM-GUI and solvated64. Na+ and Cl− ions were added to neutralize the system with a net concentration of 100 mM. The system (197,531 atoms) was minimized for 5,000 steps and simulated for 10 ns at 310 K with all heavy atoms of the protein restrained to their crystallographic positions with a spring constant of k = 5 kcal/mol/Å2. Thereafter, the restraints on the side chains were removed and the system was simulated for an additional 10 ns with only the Cα atoms restrained at a spring constant of k = 5 kcal/mol/Å2. Finally, the system was simulated for 500 ns while restraining only the periplasmic ends of the transmembrane helices (to represent the effect of the periplasmic domain), using a spring constant of k = 5 kcal/mol/Å2. The final system had dimensions of 110 Å × 110 Å × 153 Å.
Simulation Protocol
All the simulations were performed with NAMD 2.965 using CHARMM27 force field for proteins with φ/ψ cross term map (CMAP) corrections66,67 and CHARMM36 all-atom additive parameters for lipids68. Water was modeled as TIP3P69. All simulations were performed using the NPT ensemble with periodic boundary conditions. Temperature was maintained at 310 K using Langevin dynamics70 with a damping constant of 0.5 ps. Pressure was kept at 1 atm using the Nosé-Hoover Langevin piston method70,71 with a piston period of 100 fs and a piston decay of 50 fs. Short-range interactions were cut off at 12 Å with a switching applied at 10 Å. Long-range electrostatic forces were calculated using the particle mesh Ewald (PME)72 method at a grid density of > 1 Å−3. Bonded, non-bonded, and PME calculations were performed at 2-, 2-, and 4-fs intervals, respectively. All restraints were in harmonic form with spring constant of k = 5 kcal/mol/Å2. Minimizations employed a conjugate gradient algorithm.
Simulation Under an Electric Potential
In order to achieve more efficient sampling of the hydrated pathways identified at the protein-lipid interface during the equilibrium simulations, and to assess their potential role as an ion translocation pathway, an independent simulation was set up in which a constant electric potential was applied across the lipid bilayer by imposing a uniform electric field E to all atoms of the system along the membrane normal (z-axis). The imposed electric field resulted in a membrane potential difference of 1 V (calculated as E.lz, where E is the magnitude of the electric field and lz is the length of the periodic cell in the z-direction). The starting point for the membrane potential simulation was a snapshot at t = 200 ns from the equilibrium simulation, which was then simulated under electric potential for an additional 200 ns.
Extended Data
Extended Data Figure 1. Functional studies of hP2X3-MFC and hP2X3-MFCslow.
a, Measurement of [3H-ATP] saturation binding to purified, detergent solubilized hP2X3-MFC using SPA. For each point in the plot, the error bars indicate the standard error of the mean (SEM) for triplicate samples. The calculated Kd for ATP binding was 2.8 ± 0.1 nM and represents the average of two separate experiments. b, ATP-induced currents for hP2X3-WT and hP2X3-MFC both show rapid desensitization kinetics with τ = 523 ± 198 ms and 429 ± 43 ms, respectively. These values represent an average of three measurements with error values indicating SEM. Actual rate constants are likely faster as the perfusion rate of our TEVC system is ~ 1000 ms. c, Measurement of [3H-ATP] saturation binding to purified, detergent solubilized hP2X3-MFCslow using SPA. The calculated Kd for ATP binding was 3.3 ± 0.3 nM. d, ATP-induced currents for hP2X3-MFCslow shows significantly delayed desensitization kinetics with τ = 42,581 ± 2194 ms. e, f, Co-application of 2 µM TNP-ATP (e) and 2 µM A-317491 (f) significantly inhibits the current induced by 1 µM ATP for hP2X3-WT, hP2X3-MFC and hP2X3-MFCslowg, Inhibition of 3H-ATP binding to hP2X3-MFCslow by unlabeled TNP-ATP yields a Ki of 94 ± 12 nM. The Ki for 3H-ATP binding to hP2X3-MFC by unlabeled TNP-ATP yields a Ki of 118 ± 1 nM (data not shown). h, i, Co-application of 2 µM TNP-ATP (h) and 2 µM A-317491 (i) blocks the residual current remaining after prolonged application of 1 µM ATP on hP2X3-MFCslow receptors.
Extended Data Figure 2. Naming of purinergic receptor domains and comparison of hP2X3 structures to previously published zfP2X4 structures.
a, Ribbon representation of one subunit of the open state structure of hP2X3 receptor shown in orthogonal views. The new “cytoplasmic cap” domain is termed the “tail fin”. b, Cartoon representation of the open state hP2X3 structure aligned to the open state zfP2X4 structure (construct name ΔP2X4-C) shown parallel to the membrane as a side view and as viewed perpendicular to the membrane from the extracellular side. The TM domains for the hP2X3 structure are significantly longer and more complete than for the zfP2X4 structure. c, Cartoon representation of the apo state hP2X3 structure aligned to the apo state zfP2X4 structure (construct name ΔP2X4-B) shown parallel to the membrane as a side view and viewed perpendicular to the membrane from the extracellular side. d, Sequence alignment of the N-terminus (top alignment) and C-terminus (bottom alignment) of hP2X3 compared to zfP2X4. Starting and ending residues of the hP2X3 construct compared to the ΔP2X4-C construct are indicated with red arrows. The hP2X3 crystallization construct has more residues at both termini than the ΔP2X4-C crystallization construct.
Extended Data Figure 3. The pore-lining surface of hP2X3 for open state, apo state and desensitized state.
a, A coronal section of a surface representation of the open state of hP2X3 reveals that four vestibules (upper, central, extracellular and intracellular) are located on the molecular three-fold axis. b, Pore-lining surfaces along the entire axis of hP2X3 for open state, apo state and desensitized state. The color of each sphere represents a different radius from the receptor center, as calculated by the program HOLE: red < 1.15 Å, green between 1.15 – 2.30 Å, and purple > 2.30 Å. c, Plot of pore radius as a function of distance along the pore axis for the open state vs. the apo state vs. the desensitized state. The positions of the residues making up the narrowest radius in each conformational state are labeled. The Cα position of I341 is set as zero. I323 defines gate #1, while T330 defines gate #2. These residues are at the equivalent positions that define the boundaries of the gate in the apo state structure of zfP2X4, but are leucine and alanine residues in zfP2X4, respectively. A single residue, V334, defines the constriction site of the desensitized state. Residue T330 defines the narrowest region of the pore in the open state.
Extended Data Figure 4. The overall structure and ion channel pore for competitive antagonist-bound states.
a,b, Cartoon representation for the competitive antagonist bound structures, TNP-ATP in cyan (a) and A-317491 in blue (b), shown parallel to the membrane as a side view. c, An overall alignment of a single protomer of apo state (red-purple), TNP-ATP bound state (cyan) and A-317491 bound state (blue). d, Plot of pore radius as a function of distance along the pore axis for apo state vs. TNP-ATP bound state vs. A-317491 bound state. The positions of the residues making up the narrowest radius in each conformational state are labeled. The Cα position of I341 is set as zero. e,f, Pore-lining surfaces along both the entire axis of the receptor as well as a focus on the transmembrane domain with TM2 pore-lining residues shown as sticks for the TNP-ATP (e) bound state and the A-317491 bound state (f). The color of each sphere represents a different radius from the receptor center, as calculated by the program HOLE: red < 1.15 Å, green between 1.15 – 2.30 Å, and purple > 2.30 Å.
Extended Data Figure 5. High affinity P2X3 agonist 2-(methylthio)adenosine 5′-triphosphate (2-methylthio-ATP) can be soaked into the desensitized state crystals.
a, Competition of 3H-ATP binding to hP2X3-MFC by unlabeled 2-methylthio-ATP yields a Ki of 1.9 ± 0.1 nM. b, Electron density for ATP in the desensitized state. The Fo-Fc map is contoured at 1.0 σ. c, Electron density for desensitized state crystals that have been soaked with 2-methylthio-ATP have a density in the binding pocket, which matches the shape of 2-methylthio-ATP, accounting for the methyl-thio moiety. The Fo-Fc map is contoured at 1.0 σ. d, An anomalous difference Fourier map (contoured at 3.5 σ) has anomalous signal that overlaps with the sulfur moiety of 2-methylthio-ATP as well as the phosphate groups. These crystals of hP2X3-MFC successfully ligand-exchanged ATP for agonist 2-methylthio-ATP in the binding pocket but were destroyed when soaked with antagonist TNP-ATP, providing evidence that the structure represents an agonist-bound, closed state or desensitized state.
Extended Data Figure 6. Resetting from desensitized to apo state of hP2X3.
a, b, Structure of hP2X3 in the desensitized state (a) and apo state (b) showed parallel to the membrane. There are significant changes between the two states in both the extracellular domain as well as the TM domain. c, d, Top-down view comparing the pore of the desensitized state (c) to the pore of the apo state (d) highlighting how, although both pores are “closed”, the residues that define the gate are different. e, Relative differences in the pore between desensitized and apo states after aligning the upper body domain of the trimer reveal that a significant clockwise conformational change at both the extracellular and cytoplasmic surfaces of the TM domain must occur for the receptor pore to “reset” back to the apo state. f, Alignment of TM2 in desensitized vs. apo state demonstrates both helices have the same helical pitch suggesting the 310-helix that existed in the open state is a transient structural feature. The inset shows the view along the axis of the TM2 helix, observed from the cytoplasmic surface. We speculate that the structural resetting of the receptor from the desensitized state to the apo state likely occurs after ligand dissociation.
Extended Data Figure 7. Orthosteric ligand-binding site and ligand densities.
a,b, View of the orthosteric binding pocket for the ATP-bound open state structure of hP2X3. ATP binds at an interface between two protomers, with protomer A shown in green and protomer B shown in gray. The 2Fo-Fc density for ATP is shown at 2.5 σ. c,d, View of the orthosteric binding pocket for the TNP-ATP bound closed state structure of hP2X3 with protomer A shown in cyan and protomer B shown in gray. The 2Fo-Fc density for TNP-ATP is shown at 1.5 σ. e,f, View of the orthosteric binding pocket for the A-317491 bound closed state structure of hP2X3 with protomer A shown in blue and protomer B shown in gray. The 2Fo-Fc density for A-317491 is shown at 0.8 σ. g, Close-up comparison of the relative orientation of ATP (shown as translucent) versus TNP-ATP in the binding pocket highlights how the phosphate moiety and the orientation of the ribose group are both inverted between the two molecules. h, The apo state structure (shown in figure) as well as both antagonist bound structures have a Mg2+ ion present in the head domain of hP2X3, coordinated by the side chains of E109 and D158 as well as the carbonyl oxygen of E156. The 2Fo-Fc density for the Mg2+ ion is shown at 1.5 σ.
Extended Data Figure 8. Anomalous signal from Mn2+ ion proves Mg2+ ion is present in the head domain of the apo state.
a, Anomalous difference map of apo structure with crystals grown in MnCl2 have an anomalous signal from a Mn2+ ion in the head domain (anomalous difference Fourier map shown in green contoured at 6 σ). This anomalous signal from Mn2+ overlaps with the 2Fo-Fc density shown in Extended Data Fig. 7h, proving this density is a Mg2+ ion. b, The Mn2+ ion in the head domain is coordinated by the side chains of E109 and D158 and the carbonyl oxygen of E156. c, The presence of a Mg2+ ion does not change the affinity of ATP for hP2X3-MFCslow, as assessed by SPA binding, suggesting that Mg2+ does not compete with ATP for the binding pocket or impair the ability of ATP to bind to the receptor.
Extended Data Table 1.
Data collection and refinement statistics.
| hP2X3-MFCslow ATP-bound |
hP2X3-MFC ATP-bound |
hP2X3-MFCslow No Ligand |
hP2X3-MFCslow A-317491-bound† |
hP2X3-MFCslow No Ligand TNP-ATP Soaked‡ |
hP2X3-MFC ATP-bound 2-MeThio-ATP Soaked |
|
|---|---|---|---|---|---|---|
| Data collection | ALS 5.0.2 | APS 24-ID-C | ALS 5.0.2 | ALS 5.0.2 | APS 24-ID-C | APS 24-ID-C |
| Space group | P213 | P213 | R32 | R32 | R32 | P213 |
| Cell dimensions a, b, c (Å) |
173.15, 173.15 173.15 |
172.14, 172.14, 172.14 |
120.17, 120.17 236.58 |
123.17, 123.17, 237.46 |
120.45, 120.45 235.99 |
172.64, 172.64, 172.64 |
| α, β, γ (°) | 90.0, 90.0, 90.0 |
90.0, 90.0, 90.0 |
90.0, 90.0, 120.0 |
90.0, 90.0, 120.0 |
90.0, 90.0, 120.0 |
90.0, 90.0, 90.0 |
| Wavelength (Å) | 1.0 | 0.979 | 1.0 | 1.0 | 0.979 | 0.979 |
| Resolution (Å) | 50 – 2.77 | 80 – 2.90 | 50 – 2.98 | 50–3.13 | 50 – 3.25 | 50 – 3.09 |
| Rmeas | 8.2 (133.6) | 8.1 (120.4) | 5.2 (61.5) | 6.1 (57.7) | 6.1 (59.4) | 8.9 (102.1) |
| //σ/* | 12.34 (1.22) | 12.30 (1.19) | 18.34 (2.42) | 20.37 (2.91) | 19.64 (2.40) | 11.10 (1.21) |
| Completeness (%)* | 99.2 (95.9) | 97.6 (96.9) | 95.4 (58) | 98.3 (99.8) | 99.8 (99.1) | 96.2 (92.8) |
| Multiplicity* | 3.94 (3.87) | 2.84 (2.86) | 4.12 (5.08) | 10.67 (8.96) | 10.27 (6.52) | 2.32 (2.31) |
| CC1/2(%)* | 99.9 (49.7) | 99.8 (43.4) | 99.9 (80.8) | 100 (32.6) | 99.9 (47.6) | 99.8 (41.7) |
| Refinement | ||||||
| Resolution (Å)* | 43 – 2.77 (2.81 –2.77) |
77 – 2.90 (2.95–2.90) |
39 – 2.98 (3.21–2.98) |
40 – 3.13 (3.44–3.13) |
48 – 3.25 (3.58–3.25) |
48 – 3.09 (3.16–3.09) |
| No. reflections | 79845 | 62472 | 13067 | 12308 | 10651 | 46746 |
| Rwork/Rfree | 0.201/0.228 | 0.205/0.240 | 0.213/0.259 | 0.252/0.283 | 0.254/0.286 | 0.203/0.228 |
| Average B-factor (Å2) | ||||||
| Protein | 90 | 89 | 84 | 120 | 125 | 98 |
| R.m.s. deviations | ||||||
| Bond lengths (Å) | 0.003 | 0.006 | 0.003 | 0.004 | 0.003 | 0.003 |
| Bond angles (°) | 0.892 | 1.350 | 0.772 | 0.955 | 0.634 | 0.721 |
| Ramachandran plot | ||||||
| Favored (%) | 97.6 | 98.6 | 97.8 | 96.6 | 98.4 | 98.1 |
| Allowed (%) | 2.4 | 1.4 | 2.2 | 3.4 | 1.6 | 1.9 |
| Disallowed (%) | 0 | 0 | 0 | 0 | 0 | 0 |
| Rotamer outliers (%) | 0.7 | 0.7 | 1.2 | 0 | 0.4 | 0.6 |
Highest resolution shell in parentheses.
5% of reflections were used for calculation of Rfree.
Two crystals were merged for the A-317491 bound structure and processed with microdiffraction assembly.
Two crystals were merged for the TNP-ATP bound structure and processed with microdiffraction assembly.
Extended Data Table 2.
Anomalous data collection statistics.
| hP2X3-MFC ATP-bound 2-MeThio-ATP Soaked Sulfur Anomalous |
hP2X3-MFCslow No ligand Mn2+ Anomalous |
hP2X3-MFCslow No Ligand Cs+ Anomalous |
|
|---|---|---|---|
| Data collection | APS 24-ID-C | ALS 5.0.2 | APS 24-ID-C |
| Space group | P213 | R32 | R32 |
| Cell dimensions | |||
| a, b, c (Å) | 172.93, 172.93 172.93 |
120.20, 120.20 236.24 |
119.95, 119.95, 236.41 |
| α, β, γ (°) | 90.0, 90.0, 90.0 |
90.0, 90.0, 120.0 |
90.0, 90.0, 120.0 |
| Wavelength (Å) | 1.550 | 1.771 | 1.907 |
| Resolution (Å) | 50 – 3.30 | 50 – 4.03 | 50 – 3.79 |
| Rmeas | 15.6 (197.8) | 14.7 (185.3) | 8.2 (292) |
| //σ/* | 11.75 (1.33) | 11.60 (1.33) | 13.42 (0.64) |
| Completeness (%)* | 99.9 (99.0) | 99.7 (97.2) | 99.8 (99.6) |
| Multiplicity* | 5.82 (5.77) | 11.34 (10.14) | 7.80 (7.70) |
| CC1/2 (%)* | 99.8 (42.6) | 100 (57.1) | 100 (28.1) |
Highest resolution shell in parentheses.
Supplementary Material
Acknowledgments
We thank M. Hattori for initial construct screening, L. Vaskalis for figures, H. Owen for manuscript preparation and Gouaux laboratory members for discussions. We acknowledge the Berkeley Center for Structural Biology at the Advanced Light source for assistance with data collection at beamline 5.0.2 and the Northeastern Collaborative Access Team at the Advanced Photon Source for assistance with data collection at beamline 24-ID-C. The simulations were supported by the National Institutes of Health (Grants U54-GM087519 and P41-GM104601 to E.T.) and computationally through XSEDE (grant TG-MCA06N060 to E.T.). E.G. is an investigator with the Howard Hughes Medical Institute. This research was supported by the National Institute of General Medical Sciences (S.E.M. 5F32GM108391 and E.G. R01GM100400).
Footnotes
AUTHOR CONTRIBUTIONS
S.E.M. and E.G. designed the project. S.E.M. performed the biochemical and functional analyses. S.E.M. and W.O. carried out the protein purification and crystallization. S.E.M., W.L., and W.O. performed the crystallography and model building. M.S. and E.T. performed the molecular dynamics simulations. All authors wrote and edited the manuscript.
The coordinates for the structure have been deposited in the Protein Data Bank under the accession codes 5SVJ, 5SVK, 5SVL, 5SVM, 5SVP, 5SVQ, 5SVR, 5SVS, and 5SVT.
The authors declare no competing financial interests.
REFERENCES
- 1.Londos C, Cooper DM, Wolff J. Subclasses of external adenosine receptors. Proc Natl Acad Sci U S A. 1980;77:2551–2554. doi: 10.1073/pnas.77.5.2551. [DOI] [PMC free article] [PubMed] [Google Scholar]
- 2.van Calker D, Muller M, Hamprecht B. Adenosine regulates via two different types of receptors, the accumulation of cyclic AMP in cultured brain cells. J Neurochem. 1979;33:999–1005. doi: 10.1111/j.1471-4159.1979.tb05236.x. [DOI] [PubMed] [Google Scholar]
- 3.Burnstock G. Do some nerve cells release more than one transmitter? Neuroscience. 1976;1:239–248. doi: 10.1016/0306-4522(76)90054-3. [DOI] [PubMed] [Google Scholar]
- 4.Valera S, et al. A new class of ligand-gated ion channel defined by P2x receptor for extracellular ATP. Nature. 1994;371:516–519. doi: 10.1038/371516a0. [DOI] [PubMed] [Google Scholar]
- 5.Webb TE, et al. Cloning and functional expression of a brain G-protein-coupled ATP receptor. FEBS Lett. 1993;324:219–225. doi: 10.1016/0014-5793(93)81397-i. [DOI] [PubMed] [Google Scholar]
- 6.Fountain SJ, Burnstock G. An evolutionary history of P2X receptors. Purinergic Signal. 2009;5:269–272. doi: 10.1007/s11302-008-9127-x. [DOI] [PMC free article] [PubMed] [Google Scholar]
- 7.Burnstock G, Kennedy C. P2X receptors in health and disease. Adv Pharmacol. 2011;61:333–372. doi: 10.1016/B978-0-12-385526-8.00011-4. [DOI] [PubMed] [Google Scholar]
- 8.Surprenant A, North RA. Signaling at purinergic P2X receptors. Annu Rev Physiol. 2009;71:333–359. doi: 10.1146/annurev.physiol.70.113006.100630. [DOI] [PubMed] [Google Scholar]
- 9.North RA, Jarvis MF. P2X receptors as drug targets. Mol Pharmacol. 2013;83:759–769. doi: 10.1124/mol.112.083758. [DOI] [PMC free article] [PubMed] [Google Scholar]
- 10.Brake AJ, Wagenbach MJ, Julius D. New structural motif for ligand-gated ion channels defined by an ionotropic ATP receptor. Nature. 1994;371:519–523. doi: 10.1038/371519a0. [DOI] [PubMed] [Google Scholar]
- 11.North RA. Molecular physiology of P2X receptors. Physiol Rev. 2002;82:1013–1067. doi: 10.1152/physrev.00015.2002. [DOI] [PubMed] [Google Scholar]
- 12.Habermacher C, Dunning K, Chataigneau T, Grutter T. Molecular structure and function of P2X receptors. Neuropharmacology. 2015 doi: 10.1016/j.neuropharm.2015.07.032. [DOI] [PubMed] [Google Scholar]
- 13.Egan TM, Khakh BS. Contribution of calcium ions to P2X channel responses. J Neurosci. 2004;24:3413–3420. doi: 10.1523/JNEUROSCI.5429-03.2004. [DOI] [PMC free article] [PubMed] [Google Scholar]
- 14.Virginio C, Robertson G, Surprenant A, North RA. Trinitrophenyl-substituted nucleotides are potent antagonists selective for P2X1, P2X3, and heteromeric P2X2/3 receptors. Mol Pharmacol. 1998;53:969–973. [PubMed] [Google Scholar]
- 15.Jarvis MF, Khakh BS. ATP-gated P2X cation-channels. Neuropharmacology. 2009;56:208–215. doi: 10.1016/j.neuropharm.2008.06.067. [DOI] [PubMed] [Google Scholar]
- 16.Koshimizu T, Koshimizu M, Stojilkovic SS. Contributions of the C-terminal domain to the control of P2X receptor desensitization. J Biol Chem. 1999;274:37651–37657. doi: 10.1074/jbc.274.53.37651. [DOI] [PubMed] [Google Scholar]
- 17.Allsopp RC, Evans RJ. The intracellular amino terminus plays a dominant role in desensitization of ATP-gated P2X receptor ion channels. J Biol Chem. 2011;286:44691–44701. doi: 10.1074/jbc.M111.303917. [DOI] [PMC free article] [PubMed] [Google Scholar]
- 18.Allsopp RC, Farmer LK, Fryatt AG, Evans RJ. P2X receptor chimeras highlight roles of the amino terminus to partial agonist efficacy, the carboxyl terminus to recovery from desensitization, and independent regulation of channel transitions. J Biol Chem. 2013;288:21412–21421. doi: 10.1074/jbc.M113.464651. [DOI] [PMC free article] [PubMed] [Google Scholar]
- 19.Boue-Grabot E, Archambault V, Seguela P. A protein kinase C site highly conserved in P2X subunits controls the desensitization kinetics of P2X(2) ATP-gated channels. J Biol Chem. 2000;275:10190–10195. doi: 10.1074/jbc.275.14.10190. [DOI] [PubMed] [Google Scholar]
- 20.Brandle U, et al. Desensitization of the P2X(2) receptor controlled by alternative splicing. FEBS Lett. 1997;404:294–298. doi: 10.1016/s0014-5793(97)00128-2. [DOI] [PubMed] [Google Scholar]
- 21.Hausmann R, et al. A hydrophobic residue in position 15 of the rP2X3 receptor slows desensitization and reveals properties beneficial for pharmacological analysis and high-throughput screening. Neuropharmacology. 2014;79:603–615. doi: 10.1016/j.neuropharm.2014.01.010. [DOI] [PubMed] [Google Scholar]
- 22.Koshimizu T, Tomic M, Koshimizu M, Stojilkovic SS. Identification of amino acid residues contributing to desensitization of the P2X2 receptor channel. J Biol Chem. 1998;273:12853–12857. doi: 10.1074/jbc.273.21.12853. [DOI] [PubMed] [Google Scholar]
- 23.Smith FM, Humphrey PP, Murrell-Lagnado RD. Identification of amino acids within the P2X2 receptor C-terminus that regulate desensitization. J Physiol. 1999;520(Pt 1):91–99. doi: 10.1111/j.1469-7793.1999.00091.x. [DOI] [PMC free article] [PubMed] [Google Scholar]
- 24.Werner P, Seward EP, Buell GN, North RA. Domains of P2X receptors involved in desensitization. Proc Natl Acad Sci U S A. 1996;93:15485–15490. doi: 10.1073/pnas.93.26.15485. [DOI] [PMC free article] [PubMed] [Google Scholar]
- 25.Zemkova H, He ML, Koshimizu TA, Stojilkovic SS. Identification of ectodomain regions contributing to gating, deactivation, and resensitization of purinergic P2X receptors. J Neurosci. 2004;24:6968–6978. doi: 10.1523/JNEUROSCI.1471-04.2004. [DOI] [PMC free article] [PubMed] [Google Scholar]
- 26.Fryatt AG, Evans RJ. Kinetics of conformational changes revealed by voltage-clamp fluorometry give insight to desensitization at ATP-gated human P2X1 receptors. Mol Pharmacol. 2014;86:707–715. doi: 10.1124/mol.114.095307. [DOI] [PubMed] [Google Scholar]
- 27.Hattori M, Gouaux E. Molecular mechanism of ATP binding and ion channel activation in P2X receptors. Nature. 2012;485:207–212. doi: 10.1038/nature11010. [DOI] [PMC free article] [PubMed] [Google Scholar]
- 28.Kasuya G, et al. Structural Insights into Divalent Cation Modulations of ATP-Gated P2X Receptor Channels. Cell Rep. 2016;14:932–944. doi: 10.1016/j.celrep.2015.12.087. [DOI] [PubMed] [Google Scholar]
- 29.Kawate T, Michel JC, Birdsong WT, Gouaux E. Crystal structure of the ATP-gated P2X(4) ion channel in the closed state. Nature. 2009;460:592–598. doi: 10.1038/nature08198. [DOI] [PMC free article] [PubMed] [Google Scholar]
- 30.Habermacher C, et al. Photo-switchable tweezers illuminate pore-opening motions of an ATP-gated P2X ion channel. Elife. 2016;5 doi: 10.7554/eLife.11050. [DOI] [PMC free article] [PubMed] [Google Scholar]
- 31.Heymann G, et al. Inter- and intrasubunit interactions between transmembrane helices in the open state of P2X receptor channels. Proc Natl Acad Sci U S A. 2013;110:E4045–E4054. doi: 10.1073/pnas.1311071110. [DOI] [PMC free article] [PubMed] [Google Scholar]
- 32.Zhou HX, Cross TA. Influences of membrane mimetic environments on membrane protein structures. Annu Rev Biophys. 2013;42:361–392. doi: 10.1146/annurev-biophys-083012-130326. [DOI] [PMC free article] [PubMed] [Google Scholar]
- 33.Minato Y, et al. Conductance of P2X4 purinergic receptor is determined by conformational equilibrium in the transmembrane region. Proc Natl Acad Sci U S A. 2016 doi: 10.1073/pnas.1600519113. [DOI] [PMC free article] [PubMed] [Google Scholar]
- 34.Quick M, Javitch JA. Monitoring the function of membrane transport proteins in detergent-solubilized form. Proc Natl Acad Sci U S A. 2007;104:3603–3608. doi: 10.1073/pnas.0609573104. [DOI] [PMC free article] [PubMed] [Google Scholar]
- 35.Chen CC, et al. A P2X purinoceptor expressed by a subset of sensory neurons. Nature. 1995;377:428–431. doi: 10.1038/377428a0. [DOI] [PubMed] [Google Scholar]
- 36.Lewis C, et al. Coexpression of P2X2 and P2X3 receptor subunits can account for ATP-gated currents in sensory neurons. Nature. 1995;377:432–435. doi: 10.1038/377432a0. [DOI] [PubMed] [Google Scholar]
- 37.Burgard EC, et al. Competitive antagonism of recombinant P2X(2/3) receptors by 2', 3'-O-(2,4,6-trinitrophenyl) adenosine 5'-triphosphate (TNP-ATP) Mol Pharmacol. 2000;58:1502–1510. doi: 10.1124/mol.58.6.1502. [DOI] [PubMed] [Google Scholar]
- 38.Jarvis MF, et al. A-317491, a novel potent and selective non-nucleotide antagonist of P2X3 and P2X2/3 receptors, reduces chronic inflammatory and neuropathic pain in the rat. Proc Natl Acad Sci U S A. 2002;99:17179–17184. doi: 10.1073/pnas.252537299. [DOI] [PMC free article] [PubMed] [Google Scholar]
- 39.Egan TM, Haines WR, Voigt MM. A domain contributing to the ion channel of ATP-gated P2X2 receptors identified by the substituted cysteine accessibility method. J Neurosci. 1998;18:2350–2359. doi: 10.1523/JNEUROSCI.18-07-02350.1998. [DOI] [PMC free article] [PubMed] [Google Scholar]
- 40.Hille B. Ion channels of excitable membranes. 3rd. Sinauer; 2001. [Google Scholar]
- 41.Degrève L, Vechi SM, Junior CQ. The hydration structure of the Na+ and K+ ions and the selectivity of their ionic channels. Biochimica et Biophysica Acta (BBA) - Bioenergetics. 1996;1274:149–156. [Google Scholar]
- 42.Migita K, Haines WR, Voigt MM, Egan TM. Polar residues of the second transmembrane domain influence cation permeability of the ATP-gated P2X(2) receptor. J Biol Chem. 2001;276:30934–30941. doi: 10.1074/jbc.M103366200. [DOI] [PubMed] [Google Scholar]
- 43.Jiang R, et al. Tightening of the ATP-binding sites induces the opening of P2X receptor channels. EMBO J. 2012;31:2134–2143. doi: 10.1038/emboj.2012.75. [DOI] [PMC free article] [PubMed] [Google Scholar]
- 44.Li M, Kawate T, Silberberg SD, Swartz KJ. Pore-opening mechanism in trimeric P2X receptor channels. Nat Commun. 2010;1:44. doi: 10.1038/ncomms1048. [DOI] [PMC free article] [PubMed] [Google Scholar]
- 45.Fujiwara Y, Keceli B, Nakajo K, Kubo Y. Voltage- and [ATP]-dependent gating of the P2X(2) ATP receptor channel. J Gen Physiol. 2009;133:93–109. doi: 10.1085/jgp.200810002. [DOI] [PMC free article] [PubMed] [Google Scholar]
- 46.Khakh BS, Bao XR, Labarca C, Lester HA. Neuronal P2X transmitter-gated cation channels change their ion selectivity in seconds. Nat Neurosci. 1999;2:322–330. doi: 10.1038/7233. [DOI] [PubMed] [Google Scholar]
- 47.Li M, Silberberg SD, Swartz KJ. Subtype-specific control of P2X receptor channel signaling by ATP and Mg2+ Proc Natl Acad Sci U S A. 2013;110:E3455–E3463. doi: 10.1073/pnas.1308088110. [DOI] [PMC free article] [PubMed] [Google Scholar]
- 48.Giniatullin R, Sokolova E, Nistri A. Modulation of P2X3 receptors by Mg2+ on rat DRG neurons in culture. Neuropharmacology. 2003;44:132–140. doi: 10.1016/s0028-3908(02)00338-6. [DOI] [PubMed] [Google Scholar]
- 49.Kawate T, Robertson JL, Li M, Silberberg SD, Swartz KJ. Ion access pathway to the transmembrane pore in P2X receptor channels. J Gen Physiol. 2011;137:579–590. doi: 10.1085/jgp.201010593. [DOI] [PMC free article] [PubMed] [Google Scholar]
- 50.Samways DS, Khakh BS, Dutertre S, Egan TM. Preferential use of unobstructed lateral portals as the access route to the pore of human ATP-gated ion channels (P2X receptors) Proc Natl Acad Sci U S A. 2011;108:13800–13805. doi: 10.1073/pnas.1017550108. [DOI] [PMC free article] [PubMed] [Google Scholar]
- 51.Goehring A, et al. Screening and large-scale expression of membrane proteins in mammalian cells for structural studies. Nat Protoc. 2014;9:2574–2585. doi: 10.1038/nprot.2014.173. [DOI] [PMC free article] [PubMed] [Google Scholar]
- 52.Kabsch W. Xds. Acta Crystallogr D Biol Crystallogr. 2010;66:125–132. doi: 10.1107/S0907444909047337. [DOI] [PMC free article] [PubMed] [Google Scholar]
- 53.Collaborative Computational Project N. The CCP4 suite: programs for protein crystallography. Acta Crystallogr D Biol Crystallogr. 1994;50:760–763. doi: 10.1107/S0907444994003112. [DOI] [PubMed] [Google Scholar]
- 54.Hanson MA, et al. Crystal structure of a lipid G protein-coupled receptor. Science. 2012;335:851–855. doi: 10.1126/science.1215904. [DOI] [PMC free article] [PubMed] [Google Scholar]
- 55.Strong M, et al. Toward the structural genomics of complexes: crystal structure of a PE/PPE protein complex from Mycobacterium tuberculosis. Proc Natl Acad Sci U S A. 2006;103:8060–8065. doi: 10.1073/pnas.0602606103. [DOI] [PMC free article] [PubMed] [Google Scholar]
- 56.McCoy AJ. Solving structures of protein complexes by molecular replacement with Phaser. Acta Crystallogr D Biol Crystallogr. 2007;63:32–41. doi: 10.1107/S0907444906045975. [DOI] [PMC free article] [PubMed] [Google Scholar]
- 57.McCoy AJ, et al. Phaser crystallographic software. J Appl Crystallogr. 2007;40:658–674. doi: 10.1107/S0021889807021206. [DOI] [PMC free article] [PubMed] [Google Scholar]
- 58.Emsley P, Cowtan K. Coot: model-building tools for molecular graphics. Acta Crystallogr D Biol Crystallogr. 2004;60:2126–2132. doi: 10.1107/S0907444904019158. [DOI] [PubMed] [Google Scholar]
- 59.Adams PD, et al. PHENIX: building new software for automated crystallographic structure determination. Acta Crystallogr D Biol Crystallogr. 2002;58:1948–1954. doi: 10.1107/s0907444902016657. [DOI] [PubMed] [Google Scholar]
- 60.Chen VB, et al. MolProbity: all-atom structure validation for macromolecular crystallography. Acta Crystallogr D Biol Crystallogr. 2010;66:12–21. doi: 10.1107/S0907444909042073. [DOI] [PMC free article] [PubMed] [Google Scholar]
- 61.Li H, Robertson AD, Jensen JH. Very fast empirical prediction and rationalization of protein pKa values. Proteins. 2005;61:704–721. doi: 10.1002/prot.20660. [DOI] [PubMed] [Google Scholar]
- 62.Olsson MH, Sondergaard CR, Rostkowski M, Jensen JH. PROPKA3: Consistent Treatment of Internal and Surface Residues in Empirical pKa Predictions. J Chem Theory Comput. 2011;7:525–537. doi: 10.1021/ct100578z. [DOI] [PubMed] [Google Scholar]
- 63.Sondergaard CR, Olsson MH, Rostkowski M, Jensen JH. Improved Treatment of Ligands and Coupling Effects in Empirical Calculation and Rationalization of pKa Values. J Chem Theory Comput. 2011;7:2284–2295. doi: 10.1021/ct200133y. [DOI] [PubMed] [Google Scholar]
- 64.Jo S, Kim T, Iyer VG, Im W. CHARMM-GUI: a web-based graphical user interface for CHARMM. J Comput Chem. 2008;29:1859–1865. doi: 10.1002/jcc.20945. [DOI] [PubMed] [Google Scholar]
- 65.Phillips JC, et al. Scalable molecular dynamics with NAMD. J Comput Chem. 2005;26:1781–1802. doi: 10.1002/jcc.20289. [DOI] [PMC free article] [PubMed] [Google Scholar]
- 66.MacKerell AD, et al. All-atom empirical potential for molecular modeling and dynamics studies of proteins. J Phys Chem B. 1998;102:3586–3616. doi: 10.1021/jp973084f. [DOI] [PubMed] [Google Scholar]
- 67.Mackerell AD, Jr, Feig M, Brooks CL., 3rd Extending the treatment of backbone energetics in protein force fields: limitations of gas-phase quantum mechanics in reproducing protein conformational distributions in molecular dynamics simulations. J Comput Chem. 2004;25:1400–1415. doi: 10.1002/jcc.20065. [DOI] [PubMed] [Google Scholar]
- 68.Klauda JB, et al. Update of the CHARMM all-atom additive force field for lipids: validation on six lipid types. J Phys Chem B. 2010;114:7830–7843. doi: 10.1021/jp101759q. [DOI] [PMC free article] [PubMed] [Google Scholar]
- 69.Jorgensen WL, Chandrasekhar J, Madura JD, Impey RW, Klein ML. Comparison of simple potential functions for simulating liquid water. The Journal of Chemical Physics. 1983;79:926–935. [Google Scholar]
- 70.Martyna GJ, Tobias DJ, Klein ML. Constant pressure molecular dynamics algorithms. The Journal of Chemical Physics. 1994;101:4177–4189. [Google Scholar]
- 71.Feller SE, Zhang Y, Pastor RW, Brooks BR. Constant pressure molecular dynamics simulation: The Langevin piston method. The Journal of Chemical Physics. 1995;103:4613–4621. [Google Scholar]
- 72.Darden T, York D, Pedersen L. Particle mesh Ewald: An N·log(N) method for Ewald sums in large systems. The Journal of Chemical Physics. 1993;98:10089–10092. [Google Scholar]
Associated Data
This section collects any data citations, data availability statements, or supplementary materials included in this article.


