Abstract
The common participation of oncogenic KRAS proteins in many of the most lethal human cancers, together with the ease of detecting somatic KRAS mutant alleles in patient samples, has spurred persistent and intensive efforts to develop drugs that inhibit KRAS activity1. However, advances have been hindered by the pervasive inter- and intra-lineage diversity in the targetable mechanisms that underlie KRAS-driven cancers, limited pharmacological accessibility of many candidate synthetic-lethal interactions and the swift emergence of unanticipated resistance mechanisms to otherwise effective targeted therapies. Here we demonstrate the acute and specific cell-autonomous addiction of KRAS-mutant non-small-cell lung cancer cells to receptor-dependent nuclear export. A multi-genomic, data-driven approach, utilizing 106 human non-small-cell lung cancer cell lines, was used to interrogate 4,725 biological processes with 39,760 short interfering RNA pools for those selectively required for the survival of KRAS-mutant cells that harbour a broad spectrum of phenotypic variation. Nuclear transport machinery was the sole process-level discriminator of statistical significance. Chemical perturbation of the nuclear export receptor XPO1 (also known as CRM1), with a clinically available drug, revealed a robust synthetic-lethal interaction with native or engineered oncogenic KRAS both in vitro and in vivo. The primary mechanism underpinning XPO1 inhibitor sensitivity was intolerance to the accumulation of nuclear IκBα (also known as NFKBIA), with consequent inhibition of NFκB transcription factor activity. Intrinsic resistance associated with concurrent FSTL5 mutations was detected and determined to be a consequence of YAP1 activation via a previously unappreciated FSTL5–Hippo pathway regulatory axis. This occurs in approximately 17% of KRAS-mutant lung cancers, and can be overcome with the co-administration of a YAP1–TEAD inhibitor. These findings indicate that clinically available XPO1 inhibitors are a promising therapeutic strategy for a considerable cohort of patients with lung cancer when coupled to genomics-guided patient selection and observation.
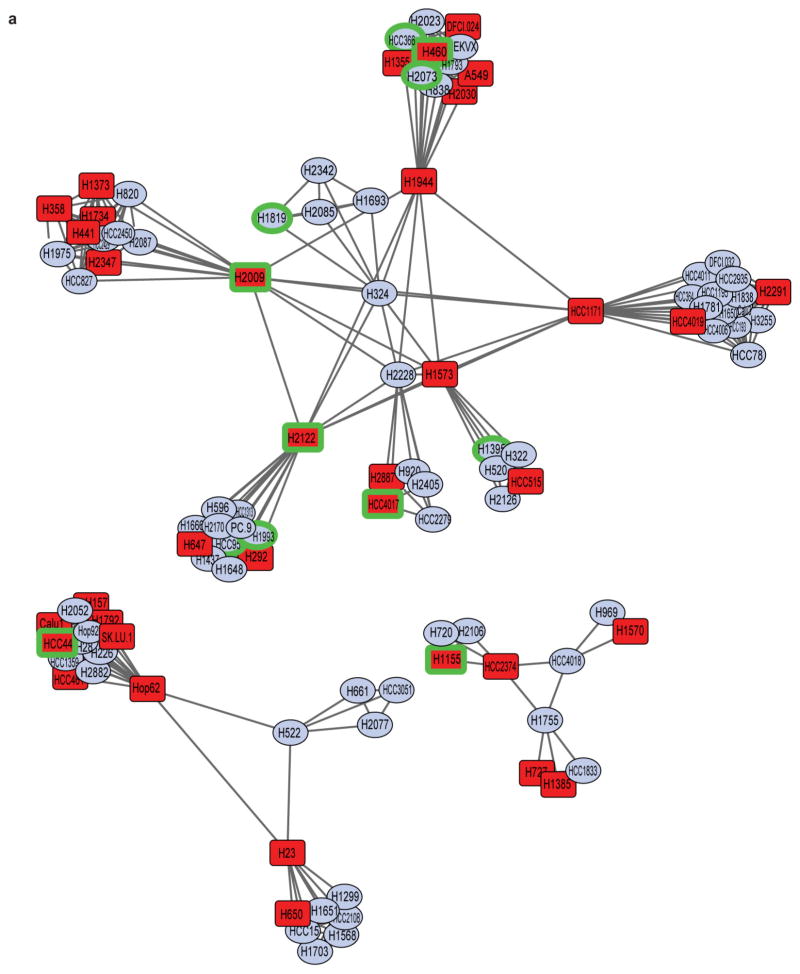
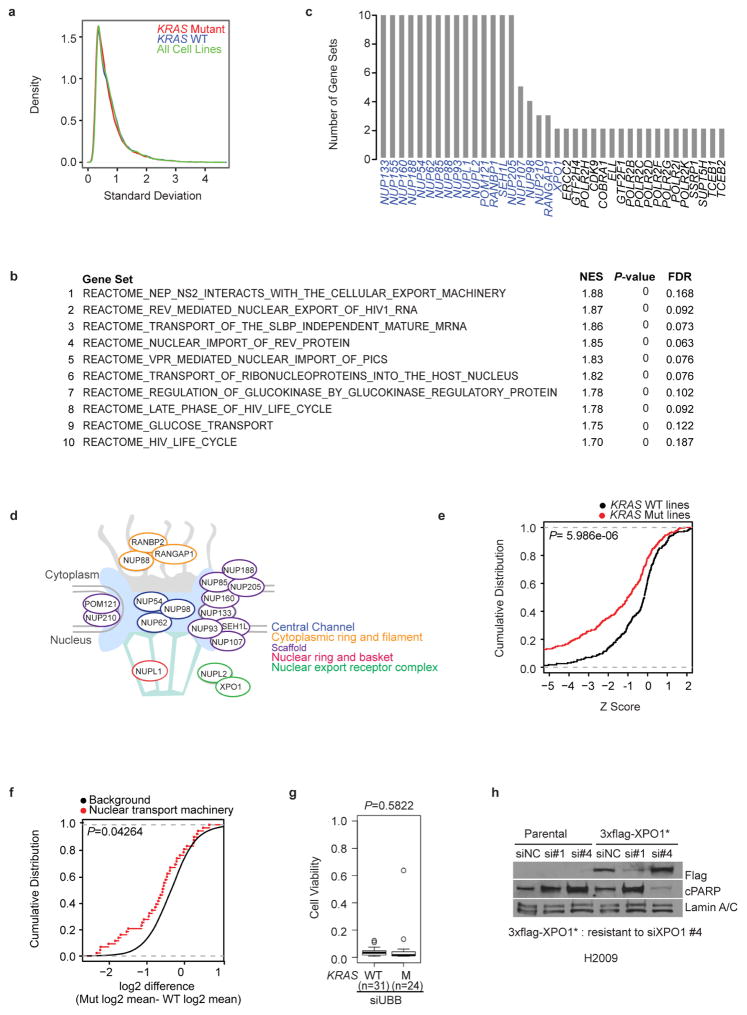
Extensive efforts have been directed at the identification of synthetic-lethal targets in KRAS-mutant cancers, producing mixed results2–5. One obstacle may be the sampling error that is associated with phenotypic diversity among KRAS-mutant cancers, both between and within disease lineages. To examine this, we determined the KRAS mutation status of 106 non-small-cell lung cancer (NSCLC)-derived cell lines (Supplementary Table 1). We then delineated common deterministic patterns derived from variations seen in whole-genome mRNA expression6 (Supplementary Table 2). At least eight phenotypic clusters were recovered, with KRAS-mutant cell lines present within most of them (Fig. 1a and Extended Data Fig. 1a). In fact, the variation in mRNA expression among KRAS-mutant cell lines was equivalent to that of all other cell lines in the panel (Extended Data Fig. 2a). To enrich for detection of bona fide synthetic-lethal genetic interactions with mutant KRAS, we therefore selected 12 cell lines, collectively distributed across the range of KRAS-independent background phenotypes, to serve as subjects for whole-genome short interfering RNA (siRNA) toxicity screens7,8 (Fig. 1a and Extended Data Fig. 1a). We detected 7,755 candidate siRNA pools that reduced the viability of at least one KRAS-mutant line (using a Z score cut-off of −3; Fig. 1b and Supplementary Table 3). To mitigate noise from ‘off-target’ siRNA oligonucleotide sequence-specific effects9, and to account for the complexity of KRAS-independent phenotypic variation, we used gene set enrichment analysis (GSEA; see Methods) to score gene sets, rather than individual genes, with collectively selective activity in the KRAS-mutant versus KRAS-wild-type lines. Of the 4,725 curated mechanistic gene sets queried, 10 were identified as being significantly enriched within the KRAS-mutant cohort (Fig. 1c and Extended Data Fig. 2b; false discovery rate (FDR) <0.2, P <1×10⁻¹⁶). Leading-edge analysis indicated that multiple genes that encode nuclear transport machinery were common among all 10 gene sets (Extended Data Fig. 2c–e). This enrichment was also seen in retrospective analysis of an independent short hairpin RNA (shRNA) viability screen3 in an isogenic pair of KRAS-wild-type and KRASG12D colorectal cancer cell lines (Extended Data Fig. 2f). Among the nuclear transport components identified in the siRNA screen, the selective nuclear export receptor XPO1 has been previously identified as druggable10,11. We therefore tested the sensitivity to XPO1 depletion across an additional 55 cell lines and found a strong positive correlation with KRAS mutation status (Fig. 1d and Extended Data Fig. 2g, h).
Figure 1. Synthetic-lethal genetic interactions in KRAS-mutant NSCLC cells.
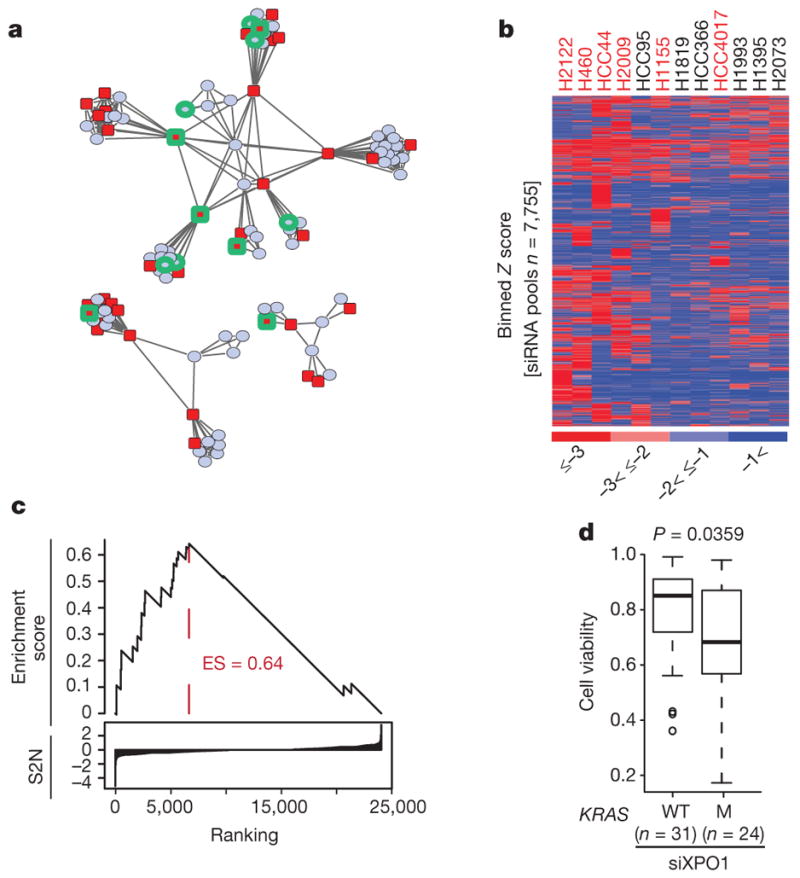
a, Two-dimensional APC projection of 106 NSCLC lines based on whole-genome variation in mRNA expression. Nodes represent cell lines and edges represent the Euclidean distance between cell lines. Red nodes, KRAS mutant (n = 37); blue nodes, KRAS wild type (n = 69). Cell lines subjected to whole-genome siRNA toxicity screening are highlighted in green. b, Binned Z-score distributions of selectively toxic gene depletions across the indicated cell lines. Cell lines (in columns; red label, KRAS mutant; black label, KRAS wild type) and siRNA target genes (rows) are clustered by two-way unsupervised unweighted pair group method with arithmetic mean (UPGMA). c, The reactome NEP NS2 interacts with the cellular export machinery. Empirical cumulative siRNA score distribution for a top-ranked KRAS-mutant-enriched gene set. S2N, signal-to-noise ratio. d, Differences in cell viability following XPO1 depletion with XPO1 siRNA (siXPO1) in KRAS-mutant versus KRAS-wild-type (WT) cell lines. Box plots indicate median and interquartile range (IQR). Unpaired t-test, P = 0.0359.
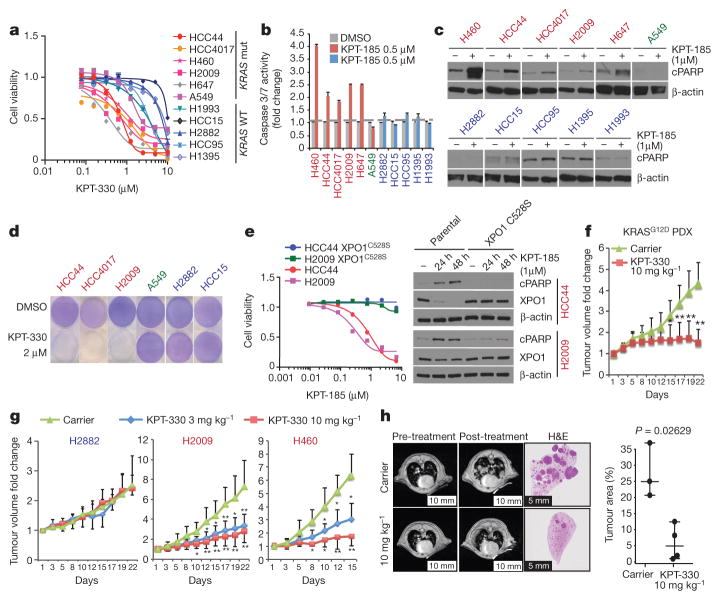
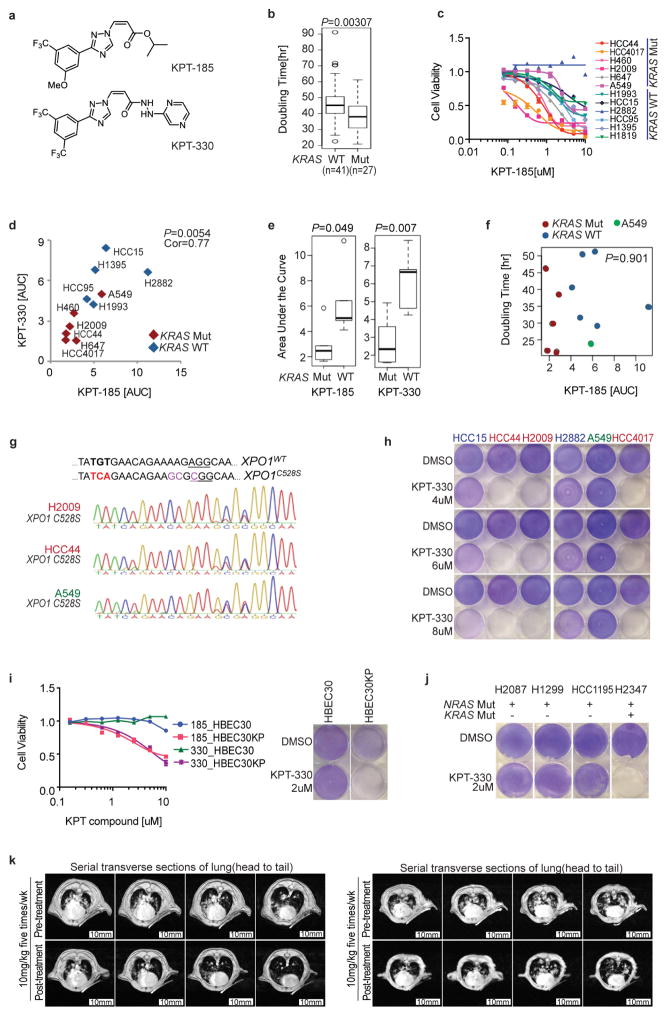
These observations led us to consider selective sensitivity to inhibition of nuclear export as a mutant KRAS-associated vulnerability in lung cancer cells. To investigate this, we used the XPO1 inhibitors KPT-185 and KPT-330 (Selinexor)10,12,13 (Extended Data Fig. 3a). Given the phenotypic enrichment for short doubling times in KRAS-mutant cells (Extended Data Fig. 3b and Supplementary Table 4), we selected a test cohort of cells with equivalent proliferation rates. Significant selective dose sensitivity among the KRAS-mutant cell lines compared to KRAS-wild-type lines was observed with both compounds (Fig. 2a and Extended Data Fig. 3c–e). Sensitivity to XPO1 inhibitors was independent of cell doubling time (Extended Data Fig. 3f and Supplementary Table 4) and was completely rescued by the introduction of the drug-resistant mutation (C528S)12 using CRISPR/Cas9-induced homologous recombination (Fig. 2e and Extended Data Fig. 3g). The non-responsive A549 cell line was an outlier and was therefore included in all subsequent analyses to represent potential mechanistic exceptions and/or contradictions to the KRAS synthetic-lethal theory.
Figure 2. Selective sensitivity of KRAS-mutant NSCLC cells to chemical inhibition of the nuclear transport receptor XPO1.
a, Dose–response curves for a panel of NSCLC lines following a 72-h exposure to KPT-330. Data are mean ± s.d. (n = 3). b, Induction of Caspase 3/7 activity in KRAS-mutant lines by KPT-185. Bars indicate mean and range of data (n = 2). c, Accumulation of the cell death marker cleaved PARP (cPARP) in KRAS-mutant lines following exposure to 1 μM KPT-185. β-actin is shown as a loading control. d, Stationary-phase cell populations exposed to KPT-330 for 6 d (crystal violet). e, Rescue of XPO1 inhibitor toxicity by gene editing. Dose–response curves are as in a. Mean and range (n = 2). Immunoblots are as in c. f, g, Fold change in tumour volume in indicated xenografts upon XPO1 inhibition. *P <0.05, **P <0.01, Unpaired t-test, mean ± s.d. h, Representative lung magnetic resonance image of KrasLSL-G12D;p53fl/fl mouse is shown before and after treatment for each cohort. Post-treatment haematoxylin and eosin (H&E)-stained left lung lobe is shown. Tumour burden was calculated as the tumour area divided by lung area. Unpaired t-test, P = 0.0263; scale bars, 10 mm (left 4) and 5mm (right 2).
Sensitivity to XPO1 inhibitors was associated with apoptosis (Fig. 2b, c), which was reversed by the XPO1C528S variant (Fig. 2e). This offered the opportunity to test clearance of stationary-phase cell populations using doses equivalent to those achievable in vivo with the orally bioavailable XPO1 inhibitor KPT-330 (ref. 14). With the exception of cell line A549, mutant KRAS-associated bimodal sensitivity to XPO1 inhibitors was evident (Fig. 2d), with preservation of target selectivity at doses over 400% higher than bioactive in vivo concentrations (Extended Data Fig. 3h and Supplementary Table 5). Notably, expression of oncogenic KRAS was sufficient to sensitize lung epithelia to XPO1 inhibitors in both proliferative and stationary-phase cultures (Extended Data Fig. 3i). However, cell lines with activating mutations in NRAS were not sensitive to XPO1 inhibitors unless they carried a concurrent KRAS mutation (Extended Data Fig. 3j). Conservation of efficacy and selectivity in vivo was tested and confirmed using three different mouse tumour models: subcutaneous xenograft tumour models with both wild-type and mutant KRAS NSCLC lines, a KRASG12D patient-derived xenograft (PDX) model, and the KrasLSL-G12D,p53fl/fl (p53 is also known as Trp53) genetically engineered mouse (GEM) model (Fig. 2f–h and Extended Data Fig. 3k).
GSEA identified NFκB target genes as being enriched in the XPO1-inhibitor-sensitive cohort (Fig. 3a and Extended Data Fig. 4a), and NFκB target genes were highly overrepresented among the 50 most differentially expressed genes in the sensitive cohort when compared with the resistant cohort (Extended Data Fig. 4b, e). NFκB signalling is often activated by KRAS and can be required for KRAS-driven tumorigenesis2,15,16. Notably, XPO1 inhibition resulted in the time-dependent nuclear accumulation of the NFκB negative regulatory protein IκBα (Fig. 3b), inhibition of NFκB promoter activity (Fig. 3d) and inhibition of NFκB target-gene expression (Fig. 3c and Extended Data Fig. 4c, d). The drug-resistant XPO1 allele cleanly reversed NFκB pathway sensitivity to KPT-185 (Fig. 3d). In addition, NFKBIA/B (the gene encoding IκBα/β) depletion was sufficient to confer resistance to XPO1 inhibitors (Fig. 3e and Extended Data Fig. 4f, g). These observations suggest that KRAS-mutant NSCLC cells require active nuclear export of IκBα to maintain NFκB-dependent survival signalling. Consistent with this, ectopic expression of an IκBα variant with an inactivated nuclear export signal (NES) sequence17 was tolerated in wild-type but not KRAS-mutant NSCLC cells, reducing their viability (Extended Data Fig. 4h). Furthermore, sensitivity to treatment with the weak but specific IκB kinase inhibitor BMS-345541 (ref. 18) exhibited significant positive correlation with sensitivity to KPT-185 (Extended Data Fig. 4i). In contrast, chemical inhibition of MEK activation, a key canonical KRAS pathway effector, had little consequence on cell viability at bioactive concentrations and showed no cooperativity with XPO1 inhibitors (Extended Data Fig. 4j, k). XPO1 inhibitors induced the nuclear accumulation of IκBα in all cell lines tested (Extended Data Fig. 4l), indicating that selective sensitivity is likely to be due to context-specific consequences of inhibition of NFκB signalling rather than selective target inhibition. Consistent with this, we found that KPT-330-resistant tumours displayed extensive nuclear accumulation of IκBα in response to KPT-330 exposure in vivo (Fig. 3f). Together, these observations indicate that the oncogenic KRAS protein induces XPO1-dependent activation of NFκB signalling in NSCLC cells to support cell survival, but that activation of the NFκB pathway is not generally required for survival of KRAS-wild-type NSCLC tumour lines with alternative mechanistic drivers.
Figure 3. Selective addiction to NFκB activity specifies sensitivity to XPO1 inhibition.
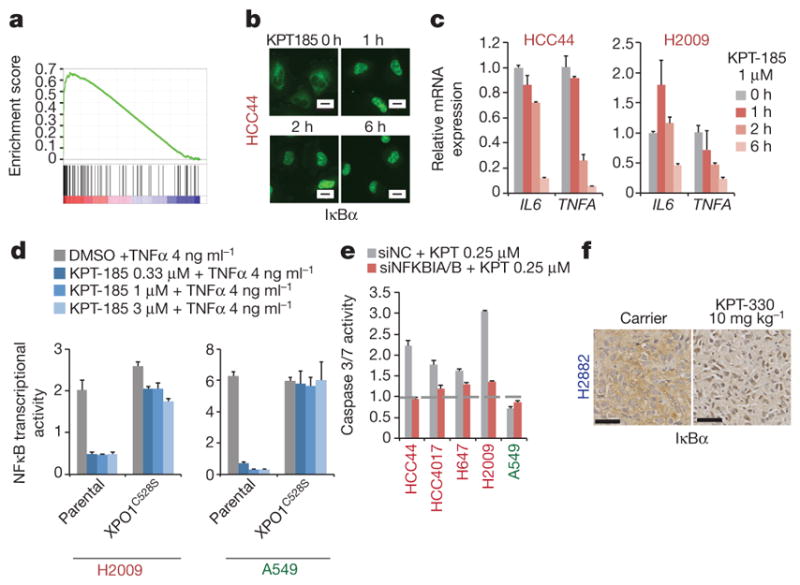
a, GSEA gene set, Hinata NFκB targets keratinocyte up. NFκB transcriptional target enrichment plot (XPO1-inhibitor-sensitive versus XPO1-inhibitor-resistant). b, Time-dependent nuclear accumulation of IκBα in response to 1 μM KPT-185. Scale bars, 20 μm. c, Time-dependent inhibition of NFκB target gene expression in response to 1 μM KPT-185. Mean and range (n = 2). d, Rescue of NFκB transcriptional activity by gene editing. Normalized luminescence-based NFκB reporter activity is shown. Mean + s.d. (n = 3). e, IκB-dependent induction of apoptosis by XPO1 inhibitors. Cells were transfected with the indicated siRNAs and 24 h later they were exposed to 0.25 μM KPT-185 for 48 h. siNC, negative control siRNA. Mean and range (n = 2). f, Nuclear accumulation of IκBα in xenograft tumours in response to KPT-330 treatment. Scale bars, 50 μm.
From separate pan-cancer cell line screening efforts, the KRAS-mutant NSCLC cell lines H2030 and H2122 were identified and validated as poor responders to XPO1 inhibitors (Extended Data Fig. 5a). We used this finding to identify any potential mechanisms of resistance to XPO1 inhibitors in KRAS-mutant NSCLC. On examination of whole-exome sequence data, we found that non- synonymous somatic alterations in FSTL5 selectively concur in XPO1-inhibitor-resistant KRAS-mutant lines (Fig. 4a and Supplementary Table 6). Two previously untested KRAS-mutant cell lines, H2291 and H1573, had concurrent FSTL5 mutations and were both found to be robustly resistant to XPO1 inhibitors (Extended Data Fig. 5b, c). Somatic mutations in FSTL5 were detected in 10% of lung adenocarcinomas in the The Cancer Genome Atlas (TCGA) database (http://www.cbioportal.org/), with an allelic distribution reminiscent of loss-of-function alterations (Extended Data Fig. 5d). Although mechanistically uncharacterized, FSTL5 has been nominated as a tumour suppressor protein in hepatocellular carcinoma (HCC)19 (Extended Data Fig. 5e). We found that FSTL5 depletion selectively reduced sensitivity to XPO1 inhibitors in KRAS-mutant, FSTL5-wild-type NSCLC lines (Fig. 4b and Extended Data Fig. 5f, g). Furthermore, ectopic FSTL5 expression was tolerated in wild-type but not mutant FSTL5 cell lines (Extended Data Fig. 5h), suggesting that some cancer genomes place selective pressure on FSTL5 inactivation. This suggests that FSTL5 mutations detected in cancer cells are loss-of-function and would promote resistance to XPO1 inhibitors.
Figure 4. Concurrent mutations in FSTL5 are associated with intrinsic resistance of KRAS-mutant lines to XPO1 inhibitors and are mechanistically coupled to YAP1 activation.
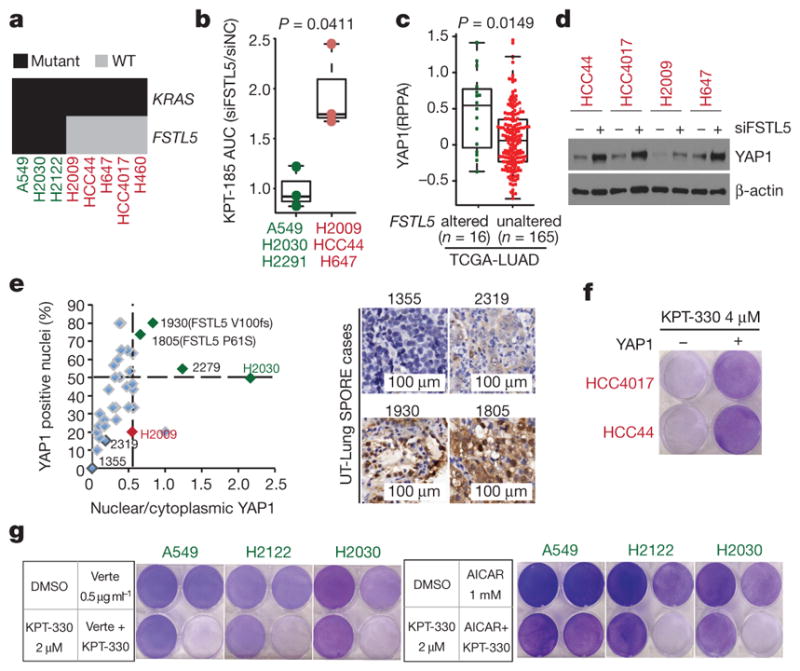
a, Biclustering results for NSCLC cell lines and KRAS and FSTL5 mutation status. b, Selective effects of FSTL5 depletion on the XPO1-inhibitor-sensitivity of KRAS-mutant, FSTL5-wild-type lines (red) versus KRAS-mutant, FSTL5-mutant lines (green). Box plot indicates fold changes in area under the curve (AUC) of FSTL5 siRNA (siFSTL5)-transfected cells normalized to negative control siRNA-transfected cells. AUCs calculated from Extended Data Fig. 5f, g. Unpaired t-test, P = 0.0411. c, Significant enrichment of YAP1 protein in tumours harbouring FSTL5 somatic alterations (data taken from the TCGA-LUAD). Unpaired t-test, P = 0.0149. d, YAP1 protein accumulation 72 h post-transfection with FSTL5 siRNAs. e, YAP1 immunohistochemistry. Detected somatic FSTL5 variants are indicated. Representative YAP1 immunohistochemistry stains are shown in the right panel. f, Induction of XPO1-inhibitor resistance by YAP1 overexpression (crystal-violet stained). g, Induction of XPO1 inhibitors sensitivity by verteporfin/AICAR-mediated YAP pathway inhibition (crystal-violet stained).
Defective YAP signalling is a major contributory factor in the development of HCC20. Together with observations of YAP-dependent resistance mechanisms to Kras inhibition in mouse lung and pancreatic cancers21–23, this led us to evaluate the potential relationships between FSTL5 and YAP activity. Human lung adenocarcinomas (from the TCGA lung adenocarcinoma database (TCGA-LUAD), n = 181) harbouring FSTL5 somatic alterations displayed significant increases in YAP1 protein expression when compared to wild-type tumours (Fig. 4c). Notably, FSTL5 depletion was sufficient to induce YAP1 protein stabilization (Fig. 4d and Extended Data Fig. 6a). Furthermore, transcription profiling revealed that the FSTL5-dependent gene expression programme was significantly enriched with genes that were also induced upon depletion of the LATS1 and LATS2 tumour suppressors (Extended Data Fig. 6b). To evaluate directly the FSTL5–YAP relationship in patient samples, 37 KRAS-mutant lung adenocarcinoma specimens were immunolabelled with antibodies for YAP1 (Supplementary Table 7). Slides were scored by experienced lung cancer pathologists for the percentage of YAP1-positive tumour cell nuclei and the relative YAP1 nuclear versus cytoplasmic distribution. Comparison to H2009 and H2030 cell blocks revealed three outlier tumours (1805, 1930 and 2279) with predicted YAP pathway activation (Fig. 4e and Extended Data Fig. 6c). Sanger sequencing of FSTL5 exons identified two samples that harboured somatic non-synonymous FSTL5 alterations (Fig. 4e and Extended Data Fig. 5d). These observations indicate a strong and clinically relevant association between FSTL5 mutation status and YAP1 protein accumulation that is consistent with inactivation of the Hippo tumour suppressor pathway24. Pertinently, overexpression of YAP1 was sufficient to confer resistance to XPO1 inhibitors (Fig. 4f and Extended Data Fig. 6d, e). Furthermore, chemical (using verteporfin) or genetic (using siRNAs targeted at YAP/TEAD2) inhibition of YAP1 transcription factor activity was sufficient to confer XPO1 inhibitor sensitivity (Fig. 4g and Extended Data Fig. 6i). Activation of AMPK by the cAMP analogue AICAR can inhibit productive YAP1/TEAD interactions by phosphorylation of YAP1 Ser94 (ref. 25). AICAR also reversed resistance to XPO1 inhibitors, but only in KRAS-mutant cell lines with an intact AMPK response (Fig. 4g and Extended Data Fig. 6f–h). Thus, FSTL5 is mechanistically coupled to YAP1 pathway activation, dictating sensitivity of KRAS-mutant NSCLC cells to chemical inhibition of XPO1.
Evaluation of the sensitivity of additional NSCLC lines to XPO1 inhibition identified one unexpected KRAS-wild-type responder (H1648) and two unexpected KRAS-mutant non-responders (HCC515 and Calu1) (Extended Data Fig. 6j). We found that H1648 contains genomic amplification of IKKB (a gene encoding IκB kinase β, an inhibitor of IκBα; also known as IKBKB) together with a transcription profile indicative of NFκB pathway activation (Extended Data Fig. 6k), suggesting sensitivity to XPO1 inhibitors owing to KRAS-independent addiction to NFκB signalling. HCC515 and Calu1 were found to harbour a LATS1 mutation (LATS1 R904X) and the loss of Merlin (also known as NF2) expression, respectively (Extended Data Fig. 6l), with both responding to YAP1 inhibition in combination with KPT-330 (Extended Data Fig. 6m). These additional exceptions were therefore accounted for by the mechanistic hypothesis.
Collectively, our observations indicate both that addiction to XPO1-dependent nuclear and cytoplasmic trafficking is a druggable liability in KRAS-mutant lung cancers and that genomics-guided patient selection and patient monitoring will be important if maximum benefit is to be achieved from XPO1 inhibitors.
METHODS
No statistical methods were used to predetermine sample size. The experiments were not randomized. The investigators were not blinded to allocation during experiments and outcome assessment.
Cell lines and reagents
NSCLC cell lines were established at the NCI and The University of Texas Southwestern Medical Center or were obtained from the ATCC. They were maintained in RPMI 1640 (Gibco), supplemented with 5% heat-inactivated fetal bovine serum (FBS; Atlanta Biologicals) and 1% penicillin/streptomycin (Gibco) in a humidified chamber at 5% CO2. HBEC30 and HBEC30-KP were maintained in ACL4 (RPMI 1640 supplemented with 0.02 mg ml−1 insulin, 0.01 mg ml−1 transferrin, 25 nM sodium selenite, 50 nM hydrocortisone, 10 mM HEPES, 1 ng ml−1 EGF, 0.01 mM ethanolamine, 0.01 mM O-phosphorylethanolamine, 0.1 nM triiodothyronine, 2 mg ml−1 BSA, 0.5 mM sodium pyruvate) with 2% FBS and 1% penicillin/streptomycin. All cell lines were authenticated using short tandem repeat (STR) profiling (PowerPlex 1.2, Promega) for at least eight different loci and results were compared with reference STR profiles available through the ATCC or established by our laboratory. Following authentication, cell-line stocks were frozen and maintained in liquid nitrogen until they were used in the reported experiments. Polyclonal stable cell lines were established by infecting parental cells with the indicated retroviral vector (Extended Data Figs 5h, 6d) or transfecting parental cells with the indicated plasmid (Extended Data Fig. 2h), followed by antibiotic selection for 7–14 days. XPO1C528S knock-in cell lines were generated by CRISPR/Cas9-induced homologous recombination as previously described12. All cell lines were mycoplasma-tested before experiments (iNtRON biotechology).
KPT-185 and KPT-330 were provided by Karyopharm Therapeutics. BMS-345541 and Verteporfin were purchased from Sigma. Antibodies were purchased from Cell Signaling (cPARP 9541, IκBa 4814, YAP1 12395, LATS1 3477, Histone H3 9715, ACC 3676, pACC 3661, Lamin A/C 4777), Sigma (β-actin A1978, Flag F1804), Abcam (Merlin ab88957) and Santa Cruz Biotechnology (XPO1 sc5595 and YAP1 sc101199 for immunofluorescence assay). The mutations in the NES of NFKBIA (M45A, L49A, I52A; Extended Data Fig. 4h) and the silent mutations in XPO1 (TGACACGGACTCAATTAAC; Extended Data Fig. 2h) were generated using the Q5 Site-Directed Mutagenesis Kit (New England Biolabs). All siRNAs used for small-scale experiments were obtained from Dharmacon. LONRF1 siRNA was used as a negative control siRNA. All siRNA sequences are provided in Supplementary Table 8.
siRNA screens and data processing
Two commercial genome-wide siRNA libraries from Ambion (library 1, 21,585 genes) and Dharmacon (library 2, 18,175 genes) were purchased in the 96-well plate format. siRNAs were dissolved in siRNA buffer (Dharmacon) overnight to a final concentration of 10 μM and stored at −80 °C before use. Libraries 1 and 2 are a mix of 3 and 4 individual siRNA oligo-nucleotides per gene, respectively. Transfection protocols were optimized for each cell line as previously described7. For reverse transfection, 3 μl of each siRNA pool (10 μM) was transferred to serum-free RPMI (95 μl per well) in empty 96-well assay plates (Costar). 30 μl of this siRNA solution was transferred to an empty 96-well optical assay plate (BioMek), incubated for 5 min, then mixed with 10 μl transfection reagent solution (0.13 μl RNAi Max (Invitrogen) in 10 μl serum-free RPMI), and incubated for 15 min. Cells were collected and diluted in parallel, then added to the siRNA–lipid mix and incubated for 96 h. All screens were performed using biological triplicates. CellTiter-Glo (Promega) assays were performed using 15 μl reagent per well followed by a 10 min incubation before quantitation of luminescence with an Envision plate reader (PerkinElmer). siUBB (siRNA against UBB, ubiquitin B; Dharmacon) was used as a positive control for toxicity for all cell lines. Screen data were row- and column-median-normalized and log2-transformed. Mean values from triplicates were used to calculate batch-centred Z scores using siMacro26.
Hierarchical clustering by UPGMA was performed using the ‘stats’ package in R, based on Euclidean distance using the ‘complete’ agglomeration method.
Functional GSEA analysis
Within each individual cell line, minimum gene-level Z scores were binned according to the following rules:
GSEA was then performed with the signal-to-noise ranking metric to determine gene sets that contained significantly lower Z scores in KRAS-mutant compared to the KRAS wild-type cells. A plot of the running sum (Fig. 1c) and the resulting signal-to-noise ratio at each point in the ranked list was constructed in R. The top gene sets preferentially ‘lower’ (that is, containing genes corresponding to siRNA pools with low (toxic) Z scores) in the KRAS-mutant cell lines were defined as those that had a P <1×10⁻¹⁶ and FDR <0.2 (Extended Data Fig. 2b). We performed a leading-edge analysis using the Broad GSEA software to identify genes enriched across multiple significant gene sets (Extended Data Fig. 2c).
Gene expression and data processing
Raw Illumina HumanWG-6 v3.0 Expression BeadChip files for the NSCLC cell lines used in this study are available from the Gene Expression Omnibus using accession number GSE32036. Data were background-corrected using the ‘MBCB’ package in R, which provides a model-based background correction method similar to an RMA correction with affymetrix arrays. Data were then quantile-normalized to produce equivalent expression distributions amongst cell lines.
To evaluate the distribution of expression variation within the NSCLC panel, standard deviations were calculated for expression of each of 25,235 genes (Illumina HumanWG-6 v3.0) across the full panel of 106 NSCLC lines, the 37 KRAS-mutant NSCLC lines, and the 69 KRAS-wild-type NSCLC lines (Supplementary Table 1, 2 and refs 27–30). Kernel density estimates were determined using the ‘stats’ package in R.
To examine the gene regulatory pathways affected by XPO1 inhibition, cells were exposed to either DMSO or 1 μM KPT-185 for 12 h. Total mRNA was isolated and gene expression profiling was performed using Illumina HT12v4 BeadChip. Expression values were extracted using GenomeStudio 2010.2. The raw values were background-corrected, quantile-normalized, log2-transformed and subjected to GSEA.
To examine the transcriptional response to LATS and FSTL5 depletion, cells were first transfected with siLATS1/2 and siFSTL5. 72 h post-transfection, cells were processed for gene expression profiling as described above. The raw intensities were background-corrected, quantile-normalized and log2-transformed. Genes with log2 expression values ≤4 across the samples were excluded from further analysis.
For targeted gene expression analysis, total cellular RNA was isolated using RNeasy miniprep Kit (Qiagen). cDNA was then synthesized using High-Capacity RNA-to-cDNA kits (Applied Biosystems) and subjected to quantitative PCR (qPCR) with TaqMan gene expression assay kits (Applied Biosystems).
Unpaired t-tests and two-sample Kolmogorov–Smirnov tests were performed using the R ‘stats’ package.
Affinity-propagation-based similarity clustering analysis
Clustering analysis was performed with the affinity propagation clustering (APC) algorithm using the ‘apcluster’ package in R. APC is a deterministic clustering method that identifies the number of clusters and cluster ‘exemplars’ (that is, the cluster centroid or the data point that is the best representative of all the other data points within that cluster) entirely from the data6, giving it an advantage over non-deterministic methods subject to a biased randomized initialization step, such as hierarichial clustering or methods in which the number of clusters has to be pre-specified, such as k-means clustering.
APC performs clustering by passing messages between the data points. It takes as input a square matrix representing pairwise similarity measures between all data points. The algorithm views each data point as a node in a network and is initialized by connecting all the nodes together, where edges between nodes are proportional to Euclidean distance. The algorithm then iteratively transmits messages along the edges, pruning edges with each iteration until a set of clusters and exemplars emerges.
Two real-valued messages are passed between nodes. The ‘responsibility’ message computes how well-suited point i is to choose point k as an exemplar, given all the other candidate exemplars, k′, and is updated by:
The availability message, a(i,k), computes how appropriate it is for point i to select point k as an exemplar, taking into account all the other points for which k is an exemplar, i′, and is given by:
In the above equation, a(i, k) is set to the self-responsibility, r(k, k), plus the sum of the positive responsibilities candidate k receives from other points. The entire sum is thresholded at 0, with a negative availability indicating that it is inappropriate for point i to choose point k as an exemplar so the tie is severed. The self-availability, a(k, k), reflects the accumulated evidence that point k is an exemplar and is updated with the following rule, which reflects the evidence that k is an exemplar based on the positive responsibilities sent to k from all points, and is updated by:
In the first iteration, all points are considered equally likely to be candidate exemplars, and a(i, k) is set to 0 and s(i, k) is set to the input similarity measure between points i and k. The above rules are then iteratively updated until a clear, stable set of clusters and exemplars emerges.
In our implementation, we first used the algorithm to identify an initial set of exemplars and clusters from the data matrix. The exemplars were then clustered together and this procedure was repeated until no more clusters emerged, identifying a hierarchical structure of clusters. Networks were drawn with cytoscape31 in the following manner. All members of the primary clusters are interconnected, and edge lengths are drawn to be proportional to Euclidean distances. Edge lengths between exemplars that cluster together are also drawn to be proportional to Euclidean distances. The entire map was rendered in a two-dimensional display using a cytoscape built-in spring-embedded algorithm.
To cluster 106 NSCLC cell lines with defined KRAS status by similar expression profiles (Fig. 1a, Extended Data Fig. 1a), we first reduced the panel of genes to those that were expressed at a log2-normalized expression value of 6 in at least one cell line and those that were present in the top 20% of the most highly variant genes; this resulted in a panel of 3,101 detectable and variable genes.
Retrospective analysis of genome-wide synthetic-lethal shRNA screen data
Extended Data Fig. 2f was generated using genome-wide synthetic-lethal shRNA screening data3. The shRNA screen was performed in an isogenic pair of KRAS wild-type and KRASG12D colorectal cancer cell lines with 6 pools of ′13,000 shRNAs/pool targeting 32,293 human transcripts. log2 fold changes in relative abundance of each shRNA depleted over time were analysed for each sample. Those with a fold-depletion equal or less than 0 in any sample were then compared between samples (KRAS-mutant versus KRAS wild-type) using the non-parametric two-sample Kolmogorov–Smirnov test.
Cell viability and cytotoxicity assay
For dose–response curves, cells were plated at 50% density in 96-well assay plates. On the following day, serially diluted compounds or vehicle alone were added to the culture media. Cell viability was measured using CellTiter-Glo (Promega) 72 h post-treatment. For dose–response analysis of XPO1 inhibitors combined with either siRNAs or chemical inhibitors (Extended Data Figs 4g, k, 5f, g, 6i), cell viability was normalized to the indicated matching controls. AUCs were computed by the trapezoidal method using GraphPad software. Caspase enzymatic activity was analysed using Caspase-Glo 3/7 (Promega) after compound treatment according to manufacturer’s instructions. The raw luminescence values were divided by the average luminescence values of matching controls (Figs 2b, 3e). To examine the cytotoxic effect of compounds on post-confluent cells, NSCLC cells were cultured to confluence in 6-well plates, exposed to compounds as indicated, then fixed in 100% cold methanol for 10 min and stained with 0.5% crystal violet for 30 min at room temperature. To examine tolerance to ectopic expression of nuclear IκBα, test plasmid DNA (pEGFP-C3-IκBα-NES-Mut) and control plasmid DNA (pEGFP-C3) were transfected into H2882 cells and H2009 cells in 12-well plates. 48 h and 72 h after transfection, cells were fixed and the GFP/DAPI ratio was examined using images taken with a Zeiss Plan 20×/0.30 PH1 objective on a Zeiss Axioplan 2E microscope. The following formula was used:
Proliferation rate measurement of NSCLC lines
Cells were counted at seeding, allowed to grow to a confluence of 80–90% and then harvested and the total cell number was determined. Population-doubling time was calculated using the following formula: number of hours from seeding to collection/((logn(t) − logn(t0))/log2). n(t) is the number of cells at time of passage and n(t0) is the number of cells seeded at previous passage32.
Targeted siRNA and plasmid DNA transfection
For transfection in 96-well plates, 1 μl siRNA (10 μM) in 30 μl of serum-free RPMI was mixed with 0.4 μl of RNAi Max (Invitrogen) in 10 μl of serum-free RPMI. Following a 15 min incubation, the siRNA–lipid mix was transferred to empty 96-well assay plates followed by delivery of single cell suspensions (100 μl per well). For transfection in 6-well plates, 10 μl siRNA (10 μM) in 250 μl of serum-free RPMI was mixed with 7 μl RNAi Max in 250 μl of serum-free RPMI and were delivered to plates followed by delivery of single-cell suspensions (2 ml per well). For plasmid DNA transfection in 12-well plates, 0.5 μg of plasmid DNA in 25 μl of serum-free media was mixed with 1.5 μl Fugene 6 (Promega) in 25 μl of serum-free media. After a 15-min incubation, suspended cells (1 ml per well) were added to the plate with DNA–Fugene 6 complexes. For plasmid DNA transfection in 60-mm dishes, cells were pre-plated and 2 μg DNA/6 μl Fugene 6 complexes in 100 μl of serum-free media were delivered to the cells the next day.
NFκB transcriptional activity reporter assay
Cells were reverse-transfected in 96-well microtitre plates with a reporter plasmid (pGL4.32[luc2p/NFκB-RE/Hygro], Promega) expressing firefly luciferase under the control of a multimerized NFκB-responsive element together with the pRL-SV40 Renilla luciferase control reporter plasmid at a ratio of 9:1. 24 h post-transfection, cells were exposed to compounds as indicated for 24 h and then treated with 4 ng ml−1 TNF for 6 h. Luciferase activities were measured using the Dual luciferase reporter system (Promega) according to manufacturer’s instructions.
Mouse xenografts
NOD/SCID female mice at 4–9 weeks of age were injected subcutaneously with H2882 (3 ×10⁵), H2009 (5 ×10⁵), and H460 (2.5 ×10⁵) cells. When tumours reached 100 mm3 or larger, mice were randomly assigned to three cohorts and orally treated with vehicle (0.6% (w/v) PVP K-29/32 and 0.6% (w/v) Pluronic F-68), 3 mg kg−1 KPT-330, or 10 mg kg−1 KPT-330 three times a week by oral gavage. Tumour volume was monitored with digital callipers using the following formula: Width2 × Length/2. Nutri-Cal (Tomlyn) was provided to mice throughout the experiment as a nutritional supplement. Mice were killed when xenografts reached 2 cm3. The number of mice per cohort was as follows: for H2882 xenografts, vehicle, n = 7; 3 mg kg−1, n = 7; 10 mg kg−1, n = 6; for H2009 xenografts, vehicle, n = 8; 3 mg kg−1, n = 8; 10 mg kg−1, n = 9; for H460 xenografts, vehicle, n = 5, 3 mg kg−1, n = 4, 10 mg kg−1, n = 5.
For bioanalysis of KPT-330 in mouse plasma, plasma samples were collected by cardiac puncture from mice (n = 4 per group), processed with three volumes of methanol containing internal standard (propranolol) and then centrifuged at 1,000g for 10 min. The supernatant was analysed by LC–MS/MS using an Agilent 6410 mass spectrometer coupled with an Agilent 1200 HPLC and a CTC PAL chilled autosampler, all controlled by MassHunter software (Agilent). After separation on a C18 reverse-phase high-performance liquid chromatography column (Agilent), using an acetonitrile-water gradient system, peaks were analysed by mass spectrometry using ESI ionization in MRM mode. All plasma samples were compared to a calibration curve prepared in mouse blank plasma.
KrasLSL-G12D;p53fl/fl GEM model
KrasLSL-G12D;p53fl/fl mice were infected with 2.5 ×10⁷ PFU of Ad-Cre (University of Iowa, Gene Transfer Vector Core) intratracheally at 7–8 weeks of age as previously described33. Eight to ten weeks after the injection, tumour development was monitored by magnetic resonance imaging (MRI) before treatment. Mice with equivalent tumour burden were randomly assigned to two cohorts and orally treated with either vehicle (0.6% (w/v) PVP K-29/32 and 0.6% (w/v) Pluronic F-68; n = 3) or 10 mg kg−1 KPT-330 (n = 4) three times a week by oral gavage. Outlier animals presenting with exceptionally high tumour burden were treated with 10 mg kg−1 KPT-330 five times a week by oral gavage. After the three weeks of treatment, lungs were imaged by MRI, then collected, fixed with 10% formalin, paraffin-embedded, and H&E stained. The stained lung-tissue specimens were scanned in Hamamatsu Nanozoomer 2.0HT for visualization and evaluation. Tumour burden was determined on the largest lobe and calculated as the tumour area divided by lung area. Area of interest was quantified using ImageJ software.
All magnetic resonance images were obtained using a 7T small-animal MRI scanner (Agilent (Varian), Inc.) equipped with a 40 mm Millipede RF coil (ExtendMR LLC, Milpitas, CA). All MRI acquisitions were gated using both cardiac and respiratory triggering. The images were recorded on the transverse plane, with the major parameters as follows: repetition time (TR), 200; echo time (TE), 1.834 ms; flip angle (FA), 45°; number of average, 8; field of view (FOV), 32 ×32 mm2; matrix size, 256 × 256; slice number, 17; slice thickness, 1 mm without any gap.
Patient-derived xenografts
Human KRASG12D T2aN0Mx stage lung adenocarcinoma tissue was obtained from a 40-year-old patient with lung cancer and directly implanted into the liver capsule of a NOD/SCID mouse. Written informed consent was obtained from the patient. Tissue procurement for the generation of patient-derived xenografts was approved by the Institutional Review Boards of UTSW. The mouse was killed 18 weeks later and the engrafted tumour was collected, divided, frozen in 10% DMSO/90% FBS and stored at −80 °C until being re-implanted subcutaneously to another NOD/SCID mouse in both flanks. When the tumours reached ~10 mm in length they were resected, evenly divided into 19 pieces and re-implanted subcutaneously to 10-week-old NOD/SCID female mice. Mice harbouring palpable engrafted tumours (58–101 mm3) were randomly assigned to receive either carrier (0.6% (w/v) PVP K-29/32 and 0.6% (w/v) Pluronic F-68; n = 6) or 10 mg kg−1 KPT-330 (n = 6) three times a week. Tumour volume was monitored with digital callipers using the following formula: tumour volume = width2 ×length/2.
All mouse studies were performed according to the guidelines of the UT Southwestern Institutional Animal Care and Use Committee.
Immunofluorescence and immunohistochemistry
For immunofluorescence-based imaging, cells were fixed with 3.7% formaldehyde (Fisher Scientific), perme-abilized with 0.1% Triton X-100, blocked with PBST (PBS containing 1% bovine serum albumin and 0.1% Tween-20) and incubated with antibodies in PBST against the indicated proteins. Representative images were captured with a PCO: sCMOS 5.5 camera on a Zeiss Axioplan 2E microscope.
For immunohistochemistry-based protein expression analysis, paraffin- embedded mouse tumour samples were deparaffinized, subjected to heat-induced antigen retrieval in 10 mM sodium citrate buffer, blocked using 3% peroxidase (Sigma), Avidin/Biotin blocking Kit (Vector laboratories), and M.O.M. Kit (Vector laboratories) and incubated with anti-IκBα antibody (Cell Signaling, 1:50) and then biotinylated secondary antibody followed by ABC reagent (Vector Laboratories). The samples were stained using immPACT DAB (Vector Laboratories) and counter stained using Mayer’s haematoxylin solution (Sigma).
In tissue microarrays with patient-derived lung tumour samples, immunohistochemistry reactions were performed using a Leica Bond Max automated stainer (Leica Biosystems, Nussloch GmbH). In summary, the NSCLC TMA slides were deparaffinized and hydrated in the Leica Bond autostainer. The primary antibodies used were YAP1 (rabbit monoclonal, clone D8H1X, Cell Signaling Technology, 14074, 1:100). Antigen retrieval was performed using Bond Epitope Retrieval Solution No. 1 (AR9961, Leica Biosystems; equivalent to citrate buffer pH 6.0). The immunohistochemistry reaction was detected using the Bond Polymer Refine Detection (Ref # DS98000, Leica Biosystems) with diaminobenzidine as chromogen for the visualization of the staining. The slides were counterstained with haematoxylin (Leica Biosystems). Formalin-fixed, paraffin-embedded (FFPE) human breast and colon adenocarcinomas were used as positive controls. Non-primary antibody control was also used as an additional control. All TMA slides were stained for YAP1 at the same time with the controls and cell line samples. The stained slides were scanned in an Aperio AT Turbo digital pathology system (Leica Biosystems) for visualization and evaluation. Immunohistochemistry quality control and scoring were performed by two pathologists (P.V. and J.R.C.). The immunohistochemistry scoring system employed was H-score, which evaluated intensity (0 to 3) and percentage of positive tumour cells (0 to 100), with a final scoring ranging from 0 to 300.
The tissue microarrays used in this study comprised 37 surgically resected lung adenocarcinoma tumours. All specimens were collected from the lung cancer tissue bank at The University of Texas M. D. Anderson Cancer Center, which is approved by the M. D. Anderson Institutional Review Board. After histological examination, tissue microarrays were constructed using three 1-mm-diameter cores per tumour. Tissue microarrays were prepared with a semi-automatic tissue arrayer (Veridiam Tissue Arrayer Model VTA-100, Veridiam) using 1 mm diameter cores in triplicate for tumours, as described previously34. Histological sections that were 4 μm in thickness were then prepared for the subsequent immunohistochemical analysis. Clinical and pathological information was obtained for all patients (Supplementary Table 7). Pathological tumour-node-metastasis stage had been determined for lung cancers at the time of primary tumour surgery.
Whole-exome deep sequencing and targeted sanger sequencing
Genomic DNA from NSCLC lines and patient-matched B-cell lines was isolated using DNeasy Blood and Tissue Kits (QIAGEN). Exonic DNA was captured using SureSelect 38MB All Exon Kit (Agilent) following manufacturer’s protocol and sequenced using HySeq 2000 (Illumina) using a paired-end sequencing protocol with reads aligned to the NCBI human genome by Bowtie 0.12.5 as previously described7,35, allowing for up to 2 mismatches per read. Single-nucleotide variants (SNV) were discovered from within the uniquely aligned reads, with at least one mismatch with a Phred quality score greater than 20 and coverage greater than 6 by non-redundant reads. Somatic SNVs were identified by requiring coverage on the variant site by the wild-type allele to be greater than 6 and to be 0 by the mutant allele. A series of filters was used to screen out probable germline mutations from somatic mutations identified in NSCLC cell lines without a matched normal B-cell line. They are as follows: (i) germline variants that were found in the matched dataset were removed; (ii) variants that were found to be present in dbSNP (http://www.ncbi.nlm.nih.gov/SNP/) but not in COSMIC (http://cancer.sanger.ac.uk/cosmic) were removed; (iii) silent, intergenic and untranslated region variants were removed; (iv) variants that were found at a frequency ≥8% in the thousand-genome project were removed; (v) variants in genes that were mutated ≥62 times at any site across the panel were removed; and (vi) variants that were mutated at the same amino acid position in more than 9 cell lines were removed (variants that were found to be ‘hotspots’ in the matched dataset were, however, rescued).
For targeted detection of mutations in FSTL5, genomic DNA was extracted from patient-derived human lung tumour samples and from matched normal tissue. Exons 2–16 were amplified by PCR with HotStarTqa Master Mix kit (Qiagen), purified using USB ExoSAP-IT (Affymetrix) and Sanger-sequenced. For exons that exhibited mixed chromatograms, PCR products were cloned using TOPO TA cloning kit (Invitrogen) and the resulting clones were individually sequenced.
Bicluster analysis
We converted the mutation table to a binary-presence call table in which ‘1’ indicated the presence of a mutation in a cell line and ‘0’ indicated the wild type. We created a biclustering script that searches for every possible permutation of rows (that is, genes) and columns (cell lines) to identify the biggest blocks of 1s in the dataset. In other words, we search for the largest number of mutations that are shared by the largest number of cell lines. We then identified the bicluster that identified mutations that were shared by KRAS-mutant/XPO1-inhibitor-resistant lines that were not present in the KRAS-mutant/XPO1-inhibitor-sensitive lines. This bicluster contained the single gene FSTL5.
Retrospective analysis of shRNA enrichment in HCC
Extended Data Figure 5e was generated from an oncogenomics-based in vivo RNAi screening result19 (Supplementary Table 3). Shown are 36 shRNAs enriched at least 2.5-fold over the predicted representation during HCC tumour development.
Extended Data
Extended Data Figure 1. Two-dimensional APC projection of 106 NSCLC lines based on whole-genome mRNA expression variation.
High-resolution, annotated version of Fig. 1a.
Extended Data Figure 2. Synthetic-lethal genetic interactions in KRAS-mutant NSCLC cells.
a, Distribution of the variation in mRNA expression among KRAS-mutant lines (red curve, n = 37), KRAS-wild-type lines (blue curve, n = 69) and all NSCLC lines (green curve). b, Top-ranked gene sets (FDR <0.2, Kolmogorov–Smirnov P <1 ×10⁻¹⁶) returned by functional GSEA. c, Genes present in leading edge gene representation among the gene sets in b. Known components of nuclear transport machinery (indicated in d) are labelled in blue. d, Biological process representation of the leading-edge synthetic-lethal gene-depletion targets. e, Cumulative distributions of the viability Z-scores for siRNA pools, targeting genes in d, among KRAS-mutant versus KRAS-wild-type cell lines. Kolmogorov–Smirnov test P value is indicated. f, Cumulative distributions of log2 difference scores for depletion of shRNAs in KRAS-mutant versus KRAS-wild-type cells. Red, shRNAs targeting genes encoding nuclear transport machinery from e; black, all other shRNAs. Kolmogorov–Smirnov test P value is indicated. Data obtained from a previous study3. g, Cell viability after UBB depletion (a broadly toxic siRNA target that serves as a positive transfection control) in KRAS-mutant versus wild-type lines. Unpaired t-test was used for the comparison. h, Rescue of XPO1 siRNA toxicity by ectopic expression of a mutant XPO1 cDNA designed to be resistant to XPO1 siRNA number 4. Lamin A/C is shown as a loading control.
Extended Data Figure 3. Selective sensitivity of KRAS-mutant NSCLC cells to chemical inhibition of the nuclear transport receptor XPO1.
a, Structures of SINE compounds (XPO1 inhibitors), KPT-185 and KPT-330. b, Enrichment of short doubling times in KRAS-mutant versus wild-type NSCLC lines. Box plots indicate median and IQR. Unpaired t-test was used for the comparison. c, The 8-point dose–response viability curves for the indicated panel of NSCLC lines following a 72-h exposure to KPT-185. Mean ± s.d. (n = 3) is shown. d, Correlation of sensitivity to the XPO1 inhibitors KPT-330 and KPT-185. AUCs from c and Fig. 2a. Red, KRAS mutant; blue, KRAS wild type. Pearson correlation P value is indicated. e, Response of KRAS-mutant versus KRAS-wild-type cohorts to XPO1 inhibitors. Box plots indicate median values and IQR, an unpaired t-test was used for the comparison. f, Scatter plot of cell-line doubling time versus KPT-185 sensitivity. Pearson correlation P value is indicated. g, Sequencing chromatogram of XPO1 genomic DNA of genome-edited cells. The C528S substitution was induced by CRISPR/Cas9-induced homologous recombination. Three synonymous mutations were simultaneously introduced near the PAM site (underlined) in order to prevent re-cutting of the recombined DNA. h, Selective sensitivity of KRAS-mutant lines to KPT-330 at doses over 400% higher than bioactive in vivo concentrations. Post-confluent cells were exposed to KPT-330 for 5 days. i, Response of KRASG12V-expressing lung epithelia (HBEC30KP), versus wild-type parental epithelia (HBEC30), to KPT-185 and KPT-330. Left, mean ± s.d., n = 3; right, monolayer assay is as in h. j, Cytotoxic effect of 2 μM KPT-330 on the indicated NRAS-mutant cell lines. Monolayer assay is as in h. k, Lung tumour burden pre- and post-treatment as indicated by magnetic resonance images. Two mice presenting with exceptionally high initial tumour burden were treated with 10 mg kg−1 KPT-330 five times per week. Lungs were imaged with serial transverse magnetic resonance sections on treatment day 0 and again on day 21.
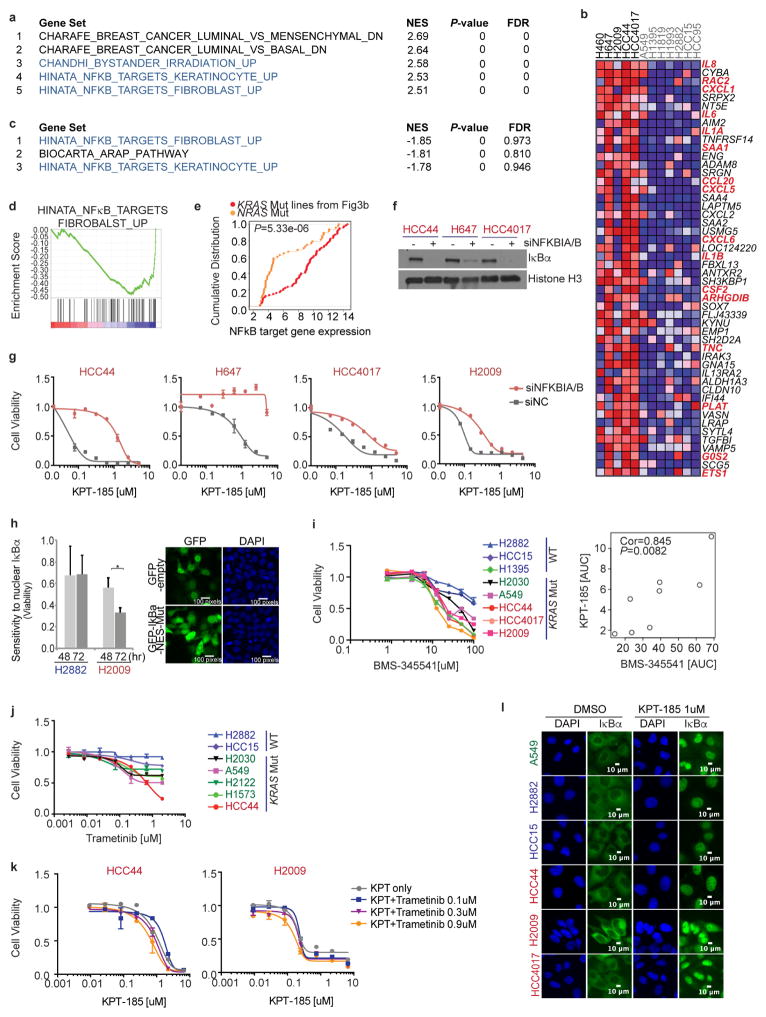
Extended Data Figure 4. Selective addiction to NFκB activity specifies sensitivity to XPO1 inhibition.
a, Top five gene sets that significantly discriminate XPO1-inhibitor-sensitive lines from XPO1-inhibitor-resistant lines. NFκB target gene sets are indicated in blue. b, Top 50 differentially expressed genes ranked by signal-to-noise (S2N) ratio. Known NFκB targets are indicated in red (16/133; hypergeometric P <1 ×10⁻¹⁶). c, Top 3 gene sets that are downregulated by a 12-h exposure to an XPO1 inhibitor. NFκB target gene sets are indicated in blue. d, Enrichment plot of NFκB target genes (KPT-185-treated versus DMSO-treated). e, Evidence for attenuated NFκB signalling in XPO1-inhibitor-resistant NRAS-mutant cell lines. Empirical cumulative distributions of NFκB target gene expression (from b) are shown for NRAS-mutant cell lines versus KRAS-mutant cell lines as indicated. Yellow, NRAS-mutant/XPO1-inhibitor-resistant lines (H2087, H1299 and HCC1195, shown in Extended Data Fig. 3j); red, KRAS-mutant/XPO1-inhibitor-sensitive line (shown in Figs 2, 3). Yellow versus red, P < 0.01 using Kolmogorov–Smirnov test. f, Immunoblot of IκBα 48 h post-transfection of siNFKBIA/siNFKBIB (targeting genes that express IκBα/IκBβ) for confirmation of target depletion. Histone H3 is shown as a loading control. g, IκB-dependent sensitivity to KPT-185. Cells were exposed to the indicated concentrations of XPO1 inhibitors for 72 h 24 h post-transfection with the indicated siRNA. Mean and range (n = 2). h, Intolerance to ectopic nuclear accumulation of IκBα in XPO1-inhibitor-sensitive cells. Left, y axis indicates fold change in the percentage of GFP-positive nuclei of GFP-IκB-NES-mutant-positive cells normalized to GFP-empty-vector-positive cells. Bars indicate mean ± s.d. for three independent experiments (*P <0.05, Unpaired t-test). Right, 293T cells transfected with the indicated plasmids to confirm plasmid transfection efficiency and localization of ectopically expressed proteins. Cells were fixed and photographed 48 h post-transfection. i, Positive correlation between sensitivity to KPT-185 and BMS-345541 (P <0.01, Pearson correlation). Dose–response curves of a panel of NSCLC lines following a 72-h exposure to BMS-345541. Mean ± s.d. (n = 3). AUCs of KPT-185 were determined from Extended Data Fig. 3c. Red labels, KRAS mutant/XPO1-inhibitor sensitive; green labels, KRAS mutant/XPO1-inhibitor resistant; blue labels, KRAS wild type. j, Dose–response curves of a panel of NSCLC lines following a 72-h exposure to Trametinib. Mean and range (n = 2). Label colours as in i. k, Dose–response curves of a panel of NSCLC lines following a 72-h exposure to KPT-185 combined with the indicated concentrations of Trametinib. Mean and range (n = 2). l, Subcellular localization of IκBα in the presence of 1 μM KPT-185. Cells were exposed to KPT-185 for 24 h. Label colours are as in i.
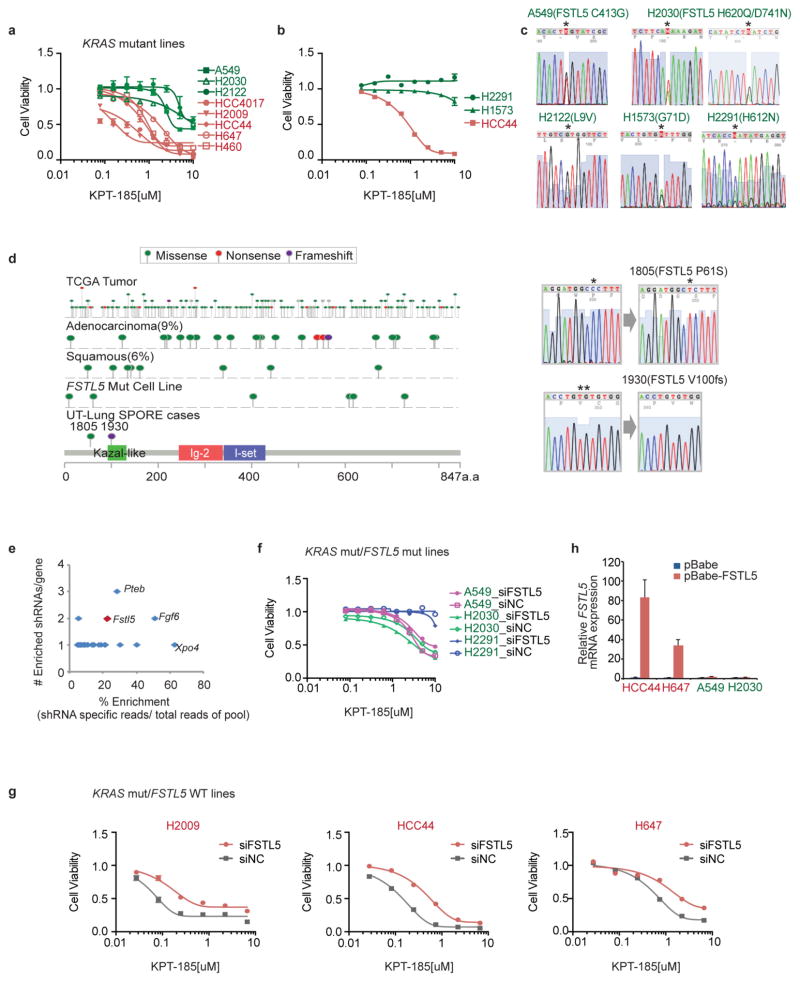
Extended Data Figure 5. Concurrent mutations in FSTL5 are associated with intrinsic resistance of KRAS-mutant lines to XPO1 inhibitor.
a, Eight-point dose–response viability curves for H2122 and H2030 following a 72-h exposure to KPT-185. Mean ± s.d. (n = 3). Data are overlaid with responses of the indicated lines from Extended Data Fig. 3c for comparison. b, KPT-185 dose–response curves. Mean ± s.d. (n = 3). c, FSTL5 Sanger-sequencing chromatograms of detected FSTL5 variants in the indicated cell lines. d, Map of somatic alterations in FSTL5 detected in all cancers (TCGA), lung adenocarcinoma (TCGA), lung squamous (TCGA), NSCLC cell lines (this study), and human lung tumour samples, 1805 and 1930 (this study). e, Tumour suppressor genes identified in an oncogenomics-based in vivo RNAi screen19. Among the genes targeted by 36 shRNAs overrepresented during HCC tumour development, Fstl5 was the third ranked gene suppressed by >1 enriched shRNA. The y axis indicates number of shRNAs per gene among the 36 enriched shRNAs. The x axis indicates shRNA specific reads over a total 2,307 sequence reads. f, g, KPT-185 dose–response of cells transfected with the indicated siRNAs as in Extended Data Fig. 4g. f shows KRAS-mutant/FSTL5-wild-type lines, g shows KRAS-mutant/FSTL5 mutant lines. Mean and range (n = 2). h, Relative ectopic expression of FSTL5 mRNA. Cells were infected with retrovirus carrying the indicated plasmids. Following a 7-day puromycin selection, cells were collected for qPCR. Mean and range (n = 2).
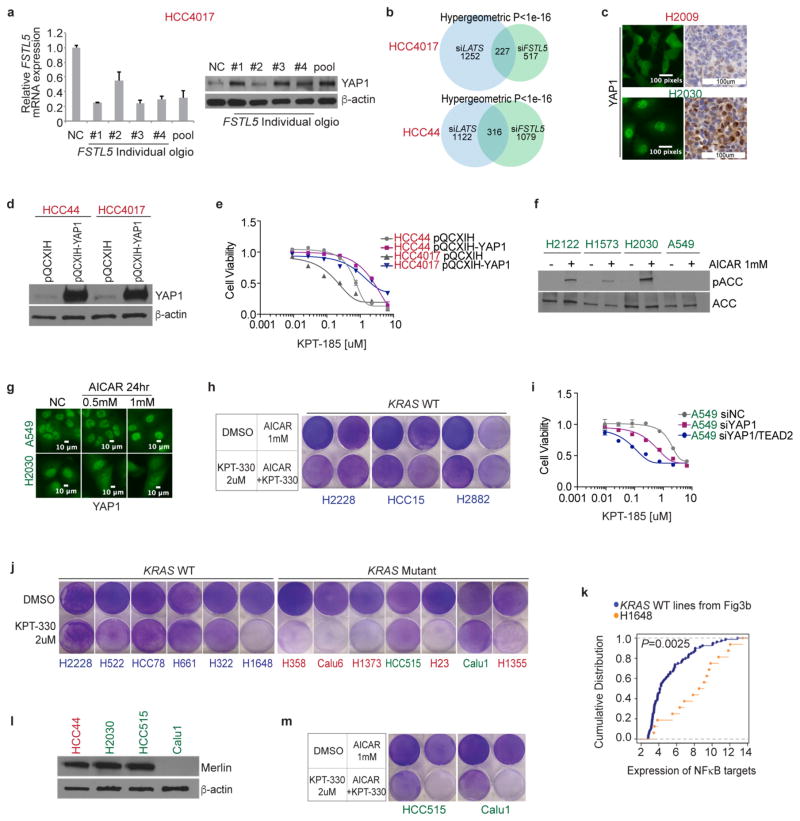
Extended Data Figure 6. Concurrent mutations in FSTL5 are mechanistically coupled to YAP1 activation.
a, Expression of FSTL5 mRNA (left) and YAP1 protein (right) following transfection with the indicated siRNAs targeting FSTL5. Cells were collected 72 h post-transfection for parallel qPCR and immunoblotting. Mean and range (n = 2). b, Intersection of the FSTL5-dependent and LATS-dependent gene expression programs in KRAS-mutant/XPO1-inhibitor-sensitive NSCLC lines. To evaluate the enrichment of YAP-responsive genes within the FSTL5-dependent gene expression network, quantitative whole-genome transcript arrays were prepared with mRNA isolated from the indicated cell lines treated with the indicated siRNAs 72 h post-transfection. LATS1/2 depletion was used to activate YAP-dependent gene expression. All arrays were normalized to corresponding control siRNA-treated samples. Euler plots indicate genes up- or downregulated at least twofold in response to siFSTL5, siLATS or both; hypergeometric P values are indicated. c, YAP1 fluorescence micrographs and representative YAP1 immunohistochemistry. H2009 and H2030 cell lines were used as a negative and positive control for YAP1 staining, respectively. d, Stably overexpressed YAP1 in KRAS-mutant/XPO1-inhibitor-sensitive lines. Cells were infected with the indicated retroviral vector, selected with hygromycin and then collected for immunoblotting. e, Induction of XPO1-inhibitor resistance by YAP1 overexpression. Proliferating cells stably expressing indicated plasmids were exposed to XPO1 inhibitors for 3 days. Mean ± range (n = 2). f, Immunoblot of the indicated proteins in KRAS-mutant/XPO1-inhibitor-resistant lines following a 24-h exposure to 1 mM AICAR. AICAR resulted in accumulation of phospho-acetyl-CoA-carboxlyase (pACC), an indicator of AMPK activation in all the lines tested except A549. A549 is known to be non-responsive to AICAR owing to the absence of LKB1 (also known as STK11) expression7. g, Subcellular localization of YAP1 in response to 0.5 or 1 mM AICAR. Cells were exposed to AICAR for 24 h. Cytoplasmic accumulation of YAP1 was observed in response to AICAR exposure in H2030, but not in A549. h, Resistance of KRAS-wild-type lines to KPT-330 in combination with AICAR. Post-confluent cells were exposed to the indicated compounds for 3 days. i, Induction of XPO1 inhibitor-sensitivity by YAP1 and TEAD2 depletion. 48 h post-transfection with the indicated siRNAs, cells were exposed to the indicated concentrations of XPO1 inhibitors for 3 days. Mean and range (n = 2). j, Cytotoxic effect of 2 μM KPT-330 on indicated cell lines. Post-confluent cells were exposed to KPT-330 for 5 days. Red labels, KRAS-mutant/XPO1-inhibitor-sensitive; green labels, KRAS-mutant/XPO1-inhibitor-resistant; blue labels, KRAS wild type. k, Evidence for NFκB pathway activation in H1648 cells. Empirical cumulative distributions of NFκB target gene expression (from Extended Data Fig. 4b) are shown for H1648 versus KRAS-wild-type cell lines as indicated. Blue, KRAS-wild-type/XPO1-inhibitor-resistant lines (H2882, HCC15, H1395, H1993 and HCC95 shown in Figs 2 and 3); yellow, KRAS-wild-type/XPO1-inhibitor-sensitive line H1648 (shown in j). Cancer Cell Line Encyclopedia data indicates that H1648 harbours genomic amplification of IKBKB. Blue versus yellow, P <0.01, Kolmogorov–Smirnov test. l, Merlin expression is absent in Calu1 cells. m, Cytotoxic effect of the indicated compounds on the indicated cell lines. Post-confluent cells were treated as in h. HCC515 harbours a somatic mutation in LATS1.
Acknowledgments
We thank J. Luo for sharing primary data; C. Marcireau for sharing information on merlin expression status in NSCLC lines; C. Xian, S. Zhang, B. Massant, and L.Bral for technical support. This work was supported by grants from the NCI, CPRIT and UT-Lung SPORE.
Footnotes
Online Content Methods, along with any additional Extended Data display items and Source Data, are available in the online version of the paper; references unique to these sections appear only in the online paper.
Supplementary Information is available in the online version of the paper.
Author Contributions J.K. and M.A.W. designed the experiments. J.K. performed the experiments with assistance from G.M. E.M. and H.S.K. performed bioinformatic analysis. H.S.K., S.M., S.W., M.R. and B.A.P. conducted the siRNA screen. N.V., P.P.S., B.G. and J.D.M aided preclinical mouse models. R.E.F. and J.D.M. provided the cell doubling times. J.R.-C., P.V., C.-W.B.C. and I.I.W. aided clinical studies. Y.L., W.S. and E.B. provided KPT compounds, advice and bioanalytical data for KPT-330 in mouse plasma. J.E.N. and D.D. generated XPO1C528 cells. J.K. and M.A.W. wrote the manuscript.
Reviewer Information Nature thanks I. Macara, A. Vivancos and the other anonymous reviewer(s) for their contribution to the peer review of this work.
The authors declare no competing financial interests. Readers are welcome to comment on the online version of the paper.
Supplementary Material
References
- 1.Cox AD, Fesik SW, Kimmelman AC, Luo J, Der CJ. Drugging the undruggable RAS: mission possible? Nat Rev Drug Discov. 2014;13:828–851. doi: 10.1038/nrd4389. [DOI] [PMC free article] [PubMed] [Google Scholar]
- 2.Barbie DA, et al. Systematic RNA interference reveals that oncogenic KRAS-driven cancers require TBK1. Nature. 2009;462:108–112. doi: 10.1038/nature08460. [DOI] [PMC free article] [PubMed] [Google Scholar]
- 3.Luo J, et al. A genome-wide RNAi screen identifies multiple synthetic lethal interactions with the RAS oncogene. Cell. 2009;137:835–848. doi: 10.1016/j.cell.2009.05.006. [DOI] [PMC free article] [PubMed] [Google Scholar]
- 4.Kumar MS, et al. The GATA2 transcriptional network is requisite for RAS oncogene-driven non-small cell lung cancer. Cell. 2012;149:642–655. doi: 10.1016/j.cell.2012.02.059. [DOI] [PubMed] [Google Scholar]
- 5.Scholl C, et al. Synthetic lethal interaction between oncogenic KRAS dependency and STK33 suppression in human cancer cells. Cell. 2009;137:821–834. doi: 10.1016/j.cell.2009.03.017. [DOI] [PubMed] [Google Scholar]
- 6.Frey BJ, Dueck D. Clustering by passing messages between data points. Science. 2007;315:972–976. doi: 10.1126/science.1136800. [DOI] [PubMed] [Google Scholar]
- 7.Kim HS, et al. Systematic identification of molecular subtype-selective vulnerabilities in non-small-cell lung cancer. Cell. 2013;155:552–566. doi: 10.1016/j.cell.2013.09.041. [DOI] [PMC free article] [PubMed] [Google Scholar]
- 8.Whitehurst AW, et al. Synthetic lethal screen identification of chemosensitizer loci in cancer cells. Nature. 2007;446:815–819. doi: 10.1038/nature05697. [DOI] [PubMed] [Google Scholar]
- 9.Jackson AL, et al. Widespread siRNA “off-target” transcript silencing mediated by seed region sequence complementarity. RNA. 2006;12:1179–1187. doi: 10.1261/rna.25706. [DOI] [PMC free article] [PubMed] [Google Scholar]
- 10.Etchin J, et al. KPT-330 inhibitor of CRM1 (XPO1)-mediated nuclear export has selective anti-leukaemic activity in preclinical models of T-cell acute lymphoblastic leukaemia and acute myeloid leukaemia. Br J Haematol. 2013;161:117–127. doi: 10.1111/bjh.12231. [DOI] [PMC free article] [PubMed] [Google Scholar]
- 11.Lapalombella R, et al. Selective inhibitors of nuclear export show that CRM1/XPO1 is a target in chronic lymphocytic leukemia. Blood. 2012;120:4621–4634. doi: 10.1182/blood-2012-05-429506. [DOI] [PMC free article] [PubMed] [Google Scholar]
- 12.Neggers JE, et al. Identifying drug-target selectivity of small-molecule CRM1/XPO1 inhibitors by CRISPR/Cas9 genome editing. Chem Biol. 2015;22:107–116. doi: 10.1016/j.chembiol.2014.11.015. [DOI] [PubMed] [Google Scholar]
- 13.Abdul Razak AR, et al. First-in-class, first-in-human phase I study of selinexor, a selective inhibitor of nuclear export, in patients with advanced solid tumors. J Clin Oncol. 2016 doi: 10.1200/JCO.2015.65.3949. http://dx.doi.org/10.1200/JCO.2015.65.3949. [DOI] [PMC free article] [PubMed]
- 14.Cheng Y, et al. XPO1 (CRM1) inhibition represses STAT3 activation to drive a survivin-dependent oncogenic switch in triple-negative breast cancer. Mol Cancer Ther. 2014;13:675–686. doi: 10.1158/1535-7163.MCT-13-0416. [DOI] [PMC free article] [PubMed] [Google Scholar]
- 15.Meylan E, et al. Requirement for NF-κB signalling in a mouse model of lung adenocarcinoma. Nature. 2009;462:104–107. doi: 10.1038/nature08462. [DOI] [PMC free article] [PubMed] [Google Scholar]
- 16.Bassères DS, Ebbs A, Cogswell PC, Baldwin AS. IKK is a therapeutic target in KRAS-induced lung cancer with disrupted p53 activity. Genes Cancer. 2014;5:41–55. doi: 10.18632/genesandcancer.5. [DOI] [PMC free article] [PubMed] [Google Scholar]
- 17.Wuerzberger-Davis SM, et al. Nuclear export of the NF-κB inhibitor IκBα is required for proper B cell and secondary lymphoid tissue formation. Immunity. 2011;34:188–200. doi: 10.1016/j.immuni.2011.01.014. [DOI] [PMC free article] [PubMed] [Google Scholar]
- 18.Burke JR, et al. BMS-345541 is a highly selective inhibitor of IκB kinase that binds at an allosteric site of the enzyme and blocks NF-κB-dependent transcription in mice. J Biol Chem. 2003;278:1450–1456. doi: 10.1074/jbc.M209677200. [DOI] [PubMed] [Google Scholar]
- 19.Zender L, et al. An oncogenomics-based in vivo RNAi screen identifies tumor suppressors in liver cancer. Cell. 2008;135:852–864. doi: 10.1016/j.cell.2008.09.061. [DOI] [PMC free article] [PubMed] [Google Scholar]
- 20.Fitamant J, et al. YAP inhibition restores hepatocyte differentiation in advanced HCC, leading to tumor regression. Cell Rep. 2015;10:1692–1707. doi: 10.1016/j.celrep.2015.02.027. [DOI] [PMC free article] [PubMed] [Google Scholar]
- 21.Kapoor A, et al. YAP1 activation enables bypass of oncogenic KRAS addiction in pancreatic cancer. Cell. 2014;158:185–197. doi: 10.1016/j.cell.2014.06.003. [DOI] [PMC free article] [PubMed] [Google Scholar]
- 22.Lin L, et al. The Hippo effector YAP promotes resistance to RAF- and MEK-targeted cancer therapies. Nat Genet. 2015;47:250–256. doi: 10.1038/ng.3218. [DOI] [PMC free article] [PubMed] [Google Scholar]
- 23.Shao DD, et al. KRAS and YAP1 converge to regulate EMT and tumor survival. Cell. 2014;158:171–184. doi: 10.1016/j.cell.2014.06.004. [DOI] [PMC free article] [PubMed] [Google Scholar]
- 24.Yu FX, Zhao B, Guan KL. Hippo pathway in organ size control, tissue homeostasis, and cancer. Cell. 2015;163:811–828. doi: 10.1016/j.cell.2015.10.044. [DOI] [PMC free article] [PubMed] [Google Scholar]
- 25.Mo JS, et al. Cellular energy stress induces AMPK-mediated regulation of YAP and the Hippo pathway. Nat Cell Biol. 2015;17:500–510. doi: 10.1038/ncb3111. [DOI] [PMC free article] [PubMed] [Google Scholar]
- 26.Singh NK, Seo BY, Vidyasagar M, White MA, Kim HS. siMacro: a fast and easy data processing tool for cell-based genomewide siRNA screens. Genomics Inform. 2013;11:55–57. doi: 10.5808/GI.2013.11.1.55. [DOI] [PMC free article] [PubMed] [Google Scholar]
- 27.Shigematsu H, et al. Somatic mutations of the HER2 kinase domain in lung adenocarcinomas. Cancer Res. 2005;65:1642–1646. doi: 10.1158/0008-5472.CAN-04-4235. [DOI] [PubMed] [Google Scholar]
- 28.Yamamoto H, et al. PIK3CA mutations and copy number gains in human lung cancers. Cancer Res. 2008;68:6913–6921. doi: 10.1158/0008-5472.CAN-07-5084. [DOI] [PMC free article] [PubMed] [Google Scholar]
- 29.Phelps RM, et al. NCI-Navy Medical Oncology Branch cell line data base. J Cell Biochem Suppl. 1996;24:32–91. doi: 10.1002/jcb.240630505. [DOI] [PubMed] [Google Scholar]
- 30.Shigematsu H, et al. Clinical and biological features associated with epidermal growth factor receptor gene mutations in lung cancers. J Natl Cancer Inst. 2005;97:339–346. doi: 10.1093/jnci/dji055. [DOI] [PubMed] [Google Scholar]
- 31.Shannon P, et al. Cytoscape: a software environment for integrated models of biomolecular interaction networks. Genome Res. 2003;13:2498–2504. doi: 10.1101/gr.1239303. [DOI] [PMC free article] [PubMed] [Google Scholar]
- 32.Bruckova L, et al. Proliferative potential and phenotypic analysis of long-term cultivated human granulosa cells initiated by addition of follicular fluid. J Assist Reprod Genet. 2011;28:939–950. doi: 10.1007/s10815-011-9617-6. [DOI] [PMC free article] [PubMed] [Google Scholar]
- 33.DuPage M, Dooley AL, Jacks T. Conditional mouse lung cancer models using adenoviral or lentiviral delivery of Cre recombinase. Nat Protocols. 2009;4:1064–1072. doi: 10.1038/nprot.2009.95. [DOI] [PMC free article] [PubMed] [Google Scholar]
- 34.Sun M, et al. HER family receptor abnormalities in lung cancer brain metastases and corresponding primary tumors. Clin Cancer Res. 2009;15:4829–4837. doi: 10.1158/1078-0432.CCR-08-2921. [DOI] [PMC free article] [PubMed] [Google Scholar]
- 35.Langmead B, Trapnell C, Pop M, Salzberg SL. Ultrafast and memory-efficient alignment of short DNA sequences to the human genome. Genome Biol. 2009;10:R25. doi: 10.1186/gb-2009-10-3-r25. [DOI] [PMC free article] [PubMed] [Google Scholar]
Associated Data
This section collects any data citations, data availability statements, or supplementary materials included in this article.


