Abstract
Estuarine ecosystems have changed dramatically from centuries of fishing, habitat disturbance, sedimentation, and nutrient loading. Degradation of oyster reefs by destructive fishing practices in particular has had a profound effect on estuarine ecology, yet the timing and magnitude of oyster-reef degradation in estuaries is poorly quantified. Here, I evaluate the expansion and collapse of oyster fisheries in 28 estuaries along three continental margins through the analysis of historical proxies derived from fishery records to infer when oyster reefs were degraded. Exploitation for oysters did not occur randomly along continental margins but followed a predictable pattern. Oyster fisheries expanded and collapsed in a linear sequence along eastern North America (Crassostrea virginica), western North America (Ostreola conchaphila), and eastern Australia (Saccostrea glomerata). Fishery collapse began in the estuaries that were nearest to a developing urban center before exploitation began to spread down the coast. As each successive fishery collapsed, oysters from more distant estuaries were fished and transported to restock exploited estuaries near the original urban center. This moving wave of exploitation traveled along each coastline until the most distant estuary had been reached and overfished.
Biogenic reefs containing aggregations of oysters, sponges, tunicates, and other suspension feeders are vital components of estuarine ecosystems. Suspension feeders suppress the accumulation of organic matter in shallow estuaries by consuming phytoplankton (1-3). Although these reefs may be several kilometers in length and tens of meters in height (4-6), they are degraded easily by destructive fishing practices, particularly from bottom dredging (7, 8). Degradation of this suspension-feeding reef community inhibits effective removal of organic matter from the water column, which may predispose estuaries to increased hypoxia, harmful algal blooms, outbreaks of parasitic diseases, and other symptoms of environmental deterioration (2, 9, 10). Despite the importance to estuarine ecology of this suspension-feeding community, the long-term history of reef degradation is poorly known for most estuaries. This study examines historical fishery records to infer when oyster reefs were degraded in North American and Australian estuaries.
Methods
I examined the history of exploitation of oyster reefs in 28 estuaries from the following three continental margins: eastern North America, western North America, and eastern Australia. The history of exploitation along each continental margin was reconstructed by using proxies derived from fishery records. Proxies are measurable descriptors that “stand in” for desired but unobservable phenomena (11). Because direct measurement of past phenomena is impossible, proxies are measured instead. Because each continental margin provides an approximate north-south geographic gradient, the timing of each proxy can be compared spatially. I used four proxies to infer reef degradation in each estuary. The use of multiple proxies to infer a single phenomenon allows replication and greatly increases their reliability (10, 11). First, the earliest law regulating each oyster fishery indicates when local governments first became concerned enough about actual or potentially declining oyster populations to enact laws prohibiting bottom dredging, year-round fishing, fishing by nonlocal people, or the burning of oyster shells for lime. For instance, in 1658 it was written that “the Director General and Council of New Netherland against... dredging Oyster shells on Manhattan Island... interdict and forbid all persons from continuing to dig or dredge any Oyster shells on the East River or on the North River, between this City and the Fresh Water” (12). In another example from eastern North America, local lawmakers near Great South Bay on Long Island passed the following law in 1679: “Oysters: To prevent the destruction of oysters in South Bay, by the unlimited number of vessels used in the same, it is ordered that but ten vessels shall be allowed, and that each half-barrel tub shall be paid for at the rate of 2d., according to the town act of Brookhaven.” (13). Although these early laws had little effect in preventing the ultimate degradation of oyster reefs, they do suggest when reef degradation first became noticeable to lawmakers. Second, the beginning of the importation of juvenile or adult oysters to restock estuaries indicates when endemic populations of oysters no longer supplied enough oysters to maintain the local fishery or to satisfy local demand. For example, Connecticut and New York were importing juvenile Crassostrea virginica from Delaware and Chesapeake bays to “seed” their estuaries as early as 1808 (14), which is consistent with independent historical observations of degraded reefs in the late 1700s and early 1800s (13). Third, time series of oyster landings (the total weight of oysters brought onshore per year) indicates when fishery collapse occurred because landings data commonly show a rapid rise to a maximum value, followed by a rapid decrease. This “peak in landings” serves as an easily recognizable proxy for fishery collapse and reef degradation. Fourth, the earliest evidence for bottom dredging in each estuary indicates the occurrence of reef degradation. Of all of the various fishing methods used, bottom dredging was the most destructive. Dredging actively erodes oyster reefs such that reef height is lowered substantially and remnants of the reef are scattered over a broad geographic area (8, 15). Two animation movies created in flash 5.0 (Macromedia, San Francisco) were constructed from landings data derived from each state between Maine and Texas along eastern North America (16) (U.S. National Marine Fisheries Service, available at www.st.nmfs.gov). Each frame in the animations represents a year between 1880 and 2000.
Results
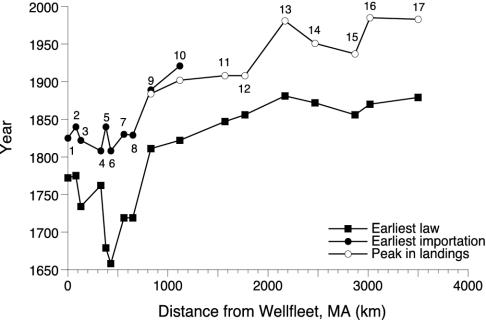
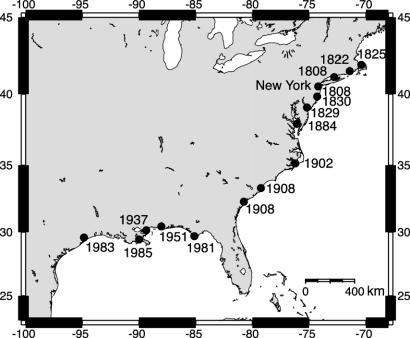
Eastern North America, western North America, and eastern Australia show a similar pattern of fishery expansion and collapse that began with European colonization and spread from a developing urban center (Table 1). Eastern North America has the longest history of European exploitation, with commercial fishing of the eastern oyster C. virginica (Gmelin) starting in the Hudson River Estuary in the early 1600s (13). Historical proxies derived from fishery records indicate that exploitation traveled from north to south along the North American coastline (Fig. 1). Between New York and Texas, the date of each proxy is significantly correlated with distance from New York (earliest laws: R2 = 0.68, P = 0.001; earliest seeding: R2 = 0.95, P = 0.0047; and peak in landings: R2 = 0.74, P = 0.0028). Dates of the earliest laws and imported oysters are also significantly correlated (R2 = 0.69, P = 0.0235) as are dates of the earliest laws and peak in landings (R2 = 0.89, P = 0.0004). Fisheries of endemic C. virginica in New England and New York collapsed by the early 19th century, whereas fisheries to the south collapsed through the 19th and 20th centuries (Fig. 2). As each fishery collapsed, C. virginica from more southern estuaries was transported northward to replenish overfished northern estuaries, until southern estuaries were also overfished, as evident in contemporaneous fishery reports (13, 17-19).
Table 1. Continental margins showing sequential exploitation of oyster populations.
| Location | Species exploited | Urban center | Nearest fishery | Start of fishery1 | Collapse of fishery1 | Most distant fishery | Start of fishery2 | Collapse of fishery2 |
|---|---|---|---|---|---|---|---|---|
| Eastern North America | C. virginica | New York | Hudson River | 1600s | Early 1800s | Texas | 1860s | late 1900s? |
| Western North America | O. conchaphila | San Francisco | San Francisco Bay | 1840s | 1850s | Puget Sound | 1851 | 1890-1920 |
| Eastern Australia | S. glomerata | Sydney | Botany Bay | 1788 | 1860-1870 | Great Sandy Strait | 1880s | 1900-1910 |
1, Nearest fishery to urban center; 2, farthest fishery from urban center.
Fig. 1.
Timing of historical proxies for exploitation of oyster reefs in estuaries along eastern North America plotted against distance from Wellfleet Harbor, MA. Proxies for exploitation include the earliest laws regulating each oyster fishery (▪), earliest importation of seed oysters from other estuaries (•), and peak in oyster landings (○). Numbers refer to specific estuaries or regions with multiple estuaries. 1, Wellfleet Harbor; 2, Buzzard's Bay; 3, Narragansett Bay; 4, Long Island Sound; 5, Great South Bay; 6, Hudson River Estuary; 7, Barnegat Bay; 8, Delaware Bay; 9, Chesapeake Bay; 10, Pamlico Estuary; 11, South Carolina; 12, Georgia; 13, Apalachicola Bay; 14, Mobile Bay; 15, Mississippi Sound; 16, Mississippi Delta; 17, Galveston Bay.
Fig. 2.
Map showing linear expansion of exploitation of oyster reefs along eastern North America. Individual estuaries are labeled with the earliest date for reef degradation, as derived from landings data (peak in landings), earliest importation of nonendemic oysters to restock each estuary, and earliest use of dredges. The major urban center driving this exploitation is shown.
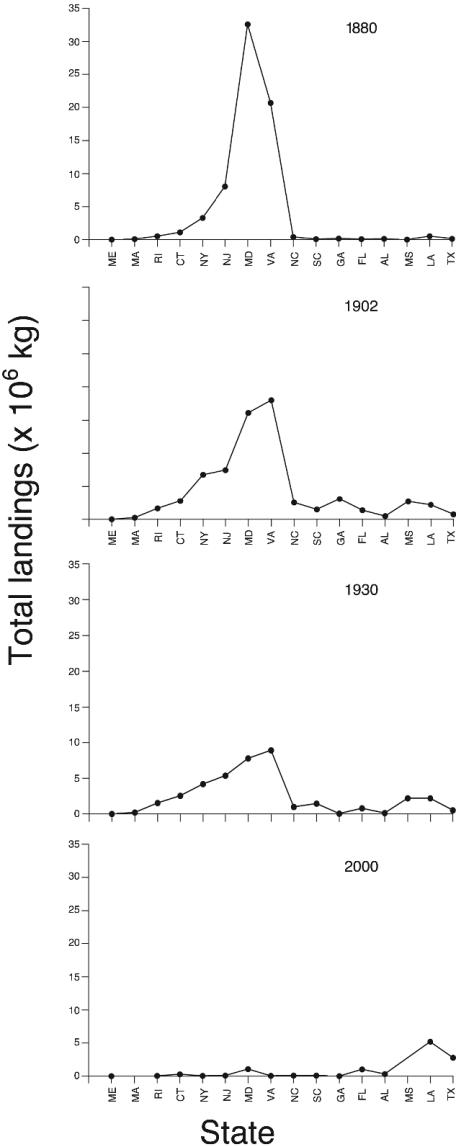
Two animations of oyster landings assembled along a coastal gradient further illustrate the historical pattern of exploitation along eastern North America. The first animation shows the north-south pattern of exploitation in each state between Maine and Texas (see Movie 1, which is published as supporting information on the PNAS web site). Landings from the Chesapeake Bay (Maryland and Virginia) are an order of magnitude greater than any other estuary in 1880, which confirms the vastness of the oyster population inhabiting reefs in this estuary (Fig. 3). Landings are left-skewed north of Chesapeake Bay, which is consistent with the known history of importation of “seed” oysters from Chesapeake Bay to restock northern estuaries (13, 17-19). Landings south of Chesapeake Bay are flat until after 1889, indicating little exploitation from northern urban centers before this time. After 1889, as landings were declining in Chesapeake Bay, landings began to increase successively in each state to the south (Fig. 3). This moving wave of exploitation traveled along the coastline from Maryland to Texas in 1889-1918, as apparent in an animation of landings normalized to the highest peak in each state fishery (see Movie 2, which is published as supporting information on the PNAS web site). Fisheries in the mid-Atlantic (Maryland to Georgia) were at their peak in 1880-1939, whereas fisheries in the Gulf of Mexico were at their lowest during this period (t test, P < 0.0001; Movie 2). The reverse is the case in 1940-2000, when mid-Atlantic fisheries were at their lowest, and Gulf fisheries were at their highest (t test, P < 0.0001). By 2000, the largest landings were in the Gulf of Mexico (Fig. 3; Movie 1), where estuaries from western Florida to Texas contributed 83% of the C. virginica that was produced in the United States (U.S. National Marine Fisheries Service, www.st.nmfs.gov). Despite this geographic shift in exploitation, total landings from the Gulf of Mexico in 2000 were only one-sixth of the size of landings from Chesapeake Bay in 1880 (Fig. 3). Landings from Chesapeake Bay in 2000 were only 1/50 the size of landings in 1880.
Fig. 3.
Landings of C. virginica, showing linear sequence of fishery expansion and decline along eastern North America between Maine and Texas. These four frames are taken from Movie 1.
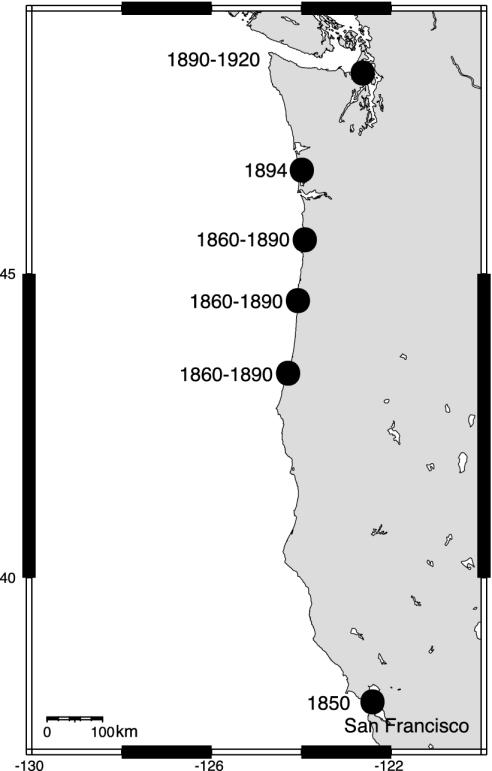
Historical data are fewer for the other coastlines, but a similar pattern of exploitation is apparent. In western North America, commercial fishing for the Olympic oyster Ostreola conchaphila (Carpenter) first began in the San Francisco Bay in the early 19th century (Fig. 4) (20). With the beginning of the California Gold Rush in 1849, oyster reefs in the bay were rapidly overfished (21). Additional O. conchaphila was imported from estuaries to the north, first from Oregon (Yaquina, Tillamook, Netarts, and Coos Bays) and then from Washington (Willapa Bay and Puget Sound) in 1850-1879 (20, 22). A high percentage of imported O. conchaphila was transplanted onto oyster reefs in the San Francisco Bay (20, 22, 23). Importation of C. virginica from eastern North America by transcontinental railroad beginning in 1869 quickly supplanted O. conchaphila as the preferred oyster (22). Importation of C. virginica, however, did not halt further overfishing of endemic O. conchaphila, whose reefs in Washington estuaries were depleted and degraded by 1920 (21, 24, 25).
Fig. 4.
Map showing linear expansion of exploitation of oyster reefs along western North America. Individual estuaries are labeled with the earliest date for reef degradation, as derived from landings data (peak in landings), earliest importation of nonendemic oysters to restock each estuary, and earliest use of dredges. The major urban center driving this exploitation is shown.
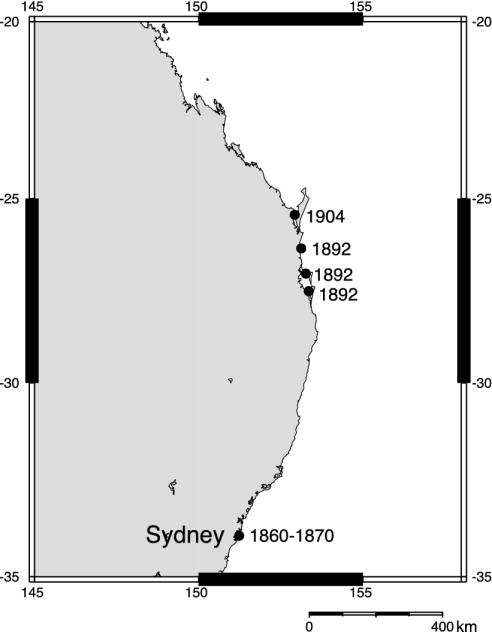
In eastern Australia, commercial fishing for the rock oyster Saccostrea glomerata (Gould) began in Botany Bay near Sydney in the late 1700s, with the European settlement of New South Wales (26). A rapidly increasing population of European settlers quickly overfished both intertidal and subtidal reefs for consumption and as a source of lime (26, 27). After fisheries in New South Wales had collapsed by the 1860s (Fig. 5), S. glomerata began to be imported from oyster reefs in Queensland to the north (26, 27). The most productive estuaries in Queensland, which supplied southern urban markets, were located in Moreton Bay (26). After fisheries collapsed in Moreton Bay by the 1890s, S. glomerata began to be imported from more northern estuaries in Queensland (Wide Bay, Tin Can Bay, and Great Sandy Strait), until these fisheries had also collapsed by the 1910s (26).
Fig. 5.
Map showing linear expansion of exploitation of oyster reefs along eastern Australia. Individual estuaries are labeled with the earliest date for reef degradation, as derived from landings data (peak in landings), earliest importation of nonendemic oysters to restock each estuary, and earliest use of dredges. The major urban center driving this exploitation is shown.
Discussion
The expansion and collapse of oyster fisheries along three continental margins represent another example of the unsustainable use of a natural resource that resulted in its rapid depletion. Cognizance of this depletion has been obscured for many estuaries because additional oysters were continually imported from other, ever more distant, estuaries to replenish degraded reefs. Although there are other examples of oyster-fishery collapse and reef degradation (7, 28, 29), this study offers insight into how exploitation resulting in oyster-reef degradation relates across multiple estuaries and over centuries of exploitation. Unfortunately, the historical degradation of oyster reefs along these continental margins remains under-appreciated in estuarine ecology today (10). This oversight may simply be due to what has been called the “shifting-baseline syndrome” (30), where no scientist alive today has ever seen an undisturbed, fully functioning oyster reef. This history is in contrast to research on coral reefs, in which hundreds of scientists have studied the ecology of coral reefs over the past 40 years. Although we lack direct observations of undisturbed oyster reefs, historical observations suggest that oyster reefs played a dominant ecological role in estuaries, if based only on their reported large size, wide geographic distribution, and content of a multitude of suspension feeders. It is unknown how much other estuarine biota, particularly fish, may have once used undisturbed oyster reefs as habitat.
These historical patterns place conservation goals in a temporal and geographic framework that is much needed for projects attempting to restore oyster-reef communities in estuaries (31-33). The linear expansion and collapse of oyster fisheries along these coastlines indicate how long each estuary has been exposed to destructive fishing practices. Estuaries at the end of the sequence may be easier to restore relative to estuaries closer to the beginning of the sequence because less time has passed since their oyster reefs were degraded. These estuaries will also deserve more protection because their reefs may be in better condition relative to those estuaries closer to the original urban center. Knowing the historical sequence of degradation allows us to infer which estuaries are currently in greatest danger of reef degradation. For example, the sequence in eastern North America suggests that estuaries in Louisiana and Texas are currently in greatest danger from reef degradation, as suggested by the recent increase in oyster landings from these states relative to the rest of North America (Fig. 3; Movie 1). Knowing the historical pattern of reef degradation along this and other continental margins will allow governments to better know where to concentrate efforts to avert further damage to oyster reef communities.
Supplementary Material
Acknowledgments
I thank R. Bradbury, J. Jackson, and H. Lenihan for discussion and useful references and fishery data. This work was supported by a National Science Foundation Earth Sciences Postdoctoral Research Fellowship and by the National Center for Ecological Analysis and Synthesis (funded by the National Science Foundation, the University of California, and the University of California, Santa Barbara).
References
- 1.Officer, C. B., Smayda, T. J. & Mann, R. (1982) Mar. Ecol. Prog. Ser. 9, 203-210. [Google Scholar]
- 2.Newell, R. I. E. (1988) in Understanding the Estuary: Advances in Chesapeake Bay Research, eds. Lynch, M. P. & Krome, E. C. (Chesapeake Bay Research Consortium, Baltimore), pp. 536-546.
- 3.Ulanowicz, R. E. & Tuttle, J. H. (1992) Estuaries 15, 298-306. [Google Scholar]
- 4.Winslow, F. (1880) in Report of the Commissioners of Fisheries of Maryland (Wiley, Annapolis, MD) pp. 105-219.
- 5.Winslow, F. (1882) U.S. Coast Survey Report for 1881 11, 1-87. [Google Scholar]
- 6.McCormick-Ray, M. G. (1998) Estuaries 21, 784-800. [Google Scholar]
- 7.Rothschild, B. J., Ault, J. S., Goulletquer, P. & Héral, M. (1994) Mar. Ecol. Prog. Ser. 111, 29-39. [Google Scholar]
- 8.Lenihan, H. S. & Peterson, C. H. (1998) Ecol. Appl. 8, 128-140. [Google Scholar]
- 9.Jonas, R. B. (1997) Amer. Zool. 37, 612-620. [Google Scholar]
- 10.Jackson J. B. C., Kirby, M. X., Berger, W. H., Bjorndal, K. A., Botsford, L. W., Bourque, B. J., Bradbury, R. H., Cooke, R., Erlandson, J., Estes, J. A., et al. (2001) Science 293, 629-638. [DOI] [PubMed] [Google Scholar]
- 11.Wefer, G., Berger, W. H., Bijima, J. & Fischer, G. (1999) in Use of Proxies in Paleoceanography: Examples from the South Atlantic, eds. Fischer, G. & Wefer, G. (Springer, Berlin), pp. 1-68.
- 12.O'Callaghan, E. B. (1868) Laws and Ordinances of New Netherland, 1638-1674 (Weed, Parsons, and Company, Albany, NY).
- 13.Ingersoll, E. (1881) in The History and Present Condition of the Fishery Industries, ed. Goode, G. B. (U.S. Dept. Interior, 10th Census of the United States, Washington, DC), pp. 1-252.
- 14.McCay, B. J. (1998) Oyster Wars and the Public Trust (Univ. Arizona Press, Tucson).
- 15.Galtsoff, P. S. & Seiwell, H. R. (1928) U.S. Dept. Commerce Bur. Fish. Econ. Cir. 66, 1-11. [Google Scholar]
- 16.Lyles, C. H. (1969) U.S. Fish Wildl. Serv. Bur. Com. Fish. Curr. Fish. Stat. 5007, 1-116. [Google Scholar]
- 17.Collins, J. W. (1891) Bull. U.S. Fish Commission 9, 461-497. [Google Scholar]
- 18.Stevenson, C. H. (1894) Bull. U.S. Fish Commission 1892 12, 203-297. [Google Scholar]
- 19.Churchill, E. P. (1920) The Oyster and the Oyster Industry of the Atlantic and Gulf Coast (Report of the U.S. Bureau of Fisheries, Washington, DC).
- 20.Conte, F. S. & Dupuy, J. L. (1982) in Proceedings of the North American Oyster Workshop, ed. Chew, K. K. (Louisiana State Univ. Press, Baton Rouge), pp. 43-63.
- 21.Beattie, J. H., McMillin, D. & Wiegardt, L. (1982) in Proceedings of the North American Oyster Workshop, ed. Chew, K. K. (Louisiana State Univ. Press, Baton Rouge), pp. 28-38.
- 22.Barrett, E. M. (1963) The California Oyster Industry (State of California, Resources Agency, California Dept. of Fish and Game, Fishery Bulletin 123).
- 23.Townsend, C. H. (1893) U.S. Commission of Fish and Fisheries Report 1889-1891 (U.S. Government, Washington, DC).
- 24.Qualman, J. L. (1982) in Proceedings of the North American Oyster Workshop, ed. Chew, K. K. (Louisiana State Univ. Press, Baton Rouge), pp. 39-42.
- 25.Galtsoff, P. S. (1930) Report of the U.S. Commissioner of Fisheries for the Fiscal Year 1929 (U.S. Government, Washington, DC).
- 26.Smith, G. S. (1985) The Queensland Oyster Fishery: An Illustrated History (Queensland Department of Primary Industries, Brisbane, Australia).
- 27.Roughley, T. C. (1922) Mus. App. Arts Sci., Sydney, Tech. Educ. Ser. 25, 1-69. [Google Scholar]
- 28.Romero, A. (2003) Conservation Biology 17, 1013-1023. [Google Scholar]
- 29.Cranefield, H. J., Michael, K. P. & Doonan, I. J. (1999) Aquatic Conserv. Mar. Freshwater Ecosyst. 9, 461-483. [Google Scholar]
- 30.Pauly, D. (1995) Trends Ecol. Evol. 10, 430. [DOI] [PubMed] [Google Scholar]
- 31.Luckenbach, M. W., Mann, R. & Wesson, J. A. (1999) Oyster Reef Habitat Restoration: A Synopsis and Synthesis of Approaches (Virginia Institute of Marine Science, Williamsburg, VA).
- 32.Breitburg, D. L., Coen, L. D., Luckenbach, M. W., Mann, R., Posey, M., Wesson, & J. A. (2000) J. Shellfish Res. 19, 371-377. [Google Scholar]
- 33.Mann, R. (2000) J. Shellfish Res. 19, 335-339. [Google Scholar]
Associated Data
This section collects any data citations, data availability statements, or supplementary materials included in this article.


