

Abstract
Interfollicular epidermal (IFE) homeostasis is a major physiological process allowing maintenance of the skin barrier function. Despite progress in our understanding of stem cell populations in different hair follicle compartments, cellular mechanisms of IFE maintenance, in particular, whether a hierarchy of progenitors exists within this compartment, have remained controversial. We here used multicolour lineage tracing with Brainbow transgenic labels activated in the epidermis to track individual keratinocyte clones. Two modes of clonal progression could be observed in the adult murine dorsal skin. Clones attached to hair follicles showed rapid increase in size during the growth phase of the hair cycle. On the other hand, clones distant from hair follicles were slow cycling, but could be mobilized by a proliferative stimulus. Reinforced by mathematical modelling, these data support a model where progenitor cycling characteristics are differentially regulated in areas surrounding or away from growing hair follicles. Thus, while IFE progenitors follow a non‐hierarchical mode of development, spatiotemporal control by their environment can change their potentialities, with far‐reaching implications for epidermal homeostasis, wound repair and cancer development.
Keywords: Brainbow model, epidermal stem cells, hair follicle cycle, homeostasis, multicolour tracing model
Subject Categories: Development & Differentiation, Stem Cells, Systems & Computational Biology
Introduction
The renewal and terminal differentiation of keratinocytes in the interfollicular epidermis (IFE) is required for the replacement of the impermeable stratum corneum layer protecting against external injuries, infection, dehydration and heat loss. It is a continuous process throughout life emanating from the basal epidermal cells that proliferate prior entering a well‐defined process of terminal differentiation during which they transit outwards before being shed from the epidermis.
The long‐held belief that the IFE was organized into cell columns of fixed size, called epidermal proliferative units (EPU; Potten, 1974), has been challenged by in vivo lineage tracing experiments demonstrating that keratinocyte clones in the IFE could grow well beyond the predicted size of these columns (Kameda et al, 2003; Ro & Rannala, 2004). Besides, other studies assaying clone progression and cell division supported a non‐hierarchical model where committed progenitors (CP) randomly adopted one of three fates by either generating one progenitor and one post‐mitotic cell undergoing terminal differentiation, or two progenitors or two post‐mitotic cells (Clayton et al, 2007; Doupe et al, 2010). This work and others (Levy et al, 2005; Page et al, 2013) suggested that the IFE could be maintained without a hierarchy of stem and transit‐amplifying cells and independently of the upper hair follicle compartments.
However, in sharp contrast to these findings, many studies support the existence of a hierarchy among IFE progenitors. In humans, the heterogeneity of IFE cells regarding surface expression of beta‐1 or alpha‐6‐integrin and CD71 levels has been reported to correlate with different self‐renewal and proliferative capacities in vitro (Li et al, 1998; Schluter et al, 2011). Two more recent studies conducting lineage tracing in the IFE supported a committed progenitor model and revealed a second population of slow‐cycling epidermal cells that could rapidly respond to proliferative stimuli (Mascre et al, 2012; Sada et al, 2016). Specific cell populations of the IFE seem to have distinct behaviour, such as K17‐expressing cells in touch domes or IFE cells with active canonical Wnt signalling in plantar epidermis (Doucet et al, 2013; Lim et al, 2013). Therefore, despite strong evidence for random fate choice, some heterogeneity exists in the basal IFE layer consistent with previous work (Potten, 1974; Barrandon & Green, 1987; Kolodka et al, 1998), and the question of the existence of a hierarchy between slow‐cycling cells and transit‐amplifying/differentiating epidermal cells in the IFE remains open.
The histology of the IFE greatly varies depending on anatomical location. Most lineage tracing experiments have been performed in the murine tail, where ortho‐ and parakeratotic modes of differentiation (Gomez et al, 2013) affect the proliferative potential of basal cells and may therefore confound analysis. Besides, there are important differences in hair follicle presence, density and biology between the murine tail or footpad epidermis and the dorsal epidermis which represents the majority of the IFE. The contribution of hair follicles and their cycling to the IFE was not assessed in previous studies which focused on the tail or the ear (Clayton et al, 2007; Doupe et al, 2010).
We here used multicolour fate tracing with Rainbow technology that makes it possible to visualize clonal limits in densely labelled samples (Tabansky et al, 2013; Roy et al, 2014). We report two modes of clonal progression reflecting fast‐ and slow‐cycling progenitors that strongly depend on anatomical position with respect to hair follicles and their cycling status. These results could be simulated by a model where the environment of anagen hair follicles modulated the proliferation and differentiation rates of committed progenitors undergoing random fate decisions.
Results
Multicolour lineage tracing for analysis of clonal population dynamics
To address the clonal dynamics of epidermal cells over time in the dorsal IFE while taking into account potentially rare progenitor populations, we used high‐density multicolour lineage tracing. We generated “Skinbow” mice by crossing Rainbow3 transgenic mice expressing a Brainbow‐1.0 construct (Livet et al, 2007) under the control of the ubiquitous CAG promoter (Tabansky et al, 2013) with Keratin 14‐CreER mice (Vasioukhin et al, 1999; Appendix Fig S1A and B). After tamoxifen‐induced Cre recombinase activation, a transition from dTomato (expressed by default) towards random but stable expression of a combination of fluorescent protein genes occurred that generated one of five possible colours in each cell as identified by confocal microscopy and flow cytometry (Appendix Fig S2A–C). Although the different fluorescent protein combinations were not equally represented, their frequency was relatively stable (Appendix Fig S2D and Appendix Supplementary Methods). Moreover, in the absence of tamoxifen injection, skinbow mice did not exhibit any recombination in the IFE (Appendix Fig S3A). In agreement, the proportions of colours representing a complete recombination of both copies of the Brainbow‐1.0 construct did not change between early and late time points highlighting the absence of secondary spontaneous recombination confirming the feasibility of long‐term fate tracing (Appendix Fig S2E). Indeed in the IFE of Rainbow mice, stable colour identities inherited by the cells' progeny resulted over time in groups of cells that shared the same label. (Fig 1 and Appendix Fig S3B). Importantly, the labelling of cells was random across the IFE and did not cluster in specific areas (Appendix Fig S3B and C). This allowed us to estimate the size of clones originating from individual progenitor cells by counting surface cells harbouring the same colour (Appendix Supplementary Methods and Fig EV1A and B); we also used stacked images acquired in confocal microscopy to determine the relationship of each group with hair follicles and Lrig1+ infundibulum cells (Fig EV1B–D). Importantly, mathematical modelling allowed us to take into account and correct the data for cases of adjacency between clones of identical colour, and our results were also confirmed in independent experiments realized in conditions of sparse labelling (see below).
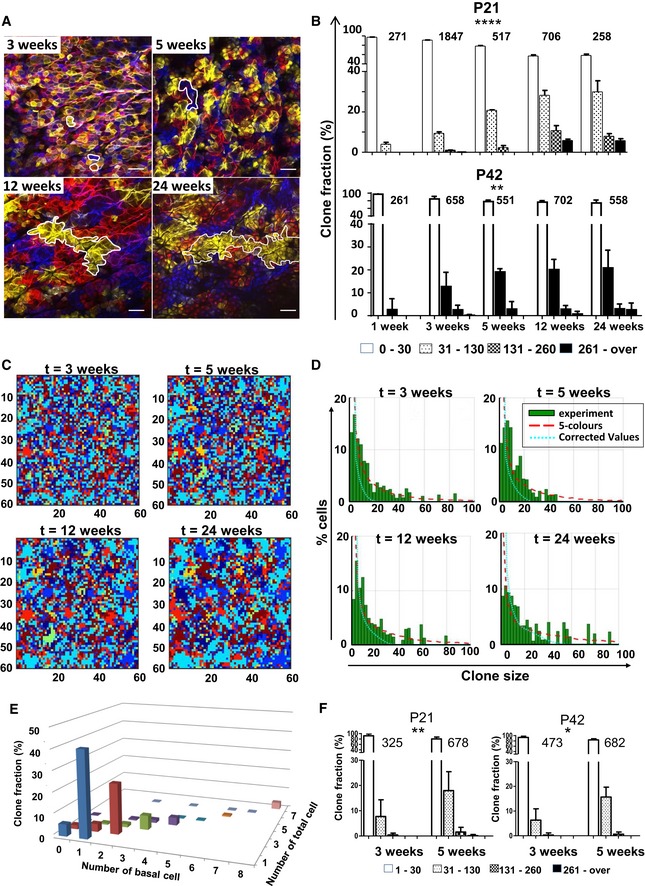
Figure 1. Interfollicular epidermal (IFE) clones labelled at P21 or P42 continuously grow in size between 3 and 24 weeks post‐induction.
-
APhotomicrographs represent 2D optical sections from a Z‐stack acquisition of whole‐mounted skin displaying IFE harbouring multiple clones of different colours at 3, 5, 12 and 24 weeks (scale bar represents 50 μm). In each image, a clone is circled in white, illustrating the progression of clone size at different times.
-
BHistogram charts showing the relative frequency of clones according to their size between 3 and 24 weeks in mice induced at P21 and P42. The frequency of larger clones increases over time. Chi‐square test, ****P < 0.0001 for P21 group and **P = 0.0056 for P42 group. The number of clones evaluated at each time point is indicated above each histogram series.
-
C, DCorrection for contiguous clones harbouring a same colour. (C) Snapshots from a computer simulation on a 2D lattice attributing six colours to basal keratinocytes. The figure illustrates the typical evolution of clone clusters in a 2D lattice simulating the basal layer with six different colours at different time points. The real clone size is simulated by attributing an infinite number of colours to the lattice and ensuring that each basal cell is uniquely labelled. (D) Plots show the probability for an individual keratinocyte to belong to a clone of a given size. Experimental data are represented in green bars. Red curve represents the five‐colour simulation and the blue curve the real size simulation. Although the frequency of large clones is overestimated in experimental data due to the limited five‐colour palette, it is apparent that real clone size progresses over time.
-
EHistogram charts showing the distribution of clones at D1‐3 following tamoxifen induction according to total number of cells and number of basal cells.
-
FHistogram charts showing the relative frequency of clones according to their size between 3 and 5 weeks in groups injected at P21 and P42 with a single low dose of tamoxifen to perform a low‐density staining. The frequency of larger clones increases over time. Chi‐square test, **P = 0.0013 for P21 group and *P = 0.0296 for P42 group.
Figure EV1. Scoring and sample analysis.
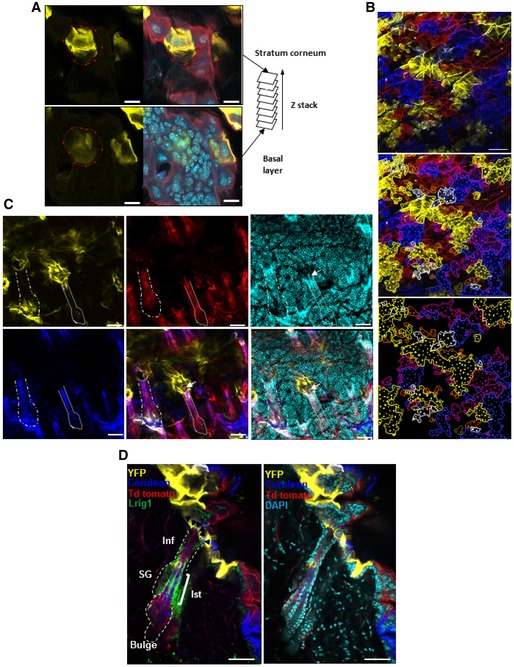
- Photomicrograph represents a 2D optical section from a Z‐stack acquisition of whole‐mounted skin displaying the stratum corneum (top images) and basal epidermal layer (bottom images). The red circle delimits a yellow clone sharing corneocytes and basal epidermal cells (scale bar represents 20 μm).
- Using individual sections from Z‐stacks, limits of clones (lines) were identified and cells (dots) within each clone were counted (scale bar represents 100 μm).
- 2D compiled images from Z‐stack acquisition of whole‐mounted skin. The white arrow shows a yellow clone in contact with a hair follicle shaft. This clone is considered attached to a hair follicle (scale bars represent 50 μm). Contact between IFE clones and HF.
- Photomicrographs represent 2D optical sections from a Z‐stack acquisition of a 0.5‐mm skin section displaying IFE and HF harbouring multiple clones of different colours at 12 weeks. The permanent portion of the hair follicle (isthmus and infundibulum) is labelled with Lrig1 (green). The yellow clone in the IFE immediately adjacent to the HF is considered as attached to the HF. Black arrows show the contact between the yellow clone and the HF. B, bulge; Inf, infundibulum; Ist, isthmus; SG, sebaceous gland; IFE, interfollicular epidermis (scale bar represents 50 μm).
Clone size evolution over time distinguishes two proliferation profiles
Using the above approach, we achieved dense labelling of epidermal cells in growing mice from P21 to P25 after hair follicle formation was complete and in adult mice at P42–P46 after the first hair cycle. We collected back skin samples in the telogen resting hair cycle phase at different time points from 1 to 24 weeks after tamoxifen induction and quantified clone size. As expected, we observed that the size of clones initiated from the labelling of individual epidermal cells increased over time. Interestingly, the frequency of clones of large size (> 30 cells) continued to increase 24 weeks after induction, suggesting sustained growth in the absence of any stimulation (Fig 1A and B). Because mice induced at P21 are still growing and not in homeostatic conditions, we focused mostly on animals induced from P42.
Despite the increase in clone size over time, in all instances, the majority (> 75%) of clones remained of small size (≤ 30 cells) even 24 weeks after induction. The maintenance of this small clone population at such late time points suggested that it could originate from slow‐cycling progenitors. This was supported by the fact that these small clones had cells in the basal layer of the epidermis as identified by alpha‐6 integrin staining in more than 80% of cases, with < 20% being disconnected from the basal layer as expected in the case of clones undergoing terminal differentiation entirely and disappearing (Fig EV2A and B). Therefore, quantitative measures of clone size evolution revealed two profiles: clones that remained of equal size even after long periods of time and clones that grew in size.
Figure EV2. Small clones remaining at 24 weeks harbour cells in the basal layer.
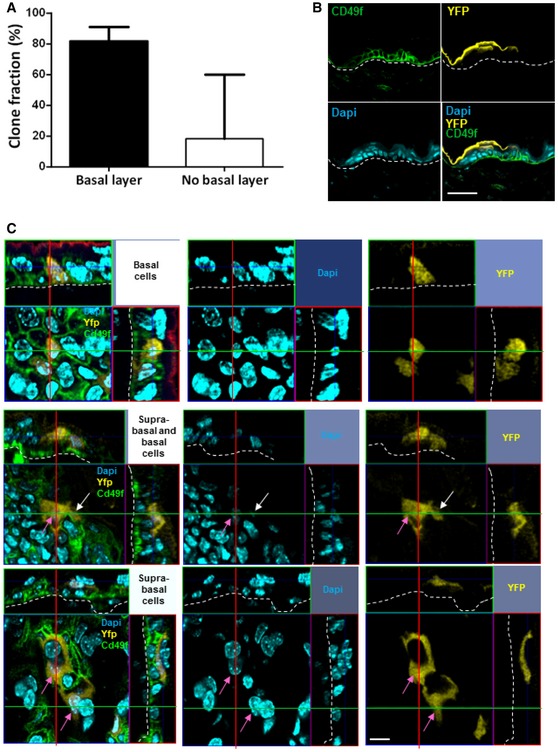
- Histogram chart showing the relative frequency of small clones observed at 24 weeks with or without cells in the basal layer. Clones without cells in the basal layer are considered as dying clones entering fully terminal differentiation. About 80% of small clones had cells in the basal layer of the epidermis (black bar), while 20% did not (white bar). n = 41 clones were counted from 4 mice. Data are represented as median with interquartile range.
- Confocal analysis of alpha‐6 integrin staining to identify basal epidermal cells. An optical section of a Z‐stack transversal acquisition demonstrates the presence of YFP+ cells above the basal layer stained with alpha‐6 integrin. This YFP+ cell is therefore suprabasal (scale bar represents 50 μm).
- Photomicrographs represent 2D optical section from a Z‐stack acquisition in of whole‐mounted skin displaying representative basal (white arrows) and suprabasal (pink arrows) clones at D3 of tamoxifen injection (scale bar represents 20 μm).
This clone size evolution was highly reminiscent of the committed progenitor (CP) model, previously described in tail epidermis, in which the clones continue to grow over time without limitation of size (Clayton et al, 2007). We next compared our observations in dorsal skin to those reported in tail epidermis where the proportions of cells undergoing divisions towards two progenitors (CP>2CP) or two post‐mitotic cells (CP>2PM) were 10% and those leading to one progenitor/one post‐mitotic cells (CP>1CP+1PM) represented 80% of cell divisions. We examined the fate of individual cells within clones 1–4 days post‐induction with tamoxifen (Fig EV2C). CP and PM cells were identified based on their basal or suprabasal presence and based on their capacity to proliferate (details in Appendix Supplementary Methods). In back skin epidermis, 48% of cell divisions resulted in CP>1CP+1PM cell division, while the remainder led to differentiation or duplication with equal probability of 26%. These frequencies appear well tuned for skin homeostasis as they do not result in excess progenitors or post‐mitotic cells. However, compared to frequencies reported in tail epidermis, the higher frequency of CP>2CP and CP>2PM division found in the IFE is expected to result in more rapid clonal size change.
Strategies to refine clone size estimate
In Skinbow samples, the chances of colour overlap between two adjacent clones were not negligible (1 in 5 in average). The apparent clone size distribution based on labelling with five colours may therefore overestimate the frequency of larger clones as they partly represented smaller overlapping clones. To address this limitation, four independent strategies were adopted. Firstly, we analysed early time points after tamoxifen induction to assess the clonality of labelled cells and evaluate the potential frequency of overlapping clones. Tissues were collected at D1‐3 after high dose of tamoxifen injection in telogen. Although clone size was normally distributed between 1 and 4 cells, a sudden peak of 3.4% was also visible for clones over 7 cells at D3 suggesting the merging of two adjacent clones. This suggested that over 95% of the labelling is clonal in proportions similar to previous reports (Mascre et al, 2012) (Fig 1E). It is, however, expected that as clones grow in size more merging of adjacent clones of the same colour might occur.
To address this further, we used computer simulations of the basal cell population on a two‐dimensional lattice (Appendix Supplementary Methods). Upon correction, the increase in the frequency of large clones was persistent and the two profiles of clone progression could still be observed (Fig 1C and D blue curve). This method was applied in all subsequent analyses to correct for the overlap of clones harbouring the same colour.
Thirdly, we analysed data obtained for rare colour labels such as orange, pink or white separately, mimicking a low‐density staining with reduced possibility of clonal overlap. We observed the same trend towards an increase in clone size accompanied by a majority of clones that did not change in size (Fig EV3). Finally, we performed low‐density labelling using a single low dose (0.3 mg) of tamoxifen. Low‐density staining resulted in significantly lower staining efficiency and therefore fewer cells stained (27.7 ± 8.1% for high density versus 3.1 ± 1.2% of epidermal cells stained, Appendix Fig S3C). Skin analysed at 3 and 5 weeks post‐induction further confirmed the presence of two clonal progression profiles as described above (Fig 1F). Therefore, regardless of the setting and the technique of high‐ or low‐density labelling used, in the dorsal epidermis, a large category of clones did not change in size, whereas a second category exhibited continued clonal growth as reported previously for tail and ear skin, arguing for a CP‐type model (Clayton et al, 2007; Doupe et al, 2010).
Figure EV3. Single‐colour analysis of IFE renewal shows continued clonal growth.
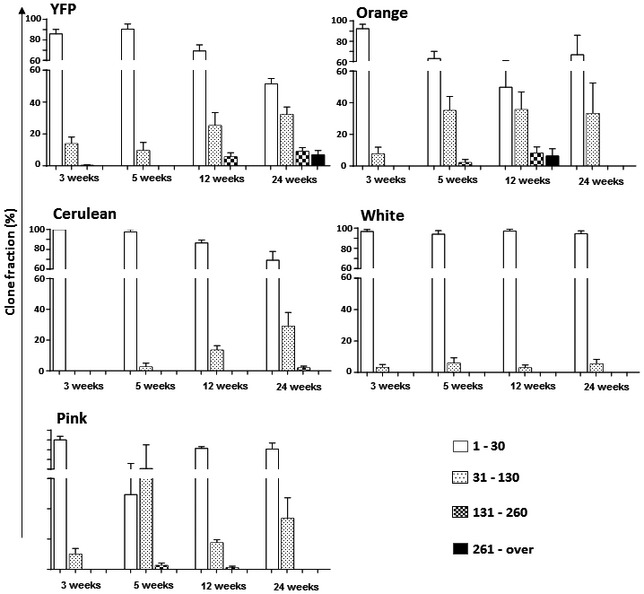
Labelled clones were grouped based on their colour, and each group was separately analysed for size progression over time. Histogram chart showing the relative frequency of clone sizes obtained for each colour between 3 and 24 weeks. The frequency of larger clones increased over time for all five colours. Continued growth was also observed for rare colours such as orange or pink, arguing against the possibility that this growth was only due to contact between clones of a same colour. Data are represented as mean ± s.e.m.
Rapidly expanding clones are connected to hair follicles
To characterize the distribution of the slow and rapidly growing clones within the IFE, we analysed the size of clones relative to their positioning with respect to hair follicles (Figs 2A and EV1C). Clones were classified as attached or not to HFs (Figs 2B and EV1D). Notably, contact between IFE clones and HFs was situated at the upper infundibulum as labelled with Lrig1. We never observed IFE clones connected to the bulge region of a HF, as predicted (Ito et al, 2005). On average, after induction at P42, clones attached to HF were larger than those not attached (P < 0.0001; Fig 2A). Interestingly, when examining clone size distribution over time, among clones attached to HFs, the frequency of large clones increased more steadily compared to those unconnected to HFs (Fig 2C). In these adult mice, at 12 weeks post‐induction, clones larger than 260 cells represented 4% of clones connected to HF versus 0% of non‐connected clones (chi‐square test P < 0.0001; Fig 2C). In growing mice induced at P21, similar observations could be made (chi‐square test P < 0.001; not shown). This was further verified in mice induced with a single low dose of tamoxifen, reducing the possibility of clonal overlap (Fig EV4A). In these adult mice with low recombination events (< 5%) added to the random acquisition of 1 of 5 colours, the probability of overlap was largely annihilated. In this scenario, 3 and 5 weeks post‐induction clones attached to HF grew bigger than clones not attached. Similarly, when considering the colours resulting from recombination individually, further reducing chances of clone overlap, HF‐attached clones' size distribution was systematically shifted towards larger clones (Fig EV4B). Of importance, among clones attached to HF, the proportion of small clones significantly decreased over time suggesting their expansion. In contrast, this proportion remained stable and high (> 70%) in clones non‐attached to hair follicles.
Figure 2. Larger clones are more likely to be attached to hair follicles.
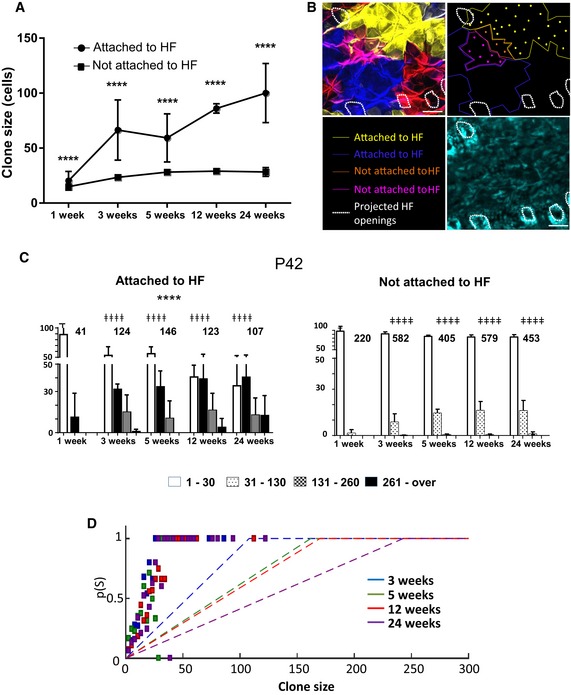
- Clones were categorized as attached or not attached to hair follicles. Average clone size of attached (circles) and non‐attached (squares) clones was plotted over time. t‐test, ****P < 0.0001. (Number of clones: 1 week n = 271, 3 weeks n = 1,847, 5 weeks n = 517, 12 weeks n = 706, 24 weeks n = 258). Data are represented as mean ± s.d.
- Photomicrographs represent 2D optical sections from a Z‐stack acquisition of a whole‐mounted back skin harbouring multiple clones of different colours at 12 weeks. The yellow and blue clones in the IFE immediately adjacent to a HF are considered as attached to the HF. The orange and pink clones are not attached to the HF. Limits of clones (lines) and cells (dots) within each clone were identified on this optical section. White dashed circles represent the projection of hair follicle openings (scale bar represents 50 μm).
- Bar charts showing the relative frequency of clone size between 3 and 24 weeks after recombination. In the P42 group, clones attached to HF were more likely to be bigger than those not attached at 3, 5, 12 and 24 weeks. Chi‐square test, ǂǂǂǂ P < 0.0001. The number of clones analysed at each time point is indicated on the graph. Of note, whether attached or not clones continued to grow over time: Chi‐square test, ****P < 0.0001. All data are represented as mean ± s.e.m.
- Plot showing the probability of a clone to be attached to a hair follicle as a function of its size (dashed line: predicted curve based on theoretical probabilities according to spacing of hair follicles at different time points; squares: experimental data). Between different time points, the distance between hair follicles varies slightly; therefore, each time point (3, 5, 12 and 24 weeks) has a distinct theoretical curve. The observed frequency of clone attachment to hair follicles is at every time point above the random prediction.
Figure EV4. Low‐density labelling and single‐colour lineage tracing confirm increased size of clones attached to HF .
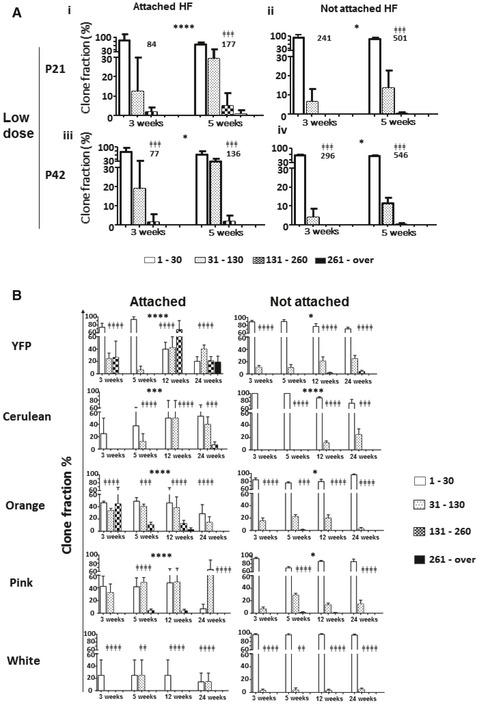
- Bar charts showing the relative frequency of clone sizes at 3 and 5 weeks after recombination in groups injected at P21 or P42 with a single low dose of tamoxifen to perform a low‐density staining. In the P21 group, clones attached to HF (i) were more likely to be bigger than those not attached (ii) at 5 weeks. The same result is found in the P42 group at 3 and 5 weeks (iii and iv). Chi‐square test, ǂǂǂ P < 0.001. The number of clones analysed is indicated on the graph. Of note, whether attached or not clones continued to grow over time. Chi‐square test, ****P < 0.0001, *P < 0.05. Data are represented as mean ± s.e.m.
- Labelled clones were grouped based on their colour, and each group was separately analysed for size distribution difference between clones attached to HF or and non‐attached. Histogram chart showing the relative frequency of clone sizes obtained for each colour between 3 and 24 weeks. The frequency of larger clones attached to HF increased more steadily in over time for all five colours. Continued growth was also observed for rare colours such as orange, white or pink, arguing against the possibility that this growth was only due to contact between clones of a same colour. Chi‐square test indicated where significant difference was identified, ǂǂ P < 0.01, ǂǂǂ P < 0.001, ǂǂǂǂ P < 0.0001, *P < 0.05, ***P < 0.001, ****P < 0.0001. Data are represented as mean ± s.e.m.
Given the regular arrangement of HF on back skin (Appendix Fig S4), we further ensured that larger clones were not in contact with a HF by chance only. We modelled the probability of a clone to be randomly connected to a HF as a function of its size (Appendix Supplementary Methods). Comparing observed percentages of attached clones to the theoretical probability, it appeared that clones were more likely to be attached to HF than predicted simply by their size. Therefore, observed differences in clone size with respect to anatomical location could not be attributed to chance alone (Fig 2D).
IFE clonal expansion around hair follicles in anagen
To further explore the relationship between IFE clonal evolution and the HF, we examined clone size in areas of telogen (resting) compared to areas initiating anagen (growth) phase of the HF cycle obtained from the same animals at the time of collection. This allowed comparing areas of the skin that have undergone one more anagen phase compared to areas in telogen. Anagen areas on murine back skin were identified by their pigmentation. At all time points, clones attached to HFs were larger in areas of active hair cycling than in resting areas. Strikingly, hair cycle had no influence on the size distribution of clones not attached to hair follicles (Fig 3A).
Figure 3. IFE clonal progression defined by hair follicle cycling.
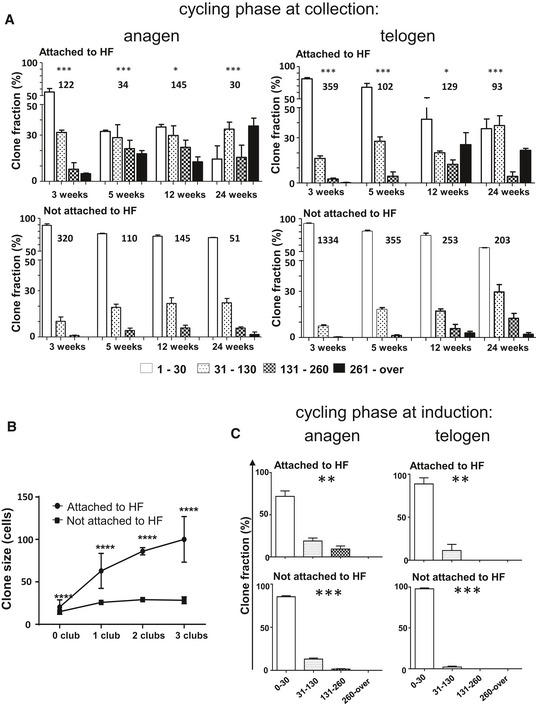
- Anagen and telogen skin identified by skin pigmentation at the time of collection were obtained from each Skinbow mouse at different time points. Histogram charts represent the relative frequency of clone size from clones attached (top row) or not (bottom row) to HF in anagen and telogen phase at the time of tissue collection. Clones connected to hair follicles were more likely to be larger in anagen compared to telogen (chi‐square test, ***P = 0.0009 at 3 weeks, ***P < 0.0001 at 5 weeks, *P = 0.0193 at 12 weeks, ***P = 0.0001 at 24 weeks). However, no difference between the two phases was observed in clones that were not attached to HFs. Clone numbers are indicated on the graph. All data are represented as mean ± s.e.m.
- Telogen skin was obtained from Skinbow mice induced at P42 at different time points from 1 to 24 weeks post‐induction. Each skin sample was evaluated for the average number of club hair found in hair follicles reflecting its history of past hair cycling. Average clone size of attached (circles) and non‐attached (squares) clones was plotted over the number of club hair. All data are represented as mean ± s.e.m. t‐test, ****P < 0.0001.
- Skinbow mice were induced at a time where the back skin contained both areas of anagen and telogen and samples were collected for evaluation at 7 days. Histogram charts represent the relative frequency of clone size from clones attached (top row) or not (bottom row) to HF in anagen and telogen phase at induction. Even at a rate of one cell division per 24 h, seven cycles of divisions result in 128 cells. Therefore, the findings reported are not incompatible with our claims as suggested. Observation of spontaneous recombinations if they exist is therefore a very rare event that we have never been able to observe. Such a rare event is unlikely to influence our analysis based on sizes of hundreds of clones. Chi‐square test, ***P = 0.001; **P = 0.01. All data are represented as mean ± s.e.m.
To further ensure the validity of this finding, we compared clone size estimates in the IFE based on the number of hair cycles that hair follicles in that same area had undergone. In whole mount preparations of the skin, we therefore estimated clone size on the surface epidermis as described above, but also counted the number of club hair in deep optical sections as an estimation of the history of hair follicle cycling. This allowed showing a direct and linear increase in clone size for clones attached to hair follicles relative to the number of hair club. The increase was strongly significant compared to clones that were not attached to HF (Fig 3B).
Finally, to more directly compare clone size changes in anagen versus telogen, we injected adult skinbow mice with tamoxifen ensuring that at the time of injection, part of the back skin was in anagen. This allowed us to directly compare clone size at 7 days post‐induction in areas that were in anagen versus areas that were in telogen at the time of induction. This allowed to demonstrate clearly that areas in anagen resulted in stronger clonal expansion especially for clones attached to hair follicles when compared to areas in telogen (Fig 3C). For clones that were not attached to hair follicles, there was a smaller but significant increase in clone size in anagen versus telogen.
The increased frequency of large clones during anagen was further supported by observations of a hair cycle‐dependent proliferation of cells in the hair follicle infundibulum and the adjacent IFE. Careful staging of hair follicle cycle on the back skin was performed using a bioluminescent reporter mouse of the canonical Wnt signalling pathway (Hodgson et al, 2014). Ki67 staining of skin sections at different stages revealed a large number of proliferating cells in the IFE exclusively during the anagen phase (Fig 4A and B). In whole mount images, the increased density of Ki67+ cells in anagen versus telogen was clearly visible (Fig 4C). This was further supported by short‐term (2 h) BrdU pulse in mice harbouring both anagen and telogen back skin areas. BrdU staining showed a dramatic difference with a significantly stronger incorporation in anagen areas (Fig 4C). In Ki67 and BrdU labelling in whole mount skin preparations, both areas in proximity and distant from the hair follicles become proliferative in anagen. However, the proliferation was more consistent in areas in proximity of hair follicles and most particularly in the hair follicle openings, whereas areas distant from follicles were only partially stained. This may explain the clone size progression observed during anagen in clones attached to HF (Fig 3).
Figure 4. Proliferation in the IFE is hair cycle dependent and occurs mainly during early anagen phase.

-
A, BKi67 immunohistochemistry of back skin sections at different phases of the hair follicle cycle determined using a bioluminescent reporter mice of the canonical Wnt signalling pathway (A; scale bar represents 100 μm) and corresponding scatter plot quantification (B). Analysis focused on the basal layer of the IFE. Each dot represents one image. Proliferation in the IFE is significantly increased during the anagen phase except in mid‐anagen. All data are represented as mean ± s.e.m. Unpaired t‐test, ****P < 0.0001, **P = 0.0020. EA n = 32, EMA n = 13, MA n = 15, C n = 21, T n = 19 from 6 mice. Black arrows: Ki67‐positive cells.
-
CPhotomicrographs represent 2D optical sections from Z‐stack acquisition of whole‐mounted back skin stained in anagen and telogen with anti‐Ki67 antibody or upon BrdU incorporation. Ki67+ cells are labelled with Alexa 647 (red). The density of Ki67+ cells increased in the anagen phase (iii and iv) compared to telogen (i and ii). White arrows: Ki67+ cells. (scale bar represents 20 μm). Similarly, short‐term BrdU pulse (2 h) resulted in significant staining of anagen epidermal areas (vi, red nuclear stain) reinforcing hair follicle openings as compared to telogen areas.
Small clones contain slow‐cycling progenitors that can be mobilized upon stimulation
Aside from the clones attached to HF that strongly proliferated during the anagen phase, we next focused on the large proportion of clones that remained of small size (defined here as < 30 cells) even up to 24 weeks post‐labelling.
As discussed before (Fig EV2), the fact that 80% of the small clones had at least one cell in the basal layer, and the persistence of this category months after labelling, opposed the idea that they were terminally differentiating.
An alternative explanation was that these clones were quiescent or slow cycling. Labelling and chase periods are needed to identify cells that divide, take up label and then retain it by cycling slowly or becoming quiescent (LRCs: label‐retaining cells). LRCs can be distinguished from other cells taking up label but continuing to cycle rapidly, as in the latter case, the label quickly becomes “diluted” below the level of detection. We therefore performed BrdU label‐retaining experiments. Adult animals were injected with BrdU during three consecutive days using a regimen of two injections per day. This allowed the labelling of nearly all basal epidermal cells as shown by BrdU staining from skin collected at 72 h immediately after the 3 days of injection. This 3‐day pulse was then followed by a period of chase up to 5 weeks post‐labelling. As can be seen in Fig 5A, during the chase period, BrdU staining in proximity of hair follicles was progressively lost suggesting their faster proliferation, whereas areas more distant from hair follicles retained their label. In skinbow mice, BrdU+ cells corresponded to individual or small group of cells distant from follicles often found within small clones not attached to HFs (Fig 5B). Together these results supported the idea that small clones that are not attached to hair follicles harbour epidermal populations that are slow cycling.
Figure 5. Small clones not attached to hair follicles harbour epidermal populations that are quiescent and can be mobilized upon stimulation.
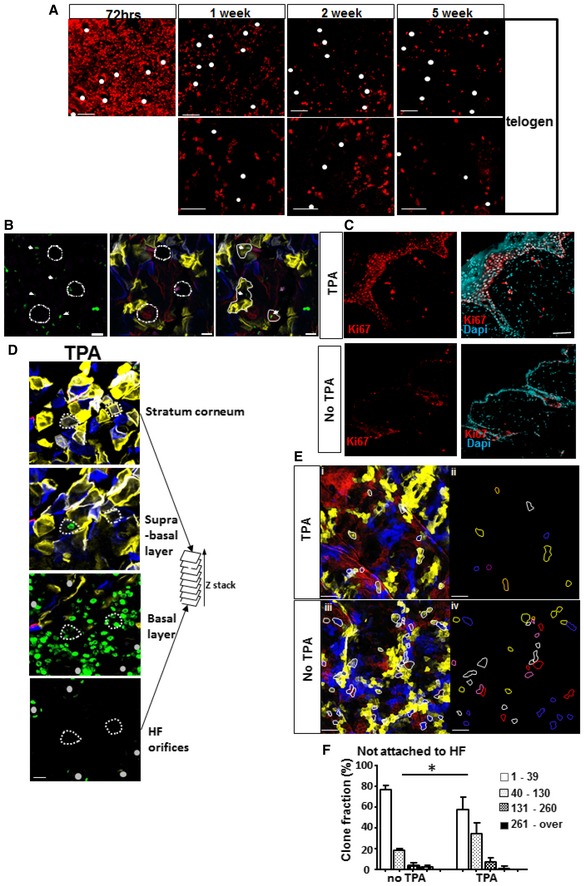
-
A, BSkinbow mice were induced for five consecutive days and pulsed with BrdU for three consecutive days with two injections per day. Skin was collected either immediately after the last BrdU injection at 72 h or after periods of 1–5 weeks of chase. (A) Photomicrographs show optical sections from a confocal image stack acquired on a whole‐mounted skin preparation immunostained with anti‐BrdU antibody (red). White dots represent hair follicles at different chase time points. (B) At 5 weeks of chase, BrdU staining (green) in skinbow skin revealed single cells distant from hair follicles. White dashed circles: hair follicles. White line: small clones. White arrows: BrdU+ cells (scale bar represents 20 μm).
-
C, DIn Skinbow mice induced at P42–P46, TPA was applied for 1 day, 3 weeks post‐induction, and animals were sacrificed at 48 h following a short pulse of BrdU (2 h). (C) Photomicrographs show optical sections from a confocal image stack acquired on a 0.5‐mm back skin section immunostained with anti‐Ki67 antibody. Ki67+ cells are labelled with Alexa 647 (red). Back skin from treated and untreated areas was collected 48 h after TPA topical application (scale bar represents 20 μm). (D) Multiple optical sections from a Z‐stack acquisition of whole mount preparation of skin treated with TPA and stained with anti‐BrdU (green). Small clones not attached to HF (two examples figured by dashed lines) can be tracked from the corneocyte layer down to the basement membrane where BrdU staining demonstrates their proliferation (scale bar represents 50 μm).
-
ERepresentative individual sections from Z‐stacks show small clones (lines) identified in back skin treated (i and ii) or not (iii and iv) with TPA (scale bars represent 100 μm).
-
FReduction in small clone frequency in the areas treated with TPA. Histogram chart showing the clone size distribution and relative frequency of small clones not attached to HF in areas treated with TPA and not treated with TPA in the same mouse. Data pooled from three mice represented as median with interquartile range. The number of clones analysed is indicated on the graph. *P = 0.0272. Data are represented as mean ± s.e.m.
An important remaining question was the potential of these small clones and their slow‐cycling cells to respond to a proliferative signal. Using 12‐O‐tetradecanoyl phorbol‐13‐acetate (TPA) stimulation of epidermal proliferation, we assessed whether these clones would enter proliferation. A short application of TPA followed by the collection of the skin at 48 h clearly highlighted an important proliferation of the entire epidermis as revealed by Ki67 staining (Fig 5C). In Skinbow mice induced at age 42–46 days, TPA was applied for 1 day, 3 weeks post‐induction and animals were sacrificed at 48 h following a short pulse of BrdU (2 h). Analysis of skinbow images clearly demonstrated that small clones not attached to hair follicles were entering proliferation at this early time point (Fig 5D). When Skinbow mice induced and treated with TPA in the same conditions were followed for another 5 weeks, a significant reduction in the proportion of small clones and a significant increase in large clones on treated compared to non‐treated areas of the back skin could be observed (Fig 5E, changes in clone size distribution, chi‐square test P = 0.0369). This clearly shows increased proliferation of the small quiescent clones upon TPA treatment, which grow into larger size clones.
Global surface representations of clones attached or not to hair follicles
A major advantage of high‐density lineage tracing is that, due to its high staining efficiency, it allows more directly to estimate the global contribution of different clone categories to the back skin epidermis. We evaluated the surface of back skin represented by each clone category. In adult animals injected at P42, the relative surface occupied by clones attached and non‐attached to the hair follicles remained stable in time (Fig 6A). Attached clones represented 36–41% of the surface of the back skin at all time points compared to non‐attached clones that covered 59–63%. Therefore, despite the increase in size observed in clones attached to HF over time, this category did not take over the entire surface of the epidermis. In growing animals injected at P21, the proportion of clones attached to follicles increased over time, suggesting that these played a role in the expansion of the animals' epidermal surface.
Figure 6. Modelling epidermal homeostasis.
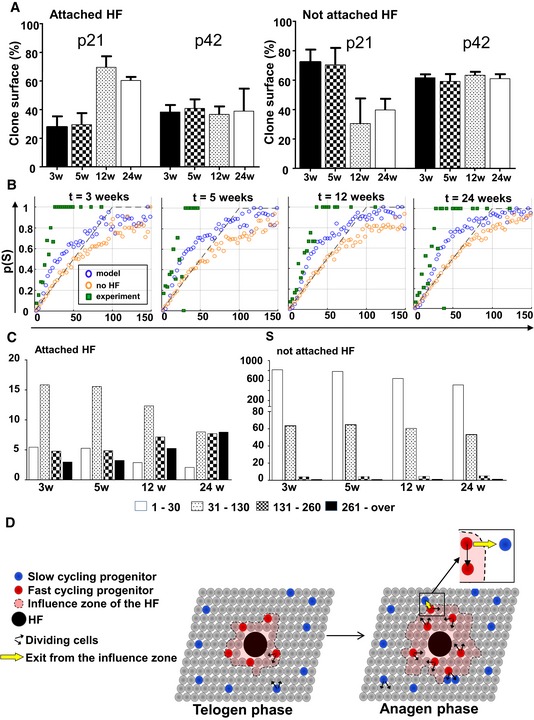
- Bar charts showing the relative surface of clones attached and not attached between 3 and 24 weeks after induction at P21 or P42. Data are represented as mean ± s.e.m.
- Computer simulation on 2D lattices representing the basal layer and hair follicles. The panels show the probability for a clone to be attached to hair follicles (p(S)) as a function of its size (S). At each time point, three sets of data were figured: values detected experimentally (green squares) versus values produced by simulating the Klein model (orange circles), and values obtained from simulations of the extended model, including the periodic activation of HFs (blue circles) enhancing the rate of migration of post‐mitotic cells in a circular neighbourhood of 21 cells around the active HFs. It can be noted that the new model taking into account hair follicles' influence is closer to observed values.
- Clone size distribution using simulations of the extended model taking into account HFs.
- Schematic representation of the model suggested by our findings. Committed progenitors have similar and low proliferation rates around and away from HF during telogen. However, during anagen, proliferation of CPs is increased in a zone of influence around hair follicles. In all cases, CPs divide according to a random fate as proposed by Clayton et al (2007). Upon proliferation of CPs around hair follicles, some CPs exit the zone of influence and remain slow cycling in subsequent anagen phases.
Modelling IFE homeostasis in the back skin
Differences observed between clones attached or not to hair follicles suggest the following models of epidermal homeostasis. The systematic bias that larger clones develop in the neighbourhood of HFs, associated with the transient increase in proliferation and clone size seen in anagen, indicates that there is a faster turnover of IFE cells in the vicinity of cycling HFs. This could be explained by the existence of two intrinsically different, slow‐cycling and fast‐cycling cell populations, possibly reflecting a hierarchical relationship among skin progenitor cells. However, modelling this first scenario involving two cell populations showed that the fast‐cycling cell population around HFs cannot explain the temporal modulation of cell turnover according to hair follicle cycling with cell‐intrinsic properties only. Indeed, the preferential localization of fast‐cycling cells in the vicinity of HFs would be gradually lost, with these cells progressively diffusing among slower cells distant from follicles due to cumulative local rearrangements of dividing and differentiating cells in the tissue. Finally, if cell‐intrinsic properties were responsible for the fast cycling of epidermal cells within clones attached to HF, one would expect that clones induced at P42 would occupy higher or similar proportion of surface in long‐term fate tracing experiments compared to clones induced at P21. However, we observed significant differences between these time points.
In contrast, a second scenario, involving an extrinsic diffusing signal or physical tension in vicinity of active HFs, provides a simple mechanism for both the temporal modulation and persistent spatial localization of enhanced turnover around HFs. We performed computer simulations of the above model using a stochastic lattice representation of the basal layer, extending the model introduced by Klein et al (2008) that proposed committed progenitors allowing the maintenance of the epithelium through random fate choice. In this simulation, we allowed spatial and temporal modulation of cell turnover by a HF‐derived physical or chemical factor (Fig 6B and C). Specifically, we assumed that the rate of migration of the post‐mitotic cells out of the basal layer is enhanced during anagen in the neighbourhood of each HF. This creates an increased rate of proliferation of progenitor cells (CP) that divide according to a random fate as proposed by Clayton et al (2007). A similar signalling mechanism may also regulate the activation of the slowly cycling cell population away from active HFs during injury or animal growth. We used this model and integrated the five‐colour staining in computer simulations. The results were consistent with the core observations presented above: (i) higher proportion of large clones attached to HF than predicted by chance (Fig 6B); (ii) increased number of CPs during anagen; (iii) slow cycling of non‐attached clones; (iv) clone size evolution and density of small and large clones according to observations made in adult animals (Fig 6C). The simulations were also compared to the Klein model (i.e. not taking into account hair follicles), clearly demonstrating that the latter could not explain observed results.
Finally, we performed a range of sensitivity analyses to evaluate the robustness of the model and its dependence on the chosen parameters. The migration and proliferation rates were calibrated using experimental clone size. We found that the best agreement with experimental data was obtained when basal cell proliferation was assumed to be in the range of 0.1–0.03/week/cell during telogen, increasing to 3/week/cell during anagen for areas in proximity of follicles. However, the results were relatively insensitive to changing the proliferation rate. We also found best agreement with experimental data when the size of the HF neighbourhood activated in anagen was in the range of 10–30 basal cells; for either larger or smaller sizes of the neighbourhood, the correlation of clone growth to HF location became weaker, approaching the model without active HFs and the corresponding theoretical prediction (Fig EV5A and B). These theoretical models were compared to the observations by calculating the root‐mean‐square of the deviation. The Klein model as well as a model including a HF influencing a large number of cells (49) in its vicinity had a higher deviation from observations than a model where hair follicles had an influence on the 21 cells in their immediate surroundings (Appendix Table S1).
Figure EV5. Sensitivity analysis of the proposed model.
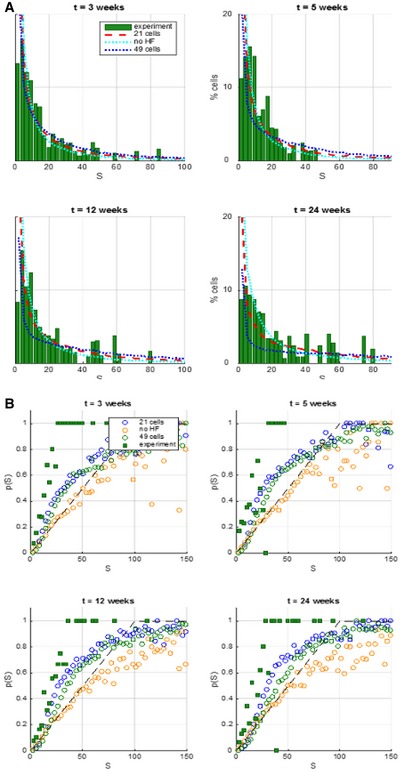
- Plots show the probability for an individual keratinocyte to belong to a clone of a given size. Experimental data are represented in green bars. Theoretical curves take into account the possibility of colour overlap.
- The panels show the probability for a clone to be attached to hair follicles (p(S)) as a function of its size (S). At each time point, three sets of data were figured: values detected experimentally (green squares) versus values produced by simulating the Klein model (orange circles) and values obtained from simulations of the extended model, including the periodic activation of HFs enhancing the rate of migration of post‐mitotic cells in a circular neighbourhood of 21 cells (blue circles) or 49 cells (green circles) around the active HFs.
Discussion
We here used multicolour lineage tracing to track individual keratinocytes in mice and report two modes of clonal progression in the interfollicular epidermis. Fast‐growing clones were attached to hair follicles and increased in size during anagen; in relation with this finding, proliferation in the IFE was induced during anagen phase. On the other hand, clones distant from hair follicles were small in size, contained label‐retaining cells and were therefore slow cycling; however, they could be mobilized by a proliferative stimulus. Modelling suggested that a modified Klein model where committed progenitors expand in response to a signal around the hair follicle essentially during anagen can explain the observed results without the presence of a hierarchy between fast‐ and slow‐cycling clones (Fig 6D).
Previous attempts to understand the homeostasis of Malpighian epithelia have resulted in different studies. Indeed in the ear, palm and oesophagus epidermis, there have been reports of a single population of progenitors that allows the maintenance of the epithelium through random fate choice as described by Klein et al (Doupe et al, 2010, 2012; Lim et al, 2013), without any slow‐cycling stem cells. The clonal dynamics described in the current study could not be explained by this simple model. Lineage tracing using K14Cre/ER resulted in two modes of clonal behaviour. A large majority of clones were slow cycling. This is in line with a previous report using K14Cre/ER (Mascre et al, 2012) or observation proliferation behaviour in the IFE (Sada et al, 2016) that also found two modes of clonal progression in the tail epidermis. Similar to our findings, quiescent clones could be mobilized by wounding or phorbol esters. They could also retain nuclear labels for long periods. Slow‐cycling cells in the tail were located at the junction between scale and interscale parts of the epidermis (Mascre et al, 2012; Sada et al, 2016). This spatial distribution of label‐retaining cells is strongly in support of our findings suggesting that they are distant from hair follicles. Most importantly, in support of our mathematical modelling, Sada et al demonstrated the possibility of exchange between the two compartments through lineage tracing.
The use of multicolour lineage tracing and semi‐sparse labelling allowed us in the present study to explore IFE renewal through a new angle. Although this labelling mode could result in overlapping clones that harboured the same colour, we showed that this represented only a small proportion of clones and that correction of clonal overlap using computer simulations did not significantly affect our findings. Indeed, these were further verified by the use of rare colour labels or low‐density labelling. Helped by high‐density staining, the global surfaces represented by each clone category could be estimated. Our mathematical modelling suggests that fast‐cycling progenitors in the vicinity of follicles give rise to progeny that is no longer connected to the HF environment and therefore behaves differently. This also supported by the recent report by Sada et al (2016) suggesting that quiescent and proliferative compartments within the epidermis can contribute to different IFE compartments. Although we cannot formally rule out a hierarchical relationship between these two categories, our results suggest that progenitor environment is more important than their intrinsic properties. This is highly reminiscent of stem cells that require to be maintained in a specific niche. In our case, distant areas from hair follicles to be defined at the cellular or molecular level define the niche for IFE slow‐cycling cells. It could be argued that within this specific environment away from the hair follicle stimulation, epidermal progenitors behave in a manner described previously for stem cells in epidermal proliferative units, maintaining small columns of epidermal cells (Potten, 1974). In the present study, many clones were found to remain of a small size for months and contributed only to a single column of the epidermis as in early descriptions of epidermal proliferative units. These clones were distant from hair follicles and behaved differently from clones attached to hair follicles. Our results are strongly supportive of these past observations for IFE areas distant from the hair follicles.
These findings are of importance in our understanding of IFE homeostasis. The presence of cycling hair follicles in the dorsal epidermis is clearly a key feature of that epithelium, shown here to result in the existence of two categories of IFE clonal dynamics. This situation, however, differs in epithelial areas with no appendages. In particular, our findings may imply also the existence of different dynamics in scalp versus glabrous skin epidermis in humans. Identifying the factors mediating the effect of hair follicle cycling on surrounding skin progenitors will be key to further understand how skin progenitor behaviour is spatiotemporally controlled in different skin models.
Materials and Methods
Mice
Rainbow mice (CAG‐Brainbow‐1.0) have been previously described (Tabansky et al, 2013). Skinbow mice were generated by crossing the Rainbow3 line with K14‐CreER mice (Vasioukhin et al, 1999). All mouse husbandry and experimental procedures were approved by the University of Queensland Health Sciences animal ethics committee. Recombination in Skinbow mice was induced at P21 or at P42 with 1 mg/mouse/day for five consecutive days (5 mg total) of tamoxifen for high dose and with a single injection of 0.3 mg of tamoxifen for low‐dose induction (Sigma‐Aldrich, St. Louis, MO, USA), and observations were performed at 3, 5, 12 and 24 weeks afterwards.
Sample preparation
Upon sacrifice, mouse tail or back skin was treated with Veet cream to remove hair follicles. Areas in anagen recognized by their pigmentation on C57Bl/6 background were collected separately from unpigmented areas in telogen. Tissue samples were fixed in 4% PFA for 2 h. Whole mount samples or 3‐mm‐thick cryosections were incubated in 0.03 μg/ml 4′,6‐diamidino‐2‐phenylindole (Roche Applied Science, Mannheim, Germany) at 4°C overnight and cleared in FocusClear™ for 2–5 days (Celexplorer Labs Co, Taiwan). Samples were then mounted in the same medium on single concave microscope slides (Sail Brand, China).
Confocal microscopy
Confocal images were acquired with a Zeiss LSM 710 microscope using a 405‐nm diode laser for DAPI (detector 1, main beam filter MBS‐405, 414–463‐nm barrier filter), a 458‐nm Argon line for Cerulean (detector 2, main beam filter MBS‐458, 464–502‐nm barrier filter), a 514‐nm Argon line for YFP (detector 3, main beam filter MBS‐458/514, 512–570‐nm barrier filter) and a 561‐nm photodiode laser for dTomato (detector 3, main beam filter MBS‐488/561, 562–611‐nm barrier filter). Image stacks for all four channels were acquired sequentially using a 10 × 0.45 objective, 20 × 0.8 objective and 40 × 1.2W objective. In all images, YFP was represented in yellow, dTomato in red and Cerulean in blue. Details of image processing, scoring and analysis are provided in Expanded View Information.
Author contributions
KK designed the research. ER, SH, HYW and JL performed experiments. KK, ER and JL analysed images. ZN and LC analysed results and performed mathematical modelling. ER, KK, JL and ZN wrote the manuscript that was further edited by other authors.
Conflict of interest
The authors declare that they have no conflict of interest.
Supporting information
Appendix
Expanded View Figures PDF
Review Process File
Acknowledgements
This work was supported by the Australian Research Council Discovery Project DP130104777. ER was supported by National Health and Medical Research Council project grant 1049341. KK was supported by the National Health and Medical Research Council Career Development Fellowship 1023371. JL was supported by ERC‐CoG, Fondation pour la Recherche Médicale and ANR‐10‐LABX‐65 (LabEx LifeSenses). ZN was supported by Australian Research Council Future Fellowship FT130100659. We thank A/Prof Nicholas Saunders, A/Prof Pritinder Kaur and Dr. Fiona Simpson for helpful discussions.
The EMBO Journal (2016) 35: 2658–2670
See also: S Ulyanchenko & KB Jensen (December 2016)
References
- Barrandon Y, Green H (1987) Three clonal types of keratinocyte with different capacities for multiplication. Proc Natl Acad Sci USA 84: 2302–2306 [DOI] [PMC free article] [PubMed] [Google Scholar]
- Clayton E, Doupe DP, Klein AM, Winton DJ, Simons BD, Jones PH (2007) A single type of progenitor cell maintains normal epidermis. Nature 446: 185–189 [DOI] [PubMed] [Google Scholar]
- Doucet YS, Woo SH, Ruiz ME, Owens DM (2013) The touch dome defines an epidermal niche specialized for mechanosensory signaling. Cell Rep 3: 1759–1765 [DOI] [PMC free article] [PubMed] [Google Scholar]
- Doupe DP, Klein AM, Simons BD, Jones PH (2010) The ordered architecture of murine ear epidermis is maintained by progenitor cells with random fate. Dev Cell 18: 317–323 [DOI] [PubMed] [Google Scholar]
- Doupe DP, Alcolea MP, Roshan A, Zhang G, Klein AM, Simons BD, Jones PH (2012) A single progenitor population switches behavior to maintain and repair esophageal epithelium. Science 337: 1091–1093 [DOI] [PMC free article] [PubMed] [Google Scholar]
- Gomez C, Chua W, Miremadi A, Quist S, Headon DJ, Watt FM (2013) The interfollicular epidermis of adult mouse tail comprises two distinct cell lineages that are differentially regulated by Wnt, Edaradd, and Lrig1. Stem Cell Reports 1: 19–27 [DOI] [PMC free article] [PubMed] [Google Scholar]
- Hodgson SS, Neufeld Z, Villani RM, Roy E, Khosrotehrani K (2014) Transgenic flash mice for in vivo quantitative monitoring of canonical Wnt signaling to track hair follicle cycle dynamics. J Invest Dermatol 134: 1519–1526 [DOI] [PubMed] [Google Scholar]
- Ito M, Liu Y, Yang Z, Nguyen J, Liang F, Morris RJ, Cotsarelis G (2005) Stem cells in the hair follicle bulge contribute to wound repair but not to homeostasis of the epidermis. Nat Med 11: 1351–1354 [DOI] [PubMed] [Google Scholar]
- Kameda T, Nakata A, Mizutani T, Terada K, Iba H, Sugiyama T (2003) Analysis of the cellular heterogeneity in the basal layer of mouse ear epidermis: an approach from partial decomposition in vitro and retroviral cell marking in vivo . Exp Cell Res 283: 167–183 [DOI] [PubMed] [Google Scholar]
- Klein AM, Doupe DP, Jones PH, Simons BD (2008) Mechanism of murine epidermal maintenance: cell division and the voter model. Phys Rev E Stat Nonlin Soft Matter Phys 77: 031907 [DOI] [PubMed] [Google Scholar]
- Kolodka TM, Garlick JA, Taichman LB (1998) Evidence for keratinocyte stem cells in vitro: long term engraftment and persistence of transgene expression from retrovirus‐transduced keratinocytes. Proc Natl Acad Sci USA 95: 4356–4361 [DOI] [PMC free article] [PubMed] [Google Scholar]
- Levy V, Lindon C, Harfe BD, Morgan BA (2005) Distinct stem cell populations regenerate the follicle and interfollicular epidermis. Dev Cell 9: 855–861 [DOI] [PubMed] [Google Scholar]
- Li A, Simmons PJ, Kaur P (1998) Identification and isolation of candidate human keratinocyte stem cells based on cell surface phenotype. Proc Natl Acad Sci USA 95: 3902–3907 [DOI] [PMC free article] [PubMed] [Google Scholar]
- Lim X, Tan SH, Koh WL, Chau RM, Yan KS, Kuo CJ, van Amerongen R, Klein AM, Nusse R (2013) Interfollicular epidermal stem cells self‐renew via autocrine Wnt signaling. Science 342: 1226–1230 [DOI] [PMC free article] [PubMed] [Google Scholar]
- Livet J, Weissman TA, Kang H, Draft RW, Lu J, Bennis RA, Sanes JR, Lichtman JW (2007) Transgenic strategies for combinatorial expression of fluorescent proteins in the nervous system. Nature 450: 56–62 [DOI] [PubMed] [Google Scholar]
- Mascre G, Dekoninck S, Drogat B, Youssef KK, Brohee S, Sotiropoulou PA, Simons BD, Blanpain C (2012) Distinct contribution of stem and progenitor cells to epidermal maintenance. Nature 489: 257–262 [DOI] [PubMed] [Google Scholar]
- Page ME, Lombard P, Ng F, Gottgens B, Jensen KB (2013) The epidermis comprises autonomous compartments maintained by distinct stem cell populations. Cell Stem Cell 13: 471–482 [DOI] [PMC free article] [PubMed] [Google Scholar]
- Potten CS (1974) The epidermal proliferative unit: the possible role of the central basal cell. Cell Tissue Kinet 7: 77–88 [DOI] [PubMed] [Google Scholar]
- Ro S, Rannala B (2004) A stop‐EGFP transgenic mouse to detect clonal cell lineages generated by mutation. EMBO Rep 5: 914–920 [DOI] [PMC free article] [PubMed] [Google Scholar]
- Roy E, Neufield Z, Livet J, Khosrotehrani K (2014) Understanding clonal dynamics in homeostasis and injury through multicolour lineage tracing. Stem Cells 32: 3046–3054 [DOI] [PubMed] [Google Scholar]
- Sada A, Jacob F, Leung E, Wang S, White BS, Shalloway D, Tumbar T (2016) Defining the cellular lineage hierarchy in the interfollicular epidermis of adult skin. Nat Cell Biol 18: 619–631 [DOI] [PMC free article] [PubMed] [Google Scholar]
- Schluter H, Paquet‐Fifield S, Gangatirkar P, Li J, Kaur P (2011) Functional characterization of quiescent keratinocyte stem cells and their progeny reveals a hierarchical organization in human skin epidermis. Stem Cells 29: 1256–1268 [DOI] [PubMed] [Google Scholar]
- Tabansky I, Lenarcic A, Draft RW, Loulier K, Keskin DB, Rosains J, Rivera‐Feliciano J, Lichtman JW, Livet J, Stern JN, Sanes JR, Eggan K (2013) Developmental bias in cleavage‐stage mouse blastomeres. Curr Biol 23: 21–31 [DOI] [PMC free article] [PubMed] [Google Scholar]
- Vasioukhin V, Degenstein L, Wise B, Fuchs E (1999) The magical touch: genome targeting in epidermal stem cells induced by tamoxifen application to mouse skin. Proc Natl Acad Sci USA 96: 8551–8556 [DOI] [PMC free article] [PubMed] [Google Scholar]
Associated Data
This section collects any data citations, data availability statements, or supplementary materials included in this article.
Supplementary Materials
Appendix
Expanded View Figures PDF
Review Process File