

Abstract
Understanding the complexity of cancer biology requires extensive information about the cancer proteome over the course of the disease. The recent advances in mass spectrometry-based proteomics technologies have led to the accumulation of an incredible amount of such proteomic information. This information allows us to identify protein signatures or protein biomarkers, which can be used to improve cancer diagnosis, prognosis and treatment. For example, mass spectrometry-based proteomics has been used in breast cancer research for over two decades to elucidate protein function. Breast cancer is a heterogeneous group of diseases with distinct molecular features that are reflected in tumour characteristics and clinical outcomes. Compared with all other subtypes of breast cancer, triple-negative breast cancer is perhaps the most distinct in nature and heterogeneity. In this review, we provide an introductory overview of the application of advanced proteomic technologies to triple-negative breast cancer research.
Graphical Abstract
Introduction
Breast cancer is arguably one of the most extensively studied cancers. Despite tremendous advancements in breast cancer research and treatment, it is still one of the leading causes of cancer-related deaths among women and a major health problem in the developed world. Over 1.7 million women are diagnosed with breast cancer, worldwide, representing about 12% of all new cancer cases and about 25% of all cancers in women and over half a million women die from the disease each year1. Although the overall breast cancer-related mortality rate has slightly declined, the American Cancer Society projects more than 246,660 new cases of breast cancer with over 40,450 deaths of American women each year2. Additionally, while many patients are treated successfully, one third of breast cancer patients experience cancer metastasis or recurrence in their lifetime3. Many of the differences in disease progression are because breast cancer is not a single disease but rather a heterogeneous group of diseases with distinct pathological, morphological, and molecular features with clinical outcomes depending on tumour characteristics. The further molecular characterization of each breast cancer subtype would enable us to develop subtype specific treatments with resulting increases in breast cancer survival rates.
Breast cancer is caused by several factors including an accumulation of chromosomal aberrations of either genetic or environmental origin4. These abnormalities range from DNA point mutations to chromosomal defects such as chromosomal instability, copy number variation, translocation, and epigenetic alteration4. In recent decades genomic and transcriptomic technologies have led to the identification and characterization of several breast cancer-related genes. These include BRCA15, ErBB26 (also known as HER2), ESR17 (also known as ER) and protein kinases, such as ATM,8 that acquire driver mutations in certain human breast cancers9. The advent of cDNA microarray technology and subsequently RNAseq has enabled us to look at global patterns of gene expression in breast cancer cells, which can be classified according to distinct molecular characteristics10. However, gene expression patterns do not necessarily reflect proteome pattern of diseased cells. Cellular protein regulation is a dynamic process controlled by translation, post-translational modifications, protein stability and protein degradation11. Characterisation of proteomes is now possible using MS-based quantitative proteomics, which is capable of sensitive protein identification and quantitation. We can examine the cancer proteomes that are responsible for functional cellular changes with high accuracy and supplement our understanding of genomic and transcriptomic changes to achieve a more sophisticated understanding of the molecular causes of different breast cancers11.
Proteomics technologies allow us to quantitatively examine large numbers of proteins in complex protein mixtures and to map post-translational protein modifications under different circumstances. Considering the heterogeneity and complexity of carcinogenesis, proteomics technologies provide suitable tools for investigating the complex network of protein interactions that cannot be examined using the classical one-gene-one-protein approach. Therefore, proteomics has emerged as an integral part of modern biomedicine. For example, proteomics tools have been used for both cancer diagnosis and therapy selection as well as for researching the underlying mechanisms of disease pathogenesis and progression 12–14. Specifically, one recent proteomic-based breast cancer study uncovered clinically distinct protein signatures for different histologically graded tumors12. Another study developed a triple-negative breast cancer-specific protein profile13 and a study by Tyanova et al. characterised functional differences between different breast cancer subtypes14.
In this review, we present a comparative overview of the different labelled and label free quantitative proteomics techniques used to address various biological parameters. We will examine their effectiveness in elucidating the protein signatures in breast cancer subtypes and especially triple-negative breast cancer, and their overall impact on molecular breast cancer research.
Non-mass spectrometry-based proteomic platforms in cancer research
Proteomic studies are varied, but can be categorized based on whether or not MS is used in the analysis pipeline. While most MS-based proteomic studies allow us to examine protein mixtures without prior biological knowledge of the protein content10, prior knowledge of the targeted protein is a prerequisite for non-MS based approaches. For instance, non-MS techniques such as Western blotting, enzyme-linked-immunosorbent assay (ELISA), immunohistochemistry (IHC), immunocytochemistry (ICC), and recently protein microarray (PMA) and tissue microarray (TMA) analyses, all require specific antibodies to examine target proteins. Many of these non-MS based technologies are very useful for addressing particular problems. For example, TMA analysis, a large-scale tissue protein analysis technique15, has become one of the most popular proteomic approaches in cancer research. TMA can be used to simultaneously analyse millions of cylindrical sections of paraffin block tissue samples for the presence of a unique protein marker or for a set of proteins providing a ‘protein signature’. The IHC-based TMA analysis technique is reliable and cost effective, making it a potent tool in investigative pathology10. However, the proteome coverage is limited by the availability of high quality, validated antibodies.
Another non-MS based technique, the protein array, is a “bait and prey” protein based signal-detection technology analogous to the cDNA microarray16. Typically 150–200 protein probes (for example specific antibodies) are immobilized on a solid surface for the quantification of their binding partners across thousands of samples, for example breast cancer samples16 and pan-cancer samples11. A related technique called reverse phase protein array (RPPA), has been used with 3,467 patient samples from 11 different cancer types, and has revealed that the expression of HER2 is less frequent in breast cancer than in serous endometrial cancer11. This study also found that HER2 is expressed more frequently at higher levels in bladder, colorectal and lung cancers, a finding that had not been predicted by a study focused on levels of mRNA expression11.
Despite significant impacts on cancer research, both the availability of and the high costs associated with producing suitable antibodies limit the wide application of non-MS techniques. Additionally, cancer is often heterogeneous in nature, with differential expression of numerous proteins affecting many biological processes. Therefore, screening methods are warranted that interrogate entire human proteomes in an unbiased fashion, rather than just a few selected proteins. Among proteomics tools, MS has become one of the most versatile and useful instruments in cancer research. MS-based proteomic research has allowed the global analysis of proteomes, which has resulted in the discovery of new protein signatures for breast cancers14, and better understanding of breast cancer development and progression17. Recent advances in quantitative proteomics have moved beyond simple protein detection to reliable protein quantitation in different biological samples18.
Quantitative mass spectrometry-based proteomic strategies in cancer research
The rapid advancement of mass spectrometry-based technologies in terms of mass accuracy, sequencing speed, resolution, power, and cost effectiveness provides a unique opportunity to accurately and rapidly profile cancer proteomes19. Powerful mass spectrometers such as the Q-TOF, TOF/TOF, Q-OT and Q-Exactive have high resolution, sensitivity, and sub-ppm mass accuracy, which makes them well-suited for shotgun proteomics approaches aimed at quantifying hundreds to thousands of proteins in a biological sample20,21.
Just a decade ago, gel-based mass spectrometry analysis was the technique of choice (and still widely used today). However, gel-free shotgun proteomics technologies, which allow for high-throughput quantitative analysis of protein specimens in a non-targeted manner22, now lead the way. In particular, multidimensional protein identification technology (MudPIT), a gel-free proteomic approach which couples multidimensional chromatography with mass spectrometry, enabling us to sensitively quantitate and detect proteins 23. In shotgun proteomics, samples are lysed or homogenized and extracted proteins are enzymatically digested into peptides, typically with trypsin. The peptides are then separated by liquid chromatography (LC) and sprayed directly into the mass spectrometer using electrospray ionization. The heterogeneous mixture of ionised peptides is then analysed. They are separated based on their mass-to-charge (m/z) ratios, and populations of peptides with a particular value of m/z can then be isolated for further characterization in an MS/MS analysis. The peptides in this now homogeneous population are fragmented using resonance excitation in a radio frequency dynamic electric field (a process called collision-induced dissociation or CID). Product ions generate an MS/MS spectrum, characteristic of a particular peptide sequence23. Using a variety of algorithms, the amino acid sequences of all peptides characterized in this way are determined from the MS/MS spectra. The peptide sequences are then used to infer and assemble a list of proteins that were present in the original sample24. In the following section, we will briefly discuss and compare the different techniques for quantitating proteins identified in this way.
i) Stable labelling approaches
To accurately quantify proteins, several unique stable labelling strategies have been developed. These strategies include enzymatic25, chemical 26, and metabolic labelling27. Each approach has particular strengths and weaknesses28. All three approaches use stable isotopes, which are incorporated into proteins or peptides of different samples. The stable isotopes change the masses of similar peptide fragments in one sample compared with the other, with no other effect on the biophysical and chemical properties of the labelled peptides or proteins29. These small mass differences in peptide fragments between “heavy” or “light” samples result in a shift in m/z values. Heavy and light samples are mixed prior to introduction into the mass spectrometer, thus labelled peptides will produce a doublet of m/z values. Relative protein abundances can be calculated based on characteristics such as the relative peak heights for the distinguishable m/z values.
Metabolic labelling
Metabolic labelling is often the preferred technique as this strategy allows for early incorporation of label in the sample preparation process and reduces error in protein quantification29. 15N-enriched cell growth media was used in early metabolic labelling studies using S. cerevisiae30 and bacteria31, and later with higher eukaryotes32. Although 15N labelling has been used with mammalian cells31, it is incompatible with many cell culture protocols because of low 15N-enrichment in serum33. To overcome this limitation, stable isotope labelling by amino acids in cell culture (SILAC), was introduced by Mann and co-workers as a technique that is highly compatible with mammalian cell culture34. With SILAC, cells are cultured with growth medium containing isotopically labelled amino acids (Figure 1A, left panel). These labelled amino acids are incorporated in newly synthesised proteins. As there are no in vitro chemical reactions required, SILAC is straightforward and easy to adopt. A SILAC based comprehensive proteomics study of mixed-lineage leukaemia (MLL) revealed a potential novel biomarker in MLL leukemia35. Another SILAC-based study led to the discovery that CXCL10, a cytokine, was upregulated in TbetaRII knockout mammary fibroblasts involved in breast tumour cell proliferation and migration36. This proteomic technique has also been used in the study of signalling37 and drug resistance38. Recently Tyanova et al. discovered a signature of 12 proteins in different breast cancer subtypes in their SILAC-based comprehensive breast cancer study14. There are also drawbacks with using metabolic labelling methods such as SILAC. First, their use is restricted to labelling proteins in cell culture and such labelling methods can’t be used to investigate primary tissues such as patient tumour samples. Even though such methods can be applied to study cultured cancer cells, some of the carcinogenic properties of these cells may have been lost during culture, and additional verification of their carcinogenic properties may be needed before metabolic labelling. Second, the high cost of labelling reagents can limit their use in research.
Figure 1. Quantitative proteomic analyses using either labelling or label free approaches.

A, Labelling two samples using either metabolic (left panel) or chemical (right panel) labelling. In metabolic labelling or SILAC, cells are cultured in medium containing either light or heavy amino acids (for example 12C or 13C containing arginine and lysine). Whole cell extracts can then be combined prior to an optional protein purification step. After protein digestion, peptides are chromatographically separated and sprayed into the mass spectrometer. Otherwise identical heavy (green) and light (blue) peptides have similar chromatographic properties and coelute. The fragmentation patterns of such peptides can be distinguished in an MS/MS spectrum from the shift in mass/charge ratios (blue vs green spectral lines). The different characteristics of these two fragmentation patterns (for example relative peak height) allow quantitation. For chemical labelling, either the proteins purified from two samples (ICAT), or the peptides from the protein digest (ITRAQ), can be chemically labelled with suitable reagent (red and blue labelled peptides). These reagents do not change the chromatographic properties of the peptides but again result in a shift in fragmentation pattern in the MS/MS spectrum (red vs blue spectral lines). B, Label free quantitation. Peptides obtained from either “experiment” or “control” cells are analysed in separate mass spectrometry runs. For a particular peptide, the total number of MS/MS spectra generated during the mass spectrometry run is used for relative quantitation.
Enzymatic labelling
Enzymatic approaches allow for stable isotopic labelling of peptides, typically with 18O. One or two 18O atoms can be introduced into the carboxyl terminus of proteolytically generated peptides using different enzymes. One or two 16O atoms are replaced by 18O atoms on the C-terminal carboxyl group of proteolytic peptides by class-2 proteases such as trypsin in the presence of 18O enriched water. The reaction results in a 4 Da mass difference between two differently labelled peptides, producing a shift in the m/z value from the labelled peptide in the MS1 spectrum39. Sprinson and Rittenberg first introduced 18O protein labelling for MS-based quantification40, and Yao et. al., subsequently adopted this labelling technique for shotgun proteomics25. In one quantitative breast cancer study, five different breast cancer cell lines were stably labelled with 18O to compare their proteomes, to quantify differentially expressed proteins, and to identify the corresponding pathways associated with specific phenotypes. It revealed a group of 86 proteins that were highly expressed in cancer cell lines compared with non-cancer cell lines41. Although this technique is very versatile, simple and cheap, it has not become a popular method for stable isotope labelling in comparative proteomics29. The main downside of this labelling method is the variable degree of incorporation of two 18O atoms into the proteolytic peptides42. This results in complicated data analysis and interpretation.
Chemical labelling
Chemical labelling methods have several advantages over other labelling approaches. Since chemical labelling is compatible with different kinds of biological samples, such as cultured cells, tissues and body fluids, a wide range of sample types can be analysed. Unlike metabolic labelling, the different mass tags are incorporated into the proteins or peptides by a chemical reaction. Several chemical labelling strategies that have received considerable attention include isotope-coded affinity tag (ICAT)26, Isobaric tags for relative and absolute quantitation (iTRAQ)43 and tandem mass tags (TMT)44. In 1999, Gygi et. al., introduced the chemical labelling method ICAT26. The ICAT reagent consists of an affinity tag (biotin), followed by a linker region of variable mass, and then by an iodo acetyl group, which is used to covalently bind the reagent to the free sulfhydryl groups of cysteines in denatured proteins26. Two protein samples can be labelled with the heavy (deuterium containing linker) or light (hydrogen containing linker) versions of the reagents. The samples are then mixed and proteolysed. The ICAT tagged peptides are enriched using biotin-streptavidin affinity chromatography, and then quantitatively analysed by mass spectrometry. Equivalent peptides from the two samples, which are otherwise identical apart from the labelled cysteines, can be distinguished as separate peaks in the mass spectrum as the heavy and light labels have a mass difference of 8 Da. Although ICAT has been considered for its potential application in protein profiling in clinical tissue samples45, only a few studies have used ICAT based approaches with serum or plasma samples to study breast cancer. Kang et al., for example, used ICAT to profile a breast cancer plasma proteome and their results revealed biotinidase as a breast cancer biomarker46. The main drawback of ICAT is that it cannot detect peptides lacking unmodified cysteines, since the ICAT reagent specifically reacts with thiol group of cysteines29.
Two similar isobaric chemical labelling strategies for relative and absolute quantification (iTRAQ and TMT) have become methods of choice. These reagents are designed for multiplex experiments: they can be used to differentially label multiple samples and so different time points and treatment conditions can be compared in the same experiment. In these methods, samples are proteolysed and the peptides are labelled separately with different isotopic variants of iTRAQ and TMT (Figure 1A, right panel). The samples are then combined for quantitative mass spectrometry analysis to determine relative protein abundance28. Isobaric labelling techniques deliver a wider multiplexing capacity and analytical throughput than other labelling strategies47. For example, iTRAQ allows simultaneous comparison of eight samples47 and TMT can be used with up to 90 samples48 combined in a single LC-MS/MS analysis. The latest 12-Plex ‘DiLeu’ isobaric tags are cheaper as reagents can be readily synthesized in-house47 unlike other members in these strategies. Both iTRAQ and TMT strategies have been broadly employed in cancer studies for drug discovery49, investigating cancer signaling50, as well as for investigating diagnostic and prognosis markers51. iTRAQ has also been employed to predict cancer recurrence and patient survival in triple negative breast tissue samples52. Although these approaches have shown merit, they are less accurate and sensitive compared with SILAC, as the tag is added at a later stage of the procedure, resulting in lower proteome coverage53.
ii) Label-free quantitative proteomics
Unlike other shotgun strategies, with label-free proteomics approaches, protein samples are typically digested into peptides and analysed by mass spectrometry without adding any stable isotopic or chemical labels28 (Figure 2B). Instead of mixing two labelled samples prior to a single mass spectrometry run, two unlabelled samples are analysed using separate chromatography/mass spectrometry runs. Using the MudPIT technique, peptides are resolved using multidimensional chromatography and electrosprayed directly for analysis by tandem mass spectrometry. The resulting product-ion mass spectra (MS/MS spectra), are used to identify the selected peptide and hence the original protein54. A typical MudPIT run takes about 20 hours of mass spectrometer time and generates about 200, 000 MS/MS spectra, each one corresponding to a short peptide sequence. Various characteristics of the spectra can be used to estimate relative peptide abundance from run to run, and hence relative protein abundance from sample to sample. Quantitation methods include MS/MS spectral counting55,56, and MS peak area measurement57. Each of these methods uses a single parameter to estimate protein abundance, thereby limiting the accuracy of the quantitation. The normalised spectral index (SIN) strategy, which combines several measured parameters, was developed to try to improve quantitation accuracy. This strategy combines the spectral count (number of MS/MS spectra per peptide), the unique peptide number, and the fragment-ion (MS/MS) intensities to obtain accurate protein quantification58. Another approach is to calculate the normalised spectral abundance factor (NSAF)59 and distributed NSAF (dNSAF)60 to obtain more accurate protein quantification. In brief, the spectral abundance factor (SAF) for a particular protein is the number of MS/MS spectra for the protein divided by the length of the protein. To account for run-to-run variation, SAF values are divided by the sum of all SAF values in the sample (NSAF). A further refinement to the calculation distributes peptides shared by multiple proteins based on the number of unique peptides assigned to a protein. Label free analysis has also benefitted from improved software (such as MaxQuant61, Skyline62) and improved search capabilities (ultra-tolerant database54) for accurate identification and precise quantification.
Figure 2. Number of breast cancer-related quantitative proteomics publications per year.

An Entrez text query of PubMed was performed with the phrases A) ‘breast cancer quantitative proteomics’ (Quantitative Proteomics), and B) ‘breast cancer label free quantitative proteomics’ (Label Free), ‘breast cancer SILAC quantitative proteomics’ (SILAC), or ‘breast cancer iTRAQ quantitative proteomics’ (iTRAQ).
Over the last few decades, the technical progression of label-free quantitative approaches has made label free quantitative proteomics strategies powerful approaches in cancer research, with constant improvements both in LC-MS equipment and in software for data analysis63. Label-free quantitation allows simultaneous identification and quantification of proteins, without the need for tedious and expensive labelling process, and can be used with samples from any sources28. As each sample of interest is prepared and analysed separately by LC-MS/MS, samples can be compared in different ways in different analyses64. As a result, there is no limit to the number of samples which can be compared and higher proteome coverage can be attained as there is no mixing of samples in the experiment. Label-free quantification methods offer high analytical depth, dynamic range and modest quantitative precision well suited for observing large global protein expression changes. Therefore, label-free proteomics approaches have become the methods of choice (Figure 2) for biomarker discovery and clinical proteomics65. Label-free approaches are sometimes described as “semiquantitative” because of poor quantitative accuracy for low abundant protein samples28. However, in recent years a number of strategies have been introduced to enhance proteome coverage, precision and accuracy in protein identification and quantification. For example, Liu et al. reported a pipeline for label-free quantitative proteomics which showed great reproducibility and precise and accurate quantification of thousands of peptides and proteins in their laser captured microdissection (LCM) driven breast tissue samples18. Furthermore, the same research group recently demonstrated that a label-free quantification approach outperformed stable labelling strategy (SILAC) in terms of dynamic range and proteome coverage of LCM tissue samples 65, further highlighting the potential applications of label-free proteomics in routine clinical applications for cancer treatment, for example breast cancer.
The landscape of breast cancer
Breast Cancer Tumours
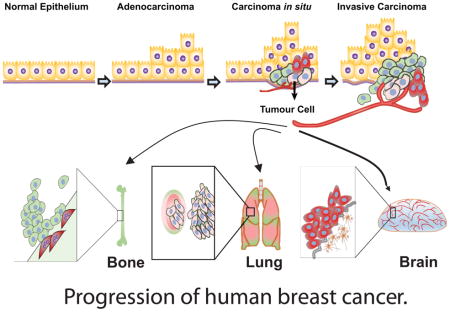
Breast cancer is a highly heterogeneous group of cancers, with diversity in its morphology, molecular genetics, biology, and clinical outcome. Adenocarcinoma is a cancer of the epithelium that originates in glandular tissue and most breast cancers start as adenocarcinoma. Adenocarcinoma progresses into ductal carcinoma in situ (DCIS), also arising from the ductal epithelium, or lobular carcinoma in situ (LCIS), which originates from the epithelium of the lobules. The most common kind of breast cancer, invasive ductal carcinoma (IDC) also called infiltrating ductal carcinoma, and infiltrating lobular carcinoma (ILC), grows from DCIS and LCIS respectively66. The invasive tumour cells metastasize preferentially to the bones, lungs and brain (Figure 3).
Figure 3. Progression of human breast cancer.

Normal epithelium of glandular tissues alters into malignant adenocarcinomas, then becomes tumorigenic (carcinoma in situ) and subsequently develops into invasive carcinomas. Preferential metastatic sites of breast malignant tumour cells are to the bones and lungs. Triple negative breast cancer cells have tendency to metastasize to the brain.
The biology of breast tumours remains poorly understood, although several measures have been undertaken to distinguish tumour features according to tumour grade, stage, and gene profile. Grading is based on the microscopic structure of the tumour and scaled from 1–3, from the least aggressive in appearance to the most aggressive. The stages are classified from non-invasive Stage 0 to the highly metastatic Stage IV, based on measurements of the tumour, lymph node involvement, and the metastatic spread67.
Molecular classification of breast cancer subtypes
Traditionally four different breast cancer subtypes have been identified based on expression of three molecules: oestrogen receptors (ER), progesterone receptor (PR), and human epidermal growth factor receptor 2 (HER2). One of these subtypes, triple-negative breast cancer (TNBC), is characterised by the absence of all three receptors. Recent studies have aimed to develop a more sophisticated understanding of different breast cancer subtypes based on global gene expression patterns. For example, in 2000 Perou et al. examined dozens of breast tumours and analysed both global patterns of gene expression and gene copy number variation. Their analyses defined several novel molecular classes of breast cancer based on these global characteristics, termed “intrinsic subtypes”66. Subsequent studies supported their findings and found additional breast cancer subclasses11,67. Breast cancer subtypes can be classified according to their molecular features (Table 1) as: 1) Basal-like (Triple-negative), 2) Luminal A, 3) Luminal B, and 4) HER2-positive, and additionally Normal-like and Claudin-low 70. Most, but not all, basal-like tumours are triple-negative breast cancers. A recent large scale genomic-transcriptomic integrated study re-clustered the current subtypes into 10 different molecular breast cancer subtypes71. However, these subtype classifications have not yet been used in clinical practice14.
Table 1.
Molecular subtypes of breast cancer. This table shows the gene expression pattern of each molecular class of breast cancers including histological grade and metastatic potential72–74.
| Basal-like (Triple-negative) | Luminal A | Luminal B | HER2-Positive | Normal Breast-like | Claudin-low | |
|---|---|---|---|---|---|---|
| Gene expression | ER−, PR−, HER2−, and BRCA1 mutations. Cytokeratin 5, 6, 14 &17 | High ER+ and PR+ HER2− | Low ER+ and PR+ HER2+ | HER2+ GRB7+ | Cytokeratin 5−, 6− and 8+, 18+ | Low expression of claudin and E-cadherin and high expression of Vimentin, Snail, TWIST and ZEB |
| Histological grade | Histological high grade and highly metastatic | Histological low grade and less metastatic | Histological low grade and less metastatic | Histological high grade and very aggressive | High metastatic potential |
The luminal subtypes (luminal A and luminal B) that make up hormone receptor expressing breast cancers represent about 70% of tumours. Luminal subtypes express luminal cytokeratins 8/18, oestrogen receptors (ER) and genes associated with ER activation such as LIV1 and Cyclin D175. The basal-like tumours are usually ER−, PR− and HER2-negative and are also associated with germ-line BRCA1 mutations, one of the most important forms of the hereditary breast cancer16.
HER2-positive breast cancers are characterised by high expression of HER2, usually as a result of amplification of the 17q12q21 locus that contains the HER2 gene. Unlike other breast tumours, basal-like and HER2 tumours have a higher proportion (84%) of TP53 mutations16. The normal breast-like subtype has been poorly characterised, has gene expression patterns similar to adipose tissues, and is usually non-responsive to neoadjuvant chemotherapy76. Luminal A tumours have the longest survival times, luminal B tumours have intermediate survival times, whereas the basal-like and HER2 positive subtypes display the shortest survival times. Luminal A and B subtypes possess low and intermediate metastatic properties respectively, while the basal-like and HER2 positive subtypes are highly aggressive tumours that express low levels of E-cadherin and the tight junction protein claudin 369. These aggressive tumours also have a low expression of luminal markers and a high expression of mesenchymal markers, which are associated with poor prognosis. Claudin-low tumours have EMT (epithelial-to-mesenchymal transition) characteristics with tumour initiating cell features, and exhibit stem cell-associated biological processes77. All of these features are associated with higher metastatic potential.
Our current understanding of breast cancer biology is more comprehensive than ever. Various molecular subtypes of breast cancer have been elucidated using genomic profiling strategies and other major technological discoveries, opening new windows into breast cancer treatment and research. However, the basal-like (Triple negative) subtype, the most distinct among all the intrinsic subtypes in breast cancer, has not been well characterised78. Additionally, a genomic study revealed that the basal-like (Triple negative) breast cancer subtype is not only distinct among other breast cancer subtypes, but also among other cancer types79.
Triple-negative breast cancer (TNBC)
Although breast cancers originate from a common tissue, they display considerable heterogeneity. Different breast cancer subtypes have distinct biological, morphological, histological and molecular features, and display different responses to therapy. In particular, TNBC, a group of the most diverse breast cancers, is posing a major challenge for viable clinical decision making13. TNBC tumours are generally higher grade with distinct metastatic patterns and have more aggressive clinical behaviours than other breast tumours80. It is estimated that TNBC account for ~10–20% of invasive breast cancers, with approximately 170,000 cases yearly worldwide81.
TNBC is very heterogeneous and the lack of well-defined molecular targets remains a huge clinical challenge. It is often seen in younger and premenopausal women and more frequently in African-American women70. TNBC tumours have a weak association between tumour grade and lymph node metastasis. They preferentially metastasize to the brain and have a higher recurrence potential and often worse prognosis than other breast cancer subtypes82. Several studies consistently reported that TNBC patients showed stronger response to chemotherapy than non-TNBC patients despite a lack of known targetable biomarkers83. Additionally, they respond better to combination chemotherapies than to single agents. However, this comes at the expense of increased chemotherapeutic toxicity and has no impact on patient survival84. In fact, less than 30% of women with metastatic breast cancer will survive five years after initial diagnosis despite systematic chemotherapy and virtually all metastatic TNBC patients eventually die of this disease85. To overcome this TNBC paradox, there is an urgent need to further sub-classify this aggressive cancer subtype to help in the development of more targeted patient treatments with better clinical outcomes.
Genomic and transcriptomic characterization of TNBC
To date, significant progress has been made on molecular subtyping of breast cancer by global gene expression analysis68. Recently, The Cancer Genome Atlas (TCGA) Program joined in this effort and established a comprehensive molecular subtype of breast cancer through mRNA, miRNA, DNA, epigenetics and reverse phase protein arrays16. In this study, they reported 80% of basal-like breast cancers were triple negative breast cancers, traditionally defined by gene expression profile or cytokeratin expression16. Several other studies also showed significant progress in subtyping TNBC. An aggregate analysis of publicly available gene expression datasets performed by Lehmann and colleagues revealed TNBCs are more complex and heterogeneous in nature than currently acknowledged and further classified TNBC into six subtypes86: 1) basal-like-1 (BL1); 2) basal-like-2 (BL2); 3) immunomodulatory (IM); 4) claudin-low-enriched mesenchymal (M); 5) mesenchymal stem-like (MSL); and 6) luminal androgen receptor positive (LAR). However, a subsequent study reported basal-like-1 & 2 were indistinguishable and that these six subtypes could be categorized in three major groups. They are, namely mesenchymal, basal-like and LAR, which is highly concordant with the previously identified three main groups termed claudin-low, basal-like and luminal/HER2E87.
In addition, several other groups implementing multiple methods have also appeared to re-delineate the sub-classification of TNBC. A comprehensive transcriptome study identified four distinct subclasses of TNBC based on the integrated expression profile of mRNA and lncRNA (IM, LAR, a mesenchymal-like subtype (MES) and a basal-like and immune suppressed (BLIS) subtype)88. Additionally, Burstein and colleagues also identified and confirmed four molecular subtypes of TNBCs and putative specific targets of those subtypes through a comprehensive genomic study 89. These four subtypes of TNBC (AR, LAR, MES, BLIS and BLIA) have the following corresponding targets: androgen receptor and the cell surface protein mucin, MUC1 (AR; LAR), PDGFRA and c-Kit specific target for MES, an immunosuppressing molecule termed VTCN1 for basal-like immunosuppressed (BLIS), and cytokines as well as STAT signal transduction molecules (BLIA) TNBC89. Moreover, Burstein and colleagues also indicated that their attempt to reproduce the 6 subtypes of Lehmann and colleagues was unsuccessful89. In addition, a higher frequency of protein abundance than projected by mRNA and DNA levels has been reported in colorectal cancer, bladder urothelial carcinoma and lung adenocarcinoma11. In a cohort of 26 lung cancer cell samples, seven of them showed high HER2 protein expression whereas only two cells samples demonstrated elevated levels of HER2 mRNA 90, suggesting that high protein abundance might not directly results from high mRNA level in cells11. In such cases, proteomics platforms might be useful for determining the predictive, prognostic and therapeutic implication of functional proteomes (Table 2).
Table 2.
Triple negative breast cancer specific protein signatures characterised using either labelling or label free quantitation methods
| Author | Sample type |
Mass spectrometr y |
Quantitation method |
Identified protein | Potential clinical use | ||
|---|---|---|---|---|---|---|---|
| Upregulated or phosphorylated |
Down-regulated or dephosphorylated |
Bio/Prognostic marker |
Drug target | ||||
| Liu et al.(2014)97 | Tissue | nLC-MS/MS | Label free | CMPK1, AIFM1, FTH1, EML4, GANAB, CTNNA1, AP1G1, STX12, AP1M1, CAPZB | MTHFD1 | Yes | —— |
| Liu et al.(2014)100 | Tissue | nLC-MS/MS | Label free | FTH1 | —— | —— | Yes |
| Campone et al.(2015)101 | Tissue | MALDI-MS/MS | iTRAQ labelling | DP, TPS1, TrpRS | —— | Yes | Yes |
| Maurizio et al.(2016)103 | Cell lines | LC-MS/MS | Label free | KIFC1, LRRC59, TRIP13 | —— | Yes | Yes |
| Sun et al.(2011)104 | Cell lines | LC-MS/MS | Dimethyl labeling | —— | PTPN12 | ||
| Cabezon et al.(2012)105 | Tissue and serum | 2D-MALDI-MS/MS | Label free | Mage-A4 | —— | —— | Yes |
| Song et al.(2016)107 | Serum | MALDI-MS/MS | Label free | apoC-I | —— | Yes | —— |
| He et al.(2011) 108 | Tissue | LC-MS/MS | Label free | HSP70 kDa-8, periostin, RhoA, actinin alpha 4, cathepsin D, preproprotein, annexin 1, ALDH1A1, G3BP | Thymosinβ4, Transketolase, Transferrin | Yes | Yes |
| Semaan et al.(2011) 109 | Tissue | LC-LTQ/FT-ICR MS | Label free | TRIM28, HSP90-alpha, hnRNP A1, CLTC, and myosin-9, HDGF, | HSP90, AB1, PTRF1, AHNAK, SEPT2 | —— | Yes |
| Tyanova et al.(2016)16 | Cell lines | LC-MS/MS | super-SILAC labelling | MCM5, STMN1, GLS, RCL1, C9ORF114, ENO1, | AGR2, MLPH, HID1, CMBL, FOXA1106 | Yes | —— |
| Wu et al.(2015)111 | Cell lines | LC-MS/MS | SILAC labeling | AXL | —— | Yes | Yes |
| Corrêa et al.(2016)106 | Tissue and serum | nLC-MS/MS | Label free | IRX1 | —— | Yes | Yes |
| Suman et al.(2016)102 | Tissue and serum | iTRAQ labeling | A2M | C4BPA | Yes | —— | |
Proteomic characterisation of TNBC
Proteomics studies that focus on characterizing the entire proteome of specific cells or tissues, provide complementary information to genomic and transcriptomic-centred breast cancer studies91. Proteins are intrinsically more complex, dynamic, and more closely reflect biological function than genes. Shortfalls in the capacity of bioinformatics to predict the presence and function of gene products have also exemplified the requirement for protein analysis91. It is estimated that in humans, between 500,000–1,000,000 protein isoforms10 are encoded by only about 20,000 protein coding genes92. A single gene can encode many distinct proteins because a single pre-mRNA transcript can be spliced to generate different protein isoforms and because proteins can be modified after translation in different ways (modifications referred to as posttranslational modifications or PTMs). The advent of modern proteomics technologies has allowed us to investigate protein abundance, protein-protein interactions, PTMs, and ultimately protein function.
A proteomics-based analysis by Kennedy et al. quantitatively characterised 319 proteins that showed differential expression levels across 30 different human breast cancer cell lines93. This proteomics data was used to successfully delineate molecular subtypes of breast cancer and identified 118 proteins that were differentially expressed in cells from basal-like vs. luminal cancers. Of these 118 proteins, a further analysis found that 30 proteins had corresponding genomic data, however the levels of only 10 of these proteins exhibited significant concordance with mRNA levels93. In another study, Liu et al. used a label free proteomic approach to examine 126 frozen TNBC primary tumours samples split into training and testing sets and identified a signature of 11 proteins linked with clinical outcome (CMPK1, AIFM1, FTH1, EML4, GANAB, CTNNA1, AP1G1, STX12, AP1M1, CAPZB and MTHFD1). The expression pattern of those signature proteins identified from the training set of samples could be used to predict clinical outcome in TNBC in the testing set of TNBC with high sensitivity and specificity. Of these 11 proteins, 10 were up-regulated (MTHFD1 was down-regulated) in patients with a good prognosis94. Three of the up-regulated proteins were involved in immunomodulation and apoptosis pathways, while MTHFD1, associated with poor prognosis, is involved in nucleotide and noncoding RNA metabolism. Liu et al. showed that over 60% of the TNBC patients who received adjuvant chemotherapy using the conventional St. Gallen95 and NIH96 criteria were unnecessarily treated based on the 11-proteins signature defined in this study. A subsequent proteomics study97 further validated that FTH1, an immunomodulatory molecule involved in augmentation of CD8+ T cells in the tumour area, is a potential therapeutic target in TNBC.
The first global deep proteomic analysis of TNBC molecular features identified 12,000 distinct proteins whose expression patterns could discriminate between TNBC subtypes. This study also elucidated TNBC-specific signalling pathways involved in metastasis, adhesion and angiogenesis13. Different expression signatures for three proteins desmoplain (DP), thrombospondin-1 (TPS1) and trytophanyl-tRNA synthase (TrpRS) were discovered for relapse and non-relapse TBNC tumours using an iTRAQ labelling based proteomic approach98. Overexpression of DP in luminal breast cells99 and the metastatic and proangiogenic activity of TPS1100 in breast cancer cells had been previously reported. The role of TrpRS in synthesis and translation of proteins as well as angiogenic signalling was also previously reported101. Overexpression of DP and TPS1 significantly altered the disease free survival and enhanced the risk of recurrence of TNBC patients. However, it was also reported that overexpression of TrpRS was associated with better disease free patient survival and lower risk of recurrence98. Another iTRAQ labelling based proteomics study identified several factors which have strong associations with molecular subtypes of breast cancer (fibronectin, alpha-2-macroglobulin (A2M), complement component-4-binding protein alpha (C4BPA) and complement factor-B). One of these factors, the antiprotease A2M, is a large plasma protein that is genetically altered and differentially expressed in plasma and tissue samples from TNBC patients 102.
Label-free proteomics strategies have been used extensively in breast cancer research. A label-free shotgun proteomic approach revealed a signature of 21 proteins in a High Mobility Group A1 (HMG1) silenced TNBC cell line which was associated with poor prognosis103. A unique HMG1-linked sub protein signature of three proteins - kinesin family member C1(KIFC1); thyroid hormone receptor interacting protein 13 (TRIP13); and leucine-rich repeat containing 59 (LRRC59) - was unexplored in TNBCs. KIFC1, TRIP13, and LRRC59 proteins are downstream targets of HMG1 and involved in cell motility103. Another label-based proteomics study reported that PTPN12, a tyrosine phosphatase, inhibited cellular transformation and metastasis of TNBC cells104. A systematic 2D gel-based proteomic study of TNBC tissue biopsies uncovered Mage-A4105, a family member of Mage-A, as a unique biomarker for TNBC and HER2 patients. Additionally, a label-free proteomic study identified Iroquois homeobox protein 1 (IRX1), which is involved in metanephric nephron development, as a potential plasma biomarker for TNBC106. Recently Song et al. identified apolipoprotein C-I in their MALDI-TOF based TNBC patient serum sample study which could readily discriminate TNBC from non-TNBC tumors107.
Another label free proteomic study of TNBC reported a protein signature of 30 proteins associated with drug resistance and poor patient survival108. Amongst these proteins, HSP70 kDa-8, periostin, RhoA, actinin alpha 4, cathepsin D, preproprotein, and annexin 1 were highly expressed in TNBC tumours resistant to neoadjuvant chemotherapy. This study also identified ALDH1A1, complement component 1 inhibitor and G3BP as proteins associated with TNBC subtypes. G3BP (also known as 90-kDa Mac-2-binding protein) is a member of the beta-galactoside-binding protein family, whose association with TNBC was previously unreported. A systematic phosphoproteomic analysis of TNBC tissue uncovered 6 proteins in TNBC tumours and 5 completely different proteins at TNBC metastatic sites which were highly phosphorylated109, suggesting that targeted dephosphorylation of these proteins may eliminate cancer progression as well as the metastatic potential of TNBC cells.
In 2010, Geiger et al. developed a SILAC-based technique aimed at quantitatively analysing proteins in human tissues. In brief, their technique (super-SILAC) compared unlabelled proteins in cells from tumour samples with metabolically labelled proteins from a panel of breast cancer cell lines cultured in media containing heavy lysine and arginine110. This super-SILAC based quantitative proteomic strategy was later used to conduct a global protein profiling of clinical breast cancer samples and describe the specific protein profiles of breast cancer subtypes14. In agreement with others16, this study observed that the down-regulation of PTEN in TNBC tumours resulted in higher activity of cell survival PI3K pathways. They found that TNBC had higher levels of six positive markers (MCM5, STMN1, GLS, RCL1, C9ORF114 and ENO1) and lower levels of five negative markers (AGR2, MLPH, HID1, CMBL and, FOXA1.). Of the six positive markers, four (MCM5, STMN1, RCL1 and C9ORF114) were associated with high cell proliferation rates of TNBC tumours. The other two positive markers, GLS and ENO1, function in glycolysis and glutaminolysis, consistent with the unique metabolism of TNBC compared with other breast cancer subtypes. Additionally another study also identified ENO1 as a potential biomarker of TNBC111. Interestingly, most of the TNBC protein markers are regulated not at the genomic level but at the protein level14, suggesting the urgency of developing proteomic approaches for disease research.
It is important to investigate normal and cancer signalling networks to understand cancer biology and develop therapeutic interventions. Several studies have reported that different major signalling networks are activated specifically in TNBC14,109,112. Phosphorylation of HMGA1 turned on the IL4-mediated signalling pathway and enhanced the metastatic potential of TNBC tumors109. PTEN, a negative regulator of PI3K signalling, is commonly lost in TNBC cells resulting in constitutive activation of the PI3K pathway. However substantial changes in key components of this pathway (such as AKT and PI3K) were not observed in breast cancer subtypes14, consistent with the particularly aggressive nature of TNBC. Wu et al. used a SILAC based quantitative phosphoproteomic approach to assess tyrosine kinase activity in TNBC and discovered multiple activated kinase signalling pathways112. Their phosphoproteomic analysis showed that AXL, a receptor tyrosine kinase, was highly phosphorylated in TNBC. Upon activation (phosphorylation) AXL dimerized with the receptor MET, resulting in activation of downstream signalling pathways (PI3K-AKT and FAK-SRC), augmenting cell proliferation and migration in TNBC.
Taken together, these studies illustrate the importance of proteomics-based studies and stress the need for a precise proteomic signature for understanding the complexity of TNBC in particular. A well-defined molecular signature can guide systematic therapeutic approaches to target breast cancer. Quantitative functional proteomic strategies have become indispensable in this quest for characteristic protein-protein interaction networks and precise protein signatures. These can be used to identify key TNBC regulators so that we can develop predictive, diagnostic and therapeutic applications. For example, a proteomics approach may reveal protein phosphorylation events in metastatic cells that are absent in primary tumour cells. Targeted dephosphorylation of these phosphorylation sites could potentially inhibit cancer cell metastasis. In addition, the combinatorial approach of genomics, transcriptomics and proteomics can better elucidate the biological processes that result in TNBC, so that we can overcome the current barriers in the clinical treatment of breast cancer.
Conclusion and Perspective
Although the ‘one-gene, one-function’ dogma is a conceptually appealing theory, it is an over simplification of gene regulation process. Alternative pre-mRNA splicing and post-translational modification of gene products are also a part of the molecular process of protein production that account for approximately 500,000–1,000,000 proteins in humans. In addition, simple targeted single molecule studies do not reflect the complexity of biological processes. Complexity and heterogeneity are an intrinsic feature of TNBC, and large-scale approaches such as proteomics can be used to decipher the global picture of TNBC cancer biology.
It has been reported that up to 30% of proteomes can potentially be phosphorylated by protein kinases113. Deregulation of the phosphorylation process may alter cell function and result in a disease state114,115. Thus, protein kinases have emerged as major targets of drug discovery. In fact, approximately one-third of the current validated drugs in the pharmaceutical armoury that are used to treat cancer are based on kinase inhibition116,117. The pathogenesis of TNBC may be depend on the degree of deregulated phosphorylation of those protein kinases, which is mostly unknown phospho-proteomic profiling of those protein kinases in TNBC could potentially reveal aetiology and new druggable targets for treating TNBC.
Proteomics approaches have become powerful investigative tools because of their high sensitivity, accuracy, reproducibility and throughput in biomedical research. Both label-free and isobaric labelling MS based proteomics approaches allow global profiling of thousands of proteins across biological conditions and have been used to uncover potential protein biomarkers including cancer specific PTMs and proteins in key signalling pathways. The topological organization of signalling networks can be deciphered through proteomics, providing information that it is important for clinical decision-making.
Although advanced proteomics techniques have become accepted tools in cancer research, very few comprehensive studies have been undertaken to address TNBC. The treatment of TNBC remains a challenge, with poor patient outcomes and few therapeutic targets. A better understanding of the carcinogenesis of TNBC is a prerequisite for more sophisticated TNBC subtyping and for developing tailored treatment options. The power of proteomics can be used to decode the complexity of TNBC, unveil precise subtype-specific TNBC protein signatures, and ultimately develop more effective clinical interventions.
Acknowledgments
This work was supported by the Stowers Institute for Medical Research and by and the National Institute of General Medical Sciences of the National Institutes of Health under Award Number RO1GM112639 to MPW. KEL’s research is funded by grants from the Canadian Breast Cancer Foundation (CBCF).
Footnotes
CONFLICT OF INTREST
The authors declare that they have no conflict of interest.
References
- 1.Ginsburg O, Love R. Breast J. 2011;17:289–95. doi: 10.1111/j.1524-4741.2011.01067.x. [DOI] [PMC free article] [PubMed] [Google Scholar]
- 2.Miller KD, Siegel RL, Lin CC, Mariotto AB, Kramer JL, Rowland JH, Stein KD, Alteri R, Jemal A. CA Cancer J Clin. 2016;66:271–89. doi: 10.3322/caac.21349. [DOI] [PubMed] [Google Scholar]
- 3.Qin XJ, Ling BX. Oncol Lett. 2012;3:735–743. doi: 10.3892/ol.2012.573. [DOI] [PMC free article] [PubMed] [Google Scholar]
- 4.Sallam RM. Dis Markers. 2015;2015:321370. doi: 10.1155/2015/321370. [DOI] [PMC free article] [PubMed] [Google Scholar]
- 5.Hall JM, Lee MK, Newman B, Morrow JE, Anderson La, Huey B, King M-C. Science. 1990;250:1684–1689. doi: 10.1126/science.2270482. [DOI] [PubMed] [Google Scholar]
- 6.Schechter AL, Stern DF, Vaidyanathan L, Decker SJ, Drebin JA, Greene MI, Weinberg RA. Nature. 1984;312:513–516. doi: 10.1038/312513a0. [DOI] [PubMed] [Google Scholar]
- 7.Lemon HM. Cancer. 1970;25:423–435. doi: 10.1002/1097-0142(197002)25:2<423::aid-cncr2820250222>3.0.co;2-v. [DOI] [PubMed] [Google Scholar]
- 8.Stredrick DL, Garcia-Closas M, Pineda MA, Bhatti P, Alexander BH, Doody MM, Lissowska J, Peplonska B, Brinton LA, Chanock SJ, Struewing JP, Sigurdson AJ. Hum Mutat. 2006;27:538–544. doi: 10.1002/humu.20323. [DOI] [PMC free article] [PubMed] [Google Scholar]
- 9.Torkamania A, Verkhivkerb G, Schorka NJ. Cancer. 2010;281:117–127. [Google Scholar]
- 10.ER CG, Galvão N, Martins LMS, Ibiapina JO, Andrade HM, Monte SJH. J Cancer Res Clin Oncol. 2011;137:915–925. doi: 10.1007/s00432-011-0978-0. [DOI] [PMC free article] [PubMed] [Google Scholar]
- 11.Akbani R, Ng PKS, Werner HMJ, Shahmoradgoli M, Zhang F, Ju Z, Liu W, Yang J-Y, Yoshihara K, Li J, Ling S, Seviour EG, Ram PT, Minna JD, Diao L, Tong P, Heymach JV, Hill SM, Dondelinger F, Städler N, Byers LA, Meric-Bernstam F, Weinstein JN, Broom BM, Verhaak RGW, Liang H, Mukherjee S, Lu Y, Mills GB. Nat Commun. 2014;5:3887. doi: 10.1038/ncomms4887. [DOI] [PMC free article] [PubMed] [Google Scholar]
- 12.Olsson N, Carlsson P, James P, Hansson K, Waldemarson S, Malmström P, Fernö M, Ryden L, Wingren C, Borrebaeck CAK. Mol Cell Proteomics. 2013;12:3612–23. doi: 10.1074/mcp.M113.030379. [DOI] [PMC free article] [PubMed] [Google Scholar]
- 13.Lawrence RT, Perez EM, Hernández D, Miller CP, Haas KM, Irie HY, Lee SI, Blau AC, Villén J. Cell Rep. 2015;11:630–644. doi: 10.1016/j.celrep.2015.03.050. [DOI] [PMC free article] [PubMed] [Google Scholar]
- 14.Tyanova S, Albrechtsen R, Kronqvist P, Cox J, Mann M, Geiger T. Nat Commun. 2016;7:1–11. doi: 10.1038/ncomms10259. [DOI] [PMC free article] [PubMed] [Google Scholar]
- 15.Simon R, Sauter G. Exp Hematol. 2002;30:1365–1372. doi: 10.1016/s0301-472x(02)00965-7. [DOI] [PubMed] [Google Scholar]
- 16.Koboldt DC, Fulton RS, McLellan MD, Schmidt H, Kalicki-Veizer J, McMichael JF, Fulton LL, Dooling DJ, Ding L, Mardis ER, Wilson RK, Ally A, Balasundaram M, Butterfield YSN, Carlsen R, Carter C, Chu A, Chuah E, Chun H-JE, Coope RJN, Dhalla N, Guin R, Hirst C, Hirst M, Holt Ra, Lee D, Li HI, Mayo M, Moore Ra, Mungall AJ, Pleasance E, Gordon Robertson a, Schein JE, Shafiei A, Sipahimalani P, Slobodan JR, Stoll D, Tam A, Thiessen N, Varhol RJ, Wye N, Zeng T, Zhao Y, Birol I, Jones SJM, Marra Ma, Cherniack AD, Saksena G, Onofrio RC, Pho NH, Carter SL, Schumacher SE, Tabak B, Hernandez B, Gentry J, Nguyen H, Crenshaw A, Ardlie K, Beroukhim R, Winckler W, Getz G, Gabriel SB, Meyerson M, Chin L, Park PJ, Kucherlapati R, Hoadley Ka, Todd Auman J, Fan C, Turman YJ, Shi Y, Li L, Topal MD, He X, Chao H-H, Prat A, Silva GO, Iglesia MD, Zhao W, Usary J, Berg JS, Adams M, Booker J, Wu J, Gulabani A, Bodenheimer T, Hoyle AP, Simons JV, Soloway MG, Mose LE, Jefferys SR, Balu S, Parker JS, Neil Hayes D, Perou CM, Malik S, Mahurkar S, Shen H, Weisenberger DJ, Triche T, Jr, Lai PH, Bootwalla MS, Maglinte DT, Berman BP, Van Den Berg DJ, Baylin SB, Laird PW, Creighton CJ, Donehower La, Getz G, Noble M, Voet D, Saksena G, Gehlenborg N, DiCara D, Zhang J, Zhang H, Wu C-J, Yingchun Liu S, Lawrence MS, Zou L, Sivachenko A, Lin P, Stojanov P, Jing R, Cho J, Sinha R, Park RW, Nazaire M-D, Robinson J, Thorvaldsdottir H, Mesirov J, Park PJ, Chin L, Reynolds S, Kreisberg RB, Bernard B, Bressler R, Erkkila T, Lin J, Thorsson V, Zhang W, Shmulevich I, Ciriello G, Weinhold N, Schultz N, Gao J, Cerami E, Gross B, Jacobsen A, Sinha R, Arman Aksoy B, Antipin Y, Reva B, Shen R, Taylor BS, Ladanyi M, Sander C, Anur P, Spellman PT, Lu Y, Liu W, Verhaak RRG, Mills GB, Akbani R, Zhang N, Broom BM, Casasent TD, Wakefield C, Unruh AK, Baggerly K, Coombes K, Weinstein JN, Haussler D, Benz CC, Stuart JM, Benz SC, Zhu J, Szeto CC, Scott GK, Yau C, Paull EO, Carlin D, Wong C, Sokolov A, Thusberg J, Mooney S, Ng S, Goldstein TC, Ellrott K, Grifford M, Wilks C, Ma S, Craft B, Yan C, Hu Y, Meerzaman D, Gastier-Foster JM, Bowen J, Ramirez NC, Black AD, White P, Zmuda EJ, Frick J, Lichtenberg TM, Brookens R, George MM, Gerken Ma, Harper Ha, Leraas KM, Wise LJ, Tabler TR, McAllister C, Barr T, Hart-Kothari M, Tarvin K, Saller C, Sandusky G, Mitchell C, Iacocca MV, Brown J, Rabeno B, Czerwinski C, Petrelli N, Dolzhansky O, Abramov M, Voronina O, Potapova O, Marks JR, Suchorska WM, Murawa D, Kycler W, Ibbs M, Korski K, Spychała A, Murawa P, Brzeziński JJ, Perz H, Łaźniak R, Teresiak M, Tatka H, Leporowska E, Bogusz-Czerniewicz M, Malicki J, Mackiewicz A, Wiznerowicz M, Van Le X, Kohl B, Viet Tien N, Thorp R, Van Bang N, Sussman H, Duc Phu B, Hajek R, Phi Hung N, Viet The Phuong T, Quyet Thang H, Zaki Khan K, Penny R, Mallery D, Curley E, Shelton C, Yena P, Ingle JN, Couch FJ, Lingle WL, King Ta, Maria Gonzalez-Angulo A, Mills GB, Dyer MD, Liu S, Meng X, Patangan M, Waldman F, Stöppler H, Kimryn Rathmell W, Thorne L, Huang M, Boice L, Hill A, Morrison C, Gaudioso C, Bshara W, Daily K, Egea SC, Pegram MD, Gomez-Fernandez C, Dhir R, Bhargava R, Brufsky A, Shriver CD, Hooke Ja, Leigh Campbell J, Mural RJ, Hu H, Somiari S, Larson C, Deyarmin B, Kvecher L, Kovatich AJ, Ellis MJ, King Ta, Hu H, Couch FJ, Mural RJ, Stricker T, White K, Olopade O, Ingle JN, Luo C, Chen Y, Marks JR, Waldman F, Wiznerowicz M, Bose R, Chang L-W, Beck AH, Maria Gonzalez-Angulo A, Pihl T, Jensen M, Sfeir R, Kahn A, Chu A, Kothiyal P, Wang Z, Snyder E, Pontius J, Ayala B, Backus M, Walton J, Baboud J, Berton D, Nicholls M, Srinivasan D, Raman R, Girshik S, Kigonya P, Alonso S, Sanbhadti R, Barletta S, Pot D, Sheth M, Demchok Ja, Mills Shaw KR, Yang L, Eley G, Ferguson ML, Tarnuzzer RW, Zhang J, Dillon LaL, Buetow K, Fielding P, Ozenberger Ba, Guyer MS, Sofia HJ, Palchik JD. Nature. 2012;490:61–70. [Google Scholar]
- 17.Hondermarck H. Mol Cell Proteomics. 2003;2:281–291. doi: 10.1074/mcp.R300003-MCP200. [DOI] [PubMed] [Google Scholar]
- 18.Liu NQ, Braakman RBH, Stingl C, Luider TM, Martens JWM, Foekens JA, Umar A. J Mammary Gland Biol Neoplasia. 2012;17:155–164. doi: 10.1007/s10911-012-9252-6. [DOI] [PMC free article] [PubMed] [Google Scholar]
- 19.Mann M, Kelleher NL. Proc Natl Acad Sci U S A. 2008;105:18132–18138. doi: 10.1073/pnas.0800788105. [DOI] [PMC free article] [PubMed] [Google Scholar]
- 20.Schilling B, MacLean B, Held JM, Sahu AK, Rardin MJ, Sorensen DJ, Peters T, Wolfe AJ, Hunter CL, MacCoss MJ, Gibson BW. Anal Chem. 2015;87:10222–10229. doi: 10.1021/acs.analchem.5b02983. [DOI] [PMC free article] [PubMed] [Google Scholar]
- 21.Rauniyar N. Int J Mol Sci. 2015;16:28566–28581. doi: 10.3390/ijms161226120. [DOI] [PMC free article] [PubMed] [Google Scholar]
- 22.Frantzi M, Bhat A, Latosinska A. Clin Transl Med. 2014;3:7. doi: 10.1186/2001-1326-3-7. [DOI] [PMC free article] [PubMed] [Google Scholar]
- 23.Banks CA, Lakshminarasimhan M, Washburn MP. eLS. 2014:1–7. [Google Scholar]
- 24.Banks CAS, Kong SE, Washburn MP. Protein Expr Purif. 2012;86:105–119. doi: 10.1016/j.pep.2012.09.007. [DOI] [PubMed] [Google Scholar]
- 25.Yao X, Freas A, Ramirez J, Demirev PA, Fenselau C. Anal Chem. 2001;73:2836–2842. doi: 10.1021/ac001404c. [DOI] [PubMed] [Google Scholar]
- 26.Gygi SP, Rist B, Gerber Sa, Turecek F, Gelb MH, Aebersold R. Nat Biotechnol. 1999;17:994–999. doi: 10.1038/13690. [DOI] [PubMed] [Google Scholar]
- 27.Pan C, Oda Y, Lankford PK, Zhang B, Samatova NF, Pelletier Da, Harwood CS, Hettich RL. Mol Cell Proteomics. 2008;7:938–948. doi: 10.1074/mcp.M700147-MCP200. [DOI] [PubMed] [Google Scholar]
- 28.Li Z, Adams RM, Chourey K, Hurst GB, Hettich RL, Pan C. J Proteome Res. 2012;11:1582–1590. doi: 10.1021/pr200748h. [DOI] [PubMed] [Google Scholar]
- 29.Sap KA, Demmers JAA. Integr Proteomics. 2012:111–132. [Google Scholar]
- 30.Oda Y, Huang K, Cross FR, Cowburn D, Chait BT. Proc Natl Acad Sci U S A. 1999;96:6591–6596. doi: 10.1073/pnas.96.12.6591. [DOI] [PMC free article] [PubMed] [Google Scholar]
- 31.Conrads TP, Alving K, Veenstra TD, Belov ME, Anderson GA, Anderson DJ, Lipton MS, Paša-Tolić L, Udseth HR, Chrisler WB, Thrall BD, Smith RD. Anal Chem. 2001;73:2132–2139. doi: 10.1021/ac001487x. [DOI] [PubMed] [Google Scholar]
- 32.Mcclatchy DB, Dong M, Wu CC, Venable JD, John R. Proteome. 2010;6:2005–2010. doi: 10.1021/pr060599n. [DOI] [PMC free article] [PubMed] [Google Scholar]
- 33.Chahrour O, Cobice D, Malone J. J Pharm Biomed Anal. 2015;113:2–20. doi: 10.1016/j.jpba.2015.04.013. [DOI] [PubMed] [Google Scholar]
- 34.Ong S-E, Blagoev B, Kratchmarova I, Kristensen§ Dan Bach, Steen H, Pandey A, Mann M. Mol Cell Proteomics. 2002;1(5):376–386. doi: 10.1074/mcp.m200025-mcp200. [DOI] [PubMed] [Google Scholar]
- 35.Yocum AK, Busch CM, Felix CA, Blair IA. J Proteome Res. 2006;5:2743–2753. doi: 10.1021/pr060235v. [DOI] [PubMed] [Google Scholar]
- 36.Xu BJ, Yan W, Jovanovic B, An AQ, Cheng N, Aakre ME, Yi Y, Eng J, Link AJ, Moses HL. Proteomics. 2010;10:2458–2470. doi: 10.1002/pmic.200900701. [DOI] [PMC free article] [PubMed] [Google Scholar]
- 37.Harsha HC, Pinto SM, Pandey A. Methods Mol Biol. 2013;1007:359–77. doi: 10.1007/978-1-62703-392-3_16. [DOI] [PubMed] [Google Scholar]
- 38.Yang W, Cai Q, Lui VWY, Everley PA, Kim J, Bhola N, Quesnelle KM, Zetter BR, Steen H, Freeman MR, Grandis JR. J Proteome Res. 2011;9:3073–3082. doi: 10.1021/pr901211j. [DOI] [PMC free article] [PubMed] [Google Scholar]
- 39.López-Ferrer D, Ramos-Fernández A, Martínez-Bartolomé S, García-Ruiz P, Vázquez J. Proteomics. 2006;6:S4–S11. doi: 10.1002/pmic.200500375. [DOI] [PubMed] [Google Scholar]
- 40.SPRINSON DB, RITTENBERG D. Nature. 1951;167:484. [Google Scholar]
- 41.Patwardhan AJ, Strittmatter EF, Camp DG, Smith RD, Pallavicini MG. Proteomics. 2006;6:2903–2915. doi: 10.1002/pmic.200500582. [DOI] [PubMed] [Google Scholar]
- 42.Blonder J, Yu LR, Radeva G, Chan KC, Lucas DA, Waybright TJ, Issaq HJ, Sharom FJ, Veenstra TD. J Proteome Res. 2006;5:349–360. doi: 10.1021/pr050355n. [DOI] [PMC free article] [PubMed] [Google Scholar]
- 43.Philip LR, Huang YN, Marchese JN, Williamson B, Parker K, Hattan S, Khainovski N, Pillai S, Dey S, Daniels S, Purkayastha S, Juhasz P, Martin S, Jones MB, He F, Jacobson A, Pappin DJ. Mol Cell Proteomics. 2004;3(12):1154–1169. doi: 10.1074/mcp.M400129-MCP200. [DOI] [PubMed] [Google Scholar]
- 44.Thompson A, Schafer J, Kuhn K, Kienle S, Schwarz J, Schmidt G, Neumann T, Hamon C. Anal Chem. 2003;75:1895–1904. doi: 10.1021/ac0262560. [DOI] [PubMed] [Google Scholar]
- 45.Gromov P, Moreira JM, Gromova I. Expert Rev Proteomics. 2014;11:285–302. doi: 10.1586/14789450.2014.899469. [DOI] [PubMed] [Google Scholar]
- 46.Kang UB, Ahn Y, Lee JW, Kim Y-H, Kim J, Yu M-H, Noh D-Y, Lee C. BMC Cancer. 2010;10:114. doi: 10.1186/1471-2407-10-114. [DOI] [PMC free article] [PubMed] [Google Scholar]
- 47.Frost DC, Greer T, Li L. Anal Chem. 2015;87:1646–1654. doi: 10.1021/ac503276z. [DOI] [PMC free article] [PubMed] [Google Scholar]
- 48.Everley RA, Kunz RC, McAllister FE, Gygi SP. Anal Chem. 2013;85:5340–5346. doi: 10.1021/ac400845e. [DOI] [PubMed] [Google Scholar]
- 49.Yao Z, Li J, Liu Z, Zheng L, Fan N, Zhang Y, Jia N, Lv J, Liu N, Zhu X, Du J, Lv C, Xie F, Liu Y, Wang X, Fei Z, Gao C. Mol BioSyst. 2016;12:729–736. doi: 10.1039/c5mb00848d. [DOI] [PubMed] [Google Scholar]
- 50.Yang J, Hou Y, Zhou M, Wen S, Zhou J, Xu L, Tang X, Du Y, Hu P, Liu M. Int J Biochem Cell Biol. 2016;71:62–71. doi: 10.1016/j.biocel.2015.12.004. [DOI] [PubMed] [Google Scholar]
- 51.Pendharkar N, Gajbhiye A, Taunk K, RoyChoudhury S, Dhali S, Seal S, Mane A, Abhang S, Santra MK, Chaudhury K, Rapole S. J Proteomics. 2016;132:112–130. doi: 10.1016/j.jprot.2015.11.024. [DOI] [PubMed] [Google Scholar]
- 52.Campone M, Valo I, Jézéquel P, Moreau M, Boissard A, Campion L, Loussouarn D, Verriele V, Coqueret O, Guette C. Mol Cell Proteomics. 2015;14:2936–46. doi: 10.1074/mcp.M115.048967. [DOI] [PMC free article] [PubMed] [Google Scholar]
- 53.Evans C, Noirel J, Ow SY, Salim M, Pereira-Medrano AG, Couto N, Pandhal J, Smith D, Pham TK, Karunakaran E, Zou X, Biggs CA, Wright PC. Anal Bioanal Chem. 2012;404:1011–1027. doi: 10.1007/s00216-012-5918-6. [DOI] [PubMed] [Google Scholar]
- 54.Chick JM, Kolippakkam D, Nusinow DP, Zhai B, Rad R, Huttlin EL, Gygi SP. Nat Biotechnol. 2015;33:743–9. doi: 10.1038/nbt.3267. [DOI] [PMC free article] [PubMed] [Google Scholar]
- 55.Liu H, Sadygov RG, Yates JR. Anal Chem. 2004;76:4193–4201. doi: 10.1021/ac0498563. [DOI] [PubMed] [Google Scholar]
- 56.Zybailov B, Coleman M, Florens L, Washburn M. Anal Chem. 2005;77:6218–6224. doi: 10.1021/ac050846r. [DOI] [PubMed] [Google Scholar]
- 57.Chelius D, Bondarenko P. J Proteome Res. 2002;1:317–23. doi: 10.1021/pr025517j. [DOI] [PubMed] [Google Scholar]
- 58.Griffin NM, Yu J, Long F, Oh P, Shore S, Li Y, Koziol JA, Schnitzer JE. Nat Biotechnol. 2010;28:83–89. doi: 10.1038/nbt.1592. [DOI] [PMC free article] [PubMed] [Google Scholar]
- 59.Zybailov B, Mosley AL, Sardiu ME, Coleman MK, Florens L, Washburn MP. J Proteome Res. 2006;5:2339–2347. doi: 10.1021/pr060161n. [DOI] [PubMed] [Google Scholar]
- 60.Zhang Y, Wen Z, Washburn MP, Florens L. Anal Chem. 2010;82:2272–2281. doi: 10.1021/ac9023999. [DOI] [PubMed] [Google Scholar]
- 61.Cox J, Mann M. Nat Biotechnol. 2008;26:1367–72. doi: 10.1038/nbt.1511. [DOI] [PubMed] [Google Scholar]
- 62.Egertson JD, MacLean B, Johnson R, Xuan Y, MacCoss MJ. Nat Protoc. 2015;10:887–903. doi: 10.1038/nprot.2015.055. [DOI] [PMC free article] [PubMed] [Google Scholar]
- 63.Tan HT, Lee YH, Chung MCM. Mass Spectrom Rev. 2012;31:583–605. doi: 10.1002/mas.20356. [DOI] [PubMed] [Google Scholar]
- 64.Bantscheff M, Lemeer S, Savitski MM, Kuster B. Anal Bioanal Chem. 2012;404:939–965. doi: 10.1007/s00216-012-6203-4. [DOI] [PubMed] [Google Scholar]
- 65.Liu NQ, Dekker LJM, Stingl C, Guzel C, De Marchi T, Martens JWM, Foekens JA, Luider TM, Umar A. J Proteome Res. 2013;12:4627–4641. doi: 10.1021/pr4005794. [DOI] [PubMed] [Google Scholar]
- 66.Sharma GN, Dave R, Sanadya J, Sharma P, Sharma KK. J Adv Pharm Technol Res. 2010:109–26. [PMC free article] [PubMed] [Google Scholar]
- 67.Bhoo-Pathy N, Subramaniam S, Taib Na, Hartman M, Alias Z, Tan G-H, Ibrahim RI, Yip C-H, Verkooijen HM. Br J Cancer. 2014;110:1–8. doi: 10.1038/bjc.2014.183. [DOI] [PMC free article] [PubMed] [Google Scholar]
- 68.Perou CM, Sørlie T, Eisen MB, van de Rijn M, Jeffrey SS, Rees Ca, Pollack JR, Ross DT, Johnsen H, Akslen La, Fluge O, Pergamenschikov a, Williams C, Zhu SX, Lønning PE, Børresen-Dale aL, Brown PO, Botstein D. Nature. 2000;406:747–752. doi: 10.1038/35021093. [DOI] [PubMed] [Google Scholar]
- 69.Sorlie T, Tibshirani R, Parker J, Hastie T, Marron JS, Nobel A, Deng S, Johnsen H, Pesich R, Geisler S, Demeter J, Perou CM, Lønning PE, Brown PO, Børresen-Dale A-L, Botstein D. Proc Natl Acad Sci U S A. 2003;100:8418–23. doi: 10.1073/pnas.0932692100. [DOI] [PMC free article] [PubMed] [Google Scholar]
- 70.Kumar P, Aggarwal R. Arch Gynecol Obstet. 2016;293:247–269. doi: 10.1007/s00404-015-3859-y. [DOI] [PubMed] [Google Scholar]
- 71.Curtis C, Shah SP, Chin S-F, Turashvili G, Rueda OM, Dunning MJ, Speed D, Lynch AG, Samarajiwa S, Yuan Y, Gräf S, Ha G, Haffari G, Bashashati A, Russell R, McKinney S, Langerød A, Green A, Provenzano E, Wishart G, Pinder S, Watson P, Markowetz F, Murphy L, Ellis I, Purushotham A, Børresen-Dale A-L, Brenton JD, Tavaré S, Caldas C, Aparicio S. Nature. 2012;486:346–52. doi: 10.1038/nature10983. [DOI] [PMC free article] [PubMed] [Google Scholar]
- 72.Munirah MA, Siti-Aishah MA, Reena MZ, Sharifah NA, Rohaizak M, Norlia A, Rafie MKM, Asmiati A, Hisham A, Fuad I, Shahrun NS, Das S. Rom J Morphol Embryol. 2011;52:669–677. [PubMed] [Google Scholar]
- 73.Sabatier R, Finetti P, Guille A, Adelaide J, Chaffanet M, Viens P, Birnbaum D, Bertucci F. Mol Cancer. 2014;13:228. doi: 10.1186/1476-4598-13-228. [DOI] [PMC free article] [PubMed] [Google Scholar]
- 74.Taube JH, Herschkowitz JI, Komurov K, Zhou AY, Gupta S, Yang J, Hartwell K, Onder TT, Gupta PB, Evans KW, Hollier BG, Ram PT, Lander ES, Rosen JM, Weinberg RA, Mani SA. Proc Natl Acad Sci U S A. 2010;107:15449–54. doi: 10.1073/pnas.1004900107. [DOI] [PMC free article] [PubMed] [Google Scholar]
- 75.Lamb J, Ladha MH, McMahon C, Sutherland RL, Ewen ME. Mol Cell Biol. 2000;20:8667–75. doi: 10.1128/mcb.20.23.8667-8675.2000. [DOI] [PMC free article] [PubMed] [Google Scholar]
- 76.Yersal O, Barutca S. World J Clin Oncol. 2014;5:412–24. doi: 10.5306/wjco.v5.i3.412. [DOI] [PMC free article] [PubMed] [Google Scholar]
- 77.Prat A, Ellis MJ, Perou CM. Nat Rev Clin Oncol. 2012;9:48–57. doi: 10.1038/nrclinonc.2011.178. [DOI] [PMC free article] [PubMed] [Google Scholar]
- 78.Prat A, Pineda E, Adamo B, Galvan P, Fern??ndez A, Gaba L, D??ez M, Viladot M, Arance A, Mu??oz M. Breast. 2015;24:S26–S35. doi: 10.1016/j.breast.2015.07.008. [DOI] [PubMed] [Google Scholar]
- 79.Prat A, Adamo B, Fan C, Peg V, Vidal M, Galván P, Vivancos A, Nuciforo P, Palmer HG, Dawood S, Rodón J, Cajal SR, Del Campo JM, Felip E, Tabernero J, Cortés J. Sci Rep. 2013;3:3544. doi: 10.1038/srep03544. [DOI] [PMC free article] [PubMed] [Google Scholar]
- 80.Malorni L, Shetty PB, De Angelis C, Hilsenbeck S, Rimawi MF, Elledge R, Osborne CK, De Placido S, Arpino G. Breast Cancer Res Treat. 2012;136:795–804. doi: 10.1007/s10549-012-2315-y. [DOI] [PMC free article] [PubMed] [Google Scholar]
- 81.Aysola K, Desai A, Welch C, Xu J, Qin Y, Reddy V, Matthews R, Owens C, Okoli J, Beech DJ, Piyathilake CJ, Reddy SP, Rao VN. Hered Genet. 2013;2013:S2. doi: 10.4172/2161-1041.S2-001. [DOI] [PMC free article] [PubMed] [Google Scholar]
- 82.Ovcaricek T, Frkovic SG, Matos E, Mozina B, Borstnar S. Radiol Oncol. 2011;45:46–52. doi: 10.2478/v10019-010-0054-4. [DOI] [PMC free article] [PubMed] [Google Scholar]
- 83.Liedtke C, Mazouni C, Hess KR, Andr?? F, Tordai A, Mejia JA, Symmans WF, Gonzalez-Angulo AM, Hennessy B, Green M, Cristofanilli M, Hortobagyi GN, Pusztai L. J Clin Oncol. 2008;26:1275–1281. doi: 10.1200/JCO.2007.14.4147. [DOI] [PubMed] [Google Scholar]
- 84.Bianchini G, Balko JM, Mayer IA, Sanders ME, Gianni L. Nat Rev Clin Oncol. 2016 doi: 10.1038/nrclinonc.2016.66. [DOI] [PMC free article] [PubMed] [Google Scholar]
- 85.Bonotto M, Gerratana L, Poletto E, Driol P, Giangreco M, Russo S, Minisini AM, Andreetta C, Mansutti M, Pisa FE, Fasola G, Puglisi F. Oncologist. 2014;19:608–15. doi: 10.1634/theoncologist.2014-0002. [DOI] [PMC free article] [PubMed] [Google Scholar]
- 86.Lehmann BD, Bauer JA, Chen X, Sanders ME, Chakravarthy AB, Shyr Y, Pietenpol JA. J Clin Invest. 2011;121:2750–2767. doi: 10.1172/JCI45014. [DOI] [PMC free article] [PubMed] [Google Scholar]
- 87.Prat A, Adamo B, Cheang MCU, Anders CK, Carey LA, Perou CM. Oncologist. 2013;18:123–33. doi: 10.1634/theoncologist.2012-0397. [DOI] [PMC free article] [PubMed] [Google Scholar]
- 88.Liu YR, Jiang YZ, Xu XE, Da Yu K, Jin X, Hu X, Zuo W-J, Hao S, Wu J, Liu GY, Di GH, Li DQ, He XH, Hu WG, Shao ZM. Breast Cancer Res. 2016;18:33. doi: 10.1186/s13058-016-0690-8. [DOI] [PMC free article] [PubMed] [Google Scholar]
- 89.Burstein MD, Tsimelzon A, Poage GM, Covington KR, Contreras A, Fuqua SAW, Savage MI, Osborne CK, Hilsenbeck SG, Chang JC, Mills GB, Lau CC, Brown PH. Clin Cancer Res. 2015;21:1688–1698. doi: 10.1158/1078-0432.CCR-14-0432. [DOI] [PMC free article] [PubMed] [Google Scholar]
- 90.Cardnell RJ, Feng Y, Diao L, Fan YH, Masrorpour F, Wang J, Shen Y, Mills GB, Minna JD, Heymach JV, Byers LA. Clin Cancer Res. 2013;19:6322–6328. doi: 10.1158/1078-0432.CCR-13-1975. [DOI] [PMC free article] [PubMed] [Google Scholar]
- 91.Graves PR, Haystead TAJ. Microbiol Mol Biol Rev Microbiol Mol Biol Rev. 2002;66:39–63. doi: 10.1128/MMBR.66.1.39-63.2002. [DOI] [PMC free article] [PubMed] [Google Scholar]
- 92.Ezkurdia I, Juan D, Rodriguez JM, Frankish A, Diekhans M, Harrow J, Vazquez J, Valencia A, Tress ML. bioRxiv p. 2014 doi: 10.1093/hmg/ddu309. [DOI] [PMC free article] [PubMed] [Google Scholar]
- 93.Kennedy JJ, Abbatiello SE, Kim K, Yan P, Jeffrey R, Lin C, Kim JS, Zhang Y, Wang X, Richard G, Zhao L, Min H, Lee Y, Yu M, Yang EG. 2014;11:149–155. doi: 10.1038/nmeth.2763. [DOI] [PMC free article] [PubMed] [Google Scholar]
- 94.Liu NQ, Stingl C, Look MP, Smid M, Braakman RBH, De Marchi T, Sieuwerts AM, Span PN, Sweep FCGJ, Linderholm BK, Mangia A, Paradiso A, Dirix LY, Van Laere SJ, Luider TM, Martens JWM, Foekens JA, Umar A. J Natl Cancer Inst. 2014:106. doi: 10.1093/jnci/djt376. [DOI] [PMC free article] [PubMed] [Google Scholar]
- 95.Senn HJJ, Thürlimann B, Goldhirsch A, Wood WCC, Gelber RDD, Coates ASS, Thurlimann B. Breast. 2003;12:569–582. doi: 10.1016/j.breast.2003.09.007. [DOI] [PubMed] [Google Scholar]
- 96.Eifel P, Axelson JA, Costa J, Crowley J, Curran WJ, Deshler A, Fulton S, Hendricks CB, Kemeny M, Kornblith AB, Louis TA, Markman M, Mayer R, Roter D. JNCI J Natl Cancer Inst. 2001;93:979–989. doi: 10.1093/jnci/93.13.979. [DOI] [PubMed] [Google Scholar]
- 97.Liu NQ, De Marchi T, Timmermans AM, Beekhof R, Trapman-Jansen AMaC, Foekens R, Look MP, van Deurzen CHM, Span PN, Sweep FCGJ, Brask JB, Timmermans-Wielenga V, Debets R, Martens JWM, Foekens Ja, Umar A. Mol Cell Proteomics. 2014:1814–1827. doi: 10.1074/mcp.M113.037176. [DOI] [PMC free article] [PubMed] [Google Scholar]
- 98.Campone M, Valo I, Jézéquel P, Moreau M, Boissard A, Campion L, Loussouarn D, Verriele V, Coqueret O, Guette C. Mol Cell Proteomics. 2015:2936–2946. doi: 10.1074/mcp.M115.048967. [DOI] [PMC free article] [PubMed] [Google Scholar]
- 99.Leclercq M, Guy L. Breast Cancer Res Treat. 2004:249–289. doi: 10.1023/B:BREA.0000014042.54925.cc. [DOI] [PubMed] [Google Scholar]
- 100.Hyder SM, Liang Y, Wu J. Int J Cancer. 2009;125:1045–1053. doi: 10.1002/ijc.24373. [DOI] [PMC free article] [PubMed] [Google Scholar]
- 101.Judes G, Rifaï K, Daures M, Dubois L, Bignon Y-J, Penault-Llorca F, Bernard-Gallon D. Cancer Lett. 2016:1–9. doi: 10.1016/j.canlet.2016.03.001. [DOI] [PubMed] [Google Scholar]
- 102.Suman S, Basak T, Gupta P, Mishra S, Kumar V, Sengupta S, Shukla Y. J Proteomics. 2016;148:183–193. doi: 10.1016/j.jprot.2016.07.033. [DOI] [PubMed] [Google Scholar]
- 103.Maurizio E, Wiśniewski JR, Ciani Y, Amato A, Arnoldo L, Penzo C, Pegoraro S, Giancotti V, Zambelli A, Piazza S, Manfioletti G, Sgarra R. Mol Cell Proteomics. 2016;15:109–23. doi: 10.1074/mcp.M115.050401. [DOI] [PMC free article] [PubMed] [Google Scholar]
- 104.Sun T, Aceto N, Meerbrey KL, Kessler JD, Zhou C, Migliaccio I, Nguyen DX, Pavlova NN, Botero M, Huang J, Bernardi RJ, Schmitt E, Hu G, Li MZ, Dephoure N, Gygi SP, Rao M, Creighton CJ, Hilsenbeck SG, Shaw CA, Muzny D, Gibbs RA, Wheeler DA, Osborne CK, Schiff R, Bentires-Alj M, Elledge SJ, Westbrook TF. Cell. 2011;144:703–718. doi: 10.1016/j.cell.2011.02.003. [DOI] [PMC free article] [PubMed] [Google Scholar]
- 105.Cabezon T, Gromova I, Gromov P, Serizawa R, Timmermans Wielenga V, Kroman N, Celis JE, Moreira JMa. Mol Cell Proteomics. 2012;12:381–394. doi: 10.1074/mcp.M112.019786. [DOI] [PMC free article] [PubMed] [Google Scholar]
- 106.Corrêa S, Panis C, Binato R, Herrera AC, Pizzatti L, Abdelhay E. J Proteomics. 2016 doi: 10.1016/j.jprot.2016.07.030. [DOI] [PubMed] [Google Scholar]
- 107.Song D, Yue L, Zhang J, Ma S, Zhao W, Guo F, Fan Y, Yang H, Liu Q, Zhang D, Xia Z, Qin P, Yue M, Yu J, Zheng S, Yang F, Wang J. Cancer Biol Ther. 2016:4047. doi: 10.1080/15384047.2016.1156262. [DOI] [PMC free article] [PubMed] [Google Scholar]
- 108.He J, Whelan SA, Lu M, Shen D, Chung DU, Saxton RE, Faull KF, Whitelegge JP, Chang HR. Int J Proteomics. 2011;2011:896476. doi: 10.1155/2011/896476. [DOI] [PMC free article] [PubMed] [Google Scholar]
- 109.Semaan SM, Wang X, Stewart PA, Marshall AG, Sang QXA. Biochem Biophys Res Commun. 2011;412:127–131. doi: 10.1016/j.bbrc.2011.07.057. [DOI] [PubMed] [Google Scholar]
- 110.Geiger T, Cox J, Ostasiewicz P, Wisniewski JR, Mann M. Nat Methods. 2010;7:383–385. doi: 10.1038/nmeth.1446. [DOI] [PubMed] [Google Scholar]
- 111.Vergara D, Simeone P, del Boccio P, Toto C, Pieragostino D, Tinelli A, Acierno R, Alberti S, Salzet M, Giannelli G, Sacchetta P, Maffia M. Mol BioSyst. 2013;9:1127–1138. doi: 10.1039/c2mb25401h. [DOI] [PubMed] [Google Scholar]
- 112.Wu X, Zahari MS, Ma B, Liu R, Renuse S, Sahasrabuddhe NA, Chen L, Chaerkady R, Kim M-S, Zhong J, Jelinek C, Barbhuiya MA, Leal-Rojas P, Yang Y, Kashyap MK, Marimuthu A, Ling M, Fackler MJ, Merino V, Zhang Z, Zahnow CA, Gabrielson E, Stearns V, Roa JC, Sukumar S, Gill PS, Pandey A. Oncotarget. 2015;6:29143–29160. doi: 10.18632/oncotarget.5020. [DOI] [PMC free article] [PubMed] [Google Scholar]
- 113.Manning G. WormBook. 2005:1–19. doi: 10.1895/wormbook.1.60.1. [DOI] [PMC free article] [PubMed] [Google Scholar]
- 114.Rauch J, Volinsky N, Romano D, Kolch W. Cell Commun Signal. 2011;9:23. doi: 10.1186/1478-811X-9-23. [DOI] [PMC free article] [PubMed] [Google Scholar]
- 115.Mertins P, Mani DR, Ruggles KV, Gillette MA, Clauser KR, Wang P, Wang X, Cao S, Petralia F, Kawaler E, Mundt F, Krug K, Tu Z, Lei JT, Gatza ML, Wilkerson M, Perou CM, Yellapantula V, Huang K, Lin C, Mclellan MD, Yan P, Davies SR, Townsend RR, Skates SJ, Wang J, Zhang B, Kinsinger CR, Mesri M, Rodriguez H, Ding L, Paulovich AG, Fenyö D, Ellis MJ, Carr SA, Cptac NCI. Nature. 2016;534:55–62. doi: 10.1038/nature18003. [DOI] [PMC free article] [PubMed] [Google Scholar]
- 116.Pearl LH, Barford D. Curr Opin Struct Biol. 2002;12:761–767. doi: 10.1016/s0959-440x(02)00386-x. [DOI] [PubMed] [Google Scholar]
- 117.Sun GC, Yang X, Yu Y, Zhao DW RE XPATH ERROR: unknown variable ‘tname’. Anticancer Agents Med Chem. 2015;15:869–80. doi: 10.2174/1871520615666150318101845. [DOI] [PubMed] [Google Scholar]