

Abstract
Enterococcus faecalis is one of the major causes for hospital-acquired antibiotic-resistant infections. It produces an exotoxin, called cytolysin, which is lethal for a wide range of Gram-positive bacteria and is toxic to higher organisms. Recently, the regulation of the cytolysin operon was connected to autoinduction by a quorum-sensing mechanism involving the CylR1/CylR2 two-component regulatory system. We report here the crystal structure of CylR2 and its properties in solution as determined by heteronuclear NMR spectroscopy. The structure reveals a rigid dimer containing a helix–turn–helix DNA-binding motif as part of a five-helix bundle that is extended by an antiparallel β-sheet. We show that CylR2 is a DNA-binding protein that binds specifically to a 22 bp fragment of the cytolysin promoter region. NMR chemical shift perturbation experiments identify surfaces involved in DNA binding and are in agreement with a model for the CylR2/DNA complex that attributes binding specificity to a complex network of CylR2/DNA interactions. Our results propose a mechanism where repression is achieved by CylR2 obstruction of the promoter preventing biosynthesis of the cytolysin operon transcript.
Keywords: antibiotic-resistant infection, CylR2, DNA complex, quorum-sensing, signal transduction
Introduction
Enterococci, ordinarily commensal organisms of the gastrointestinal tract, have emerged as leading causes of hospital-acquired infections and these infections are often highly refractory to antibiotic treatment (Huycke et al, 1998; Mundy et al, 2000; Gilmore and Ferretti, 2003; Hancock and Gilmore, 2003). The species Enterococcus faecalis causes most of the enterococcal infections (Huycke et al, 1998; Mundy et al, 2000), and several factors that are often encoded within a pathogenicity island (Shankar et al, 2002) or on plasmids have been shown to contribute to the virulence of the species (Shankar et al, 2001; Coburn and Gilmore, 2003). Perhaps the most thoroughly characterized virulence factor of E. faecalis is the cytolysin (Gilmore et al, 2002; Coburn and Gilmore, 2003). The enterococcal cytolysin is a novel toxin that consists of two nonidentical, post-translationally modified subunits (Booth et al, 1996; Coburn and Gilmore, 2003). These subunits interact to cause lysis of erythrocytes and other eukaryotic cells, and the cytolysin is lethal for a wide range of Gram-positive bacteria (Jett and Gilmore, 1990; Coburn and Gilmore, 2003). As this toxin is lethal for strains that lack a specific immunity gene encoded within the same operon (Coburn et al, 1999), regulation of cytolysin expression has to be carefully orchestrated with regulation of immunity. It was recently shown that cytolysin operon expression is regulated by a quorum-sensing system, with two genes, CylR1 and CylR2, shown to be essential for this regulation (Haas et al, 2002).
In most cases of cell–cell communication between bacteria, binding of a signaling peptide to a histidine kinase receptor on the cell surface results in autophosphorylation of the kinase and the phosphate is transferred to a response regulator converting it to an active transcription factor. Alternatively, the peptide signal is imported into the cell by an oligopeptide permease where it interacts with an intracellular receptor (Hoch, 2000).
The CylR1/CylR2 two-component regulatory system differs from known signal transduction systems in that neither CylR1 nor CylR2 shows relatedness to the superfamily of two-component regulators (Haas et al, 2002). Repression of the cytolysin gene is overcome in a density-dependent fashion as a result of the accumulation of one of the post-translationally modified subunits of the toxin, CylLS″, but the mechanism by which this accumulation is sensed by the cell is presently unknown. It is predicted that CylR2 may contain a helix–turn–helix (HTH) motif, and that CylR1 would likely be a membrane-bound protein. Thus, a model was proposed by Haas et al (2002) in which CylR2, interacting with membrane-bound CylR1, binds and represses the cytolysin promoter until CylLS″ is accumulated to a threshold level to trigger a change that alters or releases the promoter, allowing for transcription.
Aside from the demonstration that mutations in either CylR1 or CylR2 lead to derepression of the operon (Haas et al, 2002), precise details of the mechanism as to how quorum-sensing autoinduction of cytolysin expression is achieved remain to be determined. As an important step toward unraveling the mechanism of regulation of this enterococcal virulence factor, it was of interest to determine (1) whether CylR2 actually binds DNA as the model predicts, (2) whether it specifically binds within the promoter region of the cytolysin operon, and (3) whether the three-dimensional structure of CylR2 and the structural basis for its DNA-binding specificity reveal opportunities for the design of antagonists.
Results and discussion
CylR2 binds the cytolysin promoter region
A radiolabeled probe complementary to the intergenic region between CylLL and CylR1, which contains two divergent overlapping promoters Preg and Plys (Figure 1) that drive transcription of the regulatory and structural transcripts of the cytolysin respectively (Haas, submitted), was found to interact with CylR2 resulting in a shift in electrophoretic mobility by gel shift analysis (Figure 2A). This interaction was detectable at an approximately equimolar ratio of CylR2 to probe in the presence of nonspecific DNA 100-fold in excess to the labeled probe (Figure 2A), and exhibited an apparent Kd of 2.2 nM (Supplementary Figure S1). A similarly strong DNA binding with a Kd of about 3.3 nM was observed for the repressor from bacteriophage 434 (Bell and Koudelka, 1993; Simoncsits et al, 1997).
Figure 1.
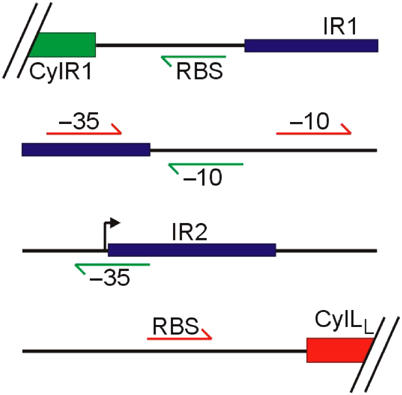
Intergenic region between cylLL and cylR1, containing divergent overlapping promoters, Preg and Plyt, involved in cytolysin expression and regulation. Two palindromic sequences within the promoter region are designated IR1 and IR2. Promoter elements (−10: −10 box, −35: −35 box, RBS: ribosomal binding site, bent arrow: transcriptional start site) for Preg and Plyt are shown in green and red, respectively.
Figure 2.
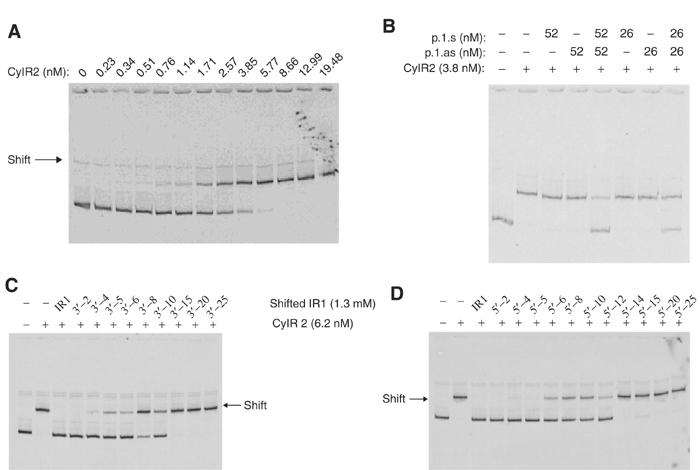
Gel shift analysis of CylR2 binding to different DNA sequences. (A) Titration of CylR2 to radiolabeled probe (1 ng probe (0.67 nM)) representing the cytolysin promoter region. (B) Effect of complementary ss IR1 oligonucleotides (p.1.s and p.1.as), alone or in combination, in order to compete for CylR2 binding to the intergenic region of the cytolysin operon (1 ng probe, 0.67 nM). (C) Competition between nested IR1 oligonucleotides shifted in the 3′ direction (2 ng probe, 1.3 nM), or (D) 5′ direction (2 ng probe, 1.3 nM) and the radiolabeled probe for CylR2 binding.
CylR2 binds the intergenic region at inverted repeat 1
The binding of CylR2 to either of two inverted repeats (IR1 and IR2) within the cytolysin promoter (Figure 1) was determined by gel shift analysis. In this case, the ability of unlabeled IR1 and IR2 constructed from synthetic oligonucleotides to compete with a labeled probe of the entire intergenic region to bind CylR2 was assessed. The results showed that CylR2 bound IR1, in that addition of double-stranded (ds) IR1 in either 14- or seven-fold molar excess with respect to CylR2 reduced the CylR2 binding of the radiolabeled intergenic probe (Figure 2B). This effect was not observed with neither single-stranded (ss) IR1 (Figure 2B), nor ds IR2 or ss IR2, at concentrations identical to those used for IR1 (data not shown). Nested, overlapping ds IR1 oligonucleotides were tested to determine which sequences within IR1 were critical for binding. Oligonucleotides that were shifted by six bases in either the 5′ or 3′ direction within IR1 showed reduced capacity to compete for CylR2 binding. Binding was completely lost when the sequence was shifted by 15 bases in either the 5′ or 3′ direction of IR1 (Figure 2C and D).
Structure determination and quality of the final model
Molecular replacement trials were carried out with Bacillus subtilis SinR (Lewis et al, 1998) and ribosome recycling factor from Thermus thermophilus (ttRRF) (Toyoda et al, 2000) as search models. According to a Blast search (Altschul et al, 1997), these proteins have the highest sequence identities to CylR2, with 31 and 32%, respectively. The structure of CylR2 may contain an HTH DNA-binding motif, as indicated by sequence-based structure predictions. Therefore, molecular replacement trials were also performed using as search models the paradigms of HTH DNA-binding proteins: cro and repressor proteins from the bacteriophage 434 (Mondragon et al, 1989b; Harrison and Aggarwal, 1990). All attempts to solve the structure by molecular replacement failed. Therefore the structure was determined at 1.9 Å resolution by single anomalous dispersion exploiting the anomalous signal of noncovalently bound iodide ions (Dauter and Dauter, 2001; Dauter et al, 2000).
The model was refined up to an Rfactor and Rfree of 15.5 and 19.2%, respectively. The coordinate error estimated from the diffraction-component precision index is 0.12 Å. A summary of the refinement statistics and characteristics of the final model is shown in Table I.
Table 1.
Summary of refinement statistics and characteristics of the model
| Resolution range (Å) | 19.8–1.9 |
| Reflections unique/free | 13 208/651 |
| Rfactor/Rfree (%) | 15.5/19.2 |
| No. of residues | 132 |
| No. of iodide/sodium ions | 15/1 |
| No. of water molecules | 194 |
| R.m.s. deviations in bond lengths (Å) | 0.012 |
| R.m.s. deviations in bond angles (deg) | 1.219 |
| Ramachandran plot (%) | |
| Most favored | 95.8 |
| Additionally allowed (%) | 4.2 |
| Average B-factor (Å2) | |
| Protein (subunit A/B) | 20.8/23.7 |
| Solvent (subunit A/B) |
38.2/41.8 |
| Rfactor=∑hkl∣∣Fobs(hkl)∣–k∣Fcal(hkl)∣∣/∑hkl∣Fobs(hkl)∣, in which Fobs and Fcal are the observed and calculated structure factors, respectively. Rfree, the crossvalidation Rfactor, was calculated with 5% of the reflections omitted in the refinement process. | |
The model of CylR2 consists of 132 residues, corresponding to two molecules in the asymmetric unit, 15 iodide ions, a sodium ion and 194 water molecules. About 96% of the residues are in the most favored regions of the Ramachandran plot (Ramakrishnan and Ramachandran, 1965), as calculated by PROCHECK (Laskowski et al, 1993). The structure is well ordered: the overall Wilson plot B-factor is 25 Å2 and the main chain of all residues, except for the C-terminal carboxyl group of Glu66 in molecule B, fits well the electron density map. A number of atoms belonging to side chains of Asn5, Lys7, Leu8, Gln29, Lys36, Gln44, Gln62, Glu66 in molecule A and Ser18, Glu19, Gln62 in molecule B were assigned occupancy 0.5, as their electron density was not as good as that for the rest of the structure. The positions of iodide ions were confirmed by anomalous difference Fourier maps. Their occupancies were adjusted to obtain B-factors comparable to those of surrounding residues.
Three-dimensional structure of CylR2
The structure of CylR2 consists of five helices (α1–α5) and an antiparallel β-sheet, which is formed by strands β1 and β2, at the N- and C-terminus of CylR2, respectively (Figure 3). Helices α2 and α3 make up the HTH DNA-binding motif and are defined as the ‘scaffold' and ‘recognition' helix, respectively (Harrison and Aggarwal, 1990).
Figure 3.
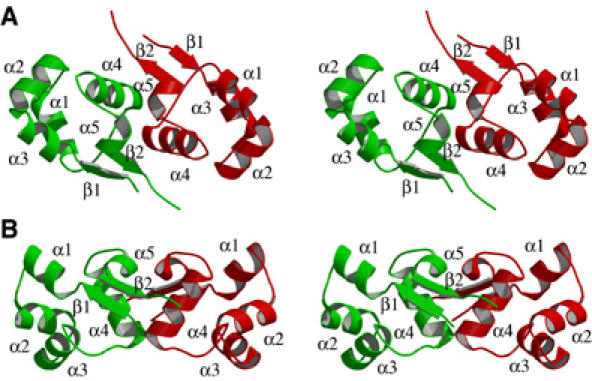
Stereo view of the crystal structure of CylR2. Subunits A and B are shown in red and green. Helices are labeled with α1–α5 and β-strands are labeled with β1 and β2. (A) Stereo view of the homodimer looking down the dimer two-fold axis. (B) CylR2 is rotated by 90° about the horizontal axis.
Helices α1, α2 and α3 pack against each other and the architecture of their fold is supported by hydrophobic and hydrophilic interactions, reflecting their amphipathic nature. The hydrophobic residues are oriented toward the center of the molecule, while hydrophilic residues, on the surface of the molecule, protect the hydrophobic core. A buried salt bridge between Arg10 and Glu35 connects helices α1–α3. The salt bridge has already been indicated as an important feature in HTH DNA-binding proteins with the function of stabilizing the fold and determining the relative orientation of the scaffold and recognition helices (Pervushin et al, 1996).
In HTH DNA-binding proteins, the tight turns between the helices are usually sterically favored by glycine (Mondragon et al, 1989a). However, in CylR2, other residues replace these glycines in sharp bends: Lys14 (α1–α2), Glu25 (α2–α3), Asn37 (α3–α4) and Asn54 (α4–α5). All of these have main-chain dihedral angles lying in the left-handed α-helical region of the Ramachandran plot, which is usually occupied by glycines. Their main-chain conformations are mostly stabilized by H-bonds between their amino and carbonyl groups of residues (n−3), a typical feature of β-turns.
Helices α4 and α5 are predominantly hydrophobic, contribute to the hydrophobic patch in the interior of the molecule and, more importantly, mediate the dimeric contacts (see below).
A DALI (Holm and Sander, 1993) search identified B. subtilis SinR (Lewis et al, 1998) and the N-terminal domain of 434 repressor as the structures having the closest structural similarity to CylR2 dimer with r.m.s.d. values of 2.2 and 1.7 Å, respectively (alignment of 62 Cα atoms of SinR and 59 Cα atoms of 434 repressor with structurally equivalent atoms of CylR2). The α-helical portion of the structure superimposes quite well on both SinR (Lewis et al, 1998) and 434 repressor (Mondragon et al, 1989a). The main divergences are in the turn between α3 and α4 and in the N- and C-terminal regions. In CylR2, the N- and C-terminal helices α1 and α5 are shorter than in SinR and 434 repressor and are preceded and followed by β-strands, which form an antiparallel β-sheet. SinR and 434 repressor lack this β-sheet.
NMR assignment of CylR2
In order to enable characterization of structure, dynamics and DNA-binding properties of CylR2 in solution, NMR resonances of CylR2 were assigned. Analysis of triple-resonance NMR spectra (Bax and Grzesiek, 1993) allowed identification and sequential assignment of all backbone amide resonances and of all Cα and Cβ chemical shifts. The assignment of Hα and the aliphatic proton and carbon side-chain resonances is complete for all residues with the exception of the carboxy-terminal Glu66. Protonated 15N resonances have been found for the side chains of all five glutamine residues, of five out of six asparagines and of the tryptophan side chain. More than 80% of the aromatic proton and carbon 1H and 13C side chains have been unambiguously assigned. Assigned 1H, 13C and 15N chemical shifts have been deposited in the BioMagResBank (http://www.bmrb.wisc.edu), accession code 10065.
CylR2 structure and dynamics in solution
The structure of CylR2 in solution was probed by heteronuclear NMR spectroscopy using residual dipolar couplings (RDCs) (Tjandra and Bax, 1997). Comparison of experimental 1DNH couplings with values back-calculated from the CylR2 crystal structure using singular value decomposition resulted in a correlation of 0.97 (Figure 4A). This proves that the backbone structure of CylR2 in solution agrees well with that in the crystalline state.
Figure 4.
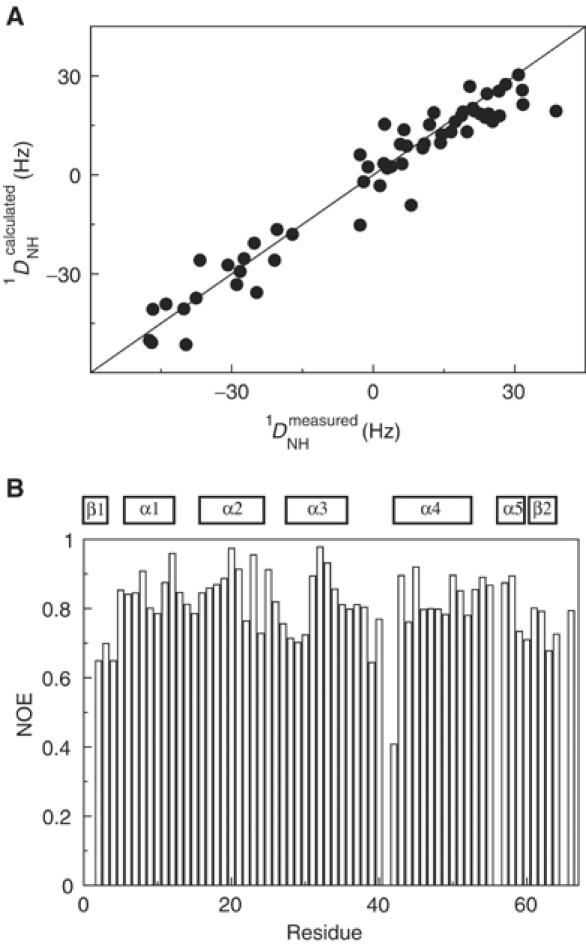
CylR2 in solution. (A) Correlation between experimental main-chain 1DNH couplings and values back-calculated from the crystal structure. (B) The 1H-15N heteronuclear NOE plotted against the residue number. Secondary structure elements are indicated.
Steady-state heteronuclear 15N{1H}-NOEs for most of the CylR2 backbone amides are above 0.7, indicating that the backbone of CylR2 is well ordered in solution (Figure 4B). Only Ser42 in the (α3–α4) loop is flexible with an 15N{1H}-NOE of 0.4 and the four N-terminal residues are slightly affected by motion.
Dimerization
NMR relaxation times indicate that in solution CylR2 is dimeric for concentrations above 10 μM (data not shown). In the crystal structure, CylR2 forms a dimer with overall dimensions of about 18 Å × 36 Å × 44 Å. The two subunits, which are related by a two-fold noncrystallographic symmetry, are very similar: the r.m.s.d. is 0.7 Å by superposition of Cα atoms (Figure 3). The N- and C-terminal residues have the highest r.m.s. deviations of about 2 Å. Helices α4 and α5 contribute extensively to the dimeric interface (Figure 5A). Helices α4 are very close to one another at their N-termini (the distance between the Leu43 Cαs is 4.5 Å) and diverge at their C-termini. C-terminally of α4, the two CylR2 subunits again come closer by means of helices α5, whose N-termini contact one another. Strands β1 and β2 mediate also intersubunit contacts by sandwiching helices α4 and α5.
Figure 5.
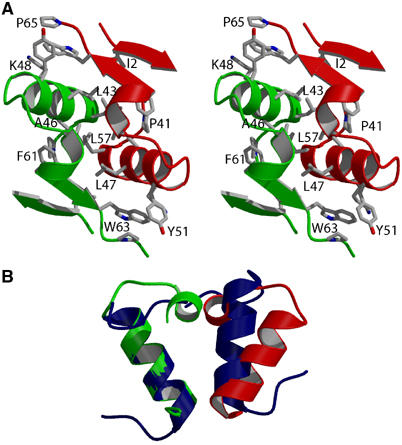
Dimer interface of CylR2. (A) Residues 1–5 and 40–65 of subunits A and B are colored red and green. Side chains of the predominantly hydrophobic residues Ile2, Pro41, Leu43, Ala46, Leu47, Lys48, Tyr51, Leu57, Phe61, Trp63 and Pro65 are shown. The orientation corresponds to Figure 3A. (B) Residues 40–60 of CylR2 (red/green) are superimposed on residues 55–74 of GerE (blue). The orientation corresponds to Figure 3B.
In general, the side chains along the dimeric interface have the same conformations and superimpose well. The interface is predominantly hydrophobic, consisting of residues Ile2, Pro41, Leu43, Ala46, Leu47 and the aliphatic part of Lys48, Tyr51, Leu57, Phe61, Trp63, Pro65 (Figure 5A). The hydrophilic interactions between the subunits are mostly water-mediated. There are only four direct hydrogen bonds from the side chains of Gln44 and Glu58 of one subunit to the main-chain nitrogens of Met1 and Leu57 of the other subunit, respectively. The side chains of the two Glu58 come close to one another: into the electron density connecting them, a sodium ion was placed. A water molecule introduced in this position showed an unusual low B-factor upon structural refinement. Thus the sodium ion between the Glu58 side chains neutralizes the local negative potential.
A similar dimerization mode is also observed for the HTH DNA-binding protein GerE (Ducros et al, 2001). However, helices α5 and strands β1 and β2 are missing and the angle between helices α4 is 20° narrower than in CylR2 (Figure 5B). In CylR2, helices α5 are pushing apart helices α4 (Figure 5A). Dimerization of CylR2 is achieved by formation of an extensive hydrophobic interface, which is shielded from the solvent (Figure 5A). It buries a total of 1600 Å2 of the solvent-accessible surface, accounting for about 18% of the total accessible area of each subunit. This is significantly more than in GerE and the N-terminal domain of 434 repressor, where 12 (Ducros et al, 2001) and 9% (Aggarwal et al, 1988) of the accessible area of each subunit are buried upon dimerization, respectively. Especially for the 434 repressor, dimerization is energetically more favorable in the DNA complex structure as charged residues at the dimer interface are neutralized upon DNA binding (Aggarwal et al, 1988).
The relative orientations of the two monomers in CylR2 and the N-terminal domain of 434 repressor bound to DNA are quite different. If only one monomer of CylR2 is superimposed on one 434 repressor monomer, the other monomers are related by a rotation of about 20° around the axis connecting the CylR2 Ser42 Cαs. In addition, the two recognition helices are about 2 Å further apart in CylR2 than in the N-terminal domain of 434 repressor bound to DNA.
Mapping of the DNA-binding site by chemical shift perturbation
The DNA interaction surface of CylR2 was determined using the NMR chemical shift perturbation method (Craik and Wilce, 1997), in which two-dimensional 1H-15N HSQC spectra of CylR2 were recorded with successive addition of the 22 bp DNA (Figure 7A). Upon DNA binding, resonances of unbound CylR2 weaken continuously and new resonances appear with significant chemical shift differences. This indicates that the free protein is in slow exchange on the NMR time scale with its DNA complex form. For both free and bound protein, only a single set of resonances was observed (Figure 6). In order to allow quantification of the observed chemical shift changes, backbone resonances of CylR2 in complex with its DNA were reassigned. Based on this assignment, the largest chemical shift changes were observed for the backbone amides of Tyr39 and Asn40 and the side-chain amides of Gln29, Asn40 and Gln44. In addition, large chemical shift changes are observed for the backbone amides of residues 16–20, 28–34 and 44–46 (Figures 6 and 7B). This indicates that especially the recognition helix, the (α3–α4) loop and the N-terminal halves of the α2 and α4 helices are involved in binding to the IR1 repeat sequence, similar to what had been observed for the N-terminal domain of 434 repressor (Aggarwal et al, 1988; Shimon and Harrison, 1993). A continuous, positively charged surface for binding to DNA is formed (Figure 8).
Figure 7.
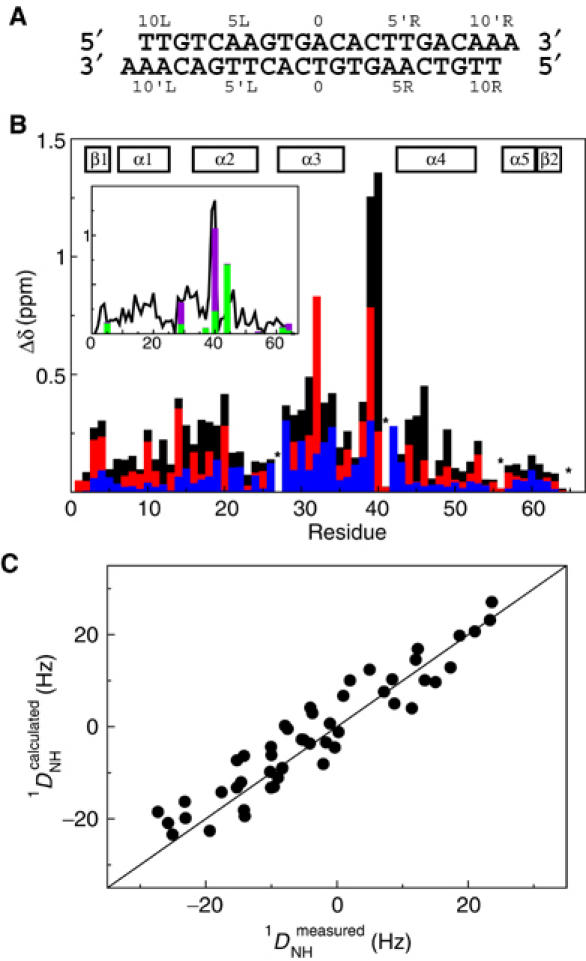
CylR2/DNA interaction. (A) The 22-mer DNA sequence of IR1 used for NMR titration experiments. (B) Combined chemical shift changes (Δδ) for CylR2 upon addition of DNA. Chemical shift changes are shown in black for Δδtot, red for ΔδCαCβ and blue for ΔδC′. Unassigned and proline residues are labeled with an asterisk. The inset displays Δδtot as a solid line. Chemical shift changes for the complete amide side chains Δδside in magenta and for the amide Cγ or Cδ ΔδsideC in green (see Materials and methods). Side-chain resonances not shown could not be detected. (C) Correlation between experimental main-chain 1DNH couplings for CylR2 in complex with DNA and values back-calculated from the crystal structure of free CylR2.
Figure 6.
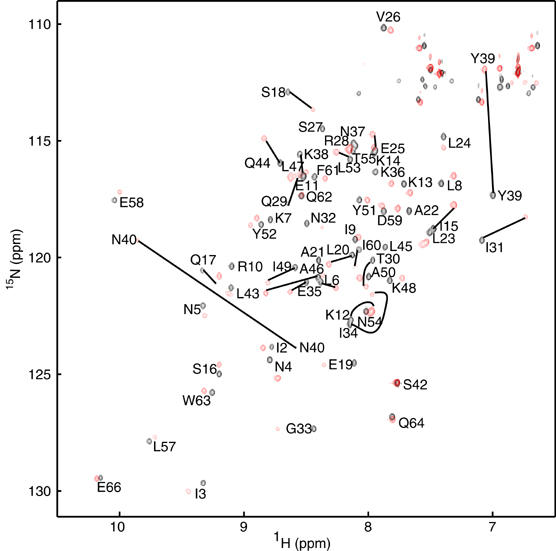
Overlay of 1H-15N HSQC spectra of CylR2 (black) and CylR2/DNA complex (red). Black lines connect strongly shifted resonances of free and complexed CylR2. Residue Ser27 is unassigned in the complex.
Figure 8.
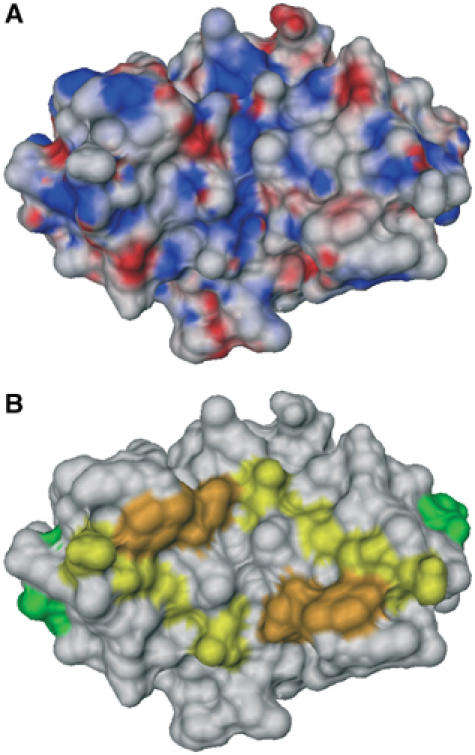
(A) Electrostatic surface of the CylR2 dimer with positive and negative potentials colored blue and red, respectively. (B) Chemical shift changes upon DNA binding mapped to the surface of the CylR2 dimer. Protein residues whose δHN and δN chemical shifts are affected very strongly (Y39, N40), strongly (Q29, T30, I31, Q44, L45, A46) and intermediately (Q17, S18, E19, L20) are colored orange, yellow and green, respectively. The orientation corresponds to Figure 3A.
Chemical shift mapping was also performed with an 18 bp fragment. No chemical shift changes could be observed for CylR2. This proves that CylR2 interactions also occur outside of the 18 bp core and the minimum length of an IR1 fragment required for binding to CylR2 is 20 or 22 bp in agreement with gel shift results (see above).
Contribution of Asn40 of CylR2 to cytolysin expression from Plyt
NMR chemical shift perturbation studies implicated Asn40 of CylR2 in binding the cytolysin promoter. The consequence of mutating this residue to an alanine residue on cytolysin expression was examined in a LacZ reporter system, in which LacZ transcription is driven by the cytolysin promoter Plyt under the control of CylR1 and CylR2.
Levels of LacZ activity indicate that expression in E. faecalis FA2-2 from the cytolysin promoter in the presence of wild-type CylR2 (pLX110) is repressed until induced by the exogenous addition of autoinducer CylLS″, after which a 10-fold increase in expression was observed (Figure 9). Analysis of LacZ expression from an identical construct in which the Asn40 residue of CylR2 was mutated to an alanine (pLXR2N40A) revealed a derepression of the cytolysin promoter resulting in large amounts of LacZ activity whether the operon was induced or not (Figure 9). These results are consistent with the proposed role of CylR2 as a repressor of cytolysin expression from Plyt via its interaction with cytolysin promoter DNA.
Figure 9.
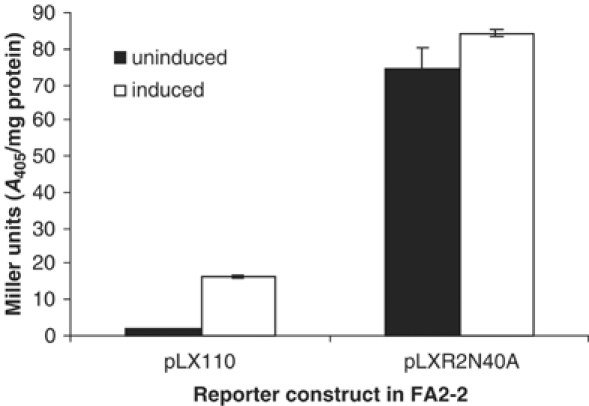
LacZ activity detected from FA2-2 containing reporter constructs pLX110 (wild-type CylR2) and pLXR2N40A (Asn40 of CylR2 replaced with alanine). Data expressed in Miller units (A405/mg protein). Cultures were either induced with FA2-2 pWH617 supernatant (containing CylLS″) or left uninduced by incubating with FA2-2 pAT28 supernatant (vector control).
Model for the CylR2/DNA complex
We have shown that CylR2 binds specifically to the IR1 inverted repeat that exists within the cytolysin promoter. The NMR shift perturbation results of CylR2 with a 22 bp fragment of the IR1 repeat sequence (Figures 6 and 7) further demonstrated that similar regions in dimeric CylR2 are interacting with DNA as compared to the N-terminal domain of 434 repressor. In order to evaluate whether DNA binding is accompanied by changes in the backbone conformation of CylR2, RDCs were measured for CylR2 when bound to DNA using NMR spectroscopy. Best fitting 1DNH couplings observed for CylR2 in complex with DNA to the crystal structure of free CylR2 results in a correlation of 0.94 between experimental and back-calculated RDCs (Figure 7C). This shows that there are no major changes in the backbone structure of CylR2 upon binding to DNA.
Based on the combined information from gel shift, X-ray crystallographic and solution NMR studies, a model of the CylR2/DNA complex was constructed. In agreement with the absence of major conformational changes in CylR2 upon binding to DNA, a starting structure for the complex was built by superposition of the structure of the unbound CylR2 dimer onto the N-terminal domain of 434 repressor and replacement of the 434 operator by standard linear B-DNA. This initial model was refined using the protein–DNA docking program Monty (Knegtel et al, 1994a, 1994b): a Monte Carlo simulation was performed where the DNA was allowed to bend, side chains at the protein–DNA interface could rotate freely, and van der Waals contacts and hydrogen bonding between CylR2 and DNA were optimized. The docking was guided by information obtained from the NMR chemical shift perturbation studies: side chains of residues 10, 16–20, 24–32 and 34–45 were allowed to rotate freely in accordance with Figure 7B. In addition, energy bonuses were given during the simulation to complex structures where the backbone amides of Tyr39, Asn40, Gln44, Leu45 and Ala46 are in close contact with the DNA and when the NH2 of Gln29 contacts T5′ reflecting the strong chemical shift changes upon addition of DNA.
Figure 10 shows the model for the CylR2/DNA complex. It agrees with established dimeric HTH/DNA interactions (Wolberger et al, 1988; Harrison and Aggarwal, 1990); binding occurs with dyad symmetry on two adjacent major grooves through their recognition helix. In a similar manner as observed for the 434 repressor/OR1 complex structure, side chains of Ser27 and Gln29 form a van der Waals pocket to receive the methyl group of thymine 4′ (Figure 10B). Moreover, complex models indicate a bidentate hydrogen bonding for the NH2 of Arg28 to either G8, T7 or C6 and a hydrogen bond between the side chain of Gln29 and bp 4. The Gln29 hydrogen bond is likely to be formed with Oɛ of Gln29 as the hydrogen bond acceptor, because the Cδ resonance showed with ∼0.9 ppm a strong downfield shift while Nɛ and Hɛ remain nearly unchanged (Figure 7B). For the side chain of Arg28 only Cα and Cβ could be assigned, whereas both backbone and side-chain resonances were missing for Ser27 in the complex. The disappearance or strong perturbation of these resonances upon binding to DNA supports their importance for complex formation. At the N-terminus of helix 2, Gln17 forms van der Waals contacts and a hydrogen bond with the phosphate of T9, in agreement with the disappearance of the side-chain resonances of the Gln17 carbonyl group upon DNA binding. Docking results and chemical shift changes also suggest that bp 6 accepts a hydrogen bond from Asn32. NMR resonances from the carbonyl side chain of Asn32 were neither found for free nor complexed CylR2, but the Cβ and Cα of Asn32 were shifted by 2.8 and 1.1 ppm downfield, respectively (Figure 7B). Very important for stabilizing the CylR2/DNA complex is the (α3–α4) loop: for both CylR2 molecules, a hydrogen bond is formed from the main-chain –NH group of Asn40 to the phosphate of C1 in more than 30% of docking solutions, in agreement with a downfield shift of 1.1 ppm of its amide proton resonance.
Figure 10.
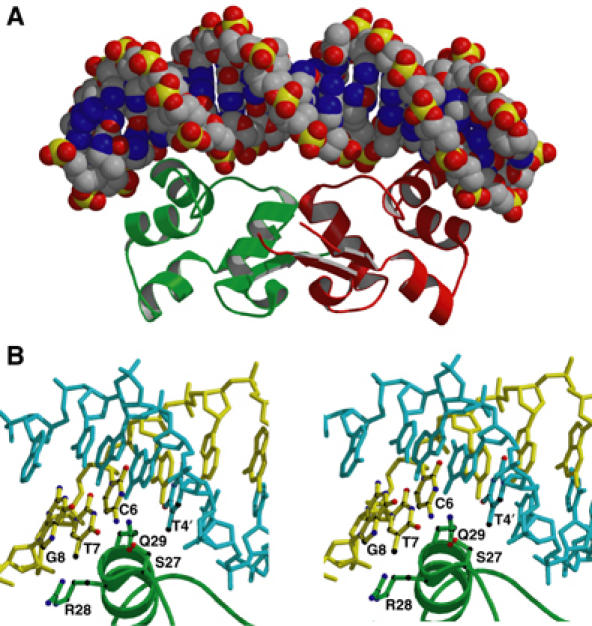
(A) Overall model of the CylR2/DNA complex structure. (B) Detailed stereo view indicating important protein–DNA interactions in the major groove. The DNA is shown with the sense strand in yellow and the antisense strand in cyan. Side chains of CylR2 and nucleobases interacting by van der Waals contacts and/or hydrogen bonds are indicated.
The best-fit of DNA to the dimeric structure of CylR2 was obtained for a DNA bending parameter of 0.4. For a more extended DNA, formation of protein/DNA interactions, which were expected on the basis of the NMR chemical shift perturbation studies, was not possible for both molecules of the CylR2 dimer simultaneously. When the DNA was more strongly bent, on the other hand, no docking solutions could be obtained that provided the necessary space to accommodate both CylR2 molecules (in the orientation and position that was observed for the uncomplexed CylR2 structure). Similar to the 434 repressor/DNA complex, the DNA is relatively straight in the middle of the operator and bends toward the ends to enable interactions with the side chains of Arg28 and Gln29 (Figure 10B). The helical axes of individual base pair, when projected onto the mean plane of bending, lie on a circle with a radius of 65 Å (Figure 10A). A specific feature of the 434/DNA complex is a strong compression of the minor groove due to insertion of the side chains of Arg43 of both molecules of the dimeric 434 repressor: the two positively charged side chains allow a closer approach of the negatively charged phosphates (Aggarwal et al, 1988). In CylR2, on the other hand, Arg43 is replaced by a serine; hence, the positive side chains are absent within the minor groove and no compression of the minor groove is required to dock DNA onto CylR2.
Our results show that CylR2 binds as a preformed dimer to a 22 bp fragment of the cytolysin promoter region and that mutation of a residue shown to be important in binding this region results in derepression in a reporter construct for the assessment of cytolysin expression. This proposes a mechanism where repression is achieved by CylR2 obstruction of the promoter preventing biosynthesis of the cytolysin operon transcript. The promoter binding is highly specific and is mediated through a complex network of CylR2/DNA interactions. In particular, the mutation of Asn40 to alanine significantly reduces the strength of CylR2–operator binding. CylR2 works together with CylR1 in order to repress transcription of cytolysin genes (Haas et al, 2002). To get an idea on how CylR1 influences CylR2–operator interaction, comparison with the repressor of phage 434 is particularly interesting. In the case of 434 repressor, it is the intricate combination of direct protein–DNA interactions and DNA conformational effects that enables differential binding to different operator binding sites. This very well orchestrated, differential binding determines the developmental fate of phage 434. By analogy, it can therefore be speculated that in the presence of the autoinducer CylLS″, CylR1 shifts the DNA-binding specificity of CylR2 to sequences adjacent to the IR1 repeat. The three-dimensional structure of CylR2 and its DNA-binding properties presented here provide first steps in understanding the molecular basis of cytolysin repression by the CylR1/CylR2 two-component regulatory system.
Materials and methods
Gel shift analysis
A PCR product 188 bp in length spanning the cytolysin promoter was amplified from pOPCT (25 ng) with 10 pmol primer ‘intergenic-f' (5′-AAG TAG ACT ACA GAA ATG ATA TCC-3′) and 10 pmol ‘intergenic-r' (5′-AAC TAG GAA CTA CAC TTA AA) under standard conditions for 25 cycles. A dsDNA 33P-labeled probe of this region was synthesized by reamplifying 50 ng of the purified PCR product in the presence of 25 μCi [α33P]dCTP (Perkin Elmer, Boston, MA), 0.25 mM dATP/dTTP/dGTP and 6.25 μM dCTP.
A 12.5 μl aliquot of recombinant CylR2 (487 fmol) in 25 mM HEPES (pH 7.0) and 125 mM NaCl was serially diluted 1.5-fold in 100 ng of salmon sperm DNA and radiolabeled probe (11.6 fmol), in a total volume of 25 μl, and was allowed to react for 45 min at room temperature. The reaction was combined with 5 μl of loading dye (0.25% bromophenol blue, 40% sucrose), and was analyzed by electrophoresis through a neutral 0.5 × TBE/10% acrylamide gel run at 275 V for 4 h at 4°C. The gel was vacuum dried onto filter paper, and was imaged with Kodak BioMax film (Eastman Kodak Co., Rochester, NY).
The dissociation constant for CylR2 and the probe derived from the intergenic region of the cytolysin operon was calculated based on the concentration of CylR2 at which 50% of the DNA probe was bound as described (Wieland et al, 2001). The 25 and 15 bp sequences, constituting inverted repeats IR1 and IR2 within the cytolysin promoter region, were constructed from complementary ss oligonucleotides: ‘p.1.s' (5′-TTT TGT CAA GTG ACA CTT GAC AAA A-3′), ‘p.1.as' (5′-TTT TGT CAA GTG TCA CTT GAC AAA A-3′), ‘p.2.s' (5′-TAA CAT ATT ATG TTA-3′) and ‘p.2.as' (5′-TAA CAT AAT ATG TTA-3′). These oligonucleotides were dissolved in TE (pH 7.0) and were incubated at 99°C for 5 min. An equal volume of each complementary oligonucleotide was combined and boiled in a water bath for 5 min. Ss oligonucleotides were subjected to the same treatment but were mixed with an equal volume of TE (pH 7.0). The oligonucleotides were annealed by allowing the H2O bath to slowly cool to room temperature on the benchtop. A 1 μl aliquot of IR1/IR2 oligonucleotide at the specified concentrations was incubated with a 12.5 μl aliquot of CylR2 (96 fmol) in the presence of 100 ng of salmon sperm DNA in a total volume of 22.5 μl for 45 min at room temperature. To the reaction, 2.5 μl of probe (16.7 fmol) was added and incubation proceeded at room temperature for an additional 45 min.
From the sequence surrounding IR1 in the intergenic region of the cytolysin operon, 25 bp complementary oligonucleotides in which the sequence was shifted 5′ or 3′ in a stepwise fashion were synthesized and allowed to anneal as described above. A 5 μl aliquot of the ds oligonucleotides (250 ng for each) was incubated with a 12.5 μl aliquot of CylR2 (155 fmol) for 30 min on ice. To the reaction, a 7.5 μl dilution of probe (33.4 fmol) was added and incubation proceeded on ice for an additional 30 min. The reactions were analyzed on acrylamide gels as described above.
Protein production for crystallization and data collection
Details of cloning, protein overexpression, purification and crystallization have been described elsewhere (Razeto et al, 2004).
Crystals were soaked for 30–60 s in mother liquor solutions containing 30% glycerol and flash-frozen. Crystal rotation of 382° φ was collected at 100°C up to 1.9 Å resolution with a Mar 345 area detector, using the CuKα radiation from a Siemens rotating anode generator. Data were processed by DENZO and SCALEPACK (Otwinowski and Minor, 1997).
Structure solution and refinement
The structure was solved by single anomalous wavelength diffraction (SAD) as described in Supplementary data. The data were subjected to 10 cycles of automated model building from experimental phases by ARP/wARP (Perrakis et al, 1999), coupled with REFMAC refinement (Murshudov et al, 1997) (a total of 100 cycles). This run succeeded in tracing 128 residues in three chains (out of 132 total residues belonging to two molecules in the asymmetric unit). The initial model was subjected to positional and B-factor restrained refinement with REFMAC (Murshudov et al, 1997), coupled with ARP/wARP solvent building (Perrakis et al, 1999). Except for the last three cycles, refinement was performed with 95% of the data, and 5% of randomly chosen reflections were used for the calculation of Rfree. Manual rebuilding was carried out with XtalView (McRee, 1999). The model converged to an Rfactor and Rfree of 15.5 and 19.2%, respectively (Supplementary data).
NMR measurements
NMR experiments were carried out at 298 K on Bruker AVANCE 600 or 800 MHz spectrometers. NMR samples contained 0.5 mM protein or 1 mM protein–DNA complex with uniformly 15N- or 15N/13C-labeled protein in 95% H2O/5% D2O, 50 mM HEPES (pH 7.0) and 350 mM NaCl. The protein:DNA ratio in the complex sample was 2:1. Backbone Cα, C′ and N assignments were obtained using standard triple-resonance experiments (Bax and Grzesiek, 1993). 3D TOCSY and NOESY spectra were performed with refocusing and mixing of 13C magnetization using adiabatic pulses (Zweckstetter and Holak, 1999; Peti et al, 2000). Additional experiments used for assignment of the free and bound protein are listed in Supplementary Table S2. All spectra were processed using NMRPipe/NMRDraw (Delaglio et al, 1995) and analyzed using NMRView 5.0.4 (Johnson and Blevins, 1994).
Anisotropic media for measurement of dipolar couplings were prepared by addition of filamentous phages (Pf1) to a concentration of 12 mg/ml (Hansen et al, 1998; Zweckstetter and Bax, 2001). In order to lower the electrostatic attraction between CylR2 and the highly negatively charged Pf1 phage, the ionic strength was raised to 500 mM for measurement of RDCs in both free and complexed CylR2. 1HN-15N splittings were measured under isotropic and anisotropic conditions using 2D IPAP-1H-15N HSQC experiments (Ottiger et al, 1998). RDCs were extracted by subtraction of the 1JNH scalar coupling measured for the isotropic sample. 1DNH dipolar couplings could be observed for 59 and 53 out of 63 backbone amide protons in CylR2 and the CylR2/DNA complex, respectively. The smaller number of RDCs for the complex is due to an increased line broadening in the DNA-bound state and a corresponding lower spectral quality. RDCs were best fitted to the crystal structure using singular value decomposition as implemented in PALES (Zweckstetter and Bax, 2000). The magnitude Da and rhombicity R of the alignment tensor were back-calculated as Da=−26.0 Hz and R=0.16 for the free protein and as Da=19.2 Hz and R=0.18 for the protein/DNA complex.
15N-1H-NOE values were calculated as the intensity ratios of the 15N-1H correlation peaks from pairs of interleaved spectra acquired with and without 1H presaturation during the recycle time of 5 s (Farrow et al, 1994).
DNA titration
The oligonucleotides used for NMR measurements were purchased from Eurogentec (Liège, Belgium). The 22 bp oligonucleotide used for NMR has the sequence 5′-TTGTCAAGTGACACTTGACAAA-3′ (Figure 7A). The oligonucleotide was resuspended in 5 mM HEPES pH 7.6, 0.05 M NaCl and 0.01 M MgCl2, and annealed by heating to 100°C for 5 min in a heatblock and cooling down slowly to room temperature. The annealed DNA was dialyzed against water, lyophilized and dissolved in the same buffer as the protein.
The CylR2/DNA complex formation was monitored by recording a series of 2D 1H-15N-HSQC spectra of a 100 μM 15N-labeled CylR2 solution with final DNA concentrations of 10, 20, 30, 50, 60 and 100 μM. The combined chemical shift change of a particular residue upon DNA binding was calculated according to
 |
 |
 |
For the amide side chains, chemical shift changes were determined as
 |
 |
Δδi are the differences between the free and bound chemical shifts and ωi denotes the weight factor of nucleus i; ωHN=ωHɛ=1, ωN=ωNɛ=0.154, ωCα=ωCβ=0.256 and ωC/δ=ωC′=0.341 (Mulder et al, 1999).
Construction of CylR2 Asn40 to Ala mutation in pTCV-lac
Vector pT2T318U (MS Gilmore, unpublished) known to harbor the entire sequence of CylR1, CylR2 and the cytolysin promoter was used as a template for mutagenesis of CylR2. The mutant was constructed using a QuikChange™ Site-Directed Mutagenesis Kit (Stratagene, La Jolla, CA). A 40 ng portion of pT2T318U was amplified with mutagenic primers R2:Asn → Ala AS (5′-TAACTGTAAAGAAGGTGCATATTTATTTTTTTC-3′) and R2:Asn → Ala S (5′-GAAAAAAATAAATATGCACCTTCTTTACAGTTA-3′). DNA from the mutagenesis reaction was electroporated into Escherichia coli XL-1 blue. A 910 bp piece of DNA including CylR1, mutant CylR2 and the promoter was amplified by PCR from pT2T318UN → A with primers CFV1829R-E (5′-AGAATTCGTTAGAAATGAAAGGC-3′) and CF614R-B (5′-CCATAATTCTTAGGATCCATCATAAAATTGTTG-3′) under standard conditions. The PCR product was ligated between the BamHI and EcoRI sites of pTCV-lac to make pLXR2N40A (Poyart and Trieu-Cuot, 1997). For the Miller assay, this construct was electroporated into strain FA2-2 as previously described (Shepard and Gilmore, 1995).
Miller assay for analysis of pLXR2N40A
Cultures of FA2-2 pLX110 and FA2-2 pLXR2N40A were grown overnight at 37°C in 10 ml of brain-heart infusion (BHI) supplemented with 1 μg/ml kanamycin and 50 μg/ml erythromycin. The bacteria were then subcultured 1:10 into 70 ml BHI with 1 μg/ml kanamycin and 50 μg/ml erythromycin and were incubated for 3 h at 37°C. In triplicate, 10 ml aliquots of culture were then either induced with 2.5 ml of CylLS″-containing supernatant (sterile supernatant from an overnight culture of FA2-2 pWH617) or left uninduced by the addition of 2.5 ml control supernatant (sterile supernatant from an overnight culture of FA2-2 pAT28). The cultures were then incubated an additional 3 h at 37°C, after which LacZ expression was analyzed as described by Hancock et al (2003).
Model for DNA binding
The structure of the CylR2/DNA complex was modeled by Monte Carlo docking using the program Monty (Knegtel et al, 1994a, 1994b). The preparation of a starting model for the CylR2/DNA complex and the used Monty parameters are described in Supplementary data.
For each starting model and DNA bending parameter, 64 Monte Carlo simulations of 200 000 attempted moves were performed. Prolonged simulations with 600 000 Monte Carlo moves showed virtually no improvement. From the 64 final solutions, those in which the DNA was detached from the protein were removed, leaving a total of 41 CylR2/DNA complexes. Since the number of possible side-chain conformers is extremely large and sampling is computationally limited, it is unlikely that one can obtain complexes with all correct protein–DNA interactions simultaneously present. Therefore, important CylR2/DNA interactions were identified based on their presence in more than 20% (van der Waals) or more than 30% (H-bonds) of the successful docking solutions.
Coordinates
The coordinates of the CylR2 protein structure have been deposited in the Protein Data Bank (accession code 1utx).
Supplementary Material
Supplementary Material
Supplementary data
Acknowledgments
We thank Kerstin Overkamp for HPLC purification, Patrick Müller for help with the backbone assignment, Christian Griesinger for useful discussions and George M Sheldrick for access to the Siemens rotating anode generator. Portions of this research were supported by research grants NIH AI41108 and EY08289, and unrestricted support from Research to Prevent Blindness Inc. AR and SB were supported by the DFG grant BE 2345. MZ is the recipient of a DFG Emmy Noether-Fellowship (ZW71/1-3).
References
- Aggarwal AK, Rodgers DW, Drottar M, Ptashne M, Harrison SC (1988) Recognition of a DNA operator by the repressor of phage 434: a view at high resolution. Science 242: 899–907 [DOI] [PubMed] [Google Scholar]
- Altschul SF, Madden TL, Schaffer AA, Zhang J, Zhang Z, Miller W, Lipman DJ (1997) Gapped BLAST and PSI-BLAST: a new generation of protein database search programs. Nucleic Acids Res 25: 3389–3402 [DOI] [PMC free article] [PubMed] [Google Scholar]
- Bax A, Grzesiek S (1993) Methodological advances in protein NMR. Accounts Chem Res 26: 131–138 [Google Scholar]
- Bell AC, Koudelka GB (1993) Operator sequence context influences amino acid–base-pair interactions in 434 repressor–operator complexes. J Mol Biol 234: 542–553 [DOI] [PubMed] [Google Scholar]
- Booth MC, Bogie CP, Sahl HG, Siezen RJ, Hatter KL, Gilmore MS (1996) Structural analysis and proteolytic activation of Enterococcus faecalis cytolysin, a novel lantibiotic. Mol Microbiol 21: 1175–1184 [DOI] [PubMed] [Google Scholar]
- Coburn PS, Gilmore MS (2003) The Enterococcus faecalis cytolysin: a novel toxin active against eukaryotic and prokaryotic cells. Cell Microbiol 5: 661–669 [DOI] [PubMed] [Google Scholar]
- Coburn PS, Hancock LE, Booth MC, Gilmore MS (1999) A novel means of self-protection, unrelated to toxin activation, confers immunity to the bactericidal effects of the Enterococcus faecalis cytolysin. Infect Immun 67: 3339–3347 [DOI] [PMC free article] [PubMed] [Google Scholar]
- Craik DJ, Wilce JA (1997) Studies of protein–ligand interactions by NMR. Methods Mol Biol 60: 195–232 [DOI] [PubMed] [Google Scholar]
- Dauter Z, Dauter M (2001) Entering a new phase: Using solvent halide ions in protein structure determination. Structure 9: R21–R26 [DOI] [PubMed] [Google Scholar]
- Dauter Z, Dauter M, Rajashankar KR (2000) Novel approach to phasing proteins: derivatization by short cryo-soaking with halides. Acta Crystallogr Sect D Biol Crystallogr 56: 232–237 [DOI] [PubMed] [Google Scholar]
- Delaglio F, Grzesiek S, Vuister GW, Zhu G, Pfeifer J, Bax A (1995) NMRPipe—a multidimensional spectral processing system based on Unix pipes. J Biomol NMR 6: 277–293 [DOI] [PubMed] [Google Scholar]
- Ducros VM, Lewis RJ, Verma CS, Dodson EJ, Leonard G, Turkenburg JP, Murshudov GN, Wilkinson AJ, Brannigan JA (2001) Crystal structure of GerE, the ultimate transcriptional regulator of spore formation in Bacillus subtilis. J Mol Biol 306: 759–771 [DOI] [PubMed] [Google Scholar]
- Farrow NA, Muhandiram R, Singer AU, Pascal SM, Kay CM, Gish G, Shoelson SE, Pawson T, Formankay JD, Kay LE (1994) Backbone dynamics of a free and a phosphopeptide-complexed Src homology-2 domain studied by N-15 NMR relaxation. Biochemistry 33: 5984–6003 [DOI] [PubMed] [Google Scholar]
- Gilmore MS, Coburn PS, Nallapareddy SR, Murray BE (eds) (2002) Enterococcal Virulence. Washington, DC: ASM Press [Google Scholar]
- Gilmore MS, Ferretti JJ (2003) Microbiology: the thin line between gut commensal and pathogen. Science 299: 1999–2002 [DOI] [PubMed] [Google Scholar]
- Haas W, Shepard BD, Gilmore MS (2002) Two-component regulator of Enterococcus faecalis cytolysin responds to quorum-sensing autoinduction. Nature 415: 84–87 [DOI] [PubMed] [Google Scholar]
- Hancock LE, Gilmore MS (eds) (2003) Pathogenicity of Enterococci. Washington, DC: ASM Press [Google Scholar]
- Hancock LE, Shepar BD, Gilmore MS (2003) Molecular analysis of the Enterococcus faecalis serotype 2 polysaccharide determinant. J Bacteriol 185: 4393–4401 [DOI] [PMC free article] [PubMed] [Google Scholar]
- Hansen MR, Mueller L, Pardi A (1998) Tunable alignment of macromolecules by filamentous phage yields dipolar coupling interactions. Nat Struct Biol 5: 1065–1074 [DOI] [PubMed] [Google Scholar]
- Harrison SC, Aggarwal AK (1990) DNA recognition by proteins with the helix–turn–helix motif. Annu Rev Biochem 59: 933–969 [DOI] [PubMed] [Google Scholar]
- Hoch JA (2000) Two-component and phosphorelay signal transduction. Curr Opin Microbiol 3: 165–170 [DOI] [PubMed] [Google Scholar]
- Holm L, Sander C (1993) Protein structure comparison by alignment of distance matrices. J Mol Biol 233: 123–138 [DOI] [PubMed] [Google Scholar]
- Huycke MM, Sahm DF, Gilmore MS (1998) Multiple-drug resistant Enterococci: the nature of the problem and an agenda for the future. Emerg Infect Dis 4: 239–249 [DOI] [PMC free article] [PubMed] [Google Scholar]
- Jett BD, Gilmore MS (1990) The growth-inhibitory effect of the Enterococcus faecalis bacteriocin encoded by Pad1 extends to the oral Streptococci. J Dent Res 69: 1640–1645 [DOI] [PubMed] [Google Scholar]
- Johnson BA, Blevins RA (1994) NMR View—a computer-program for the visualization and analysis of NMR data. J Biomol NMR 4: 603–614 [DOI] [PubMed] [Google Scholar]
- Knegtel RMA, Antoon J, Rullmann C, Boelens R, Kaptein R (1994a) Monty—a Monte-Carlo approach to protein–DNA recognition. J Mol Biol 235: 318–324 [DOI] [PubMed] [Google Scholar]
- Knegtel RMA, Boelens R, Kaptein R (1994b) Monte-Carlo docking of protein–DNA complexes—incorporation of DNA flexibility and experimental-data. Protein Eng 7: 761–767 [DOI] [PubMed] [Google Scholar]
- Laskowski RA, Macarthur MW, Moss DS, Thornton JM (1993) Procheck—a program to check the stereochemical quality of protein structures. J Appl Crystallogr 26: 283–291 [Google Scholar]
- Lewis RJ, Brannigan JA, Offen WA, Smith I, Wilkinson AJ (1998) An evolutionary link between sporulation and prophage induction in the structure of a repressor: anti-repressor complex. J Mol Biol 283: 907–912 [DOI] [PubMed] [Google Scholar]
- McRee DE (1999) XtalView Xfit—a versatile program for manipulating atomic coordinates and electron density. J Struct Biol 125: 156–165 [DOI] [PubMed] [Google Scholar]
- Mondragon A, Subbiah S, Almo SC, Drottar M, Harrison SC (1989a) Structure of the amino-terminal domain of phage 434 repressor at 2.0 Å resolution. J Mol Biol 205: 189–200 [DOI] [PubMed] [Google Scholar]
- Mondragon A, Wolberger C, Harrison SC (1989b) Structure of phage 434 Cro protein at 2.35 Å resolution. J Mol Biol 205: 179–188 [DOI] [PubMed] [Google Scholar]
- Mulder FAA, Schipper D, Bott R, Boelens R (1999) Altered flexibility in the substrate-binding site of related native and engineered high-alkaline Bacillus subtilis. J Mol Biol 292: 111–123 [DOI] [PubMed] [Google Scholar]
- Mundy LM, Sahm DF, Gilmore MS (2000) Relationships between enterococcal virulence and antimicrobial resistance. Clin Microbiol Rev 13: 513–522 [DOI] [PMC free article] [PubMed] [Google Scholar]
- Murshudov GN, Vagin AA, Dodson EJ (1997) Refinement of macromolecular structures by the maximum- likelihood method. Acta Crystallogr D 53: 240–255 [DOI] [PubMed] [Google Scholar]
- Ottiger M, Delaglio F, Bax A (1998) Measurement of J and dipolar couplings from simplified two-dimensional NMR spectra. J Magn Reson 131: 373–378 [DOI] [PubMed] [Google Scholar]
- Otwinowski Z, Minor W (1997) Processing of X-ray diffraction data collected in oscillation mode. Methods Enzymol 276: 307–326 [DOI] [PubMed] [Google Scholar]
- Perrakis A, Morris R, Lamzin VS (1999) Automated protein model building combined with iterative structure refinement. Nat Struct Biol 6: 458–463 [DOI] [PubMed] [Google Scholar]
- Pervushin K, Billeter M, Siegal G, Wuthrich K (1996) Structural role of a buried salt bridge in the 434 repressor DNA-binding domain. J Mol Biol 264: 1002–1012 [DOI] [PubMed] [Google Scholar]
- Peti W, Griesinger C, Bermel W (2000) Adiabatic TOCSY for C,C and H,H J-transfer. J Biomol NMR 18: 199–205 [DOI] [PubMed] [Google Scholar]
- Poyart C, Trieu-Cuot P (1997) A broad-host-range mobilizable shuttle vector for the construction of transcriptional fusions to beta-galactosidase in Gram-positive bacteria. FEMS Microbiol Lett 156: 193–198 [DOI] [PubMed] [Google Scholar]
- Ramakrishnan C, Ramachandran GN (1965) Stereochemical conformations for polypeptide and protein conformations. II. Allowed conformations for a pair of peptide units. Biophys J 5: 909–933 [DOI] [PMC free article] [PubMed] [Google Scholar]
- Razeto A, Giller K, Haas W, Gilmore MS, Zweckstetter M, Becker S (2004) Expression, purification, crystallisation and preliminary crystallographic studies of the Enterococcus faecalis cytolysin repressor CylR2. Acta Crystallogr D 60: 746–748 [DOI] [PubMed] [Google Scholar]
- Shankar N, Baghdayan AS, Gilmore MS (2002) Modulation of virulence within a pathogenicity island in vancomycin-resistant Enterococcus faecalis. Nature 417: 746–750 [DOI] [PubMed] [Google Scholar]
- Shankar N, Lockatell CV, Baghdayan AS, Drachenberg C, Gilmore MS, Johnson DE (2001) Role of Enterococcus faecalis surface protein Esp in the pathogenesis of ascending urinary tract infection. Infect Immun 69: 4366–4372 [DOI] [PMC free article] [PubMed] [Google Scholar]
- Shepard BD, Gilmore MS (1995) Electroporation and efficient transformation of Enterococcus faecalis grown in high concentrations of glycine. In Methods in Molecular Biology, Vol. XX: Electroporation and Electroprofusion of Microorganisms Protocols, Nickologg JA (ed) New Jersey: Humana Press Inc. [DOI] [PubMed] [Google Scholar]
- Shimon LJ, Harrison SC (1993) The phage 434 OR2/R1-69 complex at 2–5 Å resolution. J Mol Biol 232: 826–838 [DOI] [PubMed] [Google Scholar]
- Simoncsits A, Chen J, Percipalle P, Wang S, Törö I, Pongor S (1997) Single-chain repressors engineered DNA-binding domains of the phage 434 repressor recognize symmetric or asymmetric DNA operators. J Mol Biol 267: 118–131 [DOI] [PubMed] [Google Scholar]
- Tjandra N, Bax A (1997) Direct measurement of distances and angles in biomolecules by NMR in a dilute liquid crystalline medium (vol 278, pg 1111, 1997). Science 278: 1697–1697 [DOI] [PubMed] [Google Scholar]
- Toyoda T, Tin OF, Ito K, Fujiwara T, Kumasaka T, Yamamoto M, Garber MB, Nakamura Y (2000) Crystal structure combined with genetic analysis of the Thermus thermophilus ribosome recycling factor shows that a flexible hinge may act as a functional switch. RNA-Publ RNA Soc 6: 1432–1444 [DOI] [PMC free article] [PubMed] [Google Scholar]
- Wieland G, Hemmerich P, Koch M, Stoyan T, Hegemann J, Diekmann S (2001) Determination of the binding constants of the centromere protein Cbf1 to all 16 centromere DNAs of Saccharomyces cerevisiae. Nucleic Acids Res 29: 1054–1060 [DOI] [PMC free article] [PubMed] [Google Scholar]
- Wolberger C, Dong YC, Ptashne M, Harrison SC (1988) Structure of a phage 434 Cro/DNA complex. Nature 335: 789–795 [DOI] [PubMed] [Google Scholar]
- Zweckstetter M, Bax A (2000) Prediction of sterically induced alignment in a dilute liquid crystalline phase: aid to protein structure determination by NMR. J Am Chem Soc 122: 3791–3792 [Google Scholar]
- Zweckstetter M, Bax A (2001) Characterization of molecular alignment in aqueous suspensions of Pf1 bacteriophage. J Biomol NMR 20: 365–377 [DOI] [PubMed] [Google Scholar]
- Zweckstetter M, Holak TA (1999) Robust refocusing of C-13 magnetization in multidimensional NMR experiments by adiabatic fast passage pulses. J Biomol NMR 15: 331–334 [DOI] [PubMed] [Google Scholar]
Associated Data
This section collects any data citations, data availability statements, or supplementary materials included in this article.
Supplementary Materials
Supplementary Material
Supplementary data