

Abstract
Objective:
To define robust resilience metrics by leveraging CSF biomarkers of Alzheimer disease (AD) pathology within a latent variable framework and to demonstrate the ability of such metrics to predict slower rates of cognitive decline and protection against diagnostic conversion.
Methods:
Participants with normal cognition (n = 297) and mild cognitive impairment (n = 432) were drawn from the Alzheimer’s Disease Neuroimaging Initiative. Resilience metrics were defined at baseline by examining the residuals when regressing brain aging outcomes (hippocampal volume and cognition) on CSF biomarkers. A positive residual reflected better outcomes than expected for a given level of pathology (high resilience). Residuals were integrated into a latent variable model of resilience and validated by testing their ability to independently predict diagnostic conversion, cognitive decline, and the rate of ventricular dilation.
Results:
Latent variables of resilience predicted a decreased risk of conversion (hazard ratio < 0.54, p < 0.0001), slower cognitive decline (β > 0.02, p < 0.001), and slower rates of ventricular dilation (β < −4.7, p < 2 × 10⁻¹⁵). These results were significant even when analyses were restricted to clinically normal individuals. Furthermore, resilience metrics interacted with biomarker status such that biomarker-positive individuals with low resilience showed the greatest risk of subsequent decline.
Conclusions:
Robust phenotypes of resilience calculated by leveraging AD biomarkers and baseline brain aging outcomes provide insight into which individuals are at greatest risk of short-term decline. Such comprehensive definitions of resilience are needed to further our understanding of the mechanisms that protect individuals from the clinical manifestation of AD dementia, especially among biomarker-positive individuals.
Limited empirical attention has focused on elucidating the factors that prevent individuals with asymptomatic Alzheimer disease (AD), those with autopsy-confirmed AD pathology (β-amyloid [Aβ] plaques and aggregation of neurofibrillary tangles) but without cognitive impairment, from expressing clinical AD.1,2 Both cognitive reserve, frequently operationalized by educational attainment,1,2 and brain reserve, frequently operationalized by cranial volume,3 confer resilience to cognitive deficits associated with AD pathology. However, it is quite likely that additional factors beyond traditional metrics of cognitive and brain reserve contribute to resilience observed in asymptomatic AD.
The well-established CSF biomarkers of AD (levels of Aβ-42 and total tau) may provide additional information that is useful for defining resilience. We therefore sought to leverage a residual approach4 to quantify levels of resilience by examining the disparity between CSF biomarkers of AD pathology and brain aging outcomes (i.e., hippocampal atrophy and cognitive decline). With this approach, brain resilience reflects larger-than-predicted hippocampal volumes given biomarker levels of AD pathology, while cognitive resilience reflects better-than-predicted memory and executive function performance given biomarker levels of AD pathology. We then integrate these resilience metrics with established metrics into a latent variable model of reserve.2,3,5 This comprehensive approach will provide insight into the mechanisms of asymptomatic AD and demonstrate how multivariate information can be harnessed to improve in vivo estimates of resilience.
METHODS
Participant data from the Alzheimer’s Disease Neuroimaging Initiative (ADNI; adni.loni.usc.edu) were used for this article. ADNI began in 2003 and was subsequently followed up by ADNI-Grand Opportunity (ADNI-GO) and ADNI-2. In total, >1500 adults 55 to 90 years of age have been recruited. Participants were excluded for serious neurologic disease other than AD, a history of psychoactive medication use, or a history of brain lesion or head trauma (complete exclusion criteria can be found at www.adni-info.org).
Standard protocol approvals, registrations, and patient consents.
Informed written consent was obtained from all participants at each site. The Vanderbilt Institutional Review Board approved data access and analysis.
Participants.
We accessed publicly available data from ADNI on June 13, 2015. Participant enrollment criteria are outlined in the ADNI protocol (http://www.adni-info.org/Scientists/ADNIStudyProcedures.html). For the present analyses, we included all participants with MRI data, memory and executive function composite measures, CSF biomarkers, and American National Adult Reading test score. Participants with AD were excluded. These criteria resulted in 729 participants with baseline diagnoses of normal cognition (NC; n = 297) and mild cognitive impairment (MCI; n = 432). Participants included individuals from ADNI-1 and follow-up ADNI-GO (initiated in 2009) and ADNI-2 (initiated in 2011). Additional information about the ADNI protocols can be found online (http://adni.loni.usc.edu/about/). In the present analyses, the average follow-up period for individuals from ADNI-1 was 4.6 years and from ADNI-2/GO was 1.9 years. Given the difference in follow-up period between ADNI-1 and ADNI-2/GO and the use of 3T in ADNI-2/GO vs 1.5T in ADNI-1, we reran all analyses stratified by scanner strength (which coincided with ADNI phase) in appendix e-1 at Neurology.org (section S.3).
CSF biomarker processing.
Previous work has outlined the quantification of AD biomarkers, including tau and Aβ-42.6,7 For the present analyses, we used the first measure of Aβ-42 and total tau, which coincided with baseline neuropsychological measures. These continuous measures were used as quantitative predictors in statistical analyses.
Composite neuropsychological measurements.
Episodic memory composite scores and executive function composite scores were calculated and reported previously.8,9 To summarize, item-level data from the Logical Memory Test, Mini-Mental State Examination, Rey Auditory Verbal Learning Test, and AD Assessment Scale-Cognitive Subscale were included in a single-factor solution to quantify the ADNI episodic memory composite. Item-level data from the Vegetable Naming test, Trail Making Test A, Trail Making Test B, Digit Symbol, Backward Digit Span, Animal Naming, and Clock Drawing Test were used to quantify the ADNI executive function composite. The harmonization of these metrics across ADNI-1 and ADNI-2/GO was completed by Gibbons and colleagues9 and is available online (http://adni.bitbucket.org/docs/UWNPSYCHSUM/ADNI_Methods_UWNPSYCHSUM.pdf). The composite measures were built to have a mean of 0 and standard deviation of 1.
Quantification of regional brain volume.
The neuroimaging protocol in ADNI has been outlined previously.10 The present analyses included uncorrected 1.5T T1-weighted structural data for ADNI-1 and 3T data for ADNI-2/GO. FreeSurfer was used for reconstruction and segmentation using version 4.3 in ADNI-1 and 5.1 in ADNI-2/GO (http://surfer.nmr.mgh.harvard.edu/)11–13 as previously described.14 The baseline neuroimaging visit was required to be within 6 months of the first cognitive visit. The mean interval between the first cognitive visit and first neuroimaging visit was 22 days.
We used FreeSurfer-defined left hippocampal and right hippocampal volumes as our primary outcome measurements in brain resilience analyses.15 Lateralized hippocampal volumes were used on the basis of evidence that aging and disease do not occur symmetrically.16 Thus, lateralized analyses provide more sensitivity to the subtle changes in the preclinical stages of AD. FreeSurfer was also used to define left and right inferior lateral ventricle volumes (a neuroimaging marker that is sensitive to neurodegeneration)17 for follow-up longitudinal analyses.
Statistical analyses.
Statistical analyses were performed in R version 3.0.1 (http://www.r-project.org/) using a multivariate partial least squares (PLS) path model. PLS path models are the least-squares equivalent to structural equation models but make fewer assumptions about variable distributions and are better positioned to handle highly correlated indicator variables.18 The single PLS path model (figure 1) quantified 4 first-order latent composite measures (cognitive reserve, brain reserve, cognitive resilience, and brain resilience) and one second-order (meaning a latent trait derived from other latent traits) latent composite measure (global resilience). This model incorporated established proxy measures for cognitive reserve (i.e., reading ability from the American National Adult Reading Test and education level in years) and brain reserve (i.e., height in inches and intracranial volume [ICV] in mm3). While brain reserve is aimed at evaluating premorbid brain size based on proxy measures defined in the literature,3,5 brain resilience is aimed at measuring the degree to which atrophic processes are already present in response to normal aging or neuropathologic processes. For cognitive resilience and brain resilience, residuals were used from linear regression models outlined below.
Figure 1. Partial least squares (PLS) path model results.

PLS path model results are presented; the goodness of fit was 0.76. Each first-order latent variable is presented as an oval. The variables included in each latent trait are presented as rectangles, and the factor loadings are presented as numbers above each arrow. Arrows are pointing away from the latent trait because we used reflective measurement. For the resilience metrics, each rectangle represents the residuals from a single linear regression model relating the given biomarker to the given outcome. The second-order latent variable (global resilience) is presented as a dotted oval. The loadings for each first-order latent variable are presented numerically above the bold arrows pointing to global resilience.
PLS path model step 1: Calculating residuals.
The primary model inputs were residuals from individual linear regressions covarying for baseline age and ICV (for brain analyses only). Separate regressions were run for each particular type of resilience. For example, memory-specific resilience to tau was calculated as residuals from a regression model with memory as the outcome and tau as the predictor, represented as the Residual (memory/tau) oval in figure 1. The 8 residuals used in the cognitive and brain resilience latent traits came from regressions relating amyloid and tau levels to baseline memory, executive function, left hippocampus volume, and right hippocampus volume.
PLS path model step 2: Running the PLS path model.
A PLS path model requires both an outer model and an inner model. The outer model is the derivation of a latent trait from the indicator variables, and the inner model includes relations between the latent traits. For the outer model, reflective measurement was used to derive latent variables from the residuals calculated in step 1 and the proxy measures of cognitive and brain resilience described above. For the inner model, brain reserve, cognitive reserve, cognitive resilience, and brain resilience contributed to a global resilience variable (figure 1). A repeated indicators approach was used to derive the global resilience second-order latent trait from the 4 other latent variables. The goodness-of-fit metric in the plspm package was calculated from the average communality score and the average r2 value; a goodness of fit >0.70 is generally accepted as a good fit.19
PLS path model hypothesis testing: Evaluating resilience measures.
To evaluate the resilience measures derived with baseline data in the PLS path model, we tested whether they each predicted diagnostic conversion or longitudinal decline in neuropsychological performance. All analyses evaluating resilience metrics were performed outside the PLS framework. Scores from the PLS model were used in subsequent regression models as outlined below.
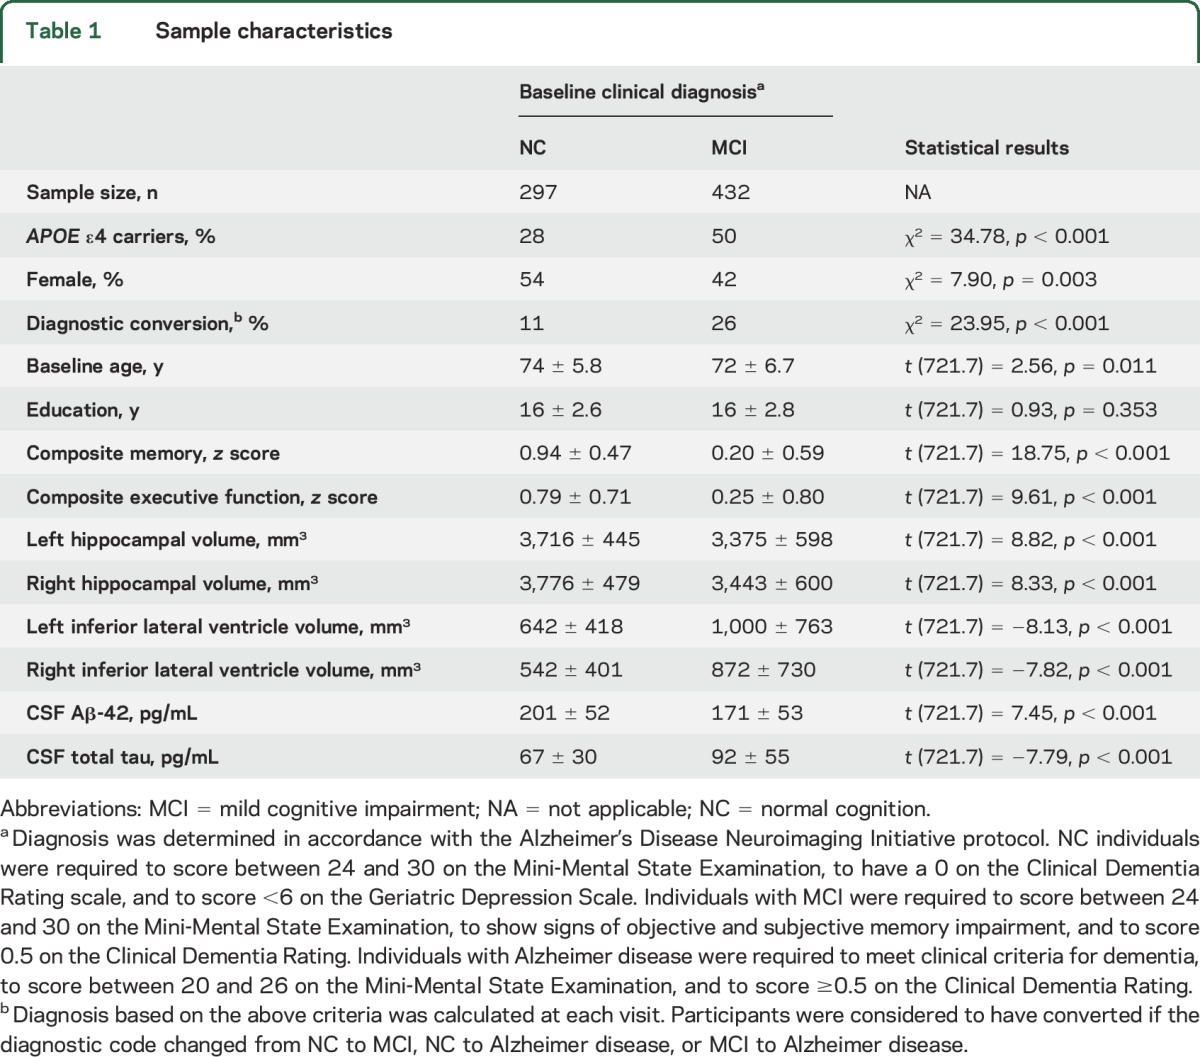
Right-censored Cox proportional hazards regression was used for conversion analyses covarying for baseline age, sex, baseline diagnosis, and APOE ε4. A participant was considered to have converted if the individual had a change in diagnosis code from NC to MCI, NC to AD, or MCI to AD over the course of the follow-up period. Diagnostic groups were defined according to the ADNI protocol and are presented as a footnote in table 1.
Table 1.
Sample characteristics
Mixed effects regression was used for longitudinal cognitive analyses, conducted separately for memory and executive function. Fixed effects included baseline age, sex, baseline diagnosis, APOE ε4, the resilience trait of interest, time (years from baseline), and a time × resilience interaction term. Random effects included time and the intercept. The time × resilience interaction term tested whether the resilience variable of interest related to change in cognition over time.
Mixed effects regression was also used to evaluate longitudinal change in lateral inferior ventricle volume, again calculated separately for the right and left hemispheres given established lateralization differences.20 Fixed effects included the same terms used in the cognitive analyses but also included baseline ICV. Random effects were the same as for the cognitive analyses.
Next, we reran all conversion and longitudinal analyses, restricting to participants with NC. Then, given that cut points for CSF measures are often applied in clinical settings, we also reran analyses using binary CSF metrics (rather than continuous CSF metrics in the original regression analyses) based on previously defined cut points7 of total tau ≥93 pg/mL (tau positive) and Aβ-42 ≤192 pg/mL (amyloid positive).
Models were also recalculated with adjustment for baseline hippocampal volume, baseline memory performance, and baseline biomarker levels to assess whether the observed resilience effects explained additional variance beyond these established predictors of decline. The longitudinal model also included a time interaction with each of these additional covariates.
Finally, to evaluate whether the resilience measures influenced risk of decline among individuals with biomarker evidence of AD pathology, we tested for a statistical interaction between biomarker positivity (tau ≥93pg/mL or Aβ-42 ≤192 pg/mL) and resilience.
RESULTS
Diagnostic groups demonstrated expected differences in cognitive performance, hippocampal volume, and CSF AD biomarker levels (p < 0.05). For longitudinal analyses, the mean follow-up interval was 2.69 years among participants with NC and 2.92 years among participants with MCI (p = 0.15). Participant characteristics are presented in table 1.
PLS path model.
The data fit the model well with a goodness-of-fit score of 0.76 (figure 1). All indicators loaded strongly on the given latent trait (loading >0.79), and no indicator cross-loaded onto another latent trait (all cross-loadings <0.37). Each first-order latent trait also demonstrated clear unidimensionality (Dillon-Goldstein ρ > 0.80, first eigenvalue >1.40, second eigenvalue <1.0). Within the individual regression models that were included in the PLS models, we observed significant effects of CSF biomarkers in predicting both cognition (absolute value of β > 0.0029, change in R2 > 0.03, p < 0.0001) and hippocampal volume (absolute value of β > 2.58, change in R2 > 0.05, p < 0.0001).
Evaluating resilience measures.
Results evaluating resilience metrics are presented in table 2. The 3 metrics of resilience (cognitive resilience, brain resilience, and global resilience) successfully predicted protection against diagnostic conversion, slower rates of cognitive decline (figure 2), and slower rates of ventricular dilation (all p < 0.001). All 3 resilience metrics also interacted with biomarker positivity (all p < 0.01) whereby the strongest effect of biomarker positivity was observed at lower levels of global resilience (figure 3). The 2 established reserve metrics showed null or negative association with protection against conversion and cognitive decline. Similar cross-sectional and longitudinal effects were observed when limiting the sample to NC; when correcting for baseline cognition, hippocampal volume, and CSF biomarker levels; when using binarized rather than continuous CSF metrics; when stratifying the sample by scanner strength; and when removing memory performance or executive function performance from the cognitive resilience calculation (see appendix e-1).
Table 2.
Associations between metrics of resilience and brain aging outcomes
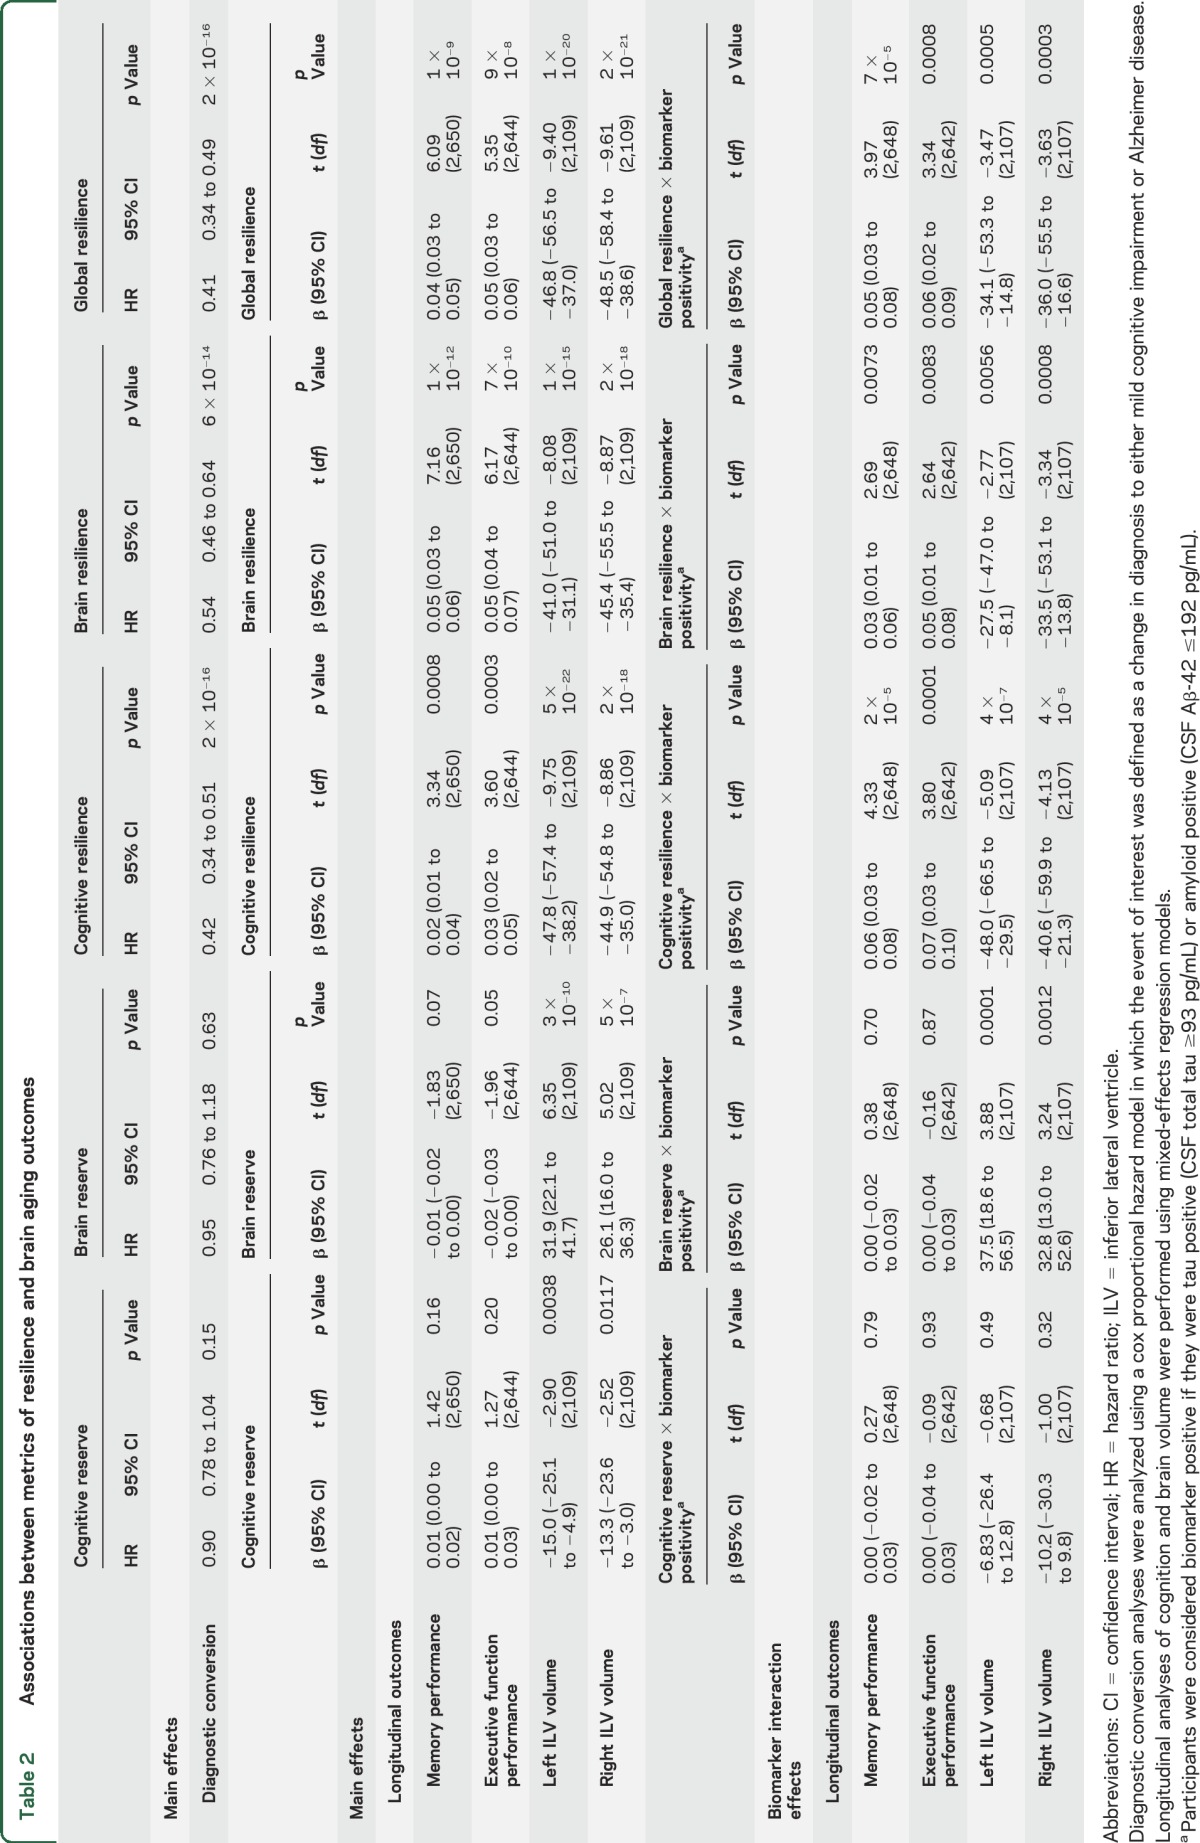
Figure 2. Association between global resilience phenotype and annual change in memory performance.

The second-order latent trait global resilience is along the x-axis, and annual change in composite memory performance is along the y-axis. Increased global resilience is associated with a slower trajectory of memory decline.
Figure 3. Interaction between global resilience and biomarker positivity on memory trajectories.

The second-order latent trait global resilience is along the x-axis, and annual change in composite memory function performance is along the y-axis. Lines are colored by biomarker group where biomarker positive is defined as having a CSF Aβ-42 ≤192 pg/mL or a CSF total tau level ≥93 pg/mL. The association between global resilience and slowed cognitive decline is strongest in biomarker-positive individuals.
DISCUSSION
This study leveraged latent variable modeling to incorporate AD biomarkers into a model of reserve. All resilience phenotypes were protective against diagnostic conversion, cognitive decline, and neurodegeneration. The global resilience phenotype calculated across all resilience and reserve metrics provided the best predictive performance. We observed more significant associations for the 3 resilience metrics than for the established reserve metrics, highlighting the value of including AD biomarkers within statistical models of resilience.
The present results demonstrate that our innovative metrics of resilience predict slower rates of longitudinal cognitive decline. There is a tremendous need to identify individuals at greatest risk for cognitive decline, particularly within the context of clinical trial participant selection and enrollment. Our results suggest that biomarker levels, hippocampal volume, and cognitive performance can be integrated into a powerful metric of resilience that can be applied to improve clinical trial screening procedures. Moreover, the multivariate technique implemented herein extracts valuable information about current risk for future decline that outperformed the independent predictive value of biomarker levels, brain volume, and cognitive performance alone.
The present model provided 2 notable additions to previous models. First, the brain resilience metric based on residual variance in hippocampal volume provided a strong predictor of future cognitive impairment. Brain resilience may indeed represent a distinct pathway to resilience in which individuals are resistant to brain atrophy in the presence of AD biomarkers. Second, the inclusion of CSF biomarker predictors in the calculation of cognitive resilience provided additional predictive power. When comparing cognitive resilience calculated with CSF predictors to cognitive resilience calculated with structural MRI predictors, we found the CSF-based metric to be a slightly stronger predictor of protection against conversion (appendix e-1). Thus, the inclusion of CSF biomarkers may enhance the definitions of resilience, likely because of the sensitivity of CSF biomarkers to prodromal changes before notable neurodegeneration.
Past work has demonstrated that proxy measures of reserve predict improved outcomes in biomarker-positive individuals,21,22 and our results suggest that factors beyond these proxies are important contributors to sustained cognition in the presence of AD pathology. As demonstrated by the biomarker-positive results, the residual method provides a continuous metric of resilience that is particularly sensitive to better-than-expected cognitive performance among individuals at highest risk of future cognitive decline. Thus, these metrics may be a valuable tool for uncovering molecular drivers of resilience that predispose some individuals to a more optimal innate response to the damaging effects of AD neuropathology.
The present results also have strong implications for how AD biomarkers may be best applied in clinical settings. For example, the low-resilience individuals identified with the present technique may need to be more aggressively managed given their elevated risk for rapid decline. Thus, moving back the treatment window may indeed be possible by developing simplified methods that integrate biomarker, imaging, and cognitive data into clinically meaningful metrics of risk and resilience.
This study takes a step toward fully integrating biomarker data into models of resilience. Although we present lateralized hippocampal volumes in our models, a combined hippocampal volume provided comparable performance (data not shown) and could be applied within the proposed framework. Evidence from recent longitudinal applications of comparable residual models suggests that change in resilience may be most predictive of cognitive impairment.4 Future work will seek to integrate change in AD biomarkers and brain aging outcomes into longitudinal models of resilience. The present model could be further improved by including additional regions in the brain resilience metric such as those identified in the Spatial Pattern of Abnormalities for Recognition of Early AD score calculation23 or brain regions known to atrophy during normal aging24 or MCI.25
The present results must be interpreted within the framework of the cohort. ADNI is not the ideal cohort for studying reserve and resilience given the skew toward white, non-Hispanic, highly educated individuals with an underrepresentation of cardiovascular risk and disease compared to the general population. Future work is needed to extend these models in more diverse cohorts and to determine whether this type of model would extend to individuals with dementia. The present results highlight that variability in resilience exists even in a highly educated and homogeneous cohort. It should also be noted that the resilience metrics were calculated outside the latent variable framework, leaving open the possibility that resilience may in part reflect psychometric error. Thus, it may be beneficial to vet whether additional power can be garnered with the use of a more complex latent variable framework.
In the present framework, it is difficult to fully separate brain resilience and cognitive resilience from the cognitive performance and hippocampal volume metrics that were used in the resilience metric calculation. We have attempted to reduce circularity concerns by evaluating multiple independent outcomes that were not used in model calculation (i.e., diagnostic conversion and lateral inferior ventricle volume), but it remains possible that subtle collinearity or residual circularity remains.
This study calculated robust resilience phenotypes by integrating AD biomarkers and residual measures into a latent variable model of reserve. Our results provide a foundation from which the molecular basis of reserve and resilience can be explored in future genomic and proteomic analyses.
Supplementary Material
GLOSSARY
- Aβ
β-amyloid
- AD
Alzheimer disease
- ADNI
Alzheimer's Disease Neuroimaging Initiative
- ADNI-GO
Alzheimer's Disease Neuroimaging Initiative-Grand Opportunity
- ICV
intracranial volume
- MCI
mild cognitive impairment
- NC
normal cognition
- PLS
partial least squares
Footnotes
Supplemental data at Neurology.org
AUTHOR CONTRIBUTIONS
Dr. Hohman: study concept, design, analysis, interpretation, manuscript preparation. Dr. McLaren, Dr. Mormino, and Dr. Gifford: design, interpretation, and critical revision. Dr. Libon: interpretation and critical revision. Dr. Jefferson: study supervision, design, interpretation, critical revision.
STUDY FUNDING
This research was supported in part by K01-AG049164 (T.J.H.), K24-AG046373 (A.L.J.), K23-AG045966 (K.A.G.), R01-AG034962 (A.L.J.), R01-HL111516 (A.L.J.), K12-HD043483 (TJ.H.), and the Vanderbilt Memory & Alzheimer's Center. The funders had no role in study design, data collection and analysis, decision to publish, or preparation of the manuscript. Data collection and sharing for this project were funded by the ADNI (NIH grant U01 AG024904) and Department of Defense ADNI (Department of Defense award number W81XWH-12-2-0012). ADNI is funded by the National Institute on Aging, by the National Institute of Biomedical Imaging and Bioengineering, and through generous contributions from the following: Alzheimer's Association; Alzheimer's Drug Discovery Foundation; Araclon Biotech; BioClinica, Inc; Biogen Idec Inc; Bristol-Myers Squibb Co; Eisai Inc; Elan Pharmaceuticals, Inc; Eli Lilly and Co; EuroImmun; F. Hoffmann-La Roche Ltd and its affiliated company Genentech, Inc; Fujirebio; GE Healthcare; IXICO Ltd; Janssen Alzheimer Immunotherapy Research & Development, LLC; Johnson & Johnson Pharmaceutical Research & Development LLC; Medpace, Inc; Merck & Co, Inc; Meso Scale Diagnostics, LLC; NeuroRx Research; Neurotrack Technologies; Novartis Pharmaceuticals Corp; Pfizer Inc; Piramal Imaging; Servier; Synarc Inc; and Takeda Pharmaceutical Co. The Canadian Institutes of Health Research is providing funds to support ADNI clinical sites in Canada. Private sector contributions are facilitated by the Foundation for the National Institutes of Health (www.fnih.org). The grantee organization is the Northern California Institute for Research and Education, and the study is coordinated by the Alzheimer's Disease Cooperative Study at the University of California, San Diego. ADNI data are disseminated by the Laboratory for Neuro Imaging at the University of Southern California.
DISCLOSURE
T. Hohman reports grants from the NIH during the conduct of the study: K24-AG046373 (A.L.J.), K23-AG045966 (K.A.G.), R01-AG034962 (A.L.J.), R01-HL111516 (A.L.J.), and K12-HD043483 (T.J.H.). D. McLaren is a Biospective, Inc employee. E. Mormino reports no disclosures relevant to the manuscript. K. Gifford reports grants from the NIH during the conduct of the study: K24-AG046373 (A.L.J.), K23-AG045966 (K.A.G.), R01-AG034962 (A.L.J.), R01-HL111516 (A.L.J.), and K12-HD043483 (T.J.H.). D. Libon reports no disclosures relevant to the manuscript. A. Jefferson reports grants from the NIH during the conduct of the study: K24-AG046373 (A.L.J.), K23-AG045966 (K.A.G.), R01-AG034962 (A.L.J.), R01-HL111516 (A.L.J.), and K12-HD043483 (T.J.H.). Go to Neurology.org for full disclosures.
REFERENCES
- 1.Roe CM, Xiong C, Miller JP, Morris JC. Education and Alzheimer disease without dementia support for the cognitive reserve hypothesis. Neurology 2007;68:223–228. [DOI] [PubMed] [Google Scholar]
- 2.Stern Y. Cognitive reserve and Alzheimer disease. Alzheimer Dis Assoc Disord 2006;20:112–117. [DOI] [PubMed] [Google Scholar]
- 3.Stern Y. Cognitive reserve. Neuropsychologia 2009;47:2015–2028. [DOI] [PMC free article] [PubMed] [Google Scholar]
- 4.Zahodne LB, Manly JJ, Brickman AM, et al. Is residual memory variance a valid method for quantifying cognitive reserve? A longitudinal application. Neuropsychologia 2015;77:260–266. [DOI] [PMC free article] [PubMed] [Google Scholar]
- 5.Brickman AM, Siedlecki KL, Muraskin J, et al. White matter hyperintensities and cognition: testing the reserve hypothesis. Neurobiol Aging 2011;32:1588–1598. [DOI] [PMC free article] [PubMed] [Google Scholar]
- 6.Shaw LM, Vanderstichele H, Knapik-Czajka M, et al. Qualification of the analytical and clinical performance of CSF biomarker analyses in ADNI. Acta Neuropathol 2011;121:597–609. [DOI] [PMC free article] [PubMed] [Google Scholar]
- 7.Jagust WJ, Landau SM, Shaw LM, et al. Relationships between biomarkers in aging and dementia. Neurology 2009;73:1193–1199. [DOI] [PMC free article] [PubMed] [Google Scholar]
- 8.Crane PK, Carle A, Gibbons LE, et al. Development and assessment of a composite score for memory in the Alzheimer's Disease Neuroimaging Initiative (ADNI). Brain Imaging Behav 2012;6:502–516. [DOI] [PMC free article] [PubMed] [Google Scholar]
- 9.Gibbons LE, Carle AC, Mackin RS, et al. A composite score for executive functioning, validated in Alzheimer's Disease Neuroimaging Initiative (ADNI) participants with baseline mild cognitive impairment. Brain Imaging Behav 2012;6:517–527. [DOI] [PMC free article] [PubMed] [Google Scholar]
- 10.Jack CR, Bernstein MA, Fox NC, et al. The Alzheimer's Disease Neuroimaging Initiative (ADNI): MRI methods. J Magn Reson Imaging 2008;27:685–691. [DOI] [PMC free article] [PubMed] [Google Scholar]
- 11.Dale AM, Fischl B, Sereno MI. Cortical surface-based analysis, I: segmentation and surface reconstruction. Neuroimage 1999;9:179–194. [DOI] [PubMed] [Google Scholar]
- 12.Fischl B, Sereno MI, Dale AM. Cortical surface-based analysis, II: inflation, flattening, and a surface-based coordinate system. Neuroimage 1999;9:195–207. [DOI] [PubMed] [Google Scholar]
- 13.Fischl B, Sereno MI, Tootell RBH, Dale AM. High-resolution intersubject averaging and a coordinate system for the cortical surface. Hum Brain Mapp 1999;8:272–284. [DOI] [PMC free article] [PubMed] [Google Scholar]
- 14.Mormino EC, Kluth JT, Madison CM, et al. Episodic memory loss is related to hippocampal-mediated beta-amyloid deposition in elderly subjects. Brain 2009;132:1310–1323. [DOI] [PMC free article] [PubMed] [Google Scholar]
- 15.Desikan RS, Segonne F, Fischl B, et al. An automated labeling system for subdividing the human cerebral cortex on MRI scans into gyral based regions of interest. Neuroimage 2006;31:968–980. [DOI] [PubMed] [Google Scholar]
- 16.Fraser MA, Shaw ME, Cherbuin N. A systematic review and meta-analysis of longitudinal hippocampal atrophy in healthy human ageing. Neuroimage 2015;112:364–374. [DOI] [PubMed] [Google Scholar]
- 17.Madsen SK, Gutman BA, Joshi SH, et al. Mapping ventricular expansion onto cortical gray matter in older adults. Neurobiol Aging 2015;36:S32–S41. [DOI] [PMC free article] [PubMed] [Google Scholar]
- 18.Tenenhaus M, Vinzi VE, Chatelin Y-M, Lauro C. PLS path modeling. Comput Stat Data Anal 2005;48:159–205. [Google Scholar]
- 19.Sanchez G. PLS path modeling with R [online]. 2013. Available at: http://gastonsanchez.com/PLS_Path_Modeling_with_R.pdf. Accessed February 16, 2015.
- 20.Thompson PM, Hayashi KM, de Zubicaray GI, et al. Mapping hippocampal and ventricular change in Alzheimer disease. Neuroimage 2004;22:1754–1766. [DOI] [PubMed] [Google Scholar]
- 21.Ewers M, Insel PS, Stern Y, Weiner MW. Cognitive reserve associated with FDG-PET in preclinical Alzheimer disease. Neurology 2013;80:1194–1201. [DOI] [PMC free article] [PubMed] [Google Scholar]
- 22.Rentz DM, Locascio JJ, Becker JA, et al. Cognition, reserve, and amyloid deposition in normal aging. Ann Neurol 2010;67:353–364. [DOI] [PMC free article] [PubMed] [Google Scholar]
- 23.Davatzikos C, Xu F, An Y, Fan Y, Resnick SM. Longitudinal progression of Alzheimer's-like patterns of atrophy in normal older adults: the SPARE-AD index. Brain 2009;132:2026–2035. [DOI] [PMC free article] [PubMed] [Google Scholar]
- 24.Resnick SM, Pham DL, Kraut MA, Zonderman AB, Davatzikos C. Longitudinal magnetic resonance imaging studies of older adults: a shrinking brain. J Neurosci 2003;23:3295–3301. [DOI] [PMC free article] [PubMed] [Google Scholar]
- 25.Carmichael O, Mungas D, Beckett L, et al. MRI predictors of cognitive change in a diverse and carefully characterized elderly population. Neurobiol Aging 2012;33:83–95. [DOI] [PMC free article] [PubMed] [Google Scholar]
Associated Data
This section collects any data citations, data availability statements, or supplementary materials included in this article.