Abstract
Allostery is a nearly ubiquitous feature of biological systems in which ligand binding or covalent modification at one site alters the activities of distant sites in a macromolecule or macromolecular complex. The molecular mechanisms underlying this phenomenon have been studied for decades. Nevertheless there are many aspects that remain poorly understood. ITC yields detailed information on the thermodynamics of biomacromolecular interactions and their coupling to additional equilibria, therefore in principle it is a powerful tool for better understanding how allostery is achieved. A particularly powerful approach involves simultaneously fitting multiple ITC data sets together with those of complementary techniques, especially nuclear magnetic resonance and circular dichroism spectroscopies. In this review, we describe several group-fitting methods for discriminating between different binding models and for improving the accuracy of thermodynamic parameters extracted from variable-temperature ITC data. The techniques were applied to the antibiotic resistance-causing enzyme aminoglycoside-6′-acetyltransferase Ii, uncovering the existence of competition between opposing mechanisms and ligand-dependent switching of the underlying mechanism. These novel observations underline the potential of combining ITC and spectroscopic techniques to study allostery.
Keywords: NMR, ITC, CD, cooperativity, aminoglycoside acetyltransferase
1. Introduction
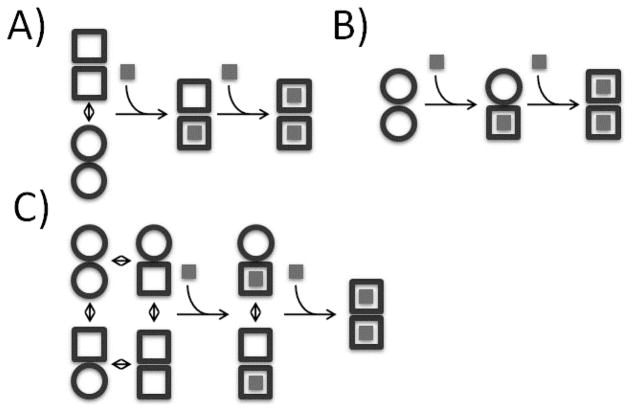
The term allostery was first introduced by Jacques Monod in 1961 to explain the results of end-product inhibition of the enzyme L-threonine deaminase.[1, 2] It describes the process through which covalent modifications or ligand binding influence regions distal to the site of interaction in a macromolecular system.[3–5] Allostery plays an essential role in many cellular processes including cell signaling and metabolism and represents a promising target for drug design.[6–10] Therefore understanding allostery at the molecular level can shed light on cellular function and can potentially lead to new therapies for human diseases. Allostery can be classified into two categories: heterotropic and homotropic. In heterotropic allostery, the interaction with one ligand affects additional processes which can include binding ligands chemically different from the first, altering catalytic rates, or undergoing large structural rearrangements such as pore opening/closing.[11–13] Meanwhile, homotropic allostery involves interactions with two or more identical ligands. Often this is referred to ‘cooperative binding’ and can be either positive (subsequent binding events are stronger than the previous) or negative (subsequent binding events are weaker than the previous). As the events in heterotropic allostery are intrinsically different, characterizing the interaction between an allosteric effector and its targets is in principle facile. However, in homotropic allostery this becomes more challenging, as the ligand is both the allosteric effector and the target of the allosteric interaction. Historically the molecular mechanisms of homotropic allostery in oligomeric proteins have been explained in terms of two paradigms. In the concerted model (MWC) of Monod, Wyman and Changeux, Figure 1A,[7] all subunits of a homo-oligomeric protein undergo simultaneous conformational changes driven by ligand binding. In the sequential model (KNF) of Koshland, Nemethy, and Filmer, Figure 1B,[10] individual subunits undergo independent conformational changes upon binding, modulating the strength of inter-subunit interactions. More recently, models have been proposed that emphasize thermodynamics and dynamic equilibria, as exemplified by the energy allosteric model (EAM), Figure 1C.[14] According to the EAM, the 1-bound state of a protein homodimer exists in dynamic equilibrium between symmetric (MWC-like) and asymmetric (KNF-like) forms. The thermodynamic balance between the two forms is governed by the energetic cost of subunit conformational changes and the strengths of inter-subunit interactions. These models help to explain how information is transferred between distant sites in a macromolecular complex, but determining which model, if any, applies to a given system is an ongoing challenge.
Figure 1.
Schematic representation of homotropic allosteric models for a dimeric protein. ○ and □ correspond to subunits in binding-incompetent, and binding-competent states, respectively. (A) Monod-Wyman-Changeux (MWC): The symmetry of the dimer is preserved, so that only ○○ and □□ states are permitted. In the absence of ligand, both states are populated, while ligand binding forces the dimer into the □□ state. If the initial equilibrium favors the ○○ state, binding is positively cooperative, since the energetic cost of the ○○ to □□ transition is paid by binding the first, but not the second ligand. Note that in the standard MWC model, both ○○ and □□ bind ligand, but with different affinities. For the sake of simplicity we have shown the limiting case where ○○ is binding-incompetent. (B) Koshland-Nemethy-Filmer (KNF): Each subunit converts from the ○ to the □ state only upon binding ligand. Cooperativity is explained in terms of the strengths subunit-subunit interactions. If the transition from the ○○ to ○□ interface is energetically more favorable than from the ○□ to □□, binding is negatively cooperative, and the first ligand is bound more strongly than the second. If the transition from the ○○ to ○□ interface is less favorable than from the ○□ to □□, binding is positively cooperative, and the second ligand is bound more strongly than the first. (C) Energy allosteric model (EAM): Each unbound subunit can populate either the ○ or □ state, and the equilibrium of each subunit is influenced by the state of the adjacent subunit. If the binding competent (□) state of one subunit stabilizes the □ state of the adjacent subunit, binding is positively cooperative. Conversely, if the binding competent □ state of one subunit stabilizes the binding-incompetent ○ state of the adjacent subunit, binding is negatively cooperative. Adapted from Freiburger et al [23]
Isothermal titration calorimetry (ITC) is a powerful approach in which the heat released or absorbed throughout a titration experiment is measured. From a single experiment it is possible to determine the changes in enthalpy (ΔH), entropy (ΔS) and Gibb’s free energy (ΔG) that accompany binding as well as binding stoichiometry.[15, 16] By performing experiments at different temperatures one can additionally determine differences in heat capacity (ΔCp) between free and bound states.[17, 18] ITC is commonly applied to simple 1:1 binding reactions, but can be used to characterize more complicated systems in which ligands bind cooperatively at multiple sites and/or involve coupling to additional equilibria such as protonation/deprotonation, heterotropic allosteric effectors, changes in oligomeric state, or conformational changes.[19–21] Studying complex binding equilibria and determining mechanisms of allostery by ITC is challenging. For example, the same ITC data can sometimes match quite different physical models of interaction, and it can be difficult to ascertain which is correct. Characterizing the thermodynamic linkage between ligand binding and additional equilibria requires multiple sets of ITC data where maximizing the accuracy and self-consistency among the datasets is paramount. As well, ITC data contain little or no structural information in and of themselves. Thus their interpretation in terms of macromolecular conformational changes remains a challenge.[19],[22] Our laboratory has developed several approaches for addressing these issues. In this review we describe global fitting procedures to identify correct binding models from ITC data obtained at different concentrations, and to optimize the accuracy of binding parameters extracted from ITC datasets obtained at different temperatures. Finally, we describe an approach for combining ITC, nuclear magnetic resonance (NMR) and circular dichroism (CD) data to reveal molecular details of homotropic allosteric interactions.
We have used the enzyme aminoglycoside 6′-N-acetyltransferase-Ii (AAC(6′)-Ii) as a model system to develop and test ITC-based methods for characterizing protein allostery. This homodimeric enzyme confers antibiotic resistance to most aminoglycosides by transferring an acetyl group from Acetyl Coenzyme A (AcCoA) to the 6′ amine of these drugs.[24] The structure of AAC(6′)-Ii has been solved by X-ray crystallography bound to CoA and AcCoA[25–27] or inhibitors.[28] Each subunit of the enzyme contains a distinct active site and both sites are able to bind ligands simultaneously in the dimer. We also used a monomeric version of the enzyme in which tryptophan 164 in the dimer interface is substituted with alanine (AAC W164A).[29] Through the group analysis of ITC, NMR, and CD data, we have shown that the enzyme binds both AcCoA and an aminoglycoside ligand with homotropic allosteric mechanisms that are thermodynamically coupled to partial unfolding of the enzyme. The binding mechanisms of AcCoA and aminoglycoside are quite different however, shedding new light on the molecular determinants of allostery.[22, 23, 30, 31]
2. Identifying Correct Binding Models
ITC is commonly applied to simple binary complexes which are described by a single equilibrium association constant (KA=exp{−ΔG/(RT)}) and binding enthalpy (ΔH).[15, 17, 32, 33] In more complicated systems comprising multiple non-equivalent binding sites, at least two fundamentally different models can apply, as illustrated in Figure 2A,B for the case of two such sites: A) Multiple Independent Sites: This model comprises two different classes of binding site that interact with the ligand independently. There are n1 type 1 sites with affinity KA1 and binding enthalpy ΔH1 (□), and n2 type 2 sites with affinity KA2 and binding enthalpy ΔH2 (○). B) Cooperative Sites: This model comprises pairs of identical sites such that the first ligand to bind either site does so with affinity KA1 and binding enthalpy ΔH1. Homotropic allostery or cooperativity then alters the binding properties of the unoccupied site and the second ligand is bound with affinity KA2 and binding enthalpy ΔH2. While these models appear similar, they represent very different binding mechanisms. The independent model predicts that a macromolecule contains multiple structurally distinct and non-interacting binding surfaces, while the cooperative binding model predicts that the macromolecule contains two identical binding sites that are energetically coupled. Even though these models describe physically different events it is possible for them to agree with experimental data equally well, obscuring the molecular mechanism underlying binding.[22]
Figure 2.
Schematic representation of (A) non-identical, non-interacting sites and (B) identical, interacting sites for 2-site binding. In (A), both n1 and n2 have been set to 1 for clarity.
2.1. Varying the c-value
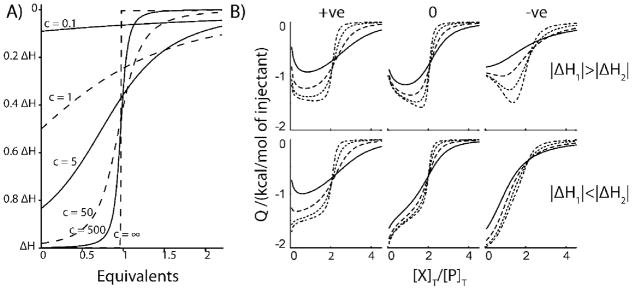
We have found that it is possible to discriminate between different binding models by analyzing multiple ITC datasets collected with different protein concentrations. In the case of a single class of non-interacting binding sites, it is convenient to express the protein analyte concentration [P]T, in terms of the parameter c which was introduced by Wiseman et al. as follows:
| (1) |
where n is the number of identical non-interacting binding sites present on the macro molecule.[33] ITC experiments are typically performed with c-values between 1 and 100 in order to accurately determine KA.[33] Experiments with larger c values (>50) produce relatively sharp transitions [33]. Experiments performed at low c values produce much shallower transitions which extend to much larger [X]T:[P]T ratios.[33] Thus for any given affinity and binding enthalpy, varying the protein concentration defines a family of related isotherms, Figure 3A. This trend also follows for more complex systems with multiple binding sites, as illustrated in Figure 3B for 2-site cooperative binding.[34] Varying the protein concentration defines a family of related curves for any given set of binding parameters KA1, KA2, ΔH1, and ΔH2. These families differ markedly depending on whether binding is positively or negatively cooperative and on the relative magnitudes of the binding enthalpies for the first and second ligands. Similarly, in the case of multiple independent sites, varying the protein concentration defines a family of curves for any given set of KA1, KA2, ΔH1, ΔH2, n1, and n2 values. A challenge in elucidating binding mechanisms is that different models can produce very similar ITC isotherms for a single protein concentration or c-value. The key to the variable-c approach is that even when several different models can reproduce a single ITC isotherm equally well, typically only the correct model can adequately account for the family of curves generated by varying the protein concentration. Note that we have employed a traditional ITC arrangement throughout, in which concentrated ligands are titrated into dilute solutions of protein. In certain situations (i.e. poor ligand solubility) it is recommended to titrate concentrated protein into a dilute solution of ligand. In this case very different families of curves would be generated. It is likely that these, too, would be suitable global analyses of the kind described below, however more research is required to verify this in practice.
Figure 3.
A) Theoretical ITC isotherms generated with different c-values for a single-set of equivalent sites model. B) Theoretical ITC isotherms generated according to a 2-site cooperative model, with [P]T = 0.5, 1.5, 4.5, 13.5 μM for the solid, dashed, dotted, and dash-dotted lines respectively. In B) left-most panels show positively-cooperative, and right-most panels show negatively-cooperative datasets. Centre panels correspond to systems where both ligands bind with equal affinities, but with different enthalpies. The top panels, |ΔH2|>|ΔHi|. In the bottom panels, |ΔH2|<|ΔHi|. Values of KA1 (×105 M), KA2 (×105 M), ΔH1(kcal/mol), ΔH2(kcal/mol) employed are: upper-left) 1,10,-1,-2; upper-centre) 1,1,-1,-2; upper-right)10,1,-1,-2; lower-left)1,10,-2,-1; lower-centre)1,1,-2,-1; lower-right)10,1,-2,-1. These correspond to c-values ranging from 0.05 to 13.5. Adapted from Freiburger et al [22].
2.2. Calculating variable-c isotherms
In the case of both independent and cooperative models, isotherms may be calculated using a heat function, Q, defined such that the heat released or absorbed during ith injection is given by the expression
| (2) |
which takes into account the sample displaced from the working volume of the cell by the injection.[35] Vi is the volume of the ith injection, Vc is the working volume of the sample cell, Q(i) is the value of the heat function following the ith injection, and Q0 is an offset parameter that accounts for heats of mixing. The total concentrations of ligand, [X]T, and protein, [P]T, present in the working volume of the cell after n injections with a total volume of may be calculated assuming that each increment of volume displaced from the working cell, dV, contains ligand and protein at the concentrations present throughout the working cell. Accordingly,
| (3) |
| (4) |
and
| (5) |
| (6) |
where [X]0 is the concentration of ligand in the syringe and [P]0 is the initial protein concentration. Note that equations (5) and (6) apply to all values of ΔV, and differ slightly from those listed in the MicroCal handbook, which are approximations valid when ΔV<Vc. Deviations between the two sets of expressions for the volumes employed in these experiments are generally less than 0.1%. Heat functions may be calculated in terms of [X]T, [P]T, and the binding parameters for both independent and cooperative binding models as follows:
Independent sites
This model describes binding to a macromolecule containing n1 independent sites with microscopic association constants KA1 and n2 independent sites with microscopic association constants KA2. The fractions of type 1 and type 2 sites that are occupied by ligand may be calculated according to
| (7) |
where [X] is the concentration of free ligand and KD1,2=(KA1,2)−1. The total concentration of ligand is given by the expression
| (8) |
Substituting Equation (7) into (8) gives the following third-order polynomial in [X]
| (9) |
where
The concentration of free ligand [X] for any combination of [X]T, [P]T, and binding parameters corresponds to the positive, real root of equation (9), which may be determined analytically [36, 37] or numerically, for example by using the bisection method.[38]The values of f1 and f2 can then be determined by substituting [X] into equation (7). Finally the heat function for the independent sites model is given by the expression
| (10) |
where ΔH1 and ΔH2 are the binding enthalpies (Hbound-Hfree) of each type 1 or type 2 site, respectively.
Cooperative sites
This model describes a protein with two identical, energetically-coupled sites. The first ligand binds to either site of the free protein, P→PX, with an association constant KA1
| (11) |
The second ligand binds the unoccupied site of a singly-bound protein, PX→PX2, with an association constant KA2,
| (12) |
The fractions of proteins in the singly-bound, f1, and doubly-bound, f2, states are given by the expressions
| (13) |
and
| (14) |
where KD1,2=(KA1,2)−1. The total ligand concentration in the sample is
| (15) |
Substituting equations (13) and (14) into equation (15) gives the following cubic expression in [X]
| (16) |
where
Similarly to the independent sites model, the positive real root of equation (16) gives the concentration of free ligand, [X], which substituted into equations (13) and (14), provides the values of f1 and f2. Finally, the heat function for this model is
| (17) |
where ΔH1=HPX−HP and ΔH2=HPX2−HPX.
ITC data are fit by adjusting binding parameters to minimize the sum of residual squared differences (RSS) between experimental data points and those calculated using equation (2),
| (18) |
where the sum runs over all data points in all ITC titrations performed at multiple protein concentrations. Uncertainties in the fitted parameters may be obtained from the covariance matrix, which is given by the expression[39]
| (19) |
where
and the derivatives are evaluated numerically at the optimized values of the binding parameters. W is a diagonal matrix of the fitting weights, which in this case are equal to 1, and ν is the number of degrees of freedom of the fit. The diagonal elements of V are the variances of the KA and ΔH parameter estimates.
1.1. Application to AAC(6′)-Ii
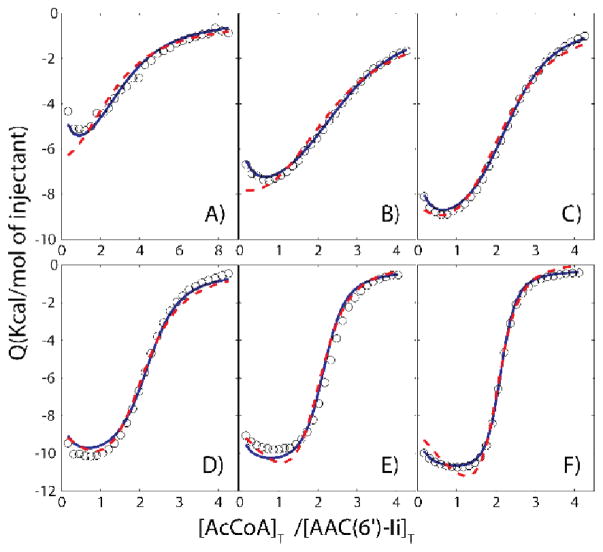
We applied the variable-c approach to determine the correct model for the dimeric enzyme AAC(6′)-Ii which binds a molecule of AcCoA in each of its two subunits.[26, 27] ITC experiments were performed on 6 different samples with protein concentrations ranging 6 to 192 μM. We first fit the independent and cooperative models on an individual basis, with different binding parameters extracted for each sample (protein concentration). Slightly lower residual-sum-of-squared deviations (RSS) were obtained for the independent sites model, compared to the cooperative model, RSS = 4.2×10⁵ versus 5.5×10⁵, respectively. This reflects the fact that the independent sites model contains additional stoichiometric parameters (n1 and n2) not present in the cooperative model and consequently has fewer degrees of freedom. In contrast, when the fits were performed globally with a single set of binding parameters for all samples, the cooperative model clearly outperformed the independent sites model, despite having fewer adjustable parameters, with RSS = 9.7×10⁶ versus 2.4×10⁷ (Figure 4). This is particularly evident in Figure 4A,B, where the cooperative but not the independent model accounts for the initial negative slopes of the ITC data. The improvement in fit offered by the cooperative model over the independent sites model is statistically significant to a high level of confidence, p=2×10⁻⁸. Thus analyses of ITC data obtained with any single [P]T value do not effectively discriminate between the two binding models, while a global analysis of the variable-c dataset conclusively shows that the cooperative model is the more appropriate description of AcCoA binding.
Figure 4.
ITC binding isotherms (circles) of AAC(6′)-Ii at A) 6, B) 12, C) 24, D) 48, E) 96,F) 192 μM titrated with AcCoA at 20°C. Dashed red and solid blue lines correspond to global fits using the independent and cooperative models, respectively. Values of c range from 0.4–11and 2–64 for the first and second binding events. In general, of c values starting at less than or close to 1and extending over about an order of magnitude are appropriate for this method. Adapted from Freiburger et al [22].
2. Characterizing linkage to additional thermodynamic equilibria
There are two main classes of binding models, which we will refer to as being phenomenological and mechanistic. For any molecule with N binding sites, the phenomenological model is defined by the binding polynomial, Z, and average enthalpy <H>, according to[40]
| (20) |
| (21) |
| (22) |
where the KA,iapp are apparent affinity equilibrium constants and ΔHA,iapp is the difference between the apparent enthalpy of molecules bound to i ligands and that of the free state, H0. The N different binding constants KA,iapp and enthalpies ΔHA,iapp entirely describe the binding behaviour regardless of whether the sites are independent or coupled and whether they are identical or distinct. An advantage of phenomenological models is that they require no knowledge of the underlying binding mechanism.[40] In contrast, mechanistic models describe the molecular events associated with ligand binding, such as coupling to additional processes including protein folding or protonation/deprotonation reactions.[21, 41–46] These are important as they shed light on how protein function is achieved at the atomic level. ITC results are typically interpreted in a two-step process.[40] Data are obtained at a series of different sample conditions, such as a range of temperatures or concentrations of a heterotropic allosteric effectors. The raw ITC isotherms are first fit using a phenomenological model for the appropriate stoichiometry (N), providing values for the apparent changes in enthalpy (ΔHA,iapp) and apparent association constants (KA,iapp). A mechanistic model is then selected and the corresponding model-specific thermodynamic parameters fitted to the phenomenological enthalpy and affinity values obtained for the range of sample conditions, shedding light on allosteric events involved in protein-ligand binding.[21, 23, 30, 41, 42]
2.1. Coupled folding/binding
A common example of a mechanistic binding model is coupling between protein folding and ligand binding, as illustrated in the scheme below for a molecule with a single binding site:
| (23) |
The folded protein, F, is binding-competent and the unfolded protein, U, is binding-incompetent. The parameters ΔHF, ΔHA, and ΔCp,F, ΔCp,A, are changes in enthalpy and heat capacity for the folding and binding steps, while KF = [F]/[U] and KA = [FL]/[F][L] are equilibrium constants. In this case, the phenomenological binding model at any individual temperature is completely defined by the apparent affinity constant KAapp and the apparent binding enthalpy ΔHAapp which are related to the ITC isotherm by the single-site heat function:
| (24) |
The temperature dependence of ΔHAapp gives the apparent change in heat capacity upon binding:[47]
If a protein undergoes a thermal denaturation (F→U) within the temperature range studied, the ΔHAapp versus T plot can be strongly curvilinear.[41] The transition from U to F is exothermic (ΔHF < 0) therefore at low temperatures the protein is predominantly folded and the apparent binding affinity and enthalpy are simply given by KA and ΔHA, respectively. At higher temperatures an appreciable fraction of the free protein exists in the unfolded state. ITC measurements therefore involve transitions from the U to FX states and the heat absorbed or released contains contributions from both folding and binding reactions. The mechanistic model parameters (ΔHF, ΔHA, ΔCp,F, ΔCp,A, KF and KA) are related to the phenomenological binding parameters (KAapp and ΔHAapp obtained over a range of temperatures) as follows:
| (25) |
| (26) |
where
| (27) |
| (28) |
Y = F or A, and T0 is an arbitrary reference temperature.
In principle, it is possible to extract the mechanistic model parameters from the phenomenological thermodynamic values determined by ITC over a range of temperatures. In practice, however, there is a high degree of covariation between the fitted parameters, leading to unreliable estimates of their values based on ITC data alone. Ladbury and coworkers have shown that combining ITC data with those of circular dichroism (CD) data can alleviate this problem as protein folding is typically accompanied by changes in molar ellipticity, [Θ].[41] The temperature dependence of the molar ellipticity is given by
| (29) |
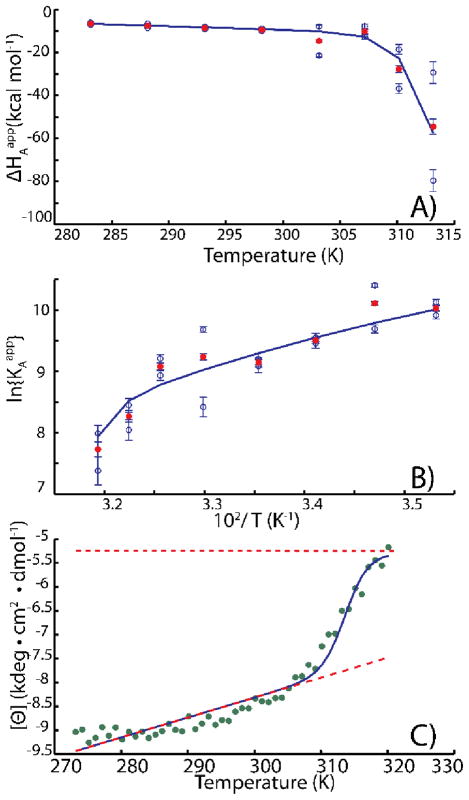
where [θ]F and [θ]U are the molar ellipticities for the folded and unfolded forms of the protein at T=T0 and mF and mU are the baseline slopes. We applied the combined ITC/CD approach to the interaction of the W164A mutant of AAC(6′)-Ii with AcCoA. This mutant is monomeric and binds AcCoA with 1:1 stoichiometry. Temperature dependent ITC and CD data are shown in Figure 5. A plot of the apparent binding enthalpy, ΔHAapp, versus temperature shows pronounced curvature around 310 K, corresponding to an increase in the amount of heat released upon ligand binding. The molar ellipticity measured at a wavelength of 222 nm decreases over the same temperature range. Both alpha-helices and beta-sheets exhibit large and negative molar ellipticities,[48, 49] while those of unstructured polypeptides are close to zero or slightly positive at this wavelength.[48–50] Thus the ITC and CD data are consistent with W164A-AAC undergoing an endothermic transition from a binding-competent to a binding-incompetent species around 310 K. Importantly, it is not necessary to have atomic-resolution structural data in order to draw this conclusion. However, we note that these data do not exclude the possibility of more complicated mechanisms, for example ones in which the unfolded form of the protein retains weak ligand affinity or the bound state undergoes thermal transitions. However, coupled folding and binding (Equation 23) provides the simplest and most likely explanation for our observations. Furthermore, the excellent agreement we obtain using this model implies that additional thermodynamic parameters associated with more complicated mechanisms would not be well defined. Consequently the coupled folding binding model has been used throughout.
Figure 5.
Coupled folding/binding analysis of (A) ΔHAapp, and (B) KAapp, values obtained from fits of individual ITC isotherms, together with (C) circular dichroism spectroscopic data (222 nm). In A and B, blue symbols indicate the values obtained for individual replicate experiments (two per temperature), while the red symbols are the pair-wise averages. Red error-bars correspond to combination in quadrature of the blue error bars. In (C), the upper and lower dashed lines correspond to the unfolded and folded ellipticity baselines, respectively. CD melts were completely reversible up to 323 K. At temperatures above this we observed a gradual decay of CD signal likely due to slow aggregation. Therefore we used data from 273.25 to 320K in our analysis. Adapted from Freiburger et al [30].
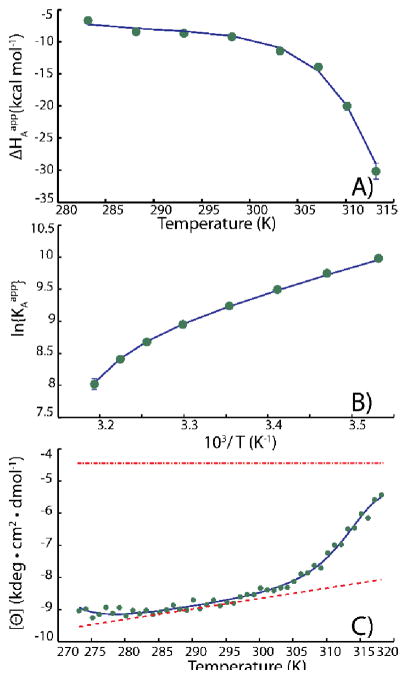
The temperature dependent ΔHAapp, KAapp, and [Θ] values can be analyzed to yield mechanistic coupled folding/binding thermodynamic parameters (blue curves in Figure 5). However the experimental errors for the apparent thermodynamic parameters are large, leading to significant scatter. This obscures their temperature dependences and leads to large uncertainties when extracting the mechanistic parameters.
2.2. Global fitting of variable-temperature ITC data
The ability to discriminate among different mechanistic models relies on the availability of accurate phenomenological binding parameters. A number of different situations can produce elevated errors in ΔHAapp and KAapp, such as when affinities are low,[51] enthalpy changes are small, or when macromolecules contain multiple non-equivalent binding sites.[52] If errors in the phenomenological thermodynamic parameters are large, developing robust, quantitative descriptions of the molecular binding process becomes challenging if not impossible, as seen in Figure 5. The accuracy of extracted parameters can be improved by fitting multiple ITC isotherms simultaneously.[10, 23, 30, 32, 53, 54] Thus global fitting methods are potentially very useful in situations with a high experimental uncertainty. However, in order to perform global fitting on variable temperature datasets, all ITC isotherms must be related mathematically. The standard phenomenological binding models provide no description to relate data sets performed at different temperatures. Instead, a mechanistic model can be fitted directly to a variable temperature dataset.[32, 53, 54] However, this requires a priori knowledge of the binding mechanism which may not be readily available.
While phenomenological models do not provide a description how the system changes when the temperature is varied, fundamentally ΔHAapp and KAapp are related through the van ‘t Hoff relation:
| (30) |
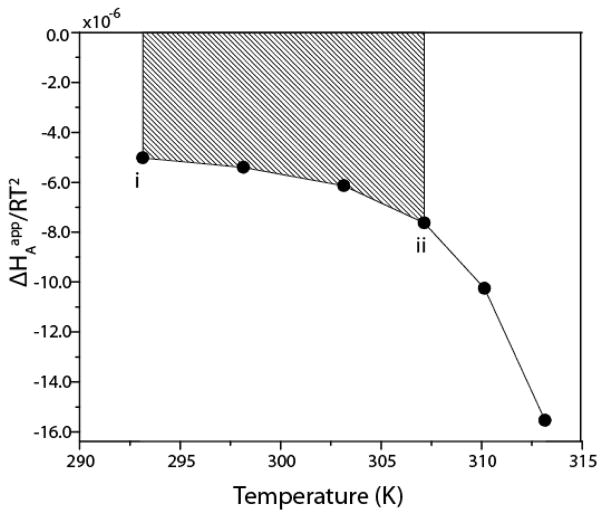
where T is the measurement temperature. All models must follow this relation to be physically reasonable, regardless of the underlying molecular mechanism. We have used this relation to constrain the global fit and relate all isotherms at different temperatures mathematically.[30, 34] In the van ‘t Hoff global fitting approach, HAapp is optimized for each temperature, but only a single binding constant, K0app, is fitted. All subsequent binding constants are determined by trapezoidal integration of the van ‘t Hoff equation which is given be the expression
| (31) |
where K0app is the apparent binding constant at the reference temperature (T0), and the ith set of ITC experiments are performed at a temperature Ti and fitted with a binding enthalpy ΔHiapp, Figure 6.[23, 30] In practice, for an ITC dataset of NR replicate experiments collected at each of NT different temperatures, a van ‘t Hoff global fit has NT adjustable ΔHA values (one for each temperature), and a single adjustable equilibrium constant (K0app). Global fitting then comprises the following steps:
Figure 6.
Schematic representation of trapezoidal integration of ΔHAapp/RT2. The points represent the fitted values of ΔHAapp, divided by the corresponding values of RT2. The difference in binding affinity between temperatures Ti and Tii corresponds to the shaded area, i.e. KAapp(ii) = KAapp(i) + shaded area. Thus the ΔHAapp/RT2 profile together with the single value of KAapp(i) specifies the affinity constants at all other temperatures. Adapted from Freiburger et al [30].
Starting with the initial values of the parameter set listed above, calculate the remaining (NT-1) equilibrium constants using K0app and the set of NT ΔHAapp values, according to Equation (31).
For each of the NR×NT isotherms, calculate the heat function, Q, using the KAapp and ΔHAapp value for the corresponding temperature according to Equation (24).
Calculate each isotherm according to Equation (2).
Repeat steps 1–4, varying the adjustable parameters in order to minimize the RSS given by Equation (18), using a standard least-squares minimization algorithm.
The van ‘t Hoff global fit reduces the total number of adjustable parameters and increases the number of degrees of freedom, compared to fits performed independently at each temperature. This leads to more accurate and unbiased determinations of ΔHAapp and KAapp values.[30, 34] An application of this approach to the raw W164A-AAC binding data of Figure 5 is shown in Figure 7. The scatter of the phenomenological ΔHAapp and KAapp values is clearly reduced, resulting in better determination of the coupled folding/binding parameters.
Figure 7.
Coupled folding/binding analysis of (A) ΔHAapp and (B) KAapp values obtained from a global van ‘t Hoff fit of ITC isotherms obtained at 8 temperatures in duplicate, together with (C) circular dichroism spectroscopic data (222 nm). In (C), the upper and lower dashed lines correspond to the unfolded and folded ellipticity baselines, respectively. Curvature of the blue fitted line at low temperatures is due to cold denaturation. Adapted from Freiburger et al [30].
2.3. Coupled folding and binding in systems with multiple sites
Molecules with more than one binding site can also experience coupling between binding and folding equilibria. In the case of two site binding, the joint ITC/CD mechanistic binding model comprises sixteen adjustable parameters. Binding of the first and second molecules of ligand to the folded protein are each associated with affinity constants (KA1, KA2), changes in enthalpy (ΔHA1, ΔHA2), and heat capacity (ΔCpA1, ΔCpA2), respectively. Partial unfolding of subunits in the protein bound to 0 and 1 molecules of ligand are associated with equilibrium constants (KU0, KU1), changes in enthalpy (ΔHU0, ΔHU1), and heat capacity (ΔCpU0, ΔCpU1). Four additional parameters describe the slopes and y-intercepts of the folded and unfolded baselines of the CD data. The temperature dependences of the mechanistic equilibrium constants and enthalpies are given by
| (32) |
and
| (33) |
where K′ and ΔH′ are the equilibrium constant and enthalpy change at an arbitrary reference temperature T′ and ΔCp is the change in heat capacity.
The phenomenological binding model in this case comprises 4 parameters (KA1app, ΔHA1app, KA2app, and ΔHA2app) at each temperature studied, for binding of the first and second molecules of ligand. The phenomenological parameters are related to the mechanistic model as follows[23]:
| (34) |
| (35) |
| (36) |
and
| (37) |
at each temperature. Combining Eq (29), (34), (35), (36) and (37) the mechanistic model parameters are extracted by minimizing the target function against ITC and CD data simultaneously
| (38) |
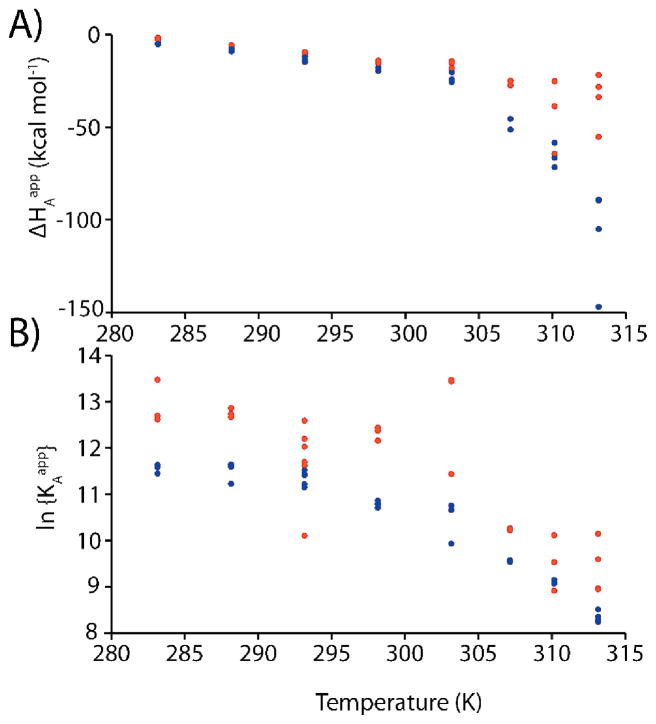
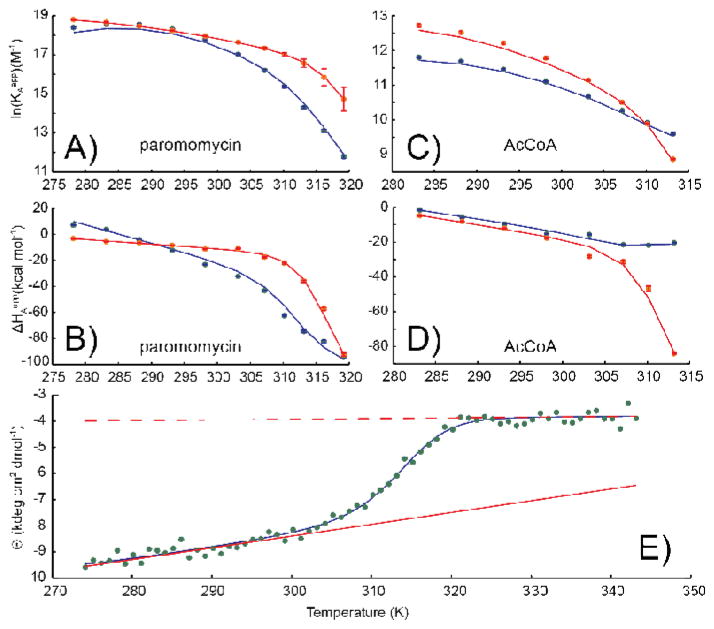
Values of KA, ΔH, and θ can differ by several orders of magnitude. Thus fractional differences are used in the the sum of fitting residuals (Equation 38) to ensure each parameter is weighted equally. Molecules with more than one binding site are challenging to characterize by ITC as extracted parameters can suffer from covariation. This presents a hurdle to elucidating robust mechanistic information. For example, wild-type AAC(6′)-Ii cooperatively binds two molecules of substrate (AcCoA or aminoglycoside) per dimer. Phenomenological binding parameters for AcCoA determined over a range of temperatures are plotted in Figure 8. While the ΔHA1,2app versus T profiles are clearly curvilinear, suggestive of a coupled folding/binding equilibrium, the large amount of scatter in the data points obstructs precise analyses in terms of a mechanistic model. This issue can be overcome using the global van ‘t Hoff fitting method. KA1app is related to ΔHA1app and KA2app is related to ΔHA2app according to Equation (31). We applied the van ‘t Hoff fitting method to ITC data for AAC(6′)-Ii binding to AcCoA and to the aminoglycoside paromomycin collected over a range of temperatures. In this case, KA1,2app are calculated using Equation (31) as before. The values of KA1,2app and ΔHA1,2app are used to calculate isotherms according to Equations (17) and (2) and the phenomenological parameters are varied to minimize the target function, Equation (18). CD measurements were subsequently performed on apo-AAC(6′)-Ii to obtain the molar-ellipticity as a function of temperature, Figure 9E. The globally-fit phenomenological binding parameters can subsequently be analyzed according to the coupled folding/binding mechanistic model combining ITC and CD data, Equations (29) and (32) to (37) as illustrated in Figure 9. A comparison of Figure 8 and Figure 9C,D highlights the improvement in the accuracy of extracted thermodynamic parameters afforded by global fitting.
Figure 8.
Values of ΔHAapp and KAapp determined for binding of the first (light blue) and second (dark red) molecules of AcCoA to AAC(6′)-Ii, from independent (non-global) fits of individual ITC isotherms.
Figure 9.
Global van ‘t Hoff analysis of paromomycin and AcCoA binding to AAC(6′)-Ii. ITC-derived (A,C) apparent association constants and (B,D) apparent enthalpies for binding to (A,B) paromomycin and (C,D) AcCoA. Blue and red symbols and curves correspond to the first and second binding events, respectively. (E) CD-derived molar ellipticity of apo-AAC(6′)-Ii determined as a function of temperature. Curves in all panels represent the best fit to a global model of allostery as described in the text. Solid and dashed lines in (E) correspond to folded and unfolded CD baselines, respectively. Adapted from Freiburger et al [55].
3. Allostery mediated by protein conformational changes
ITC is extremely sensitive to the energetics of conformational transitions and macromolecular interactions. However it can be difficult to relate these measurements to specific changes in molecular structure and flexibility without additional information. For example it is not possible to discriminate between the allosteric models represented in Figure 1 based on calorimetric data alone. In this regard, it is very powerful to combine ITC data with those of NMR spectroscopy. NMR is exquisitely sensitive to macromolecular conformation and dynamics at the level of individual atoms, but thermodynamic information is obtained indirectly. Combining NMR and calorimetric measurements thus allows one to develop models of allostery and other molecular functions that are thermodynamically rigorous with atomic resolution. One caveat for the use of NMR is that it is technically a more demanding technique than either ITC or CD spectroscopy. Proteins must be isotopically enriched, and stably monodisperse at concentrations of roughly 200 μM or greater. Furthermore, NMR becomes more challenging with increasing molecular weight, necessitating specific labelling schemes[56, 57] and relaxation-optimised experiments [58, 59].
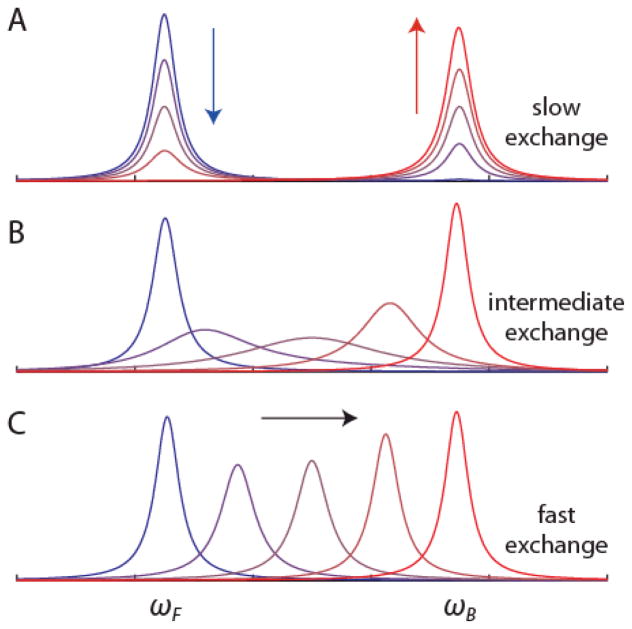
Protein NMR spectra can be collected with ligand present at a range of concentrations under conditions matching those of ITC titrations. Consider a hypothetical protein binding site that contains an NMR-active nucleus that precesses at a resonance frequency ωF in the absence of ligand. Ligand binding alters the local electronic environment of the nucleus, resulting in a shift of the resonance frequency to ωB. The resulting NMR signal from the ensemble of nuclei in the sample depends on the fraction of binding sites that are occupied by ligand, fB, the difference in chemical shift between the free and bound states, Δω = ωB - ωF, and the rate at which the ligand associates and dissociates, kex = kon′ + koff. Note that in this example, kon′ is a pseudo-first order rate constant that depends on the second order association rate constant and the concentration of free ligand, kon′ = kon [X]. When kex ≪ Δω, the system is in the slow exchange regime and spectra contain separate peaks at ωF and ωB. If ligand is gradually added, the intensity (IF) of the “free” peak at ωF decreases while the intensity (IB) of the “bound” peak at ωB increases, according to IB ∝ fB[P]T and IF ∝ (1-fB)[P]T (Figure 10A). In contrast, when kex ≫ Δω, the system is in the fast exchange regime and the spectrum contains a single peak at the population-weighted average precession frequency. If ligand is titrated into the sample, the position of the peak gradually shifts from ωF to ωB, according to ωobs = ωF + fB·Δω (Figure 10C). Thus analyses of peak intensities or positions can yield quantitative information on the populations of different conformational states at atomic resolution. Furthermore, fluctuations in ω on the millisecond to microsecond time scale, for example due to exchange between ligand-free and ligand-bound states or internal motions, leads to enhanced transverse relaxation and increases in the line widths of NMR signals (Figure 10B).
Figure 10.
Effect of ligand binding on an NMR signal. Superposition of simulated 1D NMR spectra for a nucleus with a resonant frequency ωF in the free state and ωB in the bound state of a protein that is 1%, 25%, 50%, 75%, and 99% ligand-bound. The spectrum of the free state is transformed into that of the bound state in a manner which depends upon the rate of exchange between the two states. (A) slow exchange regime where kex ≪ Δω, (B) intermediate exchange regime where kex ≈ Δω (C) fast exchange regime where kex ≫ Δω, where kex = koff + kon[X] and Δω = |ωB−ωF| = 100π rad s−1, in the simulations.
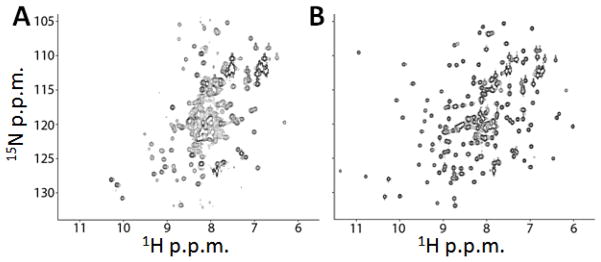
In the case of AAC(6′)-Ii, two dimensional 1H/15N NMR correlation spectra of the free (apo) and the AcCoA- or paromomycin-saturated (holo) forms are very different. The apo-spectrum exhibits poor chemical shift dispersion and a high degree of overlap, with approximately 20% of the expected signals missing (Figure 11A). This is likely due to pervasive dynamic exchange broadening and/or hydrogen exchange with water, characteristic of extensive conformational mobility. In contrast to the free form, the spectra of the AcCoA-saturated (Figure 11B) or paromomycin-saturated enzyme are typical of a folded globular protein, suggesting that large structural and dynamic changes accompany ligand binding. Adapted from Mittermaier and Meneses [60].
Figure 11.
1H/15N NMR correlation spectra of AAC(6′)-Ii free (A) and saturated with AcCoA (B)
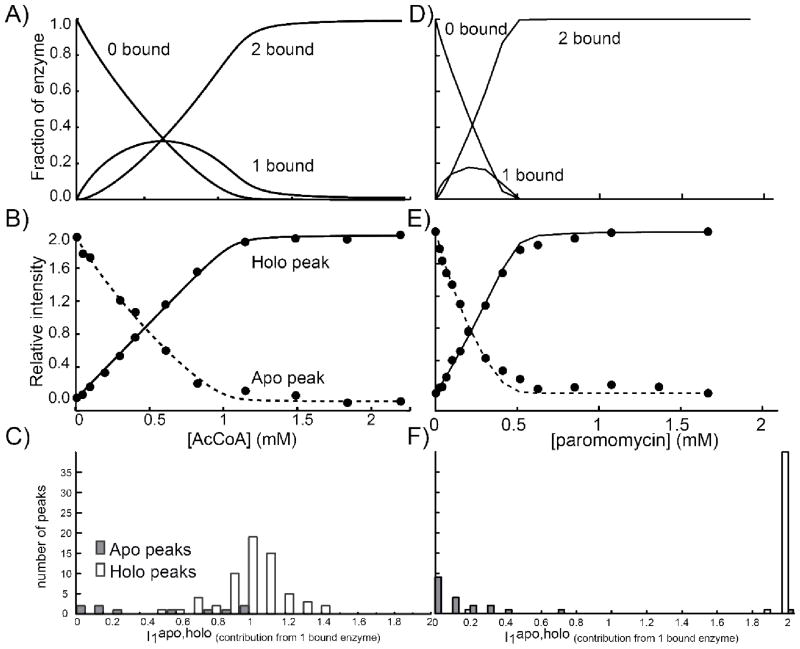
We have found that the combination of NMR titration data with those of calorimetry can distinguish among different allosteric paradigms. In what follows, apo and holo are used to describe peaks appearing in NMR spectra of the ligand-free and ligand-saturated protein, and 0-bound, 1-bound, and 2-bound to describe the various ligated states of the enzyme. Exchange occurs slowly on the NMR chemical shift timescale therefore both apo and holo peaks are simultaneously visible in spectra collected midway through titrations and peak intensities are proportional to the concentrations of subunits in the apo and holo conformational forms. The expected fractions of enzyme in the 0-bound (f0), 1-bound (f1), and 2-bound (f2) forms are calculated based on the binding parameters determined by ITC for AcCoA (Figure 12A) or paromomycin (Figure 12D). The value of f1 is predicted to increase to between 20% and 30% at partial ligand saturation, before decreasing at higher concentrations. However none of the signals in the spectra follow this pattern of intensities. This implies that all signals from the 1-bound form are either coincident with those of the 0-bound or 2-bound states (i.e. contribute to the apo or holo peaks or are located in overlapped regions) or are dynamically broadened beyond detection. In order to combine the NMR and ITC data, the intensity profile of each well-resolved apo and holo peak (Itotapo, Itotholo) is fitted using the ITC-derived f0, f1, and f2 values, adjusting only the relative contribution of the 1-bound state to the apo or holo peak as follows: the initial intensity of each apo peak is normalized to 2, and the final intensity of each holo peak is normalized to 2, corresponding to the two subunits of the homodimeric enzyme. Peak intensities throughout the titrations are calculated as:
| (39) |
| (40) |
Figure 12.
Joint NMR/ITC analysis of AAC(6′)-Ii binding to AcCoa (A-C) and paromomycin (D-E). Fraction of enzyme in the 0-bound, 1 bound and 2 bound states determined by ITC (A,D). Intensities of a representative apo peak (dashed line) and holo peak (solid line) throughout a titration (B, E). Histograms of the relative contributions of the 1 bound state to apo (I1apo) and holo (I1holo) peaks of AAC(6′)-Ii (C,F).
The values of and quantify the contributions of the 1-bound state to the apo and holo signals, respectively. By optimizing these parameters, excellent agreement with NMR peak intensities can be obtained throughout the titrations (Figure 12B, E). With AAC(6′)-Ii the extracted values for cluster about a value of 1 (Figure 12C). This strongly suggests that a single subunit of the 1-bound enzyme resembles those of the holo form, reminiscent the KNF allosteric model (Figure 1B). Interestingly, the values obtained for the are fairly heterogeneous, ranging from 0 to 1. This could result from increased dynamic broadening, hydrogen exchange with solvent or movement of peaks to overlapped regions of the spectrum. With paromomycin, the values obtained for cluster around 2 and the values obtained for the are clustered around 0 (Figure 12F). This strongly suggests that upon binding a single molecule of paromomycin, both subunits adopt a conformation which is similar to that of the holo enzyme, reminiscent of the MWC allosteric paradigm (Figure 1A).
3.1. Competing mechanisms and ligand-dependent switching of allostery in AAC(6′)-Ii
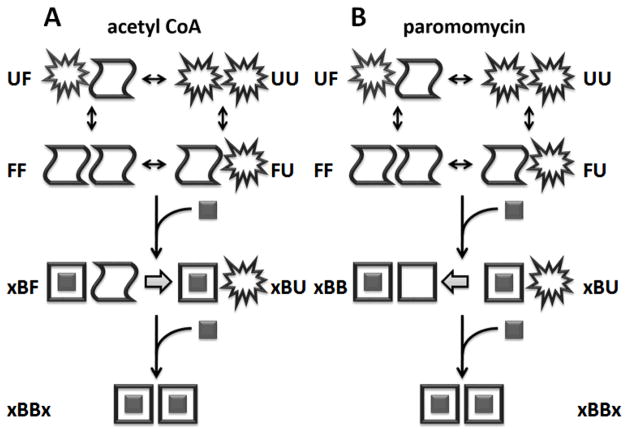
The combination of ITC, CD, and NMR data show that allosteric binding of AcCoA by AAC(6′)-Ii can be explained by a model comprising a hybrid of the KNF and EAM paradigms. The subunits undergo partial thermal unfolding (F→U), although the enzyme remains dimeric, even at higher temperatures.[23] Therefore the free enzyme exists as a mixture of FF, FU, UF, and UU states. When a subunit binds AcCoA it undergoes a large conformational change to adopt the B state, while the unbound subunit retains an apo-like configuration that can undergo thermal unfolding. Thus the 1-bound enzyme exists as a mixture of xBF, xBU, FBx, and UBx forms. The 2-bound enzyme exists simply as xBBx. The energy of AAC(6′)-Ii binding to AcCoA can be separated into two distinct contributions. Firstly, the native dimer binds with intrinsically positive cooperativity following a classical KNF explanation of allostery in which the 1-bound state is asymmetrical.[10] Secondly, the unbound subunits undergo partial unfolding as the temperature is raised, such that subunits are more stable in the context of the 0-bound compared to the 1-bound state. At higher temperatures, this results in partial unfolding of the unbound subunit of the 1-bound enzyme (xBF→xBU), with a concomitant reduction in affinity for the second AcCoA molecule (KA2app) and a shift towards negative cooperativity. This effect represents a modification of the EAM (Fig. 1C).[61] In the EAM model, ligand-induced folding of one subunit alters the folding equilibrium of the adjacent subunit. In AAC(6′)-Ii, each subunit can adopt at least three distinct conformational states, and it is largely the F to B transition that modulates partial unfolding of the adjacent subunit. Thus the shift from positive to negative cooperativity observed for AcCoA binding (Figure 9C) results from competition between a positively cooperative KNF mechanism and a negatively-cooperative EAM (Figure 13A) .
Figure 13.
Schematic representation of allosteric equilibria of AAC(6′)-Ii binding to AcCoA (A) and paromomycin (B) where x, B, F, and U represent ligand and enzyme subunits the holo, apo, and partially unfolded forms, respectively.
Similarly to AcCoA, the enzyme bound to two molecules of paromomycin adopts the xBBx conformation while the free enzyme exists as a mixture of FF, FU, UF, and UU. In this case however, NMR data indicate that the native 1-bound state is symmetrical, although the unbound subunit can undergo partial unfolding: xBB, xBU, BBx, and UBx. Once again, allostery is governed by two superposed mechanisms. Firstly, the native dimer binds with intrinsically positive cooperativity following a classical MWC paradigm. Secondly, the unbound subunit is more stable in the context of the paromomycin 1-bound form than in the free protein. This leads results in additional positive cooperativity, following a modified EAM paradigm (Figure 13B). Thus the enzyme follows strikingly different allosteric mechanisms (KNF vs. MWC) depending upon which substrate is bound. We attribute this switching behaviour to the locations of the AcCoA and aminoglycoside binding pockets within the active site of the enzyme. The structure of the enzyme has been solved in complex with bisubstrate inhibitors comprising CoA covalently tethered to aminoglycosides.[28, 62] The aminoglycoside portion of the bisubstrate inhibitor is located very near the dimer interface and approaches to within 4 Å of the adjacent subunit. Reorientation could potentially bring it into direct contact. In contrast, CoA is bound more than 10 Å away from the interface. The proximity of one paromomycin molecule to both subunits of the enzyme likely stabilizes the interface and drives simultaneous F→B transitions. Conversely, the distance of a single AcCoA molecule from the adjacent subunit does not stabilize the interface to as great an extent and only the bound subunit experiences an F→B transition.
The MWC and KNF allosteric paradigms represent limiting cases of a thermodynamic continuum in which binding of ligands to one subunit alters conformational equilibria in adjacent subunits via modulation of interface energies [14]. When the BB interface is sufficiently favourable to completely drive the F→B transition in the unbound subunit of the 1-bound state, the MWC model applies. Conversely, if the F→B transition is so unfavourable that the unbound subunit remains almost entirely in the F conformation in the 1-bound state, then the KNF model applies. In general however, allostery can be operative while the unbound subunit populates both F and B states to non-negligible extents [14, 55]. The joint ITC/NMR fitting approach described above can distinguish between predominately KNF versus MWC behaviour, however small populations of a symmetric 1-bound state in a KNF system, or small amounts of asymmetric 1-bound state in an MWC system, could go undetected. The application of additional NMR experiments capable of detecting high-energy states[63, 64] could help to resolve this ambiguity. This represents an interesting avenue for future research.
4. Conclusion
The application of global fitting techniques to ITC data represents a powerful approach for gaining insight into the molecular mechanisms of allostery. By simultaneously analysing isotherms obtained with a range of protein concentrations, one can determine with confidence whether allosteric interactions are indeed present. Global analyses of ITC data obtained over a range of temperatures produce binding parameters with improved accuracy compared to those extracted from individual fits. Fits that combine ITC and CD data permit coupled folding/binding equilibria to be characterized in detail. Finally, the combination of ITC and NMR data provides an avenue for determining how protein conformational changes are linked to ligand binding. By applying these global analysis techniques to AAC(6′)-Ii, we have uncovered the existence of competition between opposing allosteric mechanisms and ligand-dependent switching of the allosteric paradigm. Thus ITC in combination with other techniques has the potential to shed new light on how energetic communication is accomplished in biological macromolecules.
Acknowledgments
This research was funded by operating grants from the Canadian Institutes of Health Research (CIHR MOP-89784). A.M. is a member of Groupe de Recherche Axé sur la Structure des Protéines (GRASP), which funds the NMR centre where the experiments were performed. NMR experiments were recorded at the Québec–Eastern Canada High Field NMR Facility, supported by McGill University and GRASP.
References
- 1.Changeux JP. Cold Spring Harbor Symposia on Quantitative Biology. 1961;26:313–318. doi: 10.1101/sqb.1961.026.01.037. [DOI] [PubMed] [Google Scholar]
- 2.Monod J, Jacob F. Cold Spring Harbor Symposia on Quantitative Biology. 1961;26:389–401. doi: 10.1101/sqb.1961.026.01.048. [DOI] [PubMed] [Google Scholar]
- 3.Vale RD, Milligan RA. Science. 2000;288:88–95. doi: 10.1126/science.288.5463.88. [DOI] [PubMed] [Google Scholar]
- 4.Kusmierczyk AR, Martin J. FEBS Letters. 2003;547:201–204. doi: 10.1016/s0014-5793(03)00722-1. [DOI] [PubMed] [Google Scholar]
- 5.Suel GM, Lockless SW, Wall MA, Ranganathan R. Nat Struct Mol Biol. 2003;10:59–69. doi: 10.1038/nsb881. [DOI] [PubMed] [Google Scholar]
- 6.Perutz MF. Quarterly Reviews of Biophysics. 1989;22:139–237. doi: 10.1017/s0033583500003826. [DOI] [PubMed] [Google Scholar]
- 7.Monod J, Wyman J, Changeux JP. Journal of Molecular Biology. 1965;19:88–118. doi: 10.1016/s0022-2836(65)80285-6. [DOI] [PubMed] [Google Scholar]
- 8.Fenton AW. Trends in Biochemical Sciences. 2008;33:420–425. doi: 10.1016/j.tibs.2008.05.009. [DOI] [PMC free article] [PubMed] [Google Scholar]
- 9.DeDecker BS. Chemistry & Biology. 2000;7:R103–R107. doi: 10.1016/s1074-5521(00)00115-0. [DOI] [PubMed] [Google Scholar]
- 10.Koshland DE, Némethy G, Filmer D. Biochemistry. 1966;5:365–385. doi: 10.1021/bi00865a047. [DOI] [PubMed] [Google Scholar]
- 11.Palmer M, Vulicevic I, Saweljew P, Valeva A, Kehoe M, Bhakdi S. Biochemistry. 1998;37:2378–2383. doi: 10.1021/bi9720890. [DOI] [PubMed] [Google Scholar]
- 12.Peters CJ, Fedida D, Accili EA. Sci Rep. 2013;3 doi: 10.1038/srep03025. [DOI] [PMC free article] [PubMed] [Google Scholar]
- 13.May LT, Leach K, Sexton PM, Christopoulos A. Annual Review of Pharmacology and Toxicology. 2007;47:1–51. doi: 10.1146/annurev.pharmtox.47.120505.105159. [DOI] [PubMed] [Google Scholar]
- 14.Hilser VJ, Wrabl JO, Motlagh HN. Annual Review of Biophysics. 2012;41:585–609. doi: 10.1146/annurev-biophys-050511-102319. [DOI] [PMC free article] [PubMed] [Google Scholar]
- 15.Velazquez-Campoy A, Ohtaka H, Nezami A, Muzammil S, Freire E. Curr Prot Cell Biol. 2004;23:17.18.01–17.18.24. doi: 10.1002/0471143030.cb1708s23. [DOI] [PubMed] [Google Scholar]
- 16.Baranauskienė L, Petrikaitė V, Matulienė J, Matulis D. International Journal of Molecular Sciences. 2009;10:2752–2762. doi: 10.3390/ijms10062752. [DOI] [PMC free article] [PubMed] [Google Scholar]
- 17.Freire E, Mayorga OL, Straume M. Analytical Chemistry. 1990;62:950A–959A. [Google Scholar]
- 18.Liang Y. Acta Biochim Biophys Sin. 2008;40:565–576. doi: 10.1111/j.1745-7270.2008.00437.x. [DOI] [PubMed] [Google Scholar]
- 19.Bjelic S, Jelesarov I. Journal of Molecular Recognition. 2008;21:289–312. doi: 10.1002/jmr.909. [DOI] [PubMed] [Google Scholar]
- 20.Ghai R, Falconer RJ, Collins BM. Journal of Molecular Recognition. 2012;25:32–52. doi: 10.1002/jmr.1167. [DOI] [PubMed] [Google Scholar]
- 21.Eftink MR, Anusiem AC, Biltonen RL. Biochemistry. 1983;22:3884–3896. doi: 10.1021/bi00285a025. [DOI] [PubMed] [Google Scholar]
- 22.Freiburger LA, Auclair K, Mittermaier AK. ChemBioChem. 2009;10:2871–2873. doi: 10.1002/cbic.200900614. [DOI] [PMC free article] [PubMed] [Google Scholar]
- 23.Freiburger LA, Baettig OM, Sprules T, Berghuis AM, Auclair K, Mittermaier AK. Nat Struct Mol Biol. 2011;18:288–294. doi: 10.1038/nsmb.1978. [DOI] [PMC free article] [PubMed] [Google Scholar]
- 24.Wright GD, Ladak P. Antimicrob Agents Chemother. 1997;41:956–960. doi: 10.1128/aac.41.5.956. [DOI] [PMC free article] [PubMed] [Google Scholar]
- 25.Burk DL, Xiong B, Breitbach C, Berghuis AM. Acta Crystallographica Section D. 2005;61:1273–1279. doi: 10.1107/S0907444905021487. [DOI] [PubMed] [Google Scholar]
- 26.Wybenga-Groot LE, Draker K-a, Wright GD, Berghuis AM. Structure. 1999;7:497–507. doi: 10.1016/s0969-2126(99)80066-5. [DOI] [PubMed] [Google Scholar]
- 27.Burk DL, Ghuman N, Wybenga-Groot LE, Berghuis AM. Protein Science. 2003;12:426–437. doi: 10.1110/ps.0233503. [DOI] [PMC free article] [PubMed] [Google Scholar]
- 28.Gao F, Yan X, Baettig OM, Berghuis AM, Auclair K. Angewandte Chemie International Edition. 2005;44:6859–6862. doi: 10.1002/anie.200501399. [DOI] [PubMed] [Google Scholar]
- 29.Draker K, Northrop DB, Wright GD. Biochemistry. 2003;42:6565–6574. doi: 10.1021/bi034148h. [DOI] [PubMed] [Google Scholar]
- 30.Freiburger LA, Auclair K, Mittermaier AK. Thermochimica Acta. 2012;527:148–157. doi: 10.1016/j.tca.2011.10.018. [DOI] [PMC free article] [PubMed] [Google Scholar]
- 31.Freiburger L, Miletti T, Zhu S, Baettig O, Berghuis A, Auclair K, Mittermaier A. Nat Chem Biol. 2014 doi: 10.1038/nchembio.1626. In Press. [DOI] [PubMed] [Google Scholar]
- 32.Turner DC, Straume M, Kasimova MR, Gaber BP. Biochemistry. 1995;34:9517–9525. doi: 10.1021/bi00029a028. [DOI] [PubMed] [Google Scholar]
- 33.Wiseman T, Williston S, Brandts JF, Lin LN. Analytical Biochemistry. 1989;179:131–137. doi: 10.1016/0003-2697(89)90213-3. [DOI] [PubMed] [Google Scholar]
- 34.Freiburger LA, Auclair K, Mittermaier AK. 2010 submitted. [Google Scholar]
- 35.ITC Data Analysis in Origin Tutorial Guide v 7.0. MicroCal, LLC; 2004. [Google Scholar]
- 36.Wang ZX. FEBS Letters. 1995;360:111–114. doi: 10.1016/0014-5793(95)00062-e. [DOI] [PubMed] [Google Scholar]
- 37.Nielsen AD, Fuglsang CC, Westh P. Analytical Biochemistry. 2003;314:227–234. doi: 10.1016/s0003-2697(02)00655-3. [DOI] [PubMed] [Google Scholar]
- 38.Burden RL, Faires JD. Numerical Analysis. 7. Brooks/Cole; 2000. [Google Scholar]
- 39.Tellinghuisen J. Anal Biochem. 2005;343:106–115. doi: 10.1016/j.ab.2005.04.026. [DOI] [PubMed] [Google Scholar]
- 40.Freire E, Schon A, Velazquez-Campoy A. Methods Enzymol. 2009;455:127–155. doi: 10.1016/S0076-6879(08)04205-5. [DOI] [PubMed] [Google Scholar]
- 41.Cliff MJ, Williams MA, Brooke-Smith J, Barford D, Ladbury JE. Journal of Molecular Biology. 2005;346:717–732. doi: 10.1016/j.jmb.2004.12.017. [DOI] [PubMed] [Google Scholar]
- 42.Ha JH, Spolar RS, Record MT. Journal of Molecular Biology. 1989;209:801–816. doi: 10.1016/0022-2836(89)90608-6. [DOI] [PubMed] [Google Scholar]
- 43.Tsai CJ, Kumar S, Ma BY, Nussinov R. Protein Science. 1999;8:1181–1190. doi: 10.1110/ps.8.6.1181. [DOI] [PMC free article] [PubMed] [Google Scholar]
- 44.Kumar S, Ma B, Tsai CJ, Sinha N, Nussinov R. Protein Science. 2000;9:10–19. doi: 10.1110/ps.9.1.10. [DOI] [PMC free article] [PubMed] [Google Scholar]
- 45.Pan H, Lee JC, Hilser VJ. Proceedings of the National Academy of Sciences of the United States of America. 2000;97:12020–12025. doi: 10.1073/pnas.220240297. [DOI] [PMC free article] [PubMed] [Google Scholar]
- 46.Volkman BF, Lipson D, Wemmer DE, Kern D. Science. 2001;291:2429–2433. doi: 10.1126/science.291.5512.2429. [DOI] [PubMed] [Google Scholar]
- 47.Prabhu NV, Sharp KA. Annu Rev Phys Chem. 2005;56:521–548. doi: 10.1146/annurev.physchem.56.092503.141202. [DOI] [PubMed] [Google Scholar]
- 48.Adler AJ, Greenfield NJ, Fasman GD. Methods Enzymol. 1973;27:675–735. doi: 10.1016/s0076-6879(73)27030-1. [DOI] [PubMed] [Google Scholar]
- 49.Saxena VP, WDB Proc Natl Acad Sci USA. 1971;68:969–972. doi: 10.1073/pnas.68.5.969. [DOI] [PMC free article] [PubMed] [Google Scholar]
- 50.Uversky VN. Protein Sci. 2002;11:739–756. doi: 10.1110/ps.4210102. [DOI] [PMC free article] [PubMed] [Google Scholar]
- 51.Tellinghuisen J. Analytical Biochemistry. 2008;373:395–397. doi: 10.1016/j.ab.2007.08.039. [DOI] [PubMed] [Google Scholar]
- 52.Tochtrop GP, Richter K, Tang CG, Toner JJ, Covey DF, Cistola DP. Proceedings of the National Academy of Sciences of the United States of America. 2002;99:1847–1852. doi: 10.1073/pnas.012379199. [DOI] [PMC free article] [PubMed] [Google Scholar]
- 53.Baker BM, Murphy KP. Journal of Molecular Biology. 1997;268:557–569. doi: 10.1006/jmbi.1997.0977. [DOI] [PubMed] [Google Scholar]
- 54.Armstrong KM, Baker BM. Biophysical Journal. 2007;93:597–609. doi: 10.1529/biophysj.107.104570. [DOI] [PMC free article] [PubMed] [Google Scholar]
- 55.Freiburger L, Miletti T, Zhu S, Baettig O, Berghuis A, Auclair K, Mittermaier A. Nature Chemical Biology. 2014;10:937–942. doi: 10.1038/nchembio.1626. [DOI] [PubMed] [Google Scholar]
- 56.Gardner KH, Kay LE. Annual Review of Biophysics and Biomolecular Structure. 1998;27:357–406. doi: 10.1146/annurev.biophys.27.1.357. [DOI] [PubMed] [Google Scholar]
- 57.Ruschak AM, Kay LE. Journal of Biomolecular Nmr. 2010;46:75–87. doi: 10.1007/s10858-009-9376-1. [DOI] [PubMed] [Google Scholar]
- 58.Tugarinov V, Hwang PM, Ollerenshaw JE, Kay LE. Journal of the American Chemical Society. 2003;125:10420–10428. doi: 10.1021/ja030153x. [DOI] [PubMed] [Google Scholar]
- 59.Pervushin K, Riek R, Wider G, Wuthrich K. Proceedings of the National Academy of Sciences of the United States of America. 1997;94:12366–12371. doi: 10.1073/pnas.94.23.12366. [DOI] [PMC free article] [PubMed] [Google Scholar]
- 60.Mittermaier A, Meneses E. Methods in molecular biology (Clifton, NJ) 2013;1008:243–266. doi: 10.1007/978-1-62703-398-5_9. [DOI] [PubMed] [Google Scholar]
- 61.Hilser VJ, Thompson EB. Proc Natl Acad Sci USA. 2007;104:8311–8315. doi: 10.1073/pnas.0700329104. [DOI] [PMC free article] [PubMed] [Google Scholar]
- 62.Magalhaes MLB, Vetting MW, Gao F, Freiburger L, Auclair K, Blanchard JS. Biochemistry. 2008;47:579–584. doi: 10.1021/bi701957c. [DOI] [PMC free article] [PubMed] [Google Scholar]
- 63.Palmer AG, Kroenke CD, Loria JP. Nuclear Magnetic Resonance of Biological Macromolecules, Pt B. 2001;339:204–238. doi: 10.1016/s0076-6879(01)39315-1. [DOI] [PubMed] [Google Scholar]
- 64.Vallurupalli P, Bouvignies G, Kay LE. Journal of the American Chemical Society. 2012;134:8148–8161. doi: 10.1021/ja3001419. [DOI] [PubMed] [Google Scholar]


