Abstract
Over 20,000 rabies deaths occur annually in India, representing one-third of global human rabies. The Indian state of Tamil Nadu has pioneered a “One Health” committee to address the challenge of rabies in dogs and humans. Currently, rabies control in Tamil Nadu involves postexposure vaccination of humans after dog bites, whereas potential supplemental approaches include canine vaccination and sterilization. We developed a data-driven rabies transmission model fit to human rabies autopsy data and human rabies surveillance data from Tamil Nadu. Integrating local estimates for canine demography and costs, we predicted the impact of canine vaccination and sterilization on human health outcomes and evaluated cost-effectiveness according to the WHO criteria for India, which correspond to thresholds of $1,582 and $4,746 per disability-adjusted life-years (DALYs) for very cost-effective and cost-effective strategies, respectively. We found that highly feasible strategies focused on stray dogs, vaccinating as few as 7% of dogs annually, could very cost-effectively reduce human rabies deaths by 70% within 5 y, and a modest expansion to vaccinating 13% of stray dogs could cost-effectively reduce human rabies by almost 90%. Through integration over parameter uncertainty, we find that, for a cost-effectiveness threshold above $1,400 per DALY, canine interventions are at least 95% likely to be optimal. If owners are willing to bring dogs to central point campaigns at double the rate that campaign teams can capture strays, expanded annual targets become cost-effective. This case study of cost-effective canine interventions in Tamil Nadu may have applicability to other settings in India and beyond.
Keywords: mathematical modeling, cost-effectiveness, rabies, sterilization, vaccination
Rabies claims the lives of an estimated 59,000 people each year, over 20,000 of which are in India (1) primarily among children in rural or marginalized populations (2). Rabies is a classic “One Health” challenge (3): more than 99% of these deaths arise from exposure to a rabid dog (4). Vaccines exist to prevent canine rabies as do human vaccines, which are the primary component of postexposure prophylactic (PEP) regimens after a dog bite (5, 6). However, imperfect awareness (7) compounded by variable accessibility of PEP (8) has resulted in the persistence of human rabies fatalities. Although canine vaccination has the potential to curb rabies transmission to humans, it has generally been perceived as prohibitively expensive in India (9, 10). Here, we evaluate the effectiveness and cost-effectiveness of canine-focused rabies control programs as an approach for reducing human rabies in India as illustrated by a case study in the state of Tamil Nadu.
Tamil Nadu has pioneered the establishment of a One Health coordination committee, which brings together leaders from the human health, veterinary, and animal welfare sectors to develop rabies control strategies that transcend sectoral boundaries (11). If successful, this committee could set an example for effective rabies control throughout India. The state has also committed to the provision of PEP for all dog bite victims with suspected rabies exposure (11); in practice, PEP is only administered to victims of dog bite who present for medical care. From 2014 to 2015, the local Tamil Nadu government procured 551,664 vials of antirabies vaccine, which is able to provide 10 doses of the intradermal regimen or 1 dose of the intramuscular (i.m.) regimen, as well as 16,429 antirabies Ig vials (12). Nonetheless, 65 human rabies fatalities were reported in 2014 (12, 13). This reported mortality likely corresponds to an actual burden of about 80 deaths, given that only 80% of human rabies cases present with the characteristic “furious” symptoms and that the other 20% presenting as febrile and paralytic are generally misdiagnosed (2, 14), often as malaria (15). Despite the high prioritization of rabies control by zoonotic disease experts in India (16), policymakers have been reluctant to implement widespread canine rabies interventions without assessments of the balance between expenditure and effectiveness (17).
Canine rabies vaccination has eliminated canine rabies in the United States and Great Britain as well as controlled rabies throughout western Europe, South America, and regions of sub-Saharan Africa and Asia where it has been maintained at sufficient coverage (5, 18). Central point vaccination campaigns, where owners bring dogs to the vaccination team, have been shown to cost-effectively prevent human rabies death in the resource-constrained settings of Tanzania and Chad (19, 20), where PEP availability is unreliable. However, the cost-effectiveness of canine rabies vaccination has not been evaluated for India (21). Campaigns of combined stray canine vaccination and sterilization are advocated by the Animal Welfare Board of India as a humane intervention to control rabies (22–24). These campaigns have been effective in a few cities (23, 25, 26) but are not widespread. Additionally, with 42% of the canine population recorded as stray (27), measures that reduce the stray population have public support as an approach to address the thousands of dog bite incidents, both rabid and nonrabid, that occur annually in Tamil Nadu alone. However, such a combined strategy is more costly per dog than vaccination alone (9), and its cost-effectiveness as an approach to mitigate rabies has not been evaluated in any setting.
Here, we present a cost-effectiveness evaluation of rabies control strategies for India, predicting the impact of exclusive vaccination strategies as well combined strategies of canine vaccination and sterilization. To evaluate these strategies, we integrated a model of rabies transmission and canine demography within a framework of cost-effectiveness analysis parameterized by data from Tamil Nadu. We took into account both rabies mortality and dog bite morbidity in determining outcomes of disability-adjusted life-years (DALYs), a measure of health impact that ranges from zero (no health impact) to one (an entire year lost to death). We applied WHO criteria for cost-effectiveness, which define strategies as “very cost-effective” or “cost-effective” when they confer health benefits at a cost per DALY that is less than the per capita gross domestic product (GDP) of a country or three times the per capita GDP, respectively (28). Recognizing that organizations or policymakers could prefer to apply cost-effectiveness thresholds that differ from the WHO standards, we also evaluated the optimal strategy across a variety of thresholds. We found that a modest investment in a program of stray canine vaccination would be very cost-effective. If owners are willing to bring dogs to central point campaigns at higher rates than campaign teams can capture strays, expanded annual targets become cost-effective. Our finding that canine vaccination would be efficient in Tamil Nadu highlights the potential efficiency of canine interventions throughout India.
Results
The parameter set that achieved the closest model fit to human rabies mortality data included an R0 of 1.41 (95% confidence interval = 1.39–1.45) and a βh of 0.51 (0.44–0.56) (Table S1). Under the status quo of PEP administration and 34% rabies vaccination coverage in owned dogs, 3,028 (2,376–3,809) people were estimated to be exposed to rabies annually in Tamil Nadu, with an average of 82 (64–103) human deaths from rabies every year. In addition, we estimated that 31,102 (24,554–39,554) individuals are treated with PEP for dog bites annually. Our calculations indicate that the annual human health burden from rabies mortality and dog bite morbidity is 1,994 (1,545–2,590) DALYs within Tamil Nadu. In addition, the economic cost of human rabies prevention, which includes providing PEP, training health workers, surveillance, and promoting awareness, is $1.68 ($1.44–$2.29) million.
Table S1.
Epidemiological parameters for predictions
| Variable | Description | Base case | 95% Prediction interval* | Sensitivity range or scenarios | Source |
| 1/σ | Canine rabies incubation period (days) | 22.0 | 19.9, 24.8 | — | Ref. 32 |
| 1/α | Canine rabies infectious period (days) | 3.32 | 2.82, 3.35 | — | Ref. 32 |
| β | Canine rabies transmission rate | 0.426 | 0.423, 0.503 | — | Fit (Methods) |
| ε | Canine vaccine efficacy | 100% | — | 80% | Ref. 47 |
| ϕ | Canine intervention rate (dogs per year) | 0 | — | 100,000–500,000 | Control variable |
| η | Vaccination coverage in owned dogs before intervention | 0.34 | 0.33, 0.35 | — | Ref. 59, p. 26 |
| μ | Canine death rate (years−1) | 0.32 | 0.22, 0.38 | — | Ref. 54 |
| ♀ | Proportion of canine population that is female | 0.24 | — | 0.3; 0.4 | Ref. 27 |
| ♂ | Proportion of canine population that is male | 0.76 | — | 0.7; 0.6 | Ref. 27 |
| ρ | Annual pregnancy rate for female dogs | 0.475 | — | — | Ref. 54 |
| λ | Median litter size | 5 | — | — | Ref. 26 |
| KO | Carrying capacity, owned dogs (thousands) | 950 | — | 495; 660; 825; 1,155 | Ref. 27 |
| KS | Carrying capacity, stray dogs (thousands) | 700 | — | 1,155; 990; 825; 495 | Ref. 27 |
| x | Rabies reintroduction rate (rabid dogs per day) | 0.25 | — | 0; 0.125; 0.5 | Assumption |
| Human health outcomes | |||||
| βH | Humans bitten per rabid dog | 0.506 | 0.443, 0.566 | — | Ref. 32 |
| PEP | Historical PEP coverage† | 0.446 | 0.446, 0.513 | — | Ref. 59, table 17 |
| p(rab) | Probability of developing rabies without PEP | 0.159 | 0.156, 0.161 | — | Refs. 35 and 67 |
Variables without prediction interval use the base case value in all simulations.
Posterior distribution for historical (2003) PEP coverage is reported here for completeness. Because the state of Tamil Nadu has specific initiatives to improve PEP access, current PEP coverage values are assumed to be equivalent to current coverage with the diptheria-tetanus-pertussis vaccine (DTaP) (Table S3).
We evaluated the effectiveness as well as the cost-effectiveness of canine vaccination or combined strategies of vaccination and sterilization, with annual targets of 100,000–500,000 stray dogs, corresponding to 7–35% of the total canine population. In Tamil Nadu, females are only 24% of the canine population (27) because of higher mortality in females. We considered male sterilization, because it is included in the policies currently advocated by the Animal Welfare Board in India (24). Although combined strategies with and without male sterilization have different costs, the canine demographic and thus. epidemiological impacts are the same given that the canine birth rate is limited by female fertility (24).
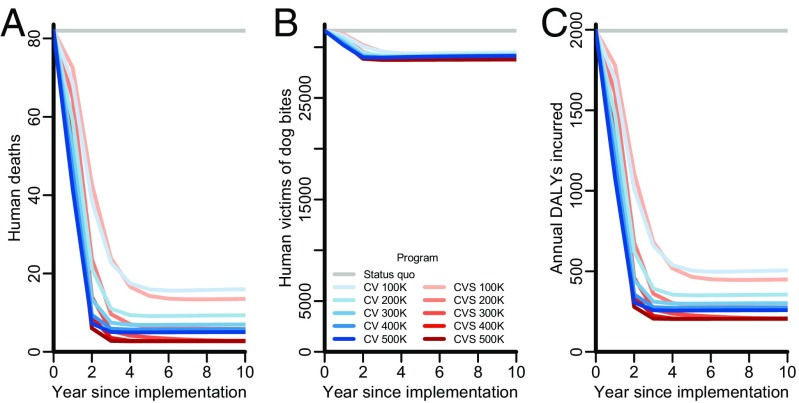
Canine vaccination and combined strategies differed in predictions of the extent to and speed at which rabies is controlled. An 88% reduction in annual rabies deaths (fewer than 10 deaths annually) by the fifth year of implementation was predicted for canine vaccination strategies with annual targets of 200,000 stray dogs, ∼13% of the overall canine population. We further predicted that a 92% reduction in human deaths (an estimated 6.4 deaths annually) could be achieved by combined strategies with the same annual target of 200,000 dogs (Fig. 1A). Rather than having a significant effect on population size (Fig. 1B and Fig. S1B), the primary epidemiological impact of sterilization arises from reduced turnover in the canine population, which increases the lifespan of vaccinated dogs. Expanding the target of combined strategies to 300,000 dogs per year was predicted to reduce human rabies by 95% within the fifth year of implementation, below four deaths annually. Using vaccination alone to achieve a similar reduction in human rabies, down to four deaths annually, is projected to require a target of 500,000 dogs.
Fig. 1.
Outcome measures of human health impact in Tamil Nadu for each year since implementation undiscounted. Rabies control strategies evaluated include maintenance of the status quo (gray lines), expanding targets of exclusive stray canine vaccination (CV; blue lines of progressively deeper shades), and expanding targets for combined stray canine vaccination and sterilization (CVS; red lines of progressively deeper shades). The epidemiological impact of canine vaccination and female sterilization is identical to the epidemiological impact of CVS. (A) Annual human rabies deaths. (B) Annual human victims of dog bites. (C) Annual DALYs incurred from both rabies mortality and dog bite morbidity for each year since implementation.
Fig. S1.
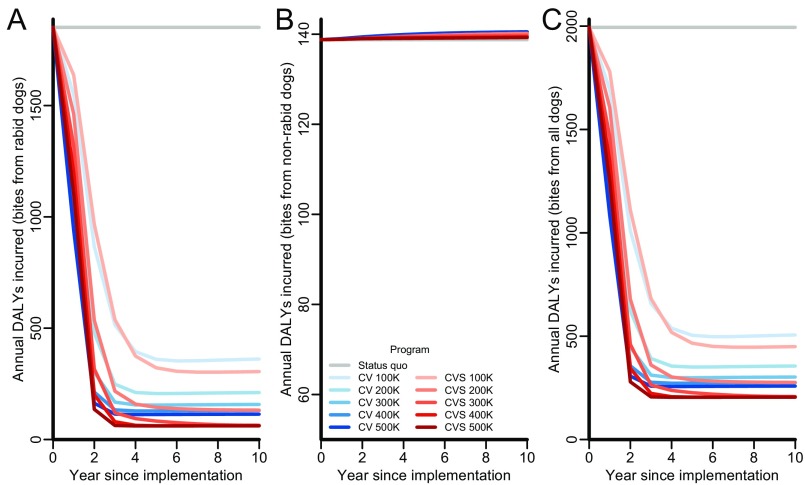
DALY components and total over time for the status quo (gray lines), expanding targets of exclusive canine vaccination (CV; blue lines of progressively deeper shades), and expanding targets of combined canine vaccination and sterilization (CVS; red lines of progressively deeper shades). In accordance with our assumptions, the epidemiological impact of canine vaccination and female sterilization is identical to the epidemiological impact of CVS. (A) Annual DALYs from rabid dog bites (both rabies morbidity and dog bite mortality), (B) annual DALYs from nonrabid dog bites, and (C) total annual DALYs.
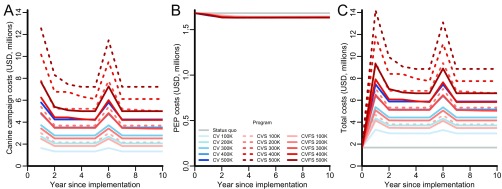
Stray capture canine vaccination at an annual target of 200,000 dogs or ∼13% coverage is estimated to cost $2.68 ($2.68–$2.68) million in the first year (Table S2), which includes $620,000 for the initial capital costs and $2.06 million for the annual operational expenditure (Fig. S2A). A combined strategy of stray canine vaccination and sterilization of both females and males with an annual target of 200,000 dogs is estimated to cost $5.40 ($5.39–$5.40) million in year 1, $1.70 million for capital costs, and $3.69 million for annual operational expenditure. If all dogs captured were vaccinated, but only females were sterilized, the costs for a program with the same target of 200,000 dogs decreased to $3.42 ($3.42–$3.42) million in year 1, $900,000 of which would be capital costs and $2.52 million of which would be operational expenditure.
Table S2.
Health, economic, and cost-effectiveness results for the base case
| Canine intervention | Annual target (dogs) | Cumulative canine intervention costs* ($US) | Cumulative PEP costs* ($US) | Cumulative total costs* ($US) | DALYs* | ICER* ($US per DALY) |
| Status quo | 0 | 0 | 14,341,778 | 14,341,778 | 17,008 | NA |
| CV | 100,000 | 11,894,017 | 14,064,424 | 25,958,440 | 6,090 | 1,064 |
| CVFS | 100,000 | 16,729,500 | 14,058,256 | 30,787,757 | 6,032 | Dominated |
| CV | 200,000 | 18,673,827 | 14,021,802 | 32,695,629 | 4,390 | 3,964 |
| CVS | 100,000 | 19,846,416 | 14,058,256 | 33,904,673 | 6,032 | Dominated |
| CVFS | 200,000 | 23,112,076 | 14,005,948 | 37,118,025 | 4,148 | Dominated |
| CV | 300,000 | 25,453,638 | 14,004,323 | 39,457,960 | 3,691 | 9,663 |
| CVFS | 300,000 | 31,975,814 | 13,976,308 | 45,952,122 | 3,340 | Dominated |
| CV | 400,000 | 32,233,448 | 13,994,568 | 46,228,016 | 3,299 | 17,300 |
| CVS | 200,000 | 34,570,416 | 14,005,948 | 48,576,364 | 4,148 | Dominated |
| CV | 500,000 | 39,013,258 | 13,988,247 | 53,001,505 | 3,045 | Dominated |
| CVFS | 400,000 | 39,823,800 | 13,959,046 | 53,782,846 | 3,007 | 25,869 |
| CVFS | 500,000 | 47,569,015 | 13,950,173 | 61,519,188 | 2,828 | 43,283 |
| CVS | 300,000 | 48,760,212 | 13,976,308 | 62,736,520 | 3,340 | Dominated |
| CVS | 400,000 | 60,296,928 | 13,959,046 | 74,255,973 | 3,007 | Dominated |
| CVS | 500,000 | 71,548,677 | 13,950,173 | 85,498,850 | 2,828 | Dominated |
CV, canine vaccination; CVS, canine vaccination and sterilization of males and females; CVFS, canine vaccination and female sterilization; NA, not applicable.
Cumulative over 10 y; discounted at 3% annually.
Fig. S2.
Annual rabies costs during intervention period in 2015 USD and undiscounted. (A) Costs of canine rabies interventions. (B) Cost of PEP administration. (C) Total costs (sum of A and B). Rabies programs evaluated include maintaining the status quo (PEP provision for 83% of rabid dog bite victims and 34% canine vaccination by owners; gray lines), exclusive canine vaccination (CV; blue lines of progressively deeper shades), combined canine vaccination and sterilization (CVS; red dashed lines of progressively deeper shades), or combined canine vaccination and female sterilization (CVFS; red solid lines of progressively deeper shades). (B) CVS and CVFS have identical epidemiological impact, and therefore, these strategies incur identical PEP costs.
In practice, PEP is used to treat all dog bites given the uncertainty regarding whether the dog in question was rabid. Consequently, the annual cost of providing PEP to bite victims of both rabid and nonrabid dogs is predicted to be $1.68 ($1.44–$2.29) million for Tamil Nadu under status quo rates of vaccination and PEP (Fig. S2B and Table S2). Approximately $1.03 million of this would be dedicated to program management and the training of healthcare workers in PEP delivery, $50,000 would be for treating rabid bites, and $600,000 would be for treating nonrabid bites. Canine rabies interventions can nearly eliminate the costs of rabid bites.
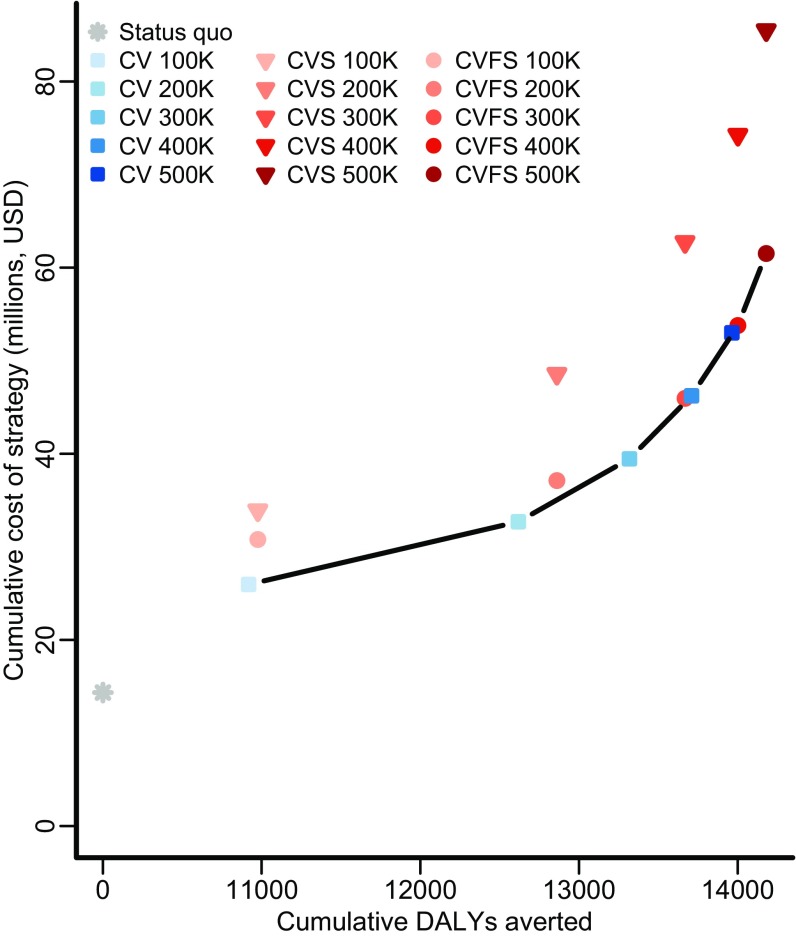
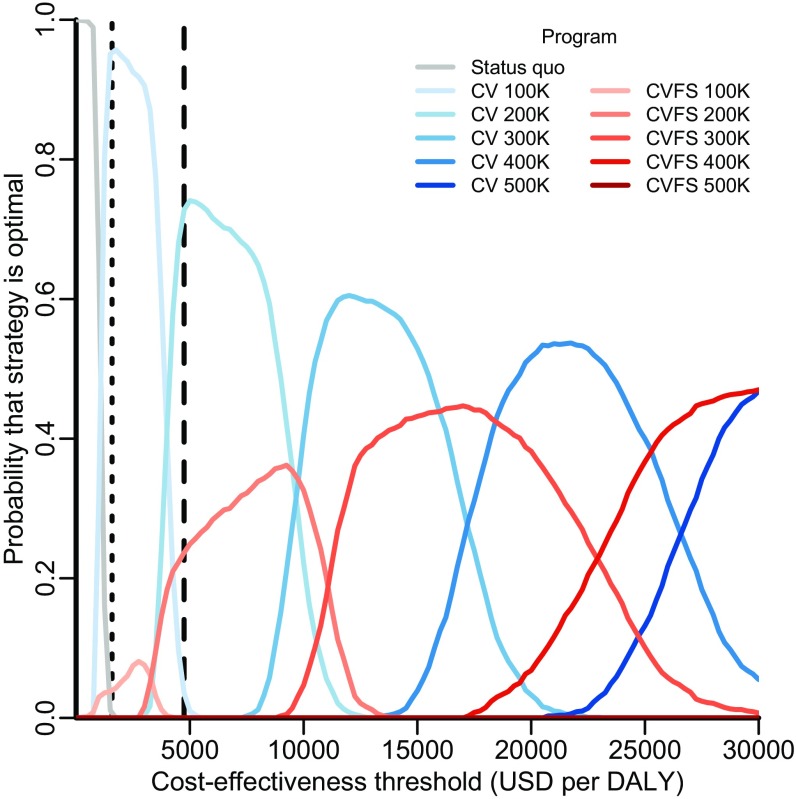
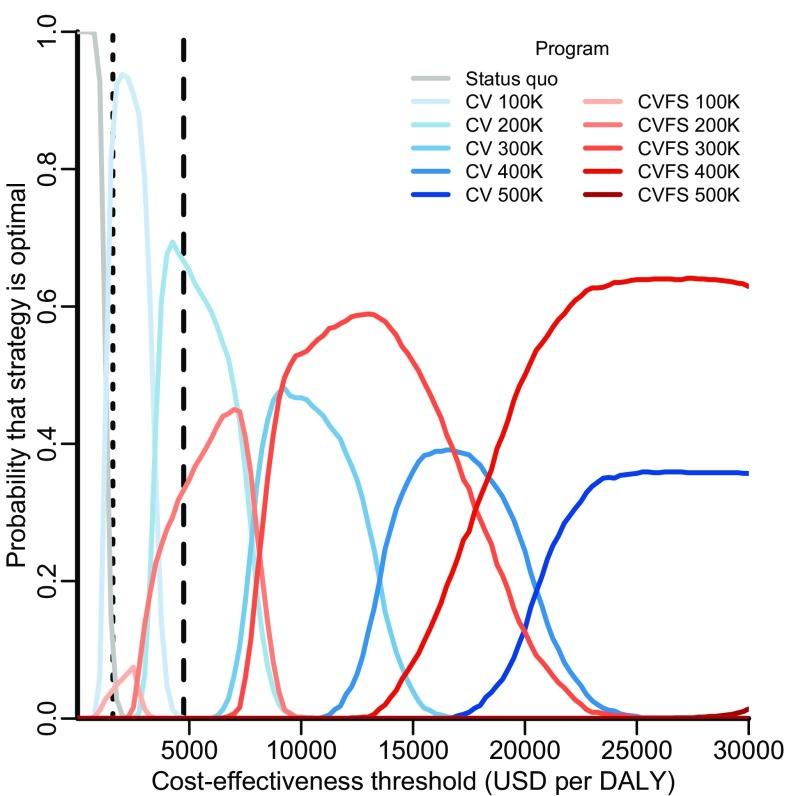
In the base case, seven strategies were found to be on the efficient frontier of the cost-effectiveness plane, meaning that no other strategy could avert more DALYs at a lower cost per DALY: status quo; canine vaccination at annual targets of 100,000, 200,000, 300,000, and 400,000 dogs; and combined canine vaccination and female sterilization at annual targets of 400,000 and 500,000 dogs (Fig. 2 and Table S2). Of these, an annual target of 100,000 dogs had an incremental cost-effectiveness ratio (ICER) of $1,064 ($814–$1,447) per DALY, and an annual target of 200,000 dogs had an ICER of $3,964 ($3,255–$4,853). According to WHO criteria, these strategies would be considered very cost-effective and cost-effective, respectively, and they would be the strategies that provide the greatest health benefit while maintaining an ICER below the cost-effective thresholds of $1,582 and $4,746 per DALY, respectively. When parameter uncertainty was incorporated, these annual targets were optimal at the WHO thresholds with 96% and 72% certainty, respectively (Fig. 3). Canine vaccination remained most likely to be optimal across cost-effectiveness thresholds ranging from $1,000 to $25,000 per DALY, beyond which combined strategies of vaccination and female sterilization became optimal. Thus, for any cost-effectiveness threshold above $1,400 per DALY, canine intervention is at least 95% likely to be optimal.
Fig. 2.
Cost-effectiveness plane. The cumulative present value cost (in 2015 USD; discounted at 3% annually) and the cumulative discounted DALYs averted (discounted at 3% annually) for four strategies: maintaining the status quo (PEP provision for 83% of rabid dog bite victims and 34% canine vaccination by owners; gray asterisk), expanding targets of exclusive stray canine vaccination (CV; blue squares of progressively deeper shades), expanding targets of combined stray canine vaccination and sterilization (CVS; red triangles of progressively deeper shades), and expanding targets of stray canine vaccination and female sterilization (CVFS; red circles of progressively deeper shades). Greater health benefits cannot be obtained at lower cost along the efficient frontier of strategies (black line).
Fig. 3.
Acceptability curves delineating the probability that a strategy is optimal. For each of 1,000 predictive simulations, only one strategy can be optimal at a given cost-effectiveness threshold—but that optimal strategy may vary from simulation to simulation as a consequence of sampling from parameter uncertainty. Each curve depicts the probability that a strategy would confer the greatest net health benefit across a range of cost-effectiveness thresholds, estimated by the proportion of simulations in which that strategy was optimal at each threshold. Rabies control strategies evaluated include maintenance of the status quo (gray line), expanding targets for stray canine vaccination (CV; blue lines of progressively deeper shades), and expanding targets for combined stray canine vaccination and female sterilization (CVFS; red lines of progressively deeper shades). Canine vaccination with sterilization of both males and females is never optimal and is not shown here. The vertical dotted and dashed lines indicate the WHO thresholds for very cost-effective and cost-effective strategies in India ($1,582 and $4,746 per DALY), respectively.
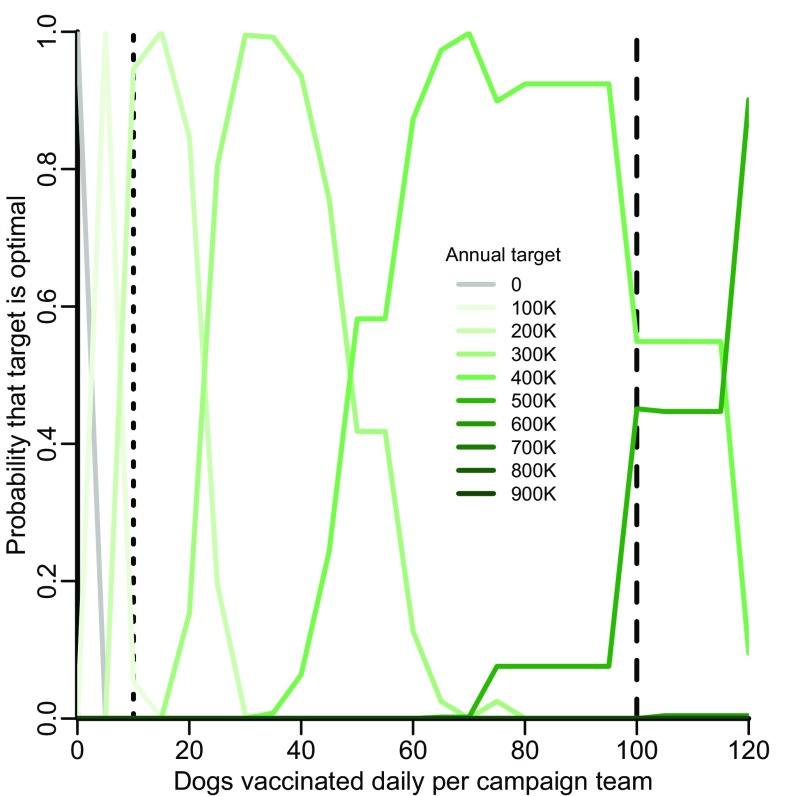
Mass canine vaccination campaigns in a number of settings require dogs to be brought by their owners to the vaccination teams, avoiding the costs of dog capture (29–31). If less time is spent catching dogs, campaign teams would be able to vaccinate more dogs each day, and annual targets could potentially be reached with less expense. Therefore, we considered how the optimal strategy is impacted by an increase in the daily number of dogs accessed by campaign teams. We found that an annual target of 200,000 dogs remains optimal when up to an average of 20 dogs is brought to campaign teams each day (Fig. S3). As more dogs are brought daily to campaign teams, higher targets become optimal. For example, an annual target of 400,000 dogs becomes optimal if an average of 100 dogs is brought daily to each campaign team. This annual target is estimated to cost $1.27 ($1.27–$1.27) million in the first year, including $120,000 of initial capital costs and $1.15 million for annual operational expenditure. At a central point annual target of 900,000 dogs, vaccinating nearly all owned dogs, first year costs would be $2.12 million, and annual operational costs would be $1.84 million. For these targets, human rabies is reduced to six and four annual deaths, respectively, by the fifth year.
Fig. S3.
Sensitivity analysis on the optimal target for central point vaccination campaigns given the daily number of dogs able to be vaccinated by the team. Acceptability curves delineate the probability that a strategy is optimal. For each of 1,000 predictive simulations, only one strategy can be optimal at a given daily rate—but that optimal strategy may vary from simulation to simulation as a consequence of sampling from parameter uncertainty. Each curve depicts the probability that a strategy would confer the greatest net health benefit across a range of daily rates estimated by the proportion of simulations in which that strategy was optimal at each rate. Rabies control strategies evaluated include maintenance of the status quo (gray lines) and expanding targets for owned canine vaccination (green lines of progressively deeper shades). The vertical dotted and dashed lines indicate the rate observed for stray capture campaigns elsewhere in India and the central point rate observed in Malawi (10 and 100 dogs vaccinated daily), respectively.
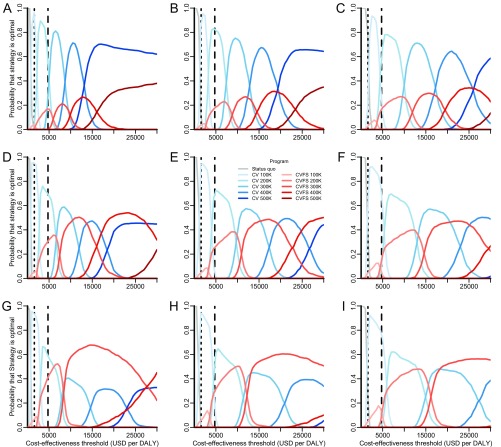
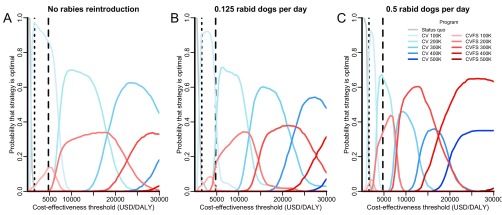
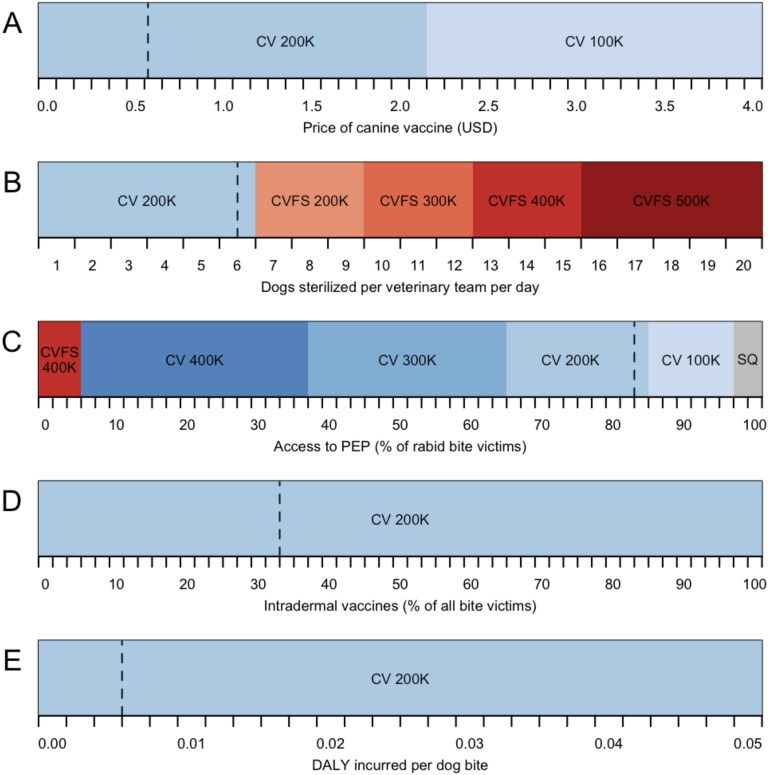
We evaluated the sensitivity of optimal targets for stray canine vaccination to several factors, including discount rate, timeframe, rabies reintroduction, DALYs incurred because of dog bites, PEP access, and the price of the canine vaccine. We found that variation in discount rate or timeframe has minimal impact at the WHO cost-effectiveness thresholds (Fig. S4). Canine vaccination remained most likely to be optimal across a wide range of plausible reintroduction rates, although the optimal target at the WHO threshold for cost-effective strategies was lower in the scenario with no rabies reintroduction. However, combined strategies of vaccination and sterilization would be optimal if both the cost-effectiveness threshold and the rabies reintroduction rate were together higher (Fig. S5). Specifically, if rabies is reintroduced at a rate of 0.5 rabid dogs per day, double the base case, a combined strategy with an annual target of 300,000 dogs becomes optimal at a cost-effectiveness threshold of $9,000 per DALY, which is much lower than the $25,000 per DALY threshold at which these strategies switch for the base case. Approximately doubling the dog to human bite rate, βh, beyond our empirical estimate had a similar effect as raising the reintroduction rate (Fig. S6). The optimality of strategies at the cost-effectiveness thresholds remained robust to a reduction in canine vaccine to 80% (as has been suspected for the vaccine used in Tamil Nadu) instead of the 100% efficacy observed for canine vaccines elsewhere (Fig. S7). The optimal strategy was also insensitive to variation in the price of the canine vaccine within the range from $0 to $2.10 per dose (Fig. S8A), because campaign and administration costs are more substantial. However, the optimal annual target would drop to 100,000 dogs if the price of the canine vaccine rose from the base case of $0.57 to above $2.10 per dose. Optimal targets were highly sensitive to the efficiency of the sterilization team, with combined strategies of vaccination and female sterilization becoming optimal if the average number of female dogs sterilized daily per veterinary team could be increased (Fig. S8B).
Fig. S4.
Sensitivity of strategy optimality to discount rate and timeframe. The probability that each strategy is optimal across a range of cost-effectiveness thresholds was evaluated for combinations of annual discount rates of (A, D, and G) 1%, (B, E, and H) 3%, and (C, F, and I) 5% and timeframes of (A–C) 5 y, (D–F) 10 y, and (G–I) 20 y. Rabies programs evaluated include maintenance of the status quo (gray lines), expanding targets for exclusive canine vaccination (CV; blue lines of progressively deeper shades), and expanding targets of combined canine vaccination and female sterilization (CVFS; red lines of progressively deeper shades). Canine vaccination with sterilization of both males and females is never optimal and is not shown here. The vertical dotted and dashed lines indicate the WHO thresholds for very cost-effective and cost-effective strategies in India ($1,582 and $4,746 per DALY), respectively.
Fig. S5.
Sensitivity of strategy optimality to rabies reintroduction rate. The probability that each strategy is optimal across a range of cost-effectiveness thresholds was evaluated for rabies reintroduction rates from 0 (A), 0.125 (B), and 0.5 (C) rabid dogs per day in the entire state of Tamil Nadu (current canine population size of 1.5 million dogs). Rabies programs evaluated include maintenance of the status quo (gray lines), expanding targets of exclusive canine vaccination (CV; blue lines of progressively deeper shades), and expanding targets of combined canine vaccination and female sterilization (CVFS; red lines of progressively deeper shades). Canine vaccination with sterilization of both males and females (CVS) is never optimal and is not shown here. The vertical dotted and dashed lines indicate the WHO thresholds for very cost-effective and cost-effective strategies in India ($1,582 and $4,746 per DALY), respectively.
Fig. S6.
Sensitivity of strategy optimality to rabid dog to human bite rate. The probability that each strategy is optimal across a range of cost-effectiveness thresholds was evaluated for an alternative assumption regarding missing contact tracing data on rabid dog outcomes yielding an estimate of 0.99 bites per rabid dog (base case: empirical estimate of 0.51) (a detailed explanation is in SI Text). Rabies programs evaluated include maintenance of the status quo (gray lines), expanding targets of exclusive canine vaccination (CV; blue lines of progressively deeper shades), and expanding targets of combined canine vaccination and female sterilization (CVFS; red lines of progressively deeper shades). Canine vaccination with sterilization of both males and females is never optimal and is not shown here. The vertical dotted and dashed lines indicate the WHO thresholds for very cost-effective and cost-effective strategies in India ($1,582 and $4,746 per DALY), respectively.
Fig. S7.
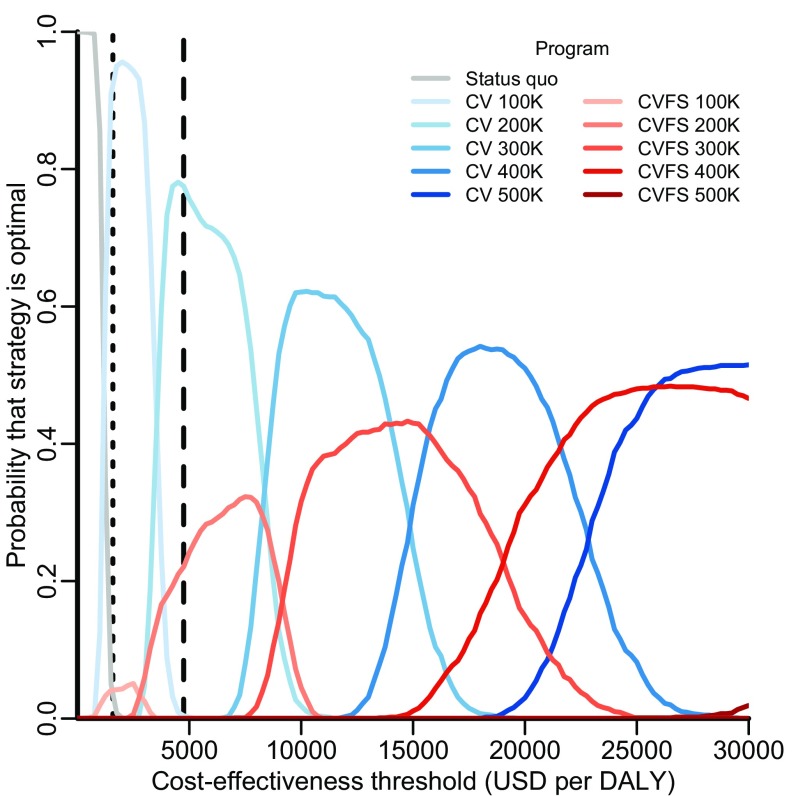
Sensitivity of strategy optimality to canine vaccine efficacy. The probability that each strategy is optimal across a range of cost-effectiveness thresholds was evaluated for an alternative canine vaccine efficacy of 80% (base case: 100% vaccine efficacy). Rabies programs evaluated include maintenance of the status quo (gray lines), expanding targets for canine vaccination alone (CV; blue lines of progressively deeper shades), and expanding targets for combined canine vaccination and female sterilization (CVFS; red lines of progressively deeper shades). Canine vaccination with sterilization of both males and females is never optimal and is not shown here. The vertical dotted and dashed lines indicate the WHO thresholds for very cost-effective and cost-effective strategies in India ($1,582 and $4,746 per DALY), respectively.
Fig. S8.
One-way sensitivity analysis of key economic parameters: (A) price of the canine vaccine; (B) number of sterilizations per day that a veterinary team has the capacity to perform; (C) access to PEP; (D) percentage of bite victims receiving intradermal (vs. i.m.) vaccines; (E) DALYs incurred per dog bite. Shading indicates the optimal program for a particular parameter combination. Rabies programs evaluated include maintenance of the status quo (SQ; gray areas), expanding targets of exclusive canine vaccination (CV; blue areas of progressively deeper shades), and expanding targets of combined canine vaccination and female sterilization (CVFS; red areas of progressively deeper shades). The optimal target within each area is stated in the text, and dashed lines indicate the empirically estimated base case value for the parameter.
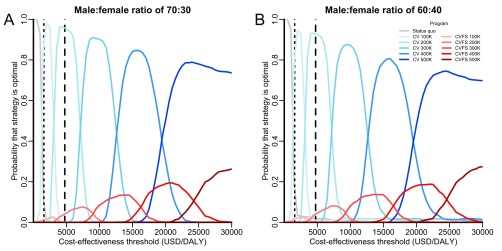
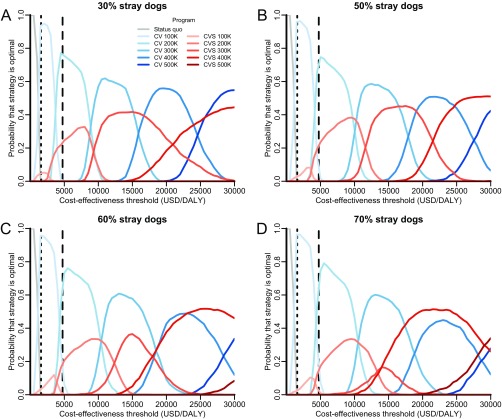
Model predictions were robust to changes in the canine demographic parameters. For example, as the proportion of females is increased from the 24% that has been recorded in the region (27), combined programs of vaccination and female sterilization would become increasingly expensive to execute without much improvement in effectiveness, and there would be greater certainty in the optimality of vaccination-only campaigns (Fig. S9). Across stray dog proportions ranging from 30 to 70%, the optimal targets at the WHO cost-effectiveness thresholds are robust for both central point and stray capture campaigns. However, at higher thresholds for cost-effectiveness, such as $10,000 per DALY, we find that certainty in the optimal annual target for central point vaccination campaigns decreases as the proportion of stray dogs increases (Fig. S10). For stray capture campaigns, combined strategies of vaccination and sterilization are more likely to be optimal at high cost-effectiveness thresholds when a larger proportion of the canine population is stray. As an example, vaccination campaigns are optimal at the $20,000 per DALY threshold if 42% of the canine population are stray, but combined vaccination and sterilization strategies would be optimal if 70% of the canine population are stray.
Fig. S9.
Sensitivity of strategy optimality to sex ratio in the canine population. The probability that each strategy is optimal across a range of cost-effectiveness thresholds was evaluated for scenarios where females make up 30% (A) and 40% (B) of the canine population (base case: empirical estimate of 24%). Rabies programs evaluated include maintenance of the status quo (gray lines), expanding targets of exclusive canine vaccination (CV; blue lines of progressively deeper shades), and expanding targets of combined canine vaccination and female sterilization (CVFS; red lines of progressively deeper shades). Canine vaccination with sterilization of both males and females (CVS) is never optimal and is not shown here. The vertical dotted and dashed lines indicate the WHO thresholds for very cost-effective and cost-effective strategies in India ($1,582 and $4,746 per DALY), respectively.
Fig. S10.
Sensitivity of strategy optimality to the percentage of dogs that are stray. The probability that each strategy is optimal across a range of cost-effectiveness thresholds was evaluated for 30% (A), 50% (B), 60% (C), and 70% (D) stray dogs (base case: 42%). Rabies programs evaluated include maintenance of the status quo (gray lines), expanding targets for canine vaccination alone (CV; blue lines of progressively deeper shades), and expanding targets for combined canine vaccination and female sterilization (CVFS; red lines of progressively deeper shades). Canine vaccination with sterilization of both males and females (CVS) is never optimal and is not shown here. The vertical dotted and dashed lines indicate the WHO thresholds for very cost-effective and cost-effective strategies in India ($1,582 and $4,746 per DALY), respectively.
We found that the optimality of annual targets was robust to PEP access within the range from 64 to 84% (Fig. S8C). If PEP access ranges from 34% to 64%, which is the case for other settings in India, the optimal target would rise to 300,000 dogs, and if PEP access falls between 6% and 34%, the optimal target would rise further to 400,000 dogs. If PEP access drops below 6%, the optimal strategy switched to a combined strategy of vaccination and female sterilization, with an annual target of 400,000 dogs. By contrast, the optimal strategy was insensitive to changes in the proportion of patients receiving intradermal vaccines vs. the more expensive i.m. vaccines (Fig. S8D) or plausible variation in the DALY incurred per dog bite (Fig. S8E).
In the base case, we assume that PEP administration practices would not change for nonrabid dogs bite victims. However, because canine vaccination reduces the risk of rabies, communication between physicians and veterinarians regarding the true risk to victims could reduce wasteful PEP allocation. Specifically, if 50% of nonrabid bite injuries could be identified as such, and unnecessary PEP, therefore, is not administered to these bite victims, $300,000 could be saved annually in Tamil Nadu. We further predicted that, if these savings were allocated to expand owner-driven central point campaign targets from the base case optimum of 400,000 dogs to an annual target of 600,000 dogs, 21 additional lives would be saved over 10 y in Tamil Nadu. As an additional comparison, we calculated the health impact of shifting the entire current budget for PEP to canine vaccination, a cost-neutral change. If the entire amount of $1.7 million spent annually on PEP was instead dedicated to owner-driven central point vaccination campaigns, these campaigns could achieve the vaccination of 700,000 dogs per year and reduce annual human deaths to 24, a 70% reduction.
Discussion
In this cost-effectiveness analysis for rabies control in India, we found that canine vaccination is more efficient than combined vaccination and sterilization. This finding is counter to the combined strategy advocated by the Animal Welfare Board of India (24) and currently implemented in Jaipur. With a target of 200,000 stray dogs vaccinated annually, canine vaccination is predicted to cost-effectively control rabies in Tamil Nadu. However, we also found that, if owners are willing to bring their dogs to the vaccination teams, central point vaccination campaigns could more efficiently achieve rabies control than stray capture strategies. Although the optimal campaign style or strategy type may depend on operational parameters, it is clear across a range of plausible parameters and assumptions that canine interventions are an efficient method for the control of human rabies in Tamil Nadu.
An annual vaccination target of 200,000 stray dogs corresponds to ∼13% of the canine population, which is highly feasible to implement in Tamil Nadu and other settings in India. Showing that an effective rabies control strategy is both cost-effective and feasible is paramount to the decision of policymakers to implement the program. The 70% coverage recommended by the WHO globally as well as targets recommended in sub-Saharan Africa (19, 20) deterred rather than inspired the implementation of such policies in India as a result of perceived infeasibility. As elaborated below, a combination of factors underlies the efficiency of the lower target for Tamil Nadu: first, the relatively low transmissibility of rabies in Tamil Nadu; second, the success of the state’s PEP program; and third, the expense of catching stray dogs.
First, we estimated the reproductive number R0 of rabies in Tamil Nadu to be 1.41, implying that a single rabid dog will infect 1.41 additional dogs in the absence of intervention, consistent with values observed in other contexts (32–34). This low transmissibility corresponds to a critical threshold of vaccination coverage less than 30%. Although this coverage is higher than the status quo, it can nonetheless be feasibly reached and sustained with a modest intervention.
Second, Tamil Nadu has made a commitment to provide PEP for dog bite victims (11), and PEP is a remarkably efficient and life-saving intervention (35, 36). Despite the availability of PEP in Tamil Nadu, human rabies deaths continue to occur in the state. Given that the ICER measures the marginal benefit of adding additional interventions beyond the status quo program of PEP, the ICERs of canine intervention will be more favorable in regions where PEP is less available. For example, fewer than one-half of bite victims completed a PEP regimen in the neighboring state of Karnataka (37). As our sensitivity analysis shows, lower PEP accessibility translate to higher optimal annual targets (i.e., the ICER for canine interventions becomes more favorable as status quo mortality burden of rabies rises).
Third, using personnel to catch stray dogs is more expensive than having owners bring dogs to a central location. Central point vaccination campaigns have been successful in sub-Saharan Africa and Latin America (6, 29, 30). Our scenario analyses indicated that, if owners are willing to bring their dogs to the campaign team, a higher annual target for canine vaccination becomes optimal. For example, the optimal annual target increases from 200,000 to 300,000 dogs if a daily average of 25 dogs can be accessed per vehicle. An alternative operational plan might involve interspersing days dedicated to owner-driven central point vaccination with those dedicated to stray capture. Although there is evidence that owner participation may be much less viable in India than elsewhere (38, 39), our results nonetheless suggest that central point vaccination campaigns deserve additional piloting and evaluation in India, with assessment of costs and owner participation rates.
The greater impact on rabies of the combined strategy for a given annual target is driven not by a reduction in the stray population through sterilization, which is only minimal, but by two epidemiological factors. First, sterilization dampens canine population turnover, such that fewer dogs need be vaccinated to maintain a specific vaccination coverage. Second, dogs can be inefficiently revaccinated annually in vaccination campaigns but not in combined campaigns, because the latter involves veterinary staff qualified to permanently mark the dogs. In our base case, these benefits are not sufficient to justify the costs incurred by surgical sterilization. However, canine immunocontraceptives currently under development (40) may dramatically reduce sterilization costs (9). Our sensitivity analysis highlights that even a small improvement in the speed and efficiency of canine sterilization would make combined strategies of vaccination and female sterilization optimal.
Combined strategies may be optimal under specific circumstances, potentially the combination of higher cost-effectiveness thresholds than recommended by the WHO and another plausible scenario (for example, if either rabies reintroduction rate or the dog to human bite rate was double their base case estimates). In these cases, focusing sterilization efforts exclusively on female dogs is clearly more efficient compared with strategies in which males are also sterilized. Although it is straightforward that a campaign that incurs the costs of male sterilization without providing any demographic or epidemiological benefit would be less efficient than an equivalent campaign that only sterilized females, we included this strategy in our analysis, because it is currently standard procedure in urban campaigns throughout India. The standard operating procedure for canine vaccination and sterilization campaigns distributed by the Animal Welfare Board of India states that limited resources should be directed primarily to the sterilization of females (24). However, veterinary teams are compensated equally for the sterilization of male and female dogs, and male sterilization is simpler than female sterilization. Consequently, there is a misalignment between compensation incentives of individual practitioners and optimal policies from a societal perspective. Our analysis shows the significant cost savings that could be achieved by an intervention that exclusively sterilizes females. These savings may be particularly large for Tamil Nadu, where females are estimated to be only one-quarter of the canine population (27). If the decision is made to implement sterilization, we would recommend the design of an incentive structure for campaign teams and veterinarians that prioritizes female sterilization.
We conducted sensitivity analyses on the proportion of stray dogs, because the statewide estimate of 42% is subject to empirical uncertainty. This uncertainty arises from potential heterogeneity between villages, fluidity in the definition of dog ownership in India, and lack of independent validation. Our sensitivity analyses showed that, at WHO-recommended cost-effectiveness thresholds, the efficiency of the optimal annual targets is robust across the range considered of 30–70% compared with 42%. At higher cost-effectiveness thresholds, decisions become somewhat more sensitive to the proportion of stray dogs. Specifically, at the $20,000 per DALY threshold, the optimal strategy remains vaccination of 400,000 dogs annually from 30 to 60% stray dogs, switching to a combined strategy of vaccination and sterilization targeting 400,000 dogs annually at 70% stray dogs. Thus, if Tamil Nadu is willing to invest in canine vaccination significantly beyond the targets suggested by the WHO cost-effectiveness criteria, it would be ideal to verify the proportion of stray dogs with ecological mark and recapture canine studies, which have been conducted in Tanzania (41).
In the first year, the full benefits of canine intervention for human health have yet to be realized. However, capital costs must be invested in the first year, leading to relatively high cost-effectiveness ratios for canine vaccination programs in the first year. In the years proceeding initial investment, with lower annual costs and full realization of the impact on incidence, cost-effectiveness ratios based on cumulative costs and DALYs averted become more favorable. In accordance with Generally Accepted Accounting Principles, the international standards adopted by government agencies in India as well as many other countries, we took into account that capital costs are expected to be incurred every 5 y (42). Consequently, this pattern of 1 y of high cost-effectiveness ratios followed by 4 y of lower cost-effectiveness ratios repeats over time.
Models of rabies for China and sub-Saharan Africa have predicted the effectiveness (33, 34, 43) and efficiency (19, 20, 44) of annual vaccination campaigns, the success of which has been borne out in practice (30, 45). Given differences between counties, particularly regarding canine demographics and campaign cost structure, it is important to tailor evaluations of rabies control programs to specific settings. Our model considers rabies programs in one Indian state. In particular, we find that the balance of local availability of PEP, the status quo vaccination coverage in owned dogs, and the specific costs of interventions together determine the optimality of more modest and hence, highly feasible targets for Tamil Nadu than other settings.
For the base case, we assumed perfect protection and lifelong immunity from rabies after vaccination, consistent with canine challenge experiments and longitudinal studies, albeit that they were conducted for up to 3 y (46, 47), which approximates the average canine lifespan in India (26). However, there is speculation that locally manufactured vaccines in Tamil Nadu are less efficacious. Nevertheless, we found that the optimal strategy is robust to a reduction in vaccine-mediated protection arising from either lower initial efficacy or waning efficacy.
Given that our analysis was conducted from the perspective of the state government in Tamil Nadu, which provides the interventions, there are additional positive externalities that we conservatively did not incorporate. For instance, additional economic costs are incurred by individuals because of travel and lost income for those seeking PEP treatment as well as from the loss of livestock after attacks from rabid dogs (1). Rabies also provides a challenge for species conservation as evidenced by rabies outbreaks that decimated populations of spotted deer in India (48–50). Our analyses were also conservative with respect to the morbidity associated with dog bite wounds and trauma, especially among children. Additionally, sterilization campaigns have been shown to improve the wellbeing of sterilized dogs and other dogs in the community (51). A societal perspective that encompassed these wider costs and benefits would be expected to judge canine interventions as even more favorable, likely justifying additional expansion of intervention targets.
Despite a commitment to PEP, rabies will continue to threaten human life if unabated in canine populations. Coordination between different sectors of state government will be fundamental to the successful control of rabies in Tamil Nadu specifically and India more broadly. Insofar as rabies control improves human health and reduces medical costs, the benefits accrue primarily in the human health sector. However, canine interventions will require the participation, expertise, and resources of the Department of Animal Husbandry Dairying & Fisheries and the Animal Welfare Board of India, neither of which have a mandate or funding to address human health challenges. Tamil Nadu is the first state in India to establish a coordination One Health committee to address rabies (11). Our analysis underscores the potential synergy of such cooperation by showing that the positive externality of canine interventions is both effective and cost-effective from the perspective of reducing human rabies alone. We find potential for additional efficiencies if agency-level coordination could be duplicated at the provider level, with local doctors and veterinarians communicating about the true risk of rabies exposure posed by a particular dog, thereby reducing PEP wastage. We also find that human rabies can be virtually eliminated with a much more moderate investment than anticipated (9). Furthermore, the successful implementation of canine vaccination in Tamil Nadu could serve as an example of cost-effective rabies control for similar settings within and beyond India.
Methods
We developed a compartmental model of canine demography and rabies transmission parameterized with empirical data from Tamil Nadu and India. We compared three rabies control approaches: (i) vaccination only, (ii) combined strategies of vaccination and sterilization, and (iii) combined strategies of canine vaccination and sterilization for females only. We evaluated these approaches across a range of intervention magnitudes, with strategies focused primarily on captured stray dogs in the base case and then extended to evaluate owner-driven mass vaccination campaigns. The costs of interventions and PEP were inflated from their valuations in earlier years to 2015 Indian rupees (INRs) and then converted to 2015 US dollars (USDs) at the 2015 exchange rate of 66.768 INRs to 1 USD (52). We evaluated the health impact of rabies mortality and dog bite morbidity in terms of DALYs, a metric that scores an individual’s health in a given year across the range from zero (death) to one (perfect health). We predicted the costs and benefits that were likely to accrue from the state government perspective over 10 y assuming a standard 3% annual discount rate in the base case. We applied the WHO-recommended threshold for cost-effectiveness, which deems strategies very cost-effective or cost-effective when they confer health benefits at cost per DALY that is less than the per capita GDP of a country or three times the per capita GDP, respectively (28). For India, the 2015 thresholds were $1,582 per DALY and $4,746 per DALY, respectively (53). In alternative scenarios, we varied both the discount rate (1–3%) and the timeframe (5–20 y).
Epidemiological and Demographic Model.
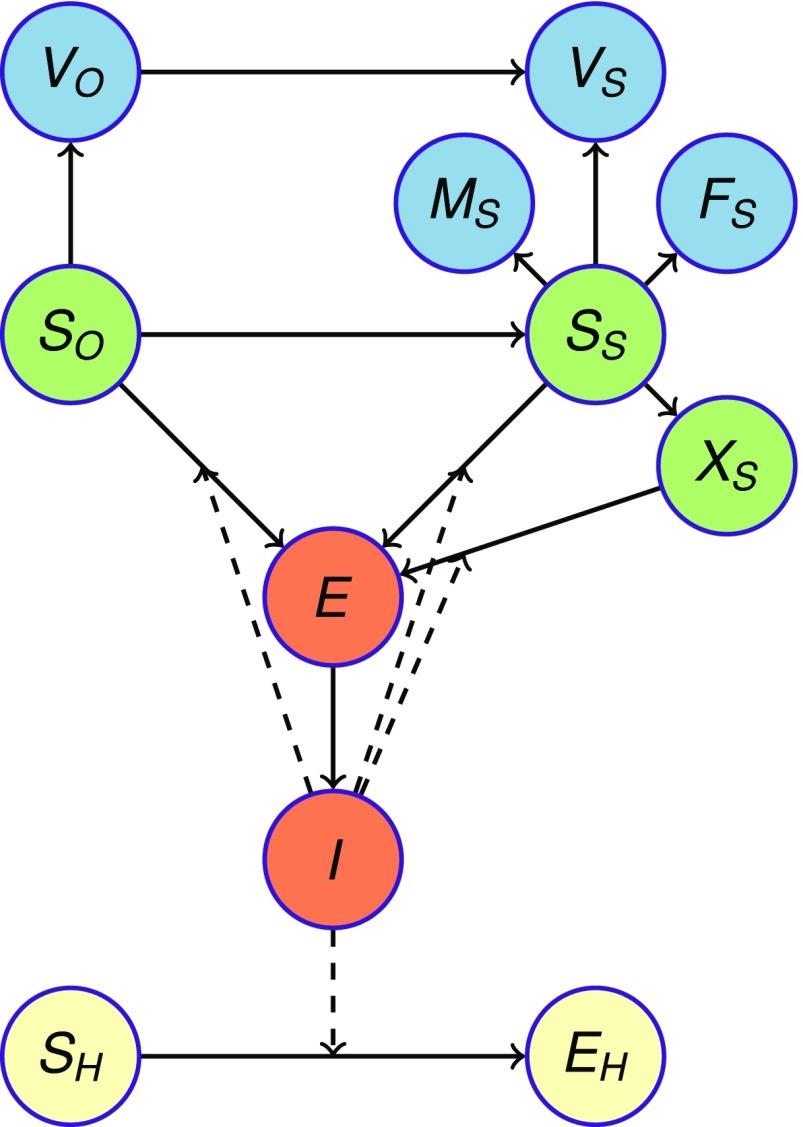
The Tamil Nadu canine population of ∼1.5 million dogs was stratified into 58% owned and 42% stray strata according to canine census data from Tamil Nadu (27) (Fig. 4 and SI Text). Immunologically, dogs were classified as either susceptible or vaccinated. Within the stray stratum, dogs were additionally classified as sterilized males, sterilized females, or unsterilized (Fig. 4). Susceptible dogs could become infected with rabies, whereupon they enter a latent phase and then progress to infectious. Infectious dogs did not recover, because rabies is inevitably fatal. Humans became exposed to rabies through bites from an infectious dog. In the base case, the canine rabies vaccine was assumed to elicit complete and lifelong protection, consistent with empirical studies (54). In a scenario analysis, we evaluated a canine vaccine at only 80% efficacy, such as has been suspected for the rabies vaccine produced in Tamil Nadu, which could arise either from lower initial efficacy or waning. Also in the base case, we assumed a steady rabies reintroduction rate of 0.25 rabid dogs per day into the infectious compartment (SI Text) based on the average distance between primary and secondary rabid dog infections and the geography of Tamil Nadu (SI Text).
Fig. 4.
Compartmental model structure. The Tamil Nadu canine population of ∼1.5 million dogs was stratified into owned and stray strata. Within the stray stratum, dogs were classified as neither sterilized nor vaccinated (SS), vaccinated but unsterilized (VS), sterilized and vaccinated males (MS), sterilized and vaccinated females (FS), or sterilized but immunologically susceptible females (XS), the result of vaccine failure. Sterilized but immunologically susceptible males are identical to dogs in the SS class. Owned dogs were classified as either susceptible (SO) or vaccinated (VO). Unvaccinated dogs can become infected with rabies, whereupon they enter a latent phase (E) and then, progress to infectious phase (I). Infectious dogs do not recover, because rabies is inevitably fatal. Humans (SH) become exposed to rabies (EH) through bites from an infectious dog. Vaccine-protected canine epidemiological states are blue, and all other canine states are green. Human epidemiological states are yellow. Solid arrows indicate the transition of individuals between compartments, and dashed arrows represent rabies transmission.
Stray dogs were all susceptible at birth, but an empirically parameterized proportion of owned dogs was born into the vaccinated class, with the remainder susceptible. Stray dogs were subject to a constant death rate as well as a density-dependent death rate that increases as the stray population reaches its carrying capacity according to the Verhulst logistic equation (55). Additionally, we assumed that owned dogs would become stray as the former reached its carrying capacity, with dogs maintaining their epidemiological status. The differential equations underlying the model (Dataset S1) were solved in continuous time in R (56) with the package deSolve (57). Code is available on request.
Parameters, Fitting, and Predictions.
Canine demographic and rabies natural history parameters were drawn from published literature (SI Text and Table S3). Using Bayesian Markov Chain Monte Carlo procedures (58), we estimated the dog to dog transmission rate βd and the dog to human bite rate βh for Tamil Nadu, specifying flat priors over plausible domains. We constructed the likelihood function to evaluate the probability of the 2014 reported human rabies mortality data and the probability of the 2005 autopsy data using binomial and Poisson distributions around model simulations for the years 2014 and 2005, respectively, and a normal distribution around βh (SI Text):
Table S3.
Prior distributions for epidemiological parameters
| Variable | Description | Prior distribution or base case value* | Source |
| 1/α | Canine rabies incubation period (days) | N (3.1, 0.128) | Ref. 32 |
| β | Canine rabies transmission rate | Uninformative | — |
| ε | Canine vaccine efficacy | 100% | Ref. 47 |
| η | Vaccination coverage in owned dogs before intervention | β (2,879, 5,621) | Ref. 59, p. 26 |
| μ | Canine death rate (years−1) | N (0.3, 0.04) | Ref. 54 |
| 1/σ | Canine rabies infectious period (days) | N (22.3, 1.28) | Ref. 32 |
| ♀ | Proportion of canine population that is female | 0.24 | Ref. 27 |
| ♂ | Proportion of canine population that is male | 0.76 | Ref. 27 |
| ρ | Annual pregnancy rate for female dogs | 0.475 | Ref. 54 |
| λ | Median litter size | 5 | Ref. 26 |
| KO | Carrying capacity, owned dogs | 950,000 | Ref. 27 |
| KS | Carrying capacity, stray dogs | 700,000 | Ref. 27 |
| x | Rabies reintroduction rate (rabid dogs per day) | 0.25 | Assumption |
| Human health outcomes | |||
| βH | Humans bitten per rabid dog | N (0.51, 0.03) | Ref. 32 |
| PEP | Historical PEP coverage | β (439, 477) | Ref. 59, table 17 |
| ω1 | Probability of bite to head or neck | Mult (3,882, ω = 0.0178) | Ref. 67 |
| ω2 | Probability of bite to upper extremity | 0.3150 | Ref. 67 |
| ω3 | Probability of bite to trunk | 0.0242 | Ref. 67 |
| ω4 | Probability of bite to lower extremity | 0.6430 | Ref. 67 |
| p1 | Probability of rabies given bite to head or neck | 0.55 | Ref. 35 |
| p2 | Probability of rabies given bite to upper extremity | 0.22 | Ref. 35 |
| p3 | Probability of rabies given bite to trunk | 0.09 | Ref. 35 |
| p4 | Probability of rabies given bite to lower extremity | 0.12 | Ref. 35 |
Variables without distributions use base case values throughout model fitting. Mult, multinomial distribution.
where h = 65, the number of 2014 cases reported in Tamil Nadu; k = 3 and n = 6,264 parameterize the historical Tamil Nadu human rabies mortality from a regional autopsy study (2); and μ = 0.51 and σ = 0.03 are the mean and the variance of the bite rate, respectively, estimated from Tanzanian contact-tracing data (20, 32, 33). The parameters λ and p represent the model estimates for human rabies under current and historical PEP coverage, respectively, and q represents the model estimate for the dog to human bite rate. From hy, the annual human rabies deaths predicted by the model for the year y, λ = 0.8h2014 to account for the underreporting of the typically misdiagnosed “nonfurious” human rabies cases (2, 14), and P = 0.8h2004/d, where d = 495,378, the overall annual mortality in Tamil Nadu.
In 2005, the state government of Tamil Nadu committed to making PEP available for all dog bite victims at health clinics. For model simulations of the human rabies burden in 2005, also the year in which the autopsy studies were conducted (2), we assumed that the commitment had not yet been fully enacted and specified a prior distribution for PEP coverage with a mean of 48% (Table S3) based on national surveys conducted in 2003 (59). Despite the current commitment and streamlined PEP distribution system (11), not all bite victims seek care (2, 14). We used the current childhood vaccination coverage of 83% as a proxy for access to healthcare and assigned an equivalent coverage for PEP for more recent time points and base case predictions.
In each predictive simulation, we drew 1,000 samples from the joint posterior parameter distribution. For every parameter set drawn, we predicted rabies incidence for status quo and each intervention evaluated. We parameterized our base case with values that maximized the likelihood of the data.
Interventions.
In the sensitivity analyses, we varied PEP access between 0% and 100% compared with the base case of 83%. We specified that 34% of owned dogs are vaccinated under status quo in accordance with regional dog ownership surveys (59).
We considered annual intervention targets for stray capture programs ranging from 100,000 to 500,000 dogs. Combined with the dogs vaccinated by their owners, this range of stray dog vaccination corresponds to population-level vaccination coverage of ∼25–50%. For canine vaccination, we assumed that stray dogs are caught without regard to previous vaccination status. For combined strategies of vaccination and sterilization, dogs are marked by veterinarians and not recaptured in subsequent years (SI Text). Male and female dogs were assumed to be caught in numbers proportional to population composition. Specifically, females make up only 24% of the canine population in Tamil Nadu as measured in the national livestock census (27). We compared strategies in which all caught dogs are vaccinated, marked, and sterilized with strategies in which all caught dogs are vaccinated and marked but only females are vaccinated. We assumed that the efficiency of capture declines with reductions in both the overall population size and the proportion of dogs remaining unsterilized (SI Text).
To model the impact of female sterilization on dog population growth, we reduced the per capita canine fertility rate by the proportion of female dogs sterilized. We did not adjust the fertility rate in response to the sterilization of male dogs. The standard operating procedure for sterilization campaigns in India suggests that limited resources be focused on sterilizing females, because an unsterilized male dog may impregnate several females (24). Male sterilization was considered, because it is implemented in India by many veterinarians, who are compensated by the government for the procedure, as a component of rabies control programs. Our analyses quantify the costs that are essentially wasted on these procedures.
Cost of Interventions.
The costs of PEP and canine interventions were primarily derived from a previous compilation in Tamil Nadu, with some adjustments that took into account recent developments on the ground (9) (Table S4). Specifically, in our base case, we assumed that the proportion of dog bite victims who receive the intradermal regimen (vs. the more expensive i.m. regime) is 0.33, consistent with the regional assessment (9). Given recent initiatives to promote intradermal PEP (11), we also varied this proportion from zero to one in sensitivity analyses. We updated the percentage of dog bites classified as Category III and treated with expensive Igs from 63% [as assessed in 2004 (59) and used in the previous compilation of costs (9)] to 57% [as measured in 2011 (60)]. The percentage of bite victims treated with Igs decreases as more patients access PEP overall, because patients who would not have previously sought treatment are less likely to have severe wounds, the criterion for Ig application. We assumed that the fixed costs associated with training health workers to administer PEP as well as program management were unaffected by canine interventions.
Table S4.
Economic parameters
| Item | Value | Source |
| Healthcare costs | ||
| Proportion of patients receiving IgG | 0.57 | Ref. 60 |
| Cost of procuring IgG | $5.24 | Department of Public Health, TN |
| Wastage rate of IgG | 0.15 | Ref. 9 |
| Proportion of patients receiving ID PEP | 0.33 | Ref. 9 |
| Outpatient visits per ID patient | 4 | Ref. 9 |
| Vials of ID PEP used per visit | 0.2 | Ref. 9 |
| Outpatient visits per i.m. patient | 5 | Ref. 9 |
| Vials of i.m. PEP used per visit | 1 | Ref. 9 |
| Cost of procuring single vial of ID or i.m. | $1.87 | Department of Public Health, TN |
| Wastage rate of vials | 0.3 | Ref. 9 |
| Health system cost for outpatient visit | $1.32 | Ref. 63 |
| Training, education, and surveillance | $1,029,648 | Ref. 9 |
| Canine intervention costs (all campaigns) | ||
| Cost per vehicle | $7,686 | Ref. 9 |
| Dog-catching equipment per vehicle | $66 | Ref. 9 |
| Annual salary for one driver per vehicle | $3,960 | Ref. 9 |
| Annual salaries for three dog catchers per vehicle | $9,743 | Ref. 9 |
| Workdays per year | 250 | Assumption |
| Maximum no. of dogs caught per vehicle per day | 10 | Ref. 9 |
| Kilometers per workday per vehicle | 100 | Ref. 9 |
| Running cost per 1 km | $0.12 | Ref. 9 |
| Training cost per 1,000 dogs | $160 | Ref. 9 |
| Dog survey | $599,541 | Ref. 9 |
| Antirabies vaccine dose | $0.57 | Ref. 9 |
| Canine sterilization costs | ||
| Maximum dogs sterilized per shed per day | 6 | Ref. 9 |
| Capital cost per shed | $4,951 | Ref. 9 |
| Annual water and electricity per shed per year | $33 | Ref. 9 |
| Veterinarian and paraveterinarian expenses per female dog sterilized | $5.27 | Ref. 9 |
| Veterinarian and paraveterinarian expenses per male dog sterilized | $3.62 | Ref. 9 |
| Medicine per female dog sterilized | $5.21 | Ref. 9 |
| Medicine per male dog sterilized | $3.55 | Ref. 9 |
| Admitted days per female dog sterilized | 7 | Ref. 9 |
| Admitted days per male dog sterilized | 4 | Ref. 9 |
| Cost of dog food per day | $0.33 | Ref. 9 |
Costs are in 2015 USD. ID, intradermal; TN, Tamil Nadu.
The previous compilation of Tamil Nadu canine intervention costs assumed that the entire canine population of 1.5 million dogs would be targeted for vaccination or both vaccination and sterilization (9). To adjust for target size of the proposed interventions, we proportionally reduced the capital costs for shelters, vehicles, and staff (SI Text). According to the international guidelines for financing and accounting as stipulated by the generally accepted accounting principles (42), we assumed that these capital costs would be incurred at the initiation of implementation and then, every 5 y. There is a fixed cost for the annual survey of the canine population, irrespective of the rabies intervention approach. Per dog costs, such as for the vaccine or veterinary care, were multiplied by the number of animals vaccinated and/or sterilized in a given year. We conducted a sensitivity analysis on the price of the canine vaccine, because it may be negotiable or vary over time. For female sterilization, we assumed that the same number of vehicles but fewer shelters would be required compared with sterilization of both males and females. In the former strategy, both male and female dogs would be caught by campaign teams, but the costs of surgical sterilization and recovery would only be incurred for females. We also assumed a minimum of 32 shelters (one per health district) given the large territory to be covered.
Human Health Outcomes.
We quantified human health outcomes using DALYs. Human rabies is inevitably fatal, and DALYs from mortality were calculated using an age distribution for rabies victims (2) and age-specific life expectancies for India (61). We assumed that bite victims with wounds from nonrabid dogs severe enough for presentation at a clinic incurred 0.005 (0.002–0.013) DALYs per patient as assigned to short-term open wounds by the Global Burden of Disease Study (62). This DALYs estimate is likely conservative given that some wounds may be much more severe. In sensitivity analyses, we considered DALYs per dog bite to range from 0.001 to 0.05.
Cost-Effectiveness Analysis.
For the base case analysis, we excluded all strongly dominated strategies defined as those for which an alternative strategy would avert more DALYs at equal or lower cost. We calculated the ICER for each nondominated strategy, (Cs − Cc)/(Dc − Ds), where Cs and Cc are the predicted costs for a strategy and its comparator, respectively, and Ds and Dc are the predicted DALY burdens for a strategy and its comparator, respectively. The comparator of a strategy is identified as the next nondominated strategy that is only incrementally less costly. After initial ICERs are calculated, strategies with a putative ICER that is higher than the ICER of a more costly strategy are deemed weakly dominated and excluded. ICERs for the remaining strategies are recalculated accordingly. These remaining strategies define the efficient frontier of the cost-effectiveness plane. According to the criteria of the WHO (63), any strategy that averts a DALY at an ICER below the per capita GDP of India is very cost-effective, and any strategy with an ICER three times higher is cost-effective.
To incorporate parameter uncertainty into our analysis, we conducted a probabilistic sensitivity analysis using a net health benefits approach (64, 65). The net health benefits approach uses a cost-effectiveness threshold, indicating a societal willingness to avert DALYs up to a maximum cost per DALY, to convert the cost of a strategy and the health benefits conferred into a single metric. Net health benefits are calculated by dividing the cost of a strategy by the cost-effectiveness threshold summed with the DALYs averted. For each of 1,000 parameter sets drawn from the joint posterior distribution, we identified the strategy that conferred the most net benefits at a given cost-effectiveness threshold. We then tabulated the probability that each strategy would confer the most net benefits, and the strategy with the highest probability was considered “optimal” at that threshold (66). We conducted this analysis across cost-effectiveness thresholds ranging from $1 to $30,000 per DALY.
Scenario and Sensitivity Analyses.
If owners brought dogs to a central point, campaign efforts could be shifted away from dog capture, such that many more dogs might be accessed each day. Thus, we conducted a scenario analysis to examine the possibility that central point vaccination campaigns might be more efficient than campaigns focused on stray dogs. Although no country-specific operational costs for central point campaigns are available for India, we considered that fewer vehicles and their associated costs would be required to reach a given annual target. For stray capture programs, campaign teams were assumed to be able to capture 10 stray dogs daily based on the experience of urban sterilization campaigns in other Indian states (9). A recent central point vaccination campaign in Malawi recorded that six-person teams were able to vaccinate, at most, 150 owned dogs daily (31), suggesting that the four-person vaccination teams (as has been the protocol in other Indian states) might be able to vaccinate as many as 100 dogs daily. Therefore, we evaluated the optimal central point campaign strategy at daily access rates per team ranging from 0 to 120 dogs in increments of 5 dogs. We considered annual intervention targets for central point vaccination of owned dogs ranging from 100,000 to 900,000 dogs. We assume that 34% of owned dogs continue to be vaccinated at birth. Central point campaigns vaccinate dogs without regard to previous vaccination status, reflecting the potential for owners to avail themselves of free campaigns instead of paying for private veterinary revaccination and that this potential becomes greater as campaign targets expand. We applied a probabilistic net benefits approach as described above, holding the cost-effectiveness threshold constant at the WHO threshold of $4,746 per DALY and instead, varying the daily number of dogs accessed per team. We conducted sensitivity analyses regarding the reintroduction rate, the rate at which rabid dogs bite humans (βh), and canine vaccine efficacy as well as the percentages of female and stray dogs. For each scenario, the entire parameter set was refit for the alternative scenario. As each parameter under investigation was varied in turn, we set the other parameters to their base case prior distributions or point estimates. Using parameter sets fitted for each scenario and additional scenarios with alternative discount rates and timeframes, we conducted a probabilistic uncertainty analysis across a range of cost-effectiveness thresholds as above. To assess sensitivity to DALYs incurred by bites from nonrabid dogs, access to PEP, the proportion of dog bite victims receiving intradermal vaccines, and the price of the canine vaccine, we conducted a one-way sensitivity analysis and identified the optimal strategy as defined for the scenario analysis of daily access rates also as above.
Through One Health practices implemented at the provider level, communication between physicians and veterinarians regarding the true rabies risk to victims has the potential to reduce wasteful PEP allocation. We calculated the monetary savings that could be achieved if such communication resulted in a 50% reduction in the provision of PEP for nonrabid bite injuries. We identified the expansion from the optimal annual canine vaccination target that could be afforded through application of these funds to canine programs and the resultant lives saved. As a separate analysis, we calculated the health impact of shifting the entire current budget for PEP to canine vaccination, a cost-neutral shift.
SI Text
Model Parameters.
We parameterized a total carrying capacity of 1.65 million dogs separated into carrying capacities of 950,000 and 700,000 dogs for owned and stray populations, respectively, based on a livestock census for Tamil Nadu in 2012 (27). We estimated the canine fertility rate by combining the sex ratio for dogs in Tamil Nadu (27) with per female fertility data from Jodhpur (26). We defined prior distributions for the incubation and infectious periods of canine rabies with means of 22.5 and 3.1 d, respectively, consistent with the epidemiological literature (31). Canine vaccine coverage for owned dogs was parameterized as 34% from dog owner survey responses for India (58). We assumed 100% canine vaccine efficacy in the base case, because clinical trials of canine vaccines have shown perfect efficacy against rabies for at least the 3-y duration of the studies (46, 47). Because the canine vaccines currently used in Tamil Nadu are suspected to have imperfect efficacy, we tested the sensitivity of our results to this parameter with a scenario of lower efficacy (considered at 80%).
Because Tamil Nadu borders restrict animal movement only minimally, if at all, the reintroduction of infectious dogs from surrounding areas is likely to present a challenge to any rabies control program. Rabid dogs have been observed to stay primarily within 5 km of the site of their infection (31), and we estimated that ∼2% of the land border of Tamil Nadu is within 5 km of the border. We, therefore, assumed that 1% of the equilibrium number of rabid dogs per year could be land importations and that an additional 0.5% could be imported through ports or other human-mediated travel. The annual equilibrium number of rabid dogs is ∼6,000, and therefore, the reintroduction rate calculated for the base case was 0.25 rabid dogs per day. We evaluated the sensitivity of our predictions to this assumption as a one-way scenario analysis. We did not include the import or export of nonrabid animals.
In the base case, the prior distribution for the rate at which a rabid dog bites a human has a mean of 0.51 bites per rabid dog from observations in rural Tanzania (Table S3) (20, 31). One assumption of this estimate was that rabid dogs that disappeared from the system died and were not the same dogs reappearing with no known source of infection. The alternative assumption, that disappearing and imported cases of rabies are the same dogs, leads to an average bite rate of 0.91 (31), and we use this as an alternative value in scenario analyses.
Interventions.
Interventions were modeled continuously throughout the year. To model canine vaccination, ε⍴SS/(365 × NS) was moved daily from the susceptible stray class (SS) to the vaccinated stray class (VS), where ε is the efficacy of the canine vaccine, and ⍴ is the annual target. For a combined target of ɸ, female dogs transitioned from SS to FS at rate εɸ and from SS to XS at rate (1 − ε)ɸ, whereas male dogs moved from SS to MS at rate εɸ. For combined strategies, we assumed that the efficiency of the campaign teams in capturing unsterilized animals declined as these animals became a smaller proportion of the population, which is described in the equation for h(fT) (Dataset S1).
Cost of Interventions.
The costs of canine interventions have been estimated for Tamil Nadu previously (Table S4) (9). We adjusted the costs to the scale of the proposed interventions, generally assuming that no less than 32 surgical recovery shelters (one per health district) would be constructed for combined interventions and that the veterinary team at each shelter could sterilize up to six dogs per day. We assumed a minimum of one vehicle per shelter, three dog catchers, and one driver per vehicle and a maximum of 10 successfully caught and vaccinated dogs per vehicle daily (9). We took into account that, if only female dogs are sterilized, only female dogs need to recover at shelters. A statewide program with 32 shelters and 96 vehicles (3 vehicles per shelter) could catch an average of 8.3 dogs and sterilize an average of 6 dogs per workday per shelter to reach an annual target of 200,000 dogs. If both male and female dogs are sterilized, 134 shelters and 134 vehicles would be required to meet the same target within Tamil Nadu.
Supplementary Material
Acknowledgments
We thank Jack Reece (Help in Suffering) for sharing his insights and data from the organization’s ongoing work on canine vaccination and sterilization and Kate Allen (Johns Hopkins Bloomberg School of Public Health) for her input on disability-adjusted life-year (DALY) weights for animal bite injuries. We also thank the many experts that we consulted and also, those who attended the two major consultations organized by us in January and September of 2015. These officers represented several different organizations, including the WHO, the Association for Prevention & Control of Rabies in India, the Animal Welfare Board of India, the Wildlife Institute of India, the Global Alliance for Livestock Veterinary Medicines, the National Institute of Veterinary Epidemiology and Disease Informatics, and the Federation of Indian Animal Protection Organizations, and included officials from the Departments of Public Health and Animal Husbandry from the Government of Tamil Nadu. This research was funded by the Bill & Melinda Gates Foundation through Grand Challenges Explorations Initiative Grant OPP1098763. M.C.F., A.P., J.P.T., and A.P.G. were supported by the Notsew Orm Sands Foundation. S.S.A. is a Commonwealth Scholar funded by the United Kingdom Government.
Footnotes
This paper results from the Arthur M. Sackler Colloquium of the National Academy of Sciences, “Coupled Human and Environmental Systems,” held March 14–15, 2016, at the National Academy of Sciences in Washington, DC. The complete program and video recordings of most presentations are available on the NAS website at www.nasonline.org/Coupled_Human_and_Environmental_Systems.
The authors declare no conflict of interest.
This article is a PNAS Direct Submission.
This article contains supporting information online at www.pnas.org/lookup/suppl/doi:10.1073/pnas.1604975113/-/DCSupplemental.
References
- 1.Hampson K, et al. Global Alliance for Rabies Control Partners for Rabies Prevention Estimating the global burden of endemic canine rabies. PLoS Negl Trop Dis. 2015;9(4):e0003709. doi: 10.1371/journal.pntd.0003709. [DOI] [PMC free article] [PubMed] [Google Scholar]
- 2.Suraweera W, et al. Million Death Study Collaborators Deaths from symptomatically identifiable furious rabies in India: A nationally representative mortality survey. PLoS Negl Trop Dis. 2012;6(10):e1847. doi: 10.1371/journal.pntd.0001847. [DOI] [PMC free article] [PubMed] [Google Scholar]
- 3.Zinsstag J, Schelling E, Waltner-Toews D, Whittaker M, Tanner M. One Health: The Theory and Practice of Integrated Health Approaches. CABI; Boston: 2015. [Google Scholar]
- 4.World Health Organization WHO Expert Consultation on Rabies. Second report. World Health Organ Tech Rep Ser. 2013;982:1–139. [PubMed] [Google Scholar]
- 5.Franka R, et al. Current and future tools for global canine rabies elimination. Antiviral Res. 2013;100(1):220–225. doi: 10.1016/j.antiviral.2013.07.004. [DOI] [PubMed] [Google Scholar]
- 6.Fooks AR, et al. Current status of rabies and prospects for elimination. Lancet. 2014;384(9951):1389–1399. doi: 10.1016/S0140-6736(13)62707-5. [DOI] [PMC free article] [PubMed] [Google Scholar]
- 7.Ichhpujani RL, et al. Knowledge, attitude and practices about animal bites and rabies in general community--a multi-centric study. J Commun Dis. 2006;38(4):355–361. [PubMed] [Google Scholar]
- 8.WHO 2014 Human Rabies in India: A Problem Needing More Attention. Available at www.who.int/bulletin/volumes/92/4/14-136044/en/. Accessed February 1, 2016.
- 9.Abbas SS, Kakkar M, Rogawski ET. Roadmap to Combat Zoonoses in India (RCZI) initiative Costs analysis of a population level rabies control programme in Tamil Nadu, India. PLoS Negl Trop Dis. 2014;8(2):e2721. doi: 10.1371/journal.pntd.0002721. [DOI] [PMC free article] [PubMed] [Google Scholar]
- 10.Nandakumar T. Drastic increase in incidence of rabies reported in State. The Hindu. October 10, 2015 Section News/Cities/THIRUVANANTHAPURAM. [Google Scholar]
- 11.Abbas SS, Venkataramanan V, Pathak G, Kakkar M. Roadmap to Combat Zoonoses in India (RCZI) Initiative Rabies control initiative in Tamil Nadu, India: A test case for the ‘One Health’ approach. Int Health. 2011;3(4):231–239. doi: 10.1016/j.inhe.2011.08.001. [DOI] [PubMed] [Google Scholar]
- 12. Joint Director (Vector Borne Disease Control Programme) (2015) Integrative Assessment of Cost and Effectiveness of Rabies Control Interventions Among Different Sectors in Tamil Nadu (Government of Tamil Nadu, Chennai, India), report dated August 4, 2015.
- 13. Director of Medical Education (2015) Medical Education Department – Rabies Control – Report of Dog Biter Cases, Rabies Treated and Rabies Death for the Period from 2010 to 2014 in Respect of Directorate of Medical Education. (Government of Tamil Nadu, Chennai, India), Ref no. 51023/Statistics/2015, dated July 13, 2015.
- 14.Sudarshan MK, et al. Assessing the burden of human rabies in India: Results of a national multi-center epidemiological survey. Int J Infect Dis. 2007;11(1):29–35. doi: 10.1016/j.ijid.2005.10.007. [DOI] [PubMed] [Google Scholar]
- 15.Mallewa M, et al. Rabies encephalitis in malaria-endemic area, Malawi, Africa. Emerg Infect Dis. 2007;13(1):136–139. doi: 10.3201/eid1301.060810. [DOI] [PMC free article] [PubMed] [Google Scholar]
- 16.Sekar N, Shah NK, Abbas SS, Kakkar M. Roadmap to Combat Zoonoses in India Initiative Research options for controlling zoonotic disease in India, 2010-2015. PLoS One. 2011;6(2):e17120. doi: 10.1371/journal.pone.0017120. [DOI] [PMC free article] [PubMed] [Google Scholar]
- 17.Kakkar M, Venkataramanan V, Krishnan S, Chauhan RS, Abbas SS. Roadmap to Combat Zoonoses in India (RCZI) initiative Moving from rabies research to rabies control: Lessons from India. PLoS Negl Trop Dis. 2012;6(8):e1748. doi: 10.1371/journal.pntd.0001748. [DOI] [PMC free article] [PubMed] [Google Scholar]
- 18.Velasco-Villa A, et al. Enzootic rabies elimination from dogs and reemergence in wild terrestrial carnivores, United States. Emerg Infect Dis. 2008;14(12):1849–1854. doi: 10.3201/eid1412.080876. [DOI] [PMC free article] [PubMed] [Google Scholar]
- 19.Zinsstag J, et al. Transmission dynamics and economics of rabies control in dogs and humans in an African city. Proc Natl Acad Sci USA. 2009;106(35):14996–15001. doi: 10.1073/pnas.0904740106. [DOI] [PMC free article] [PubMed] [Google Scholar]
- 20.Fitzpatrick MC, et al. Cost-effectiveness of canine vaccination to prevent human rabies in rural Tanzania. Ann Intern Med. 2014;160(2):91–100. doi: 10.7326/M13-0542. [DOI] [PMC free article] [PubMed] [Google Scholar]
- 21.Abbas SS, Kakkar M. Systems thinking needed for rabies control. Lancet. 2013;381(9862):200. doi: 10.1016/S0140-6736(13)60082-3. [DOI] [PubMed] [Google Scholar]
- 22.Acharya AS, Kaur R, Lakra K. Rabies epidemiology and control in India: A review. J Commun Dis. 2012;44(2):59–69. [PubMed] [Google Scholar]
- 23.ABC Program 2009 Blue Cross of India. Available at https://web.archive.org/web/20160331214000/http:/bluecrossofindia.org/?page_id=1662. Accessed April 18, 2016.
- 24.Animal Welfare Board of India 2009. Standard Operating Procedures for Sterilization of Stray Dogs Under the Animal Birth Control Program (Ministry of Environment & Forests, Govt. of India, Valmiki Nagar, Thiruvanmiyur, Chenna, India)
- 25.Reece JF, Chawla SK. Control of rabies in Jaipur, India, by the sterilisation and vaccination of neighbourhood dogs. Vet Rec. 2006;159(12):379–383. doi: 10.1136/vr.159.12.379. [DOI] [PubMed] [Google Scholar]
- 26.Totton SC, et al. Stray dog population demographics in Jodhpur, India following a population control/rabies vaccination program. Prev Vet Med. 2010;97(1):51–57. doi: 10.1016/j.prevetmed.2010.07.009. [DOI] [PubMed] [Google Scholar]
- 27.Ministry of Agriculture, Department of Animal Husbandry, Dairying, and Fisheries 2014. 19th Livestock Census - 2012 All India Report (Ministry of Agriculture, Government of India, New Delhi)
- 28.WHO Commission on Macroeconomics and Health . Macroeconomics and Health: Investing in Health for Economic Development. World Health Organization; Geneva: 2001. [Google Scholar]
- 29.Fishbein DB, et al. Prevention of canine rabies in rural Mexico: An epidemiologic study of vaccination campaigns. Am J Trop Med Hyg. 1992;47(3):317–327. doi: 10.4269/ajtmh.1992.47.317. [DOI] [PubMed] [Google Scholar]
- 30.Kaare M, et al. Rabies control in rural Africa: Evaluating strategies for effective domestic dog vaccination. Vaccine. 2009;27(1):152–160. doi: 10.1016/j.vaccine.2008.09.054. [DOI] [PMC free article] [PubMed] [Google Scholar]
- 31.Gibson AD, et al. The vaccination of 35,000 dogs in 20 working days using combined static point and door-to-door methods in Blantyre, Malawi. PLoS Negl Trop Dis. 2016;10(7):e0004824. doi: 10.1371/journal.pntd.0004824. [DOI] [PMC free article] [PubMed] [Google Scholar]
- 32.Hampson K, et al. Transmission dynamics and prospects for the elimination of canine rabies. PLoS Biol. 2009;7(3):e53. doi: 10.1371/journal.pbio.1000053. [DOI] [PMC free article] [PubMed] [Google Scholar]
- 33.Fitzpatrick MC, et al. Potential for rabies control through dog vaccination in wildlife-abundant communities of Tanzania. PLoS Negl Trop Dis. 2012;6(8):e1796. doi: 10.1371/journal.pntd.0001796. [DOI] [PMC free article] [PubMed] [Google Scholar]
- 34.Kitala PM, McDermott JJ, Coleman PG, Dye C. Comparison of vaccination strategies for the control of dog rabies in Machakos District, Kenya. Epidemiol Infect. 2002;129(1):215–222. doi: 10.1017/s0950268802006957. [DOI] [PMC free article] [PubMed] [Google Scholar]
- 35.Shim E, Hampson K, Cleaveland S, Galvani AP. Evaluating the cost-effectiveness of rabies post-exposure prophylaxis: A case study in Tanzania. Vaccine. 2009;27(51):7167–7172. doi: 10.1016/j.vaccine.2009.09.027. [DOI] [PMC free article] [PubMed] [Google Scholar]
- 36.Hampson K, Cleaveland S, Briggs D. Evaluation of cost-effective strategies for rabies post-exposure vaccination in low-income countries. PLoS Negl Trop Dis. 2011;5(3):e982. doi: 10.1371/journal.pntd.0000982. [DOI] [PMC free article] [PubMed] [Google Scholar]
- 37.Masthi NRR, Narayana DHA, Kulkarni P, Gangaboraiah PK, Belludi A. Epidemiology and prevention of animal bite and human rabies in a rural community-One health experiment. Asian Pac J Trop Dis. 2014;4:S486–S490. [Google Scholar]
- 38.Reece JF. Dogs and dog control in developing countries. In: Salem DJ, Rowan AN, editors. State of the Animals. Humane Society Press; Washington, DC: 2005. pp. 55–64. [Google Scholar]
- 39.Belsare AV, Gompper ME. Assessing demographic and epidemiologic parameters of rural dog populations in India during mass vaccination campaigns. Prev Vet Med. 2013;111(1-2):139–146. doi: 10.1016/j.prevetmed.2013.04.003. [DOI] [PubMed] [Google Scholar]
- 40.Vargas-Pino F, et al. Concomitant administration of GonaCon™ and rabies vaccine in female dogs (Canis familiaris) in Mexico. Vaccine. 2013;31(40):4442–4447. doi: 10.1016/j.vaccine.2013.06.061. [DOI] [PubMed] [Google Scholar]
- 41.Gsell AS, Knobel DL, Kazwala RR, Vounatsou P, Zinsstag J. Domestic dog demographic structure and dynamics relevant to rabies control planning in urban areas in Africa: The case of Iringa, Tanzania. BMC Vet Res. 2012;8:236. doi: 10.1186/1746-6148-8-236. [DOI] [PMC free article] [PubMed] [Google Scholar]
- 42. American Institute of Professional Bookkeepers (2012) Tax depreciation of vehicles. Mastering Depreciation Updates (AIPB, Rockville, MD), Sect 8, pp 187–207.
- 43.Zhang J, Jin Z, Sun GQ, Zhou T, Ruan S. Analysis of rabies in China: Transmission dynamics and control. PLoS One. 2011;6(7):e20891. doi: 10.1371/journal.pone.0020891. [DOI] [PMC free article] [PubMed] [Google Scholar]
- 44.Bögel K, Meslin FX. Economics of human and canine rabies elimination: Guidelines for programme orientation. Bull World Health Organ. 1990;68(3):281–291. [PMC free article] [PubMed] [Google Scholar]
- 45.Léchenne M, et al. Technical committee Operational performance and analysis of two rabies vaccination campaigns in N’Djamena, Chad. Vaccine. 2016;34(4):571–577. doi: 10.1016/j.vaccine.2015.11.033. [DOI] [PubMed] [Google Scholar]
- 46.Schultz RD. Duration of immunity for canine and feline vaccines: A review. Vet Microbiol. 2006;117(1):75–79. doi: 10.1016/j.vetmic.2006.04.013. [DOI] [PubMed] [Google Scholar]
- 47.Minke JM, et al. Comparison of antibody responses after vaccination with two inactivated rabies vaccines. Vet Microbiol. 2009;133(3):283–286. doi: 10.1016/j.vetmic.2008.06.024. [DOI] [PubMed] [Google Scholar]
- 48.Laurenson MK, Mlengeya T, Shiferaw F, Cleaveland S. Approaches to disease control in domestic canids for the conservation of endangered wild carnivores. Occasional Papers of the IUCN Species Survival Commission. 2005;30:141–146. [Google Scholar]
- 49.Johnson N, et al. A new outbreak of rabies in rare Ethiopian wolves (Canis simensis) Arch Virol. 2010;155(7):1175–1177. doi: 10.1007/s00705-010-0689-x. [DOI] [PubMed] [Google Scholar]
- 50.India PT 2016 33 Spotted deer died of rabies in National Zoological Park. Business Standard. Available at www.business-standard.com/article/pti-stories/33-spotted-deer-died-of-rabies-in-national-zoological-park-116080101079_1.html. Accessed August 19, 2016.
- 51.Yoak AJ, Reece JF, Gehrt SD, Hamilton IM. Disease control through fertility control: Secondary benefits of animal birth control in Indian street dogs. Prev Vet Med. 2014;113(1):152–156. doi: 10.1016/j.prevetmed.2013.09.005. [DOI] [PubMed] [Google Scholar]
- 52.Internal Revenue Service 2016 Yearly Average Currency Exchange Rates. Available at https://www.irs.gov/individuals/international-taxpayers/yearly-average-currency-exchange-rates. Accessed April 7, 2016.
- 53.World Bank 2016 GDP per Capita (Current US$) Data. Available at data.worldbank.org/indicator/NY.GDP.PCAP.CD?locations=IN. Accessed September 28, 2016.
- 54.Reece JF, Chawla SK, Hiby EF, Hiby LR. Fecundity and longevity of roaming dogs in Jaipur, India. BMC Vet Res. 2008;4:6. doi: 10.1186/1746-6148-4-6. [DOI] [PMC free article] [PubMed] [Google Scholar]
- 55.Tsoularis A, Wallace J. Analysis of logistic growth models. Math Biosci. 2002;179(1):21–55. doi: 10.1016/s0025-5564(02)00096-2. [DOI] [PubMed] [Google Scholar]
- 56.R Development Core Team 2005 R: A Language and Environment for Statistical Computing. Available at www.r-project.org. Accessed December 1, 2016.
- 57.Friedman J, Hastie T, Tibshirani R. Regularization Paths for Generalized Linear Models via Coordinate Descent. J Stat Softw. 2010;33(1):1–22. [PMC free article] [PubMed] [Google Scholar]
- 58.Pandey A, Mubayi A, Medlock J. Comparing vector–host and SIR models for dengue transmission. Math Biosci. 2013;246(2):252–259. [PubMed] [Google Scholar]
- 59.Association for Prevention and Control of Rabies in India . Assessing Burden of Rabies in India. Association for the Prevention and Control of Rabies in India (APCRI); Bangalore, India: 2004. [Google Scholar]
- 60.Indu D, et al. Profile study of patients attending preventive clinic for animal bites at Government medical College, Thiruvananthapuram. APCRI J. 2012;14:30–32. [Google Scholar]
- 61.Office of the Registrar General & Census Commissioner, India 2011 ORGI Census of India. Available at www.censusindia.gov.in/. Accessed April 21, 2016.
- 62.Murray CJL, et al. Disability-adjusted life years (DALYs) for 291 diseases and injuries in 21 regions, 1990-2010: A systematic analysis for the Global Burden of Disease Study 2010. Lancet. 2012;380(9859):2197–2223. doi: 10.1016/S0140-6736(12)61689-4. [DOI] [PubMed] [Google Scholar]
- 63.WHO . Choosing Interventions That Are Cost Effective (WHO-CHOICE) World Health Organization; Geneva: 2010. [Google Scholar]
- 64.Stinnett AA, Mullahy J. Net health benefits: A new framework for the analysis of uncertainty in cost-effectiveness analysis. Med Decis Making. 1998;18(2 Suppl):S68–S80. doi: 10.1177/0272989X98018002S09. [DOI] [PubMed] [Google Scholar]
- 65.Briggs AH, Goeree R, Blackhouse G, O’Brien BJ. Probabilistic analysis of cost-effectiveness models: Choosing between treatment strategies for gastroesophageal reflux disease. Med Decis Making. 2002;22(4):290–308. doi: 10.1177/0272989X0202200408. [DOI] [PubMed] [Google Scholar]
- 66.Barton GR, Briggs AH, Fenwick EAL. Optimal cost-effectiveness decisions: The role of the cost-effectiveness acceptability curve (CEAC), the cost-effectiveness acceptability frontier (CEAF), and the expected value of perfection information (EVPI) Value Health. 2008;11(5):886–897. doi: 10.1111/j.1524-4733.2008.00358.x. [DOI] [PubMed] [Google Scholar]
- 67.Srinivas PJ, Prasad KKL, Appalnaidu S. Profile of the dog bite victims attending anti-rabies clinic, King George Hospital, Visakhapatnam, Andhra Pradesh. APCRI J. 2015;16(2):20–22. [Google Scholar]
Associated Data
This section collects any data citations, data availability statements, or supplementary materials included in this article.


