Abstract
Mass spectrometry (MS) is widely recognized as a powerful analytical tool for molecular research. MS is used by researchers around the globe to identify, quantify, and characterize biomolecules like proteins from any number of biological conditions or sample types. As instrumentation has advanced, and with the coupling of liquid chromatography (LC) for high-throughput LC-MS/MS, a proteomics experiment measuring hundreds to thousands of proteins/protein groups is now commonplace. While expert practitioners who best understand the operation of LC-MS systems tend to have strong backgrounds in physics and engineering, consumers of proteomics data and technology are not exposed to the physio-chemical principles underlying the information they seek. Since articles and reviews tend not to focus on bridging this divide, our goal here is to span this gap and translate MS ion physics into language intuitive to the general reader active in basic or applied biomedical research. Here, we visually describe what happens to ions as they enter and move around inside a mass spectrometer. We describe basic MS principles, including electric current, ion optics, ion traps, quadrupole mass filters, and Orbitrap FT-analyzers.
Introduction
Mass spectrometry (MS) is a powerful tool for molecular analysis, evidenced in part by the increasing number of biologists utilizing MS for protein identification, quantification, and characterization. Although MS is a popular technology among the masses, it is not necessarily understood. A biologist who is interested in how a data-dependent tandem MS experiment is conducted will not, in our experience, find intuitive didactic materials in the peer-reviewed literature. They will find mathematical and physical descriptions of the mass spectrometer itself but little, if any, language naturally intuitive. Here, we offer a basic tutorial of mass spectrometry using lay terms and simple figures.
Before delving more deeply into the physics and chemistry of MS, it may be helpful to the typical end user for us to briefly discuss the naming conventions and commercialized versions of the most commonly available MS instruments. Mass spectrometers are typically referred to in terms of the mass analyzer(s) they possess—these are the important components of the instrument that actually generate mass spectral data to be interpreted by analysts later. The mass analyzers discussed in this tutorial include linear ion traps (LIT), quadrupole ion traps (QIT) and mass filters (QMF), and high-resolution Orbitraps. Relatively common mass analyzers that will not be discussed in the following pages, for brevity, include time-of-flight (TOF) and ion cyclotron resonance (ICR) mass spectrometers. Although we will not be reviewing these analyzers, the lessons learned here about basic ion physics and manipulation can be applied to further one’s understanding of the function of any mass analyzer, and in-depth materials on TOFs [1–3] and ICRs [4, 5] are readily available for the interested reader.
It is key to note that MS-based proteomics is not a single strategy or technique—rather, it is a field composed of myriad tools and processes that may differ based on a number of factors, including sample type and complexity, and the nature of the question being asked.[6] The range of commercial products for MS proteomic applications is vast, and it can be challenging to determine which of the aforementioned mass analyzers is appropriate for different workflows or experiments, especially when increasingly common hybrid architectures are thrown into the mix. Generally, singular ion trap-based instruments, such as the LTQ XL (Thermo Fisher Scientific) or the amaZon SL (Bruker), are deployed for general chemistry applications, metabolite identification[7], and general protein/peptide profiling and post-translational modification (PTM) identification, due to their high sensitivity and rapid speed of analysis, albeit at low resolution. When combined into hybrid architectures with fast-scanning quadrupoles, such as in the QTRAP series (AB Sciex), targeted quantitation of peptides in complex samples becomes a workhorse for high-throughput application. These highly sensitive workflows, often referred to as selected reaction monitoring (SRM)[8] or multiple reaction monitoring (MRM) experiments, take advantage of the enhanced precursor isolation capabilities and scanning velocity of the quadrupole components to increase the dynamic range of the analysis and identify and quantify less abundant peptide species in complex mixtures. A linear combination of three quadrupole mass analyzers in tandem (referred to as “triple quadrupole” or “QQQ” instruments) is frequently applied to these global quantitative proteomics experiments, in addition to metabolomic workflows, and demonstrate extreme sensitivity and high dynamic range. Examples of these ubiquitous and highly useful QQQs include the TSQ series (Thermo Fisher Scientific), EVOQ series (Bruker), Xevo series (Waters), and API and Triple Quad systems (AB Sciex).
Mass analyzers that can achieve very high resolution can be applied to increasingly complex analyses—such as whole protein, or “top-down” proteomics. Recently, hybrid instruments combining ion traps or quadrupoles with the Orbitrap Fourier transform-based mass analyzer have emerged as ideal platforms for top-down proteomics and PTM identification/localization at high mass accuracy, in addition to previously mentioned peptide-based quantitation from complex mixtures. Trade names for these increasingly common instruments include the Q-Exactive (quadrupole-Orbitrap, Thermo Fisher Scientific), Orbitrap Elite (LIT-Orbitrap, Thermo Fisher Scientific), and recent Fusion Tribrid (quadrupole-LIT-Orbitrap, Thermo Fisher Scientific). Additionally, the previously-mentioned ICR analyzers were the state-of-the-art for high-resolution MS applications for many years before the introduction of Orbitrap technology, and a commercial example of this still-relevant technology is the SolariX XR (Bruker), which attains extraordinarily high resolving power. It is also key to mention that TOF analyzer configurations are common, especially quadrupole-TOF hybrids (Q-TOF) such as the TripleTOF (AB Sciex) and Impact II (Bruker), and can be used for various protein/PTM identification workflows from solution or solid phase-based samples.
Measuring molecules: Ions, electromagnetic fields, and direct and alternating current
A mass spectrometer ultimately measures the mass (m) of a molecule in relation to its charge (z). In the macroscopic world we measure the mass of something using a scale and the force of gravity. For example, a hypothetical dog is composed of 18 kg of mass. More colloquially, we would simply say: “the dog weighs 18 kg.” In the molecular world of proteins, peptides, and metabolites, however, masses are too small to use a scale and gravity. But, if we ionize them—that is, put an electric charge on them—although we still cannot measure their response to gravity, we can measure their response to electric and magnetic forces. A mass spectrometer is the tool we use to measure the response of ionized molecules to user-defined electromagnetic forces. The resulting data is then used to calculate the mass-per-charge (m/z) of the ionized molecule, and ultimately the original mass of the neutral.
Electromagnetic fields apply forces to gas phase ions and result from applied electric currents. Electric “current” is simply charge in motion, carried by electrons most often through wires. This flow of charge in electric currents can easily be imagined as water being pumped through a hose. Two types of current are used in mass spectrometry: direct current (DC) and alternating current (AC). In DC, charge moves in one direction to the point where the charge of the electrode (the thing being charged) reaches its intended level. The current then stops flowing but retains the potential to flow again as soon as the electrode loses any charge. Using the water analogy, imagine turning on a hose, screwing it securely into a barrel, and filling that barrel with water. When the pressure in the full barrel equals that of the source of the water the flow stops, but if someone let water out the other side of the barrel, then the water would flow again to replace what was lost. In AC, on the other hand, the water flows in alternating directions: into the barrel, back toward the supply, into the barrel, back toward the supply, etc. Although the utility of AC in the hose and barrel analogy does not appear to make much sense, we will soon demonstrate that AC is extremely useful for the confinement of ions within mass spectrometers.
Electromagnetic fields are produced by applying DC and AC currents in varying intensities. In electromagnetism, these intensities are referred to as amplitudes, and we measure them in voltage. The higher the amplitude of a current (DC or AC) the more electromagnetic force that is applied. Electromagnetic fields resulting from AC can be adjusted by altering the frequency with which the current alternates. AC frequency is described in units of Hertz (Hz), or events per second. When the AC is oscillating in the range of 3 kHz to 300 GHz it is referred to as radio frequency (RF). Thus, all RF is AC, but not all AC is RF. Ultimately, ions are controlled and measured in a mass spectrometer through the application of DC and AC, often in the RF range.
Ion Optics
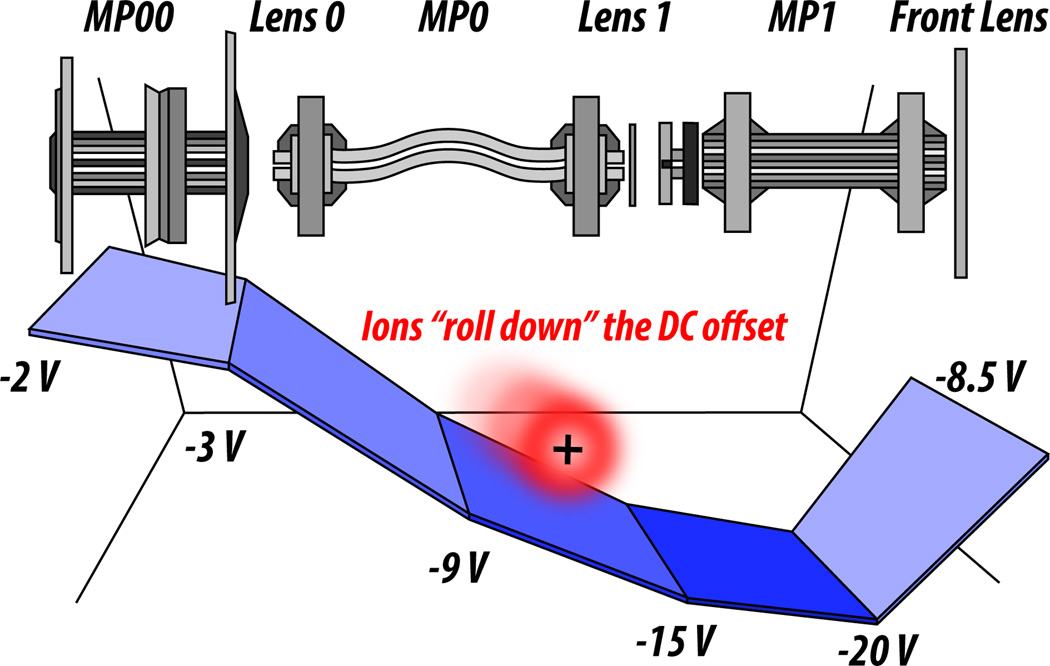
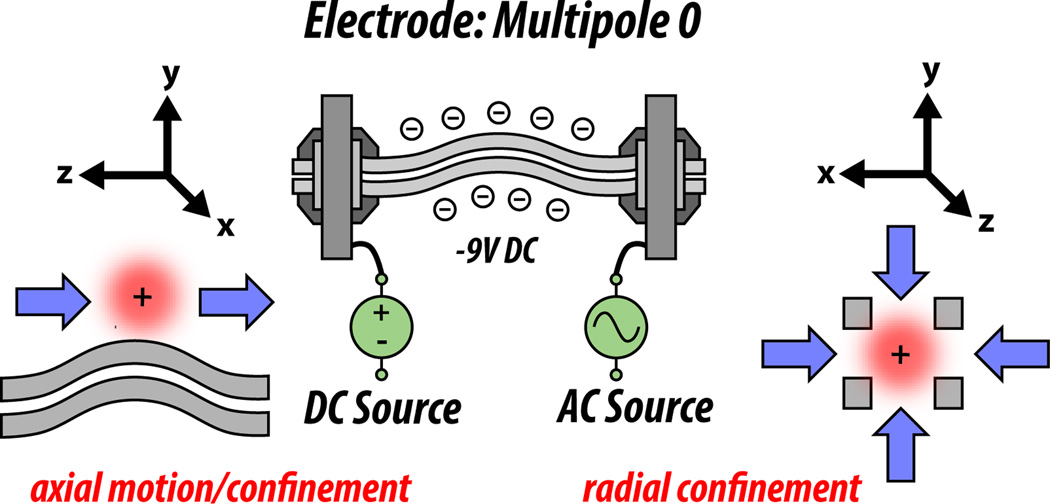
The “optics” of a mass spectrometer are the electrodes upstream of the mass analyzer to which DC and AC currents are applied in order to create electromagnetic fields that focus and propel the ions down a particular path ultimately ending at the analyzer (Figure 1). There are two primary types of electrodes housed within the ion optics: disc-shaped (lenses) and rod-shaped (poles; i.e. multipoles, quadrupoles, bent flatapoles). Analogous to how optics in microscopy are used to focus and direct light, optics in a mass spectrometer focus and direct ions. From entering the optic path to arriving at the point of analysis, ions are confined radially by AC and propelled axially toward the analyzer using DC “offsets,” meaning juxtaposed electrodes have differing DC amplitudes (Figure 2). The result is that ions ‘fall’ down an electric potentiali gradient similar to how a ball rolls down a hill (Figure 1). Typically, biomolecular ions (especially peptides and proteins) in LC-MS experiments are positively charged by protonation in solution—therefore, increasingly negative voltages are applied in the DC offset (recall that opposite charges attract and like charges repel one another).
Figure 1. An example of ion optics and the concept of a DC offset.
A DC voltage gradient is applied to sequential multipoles and lenses that compose the optics of the mass spectrometer, which all serve to focus and propel ions from the ion source through to the mass analyzer (from left to right). This gradient is increasingly negative, so as to propel positively charged ions (symbolized here by the red sphere with a positive sign) through the optics and towards the mass analyzer, with a final decrease in negative voltage to slow the ions down just enough so they can be captured in the trap. MP = multipole.
Figure 2. Axial and radial motion of ions in the optic path.
AC applied to each optic serves to confine ion packets radially. That is, the AC supplies a counterforce that keeps ions within the radial boundaries of the optical path, much like ink is encased within the narrow tube of a pen. In the optics, DC offsets from optic to optic provide the force to keep ions moving in the axial dimension, which refers to the path of the ion (the longitudinal axis of the pen, in the previous analogy). In traps, we will see that DC can be used for axial confinement in a potential well.
Ion Traps: the Mathieu equation, trapping, and scanning
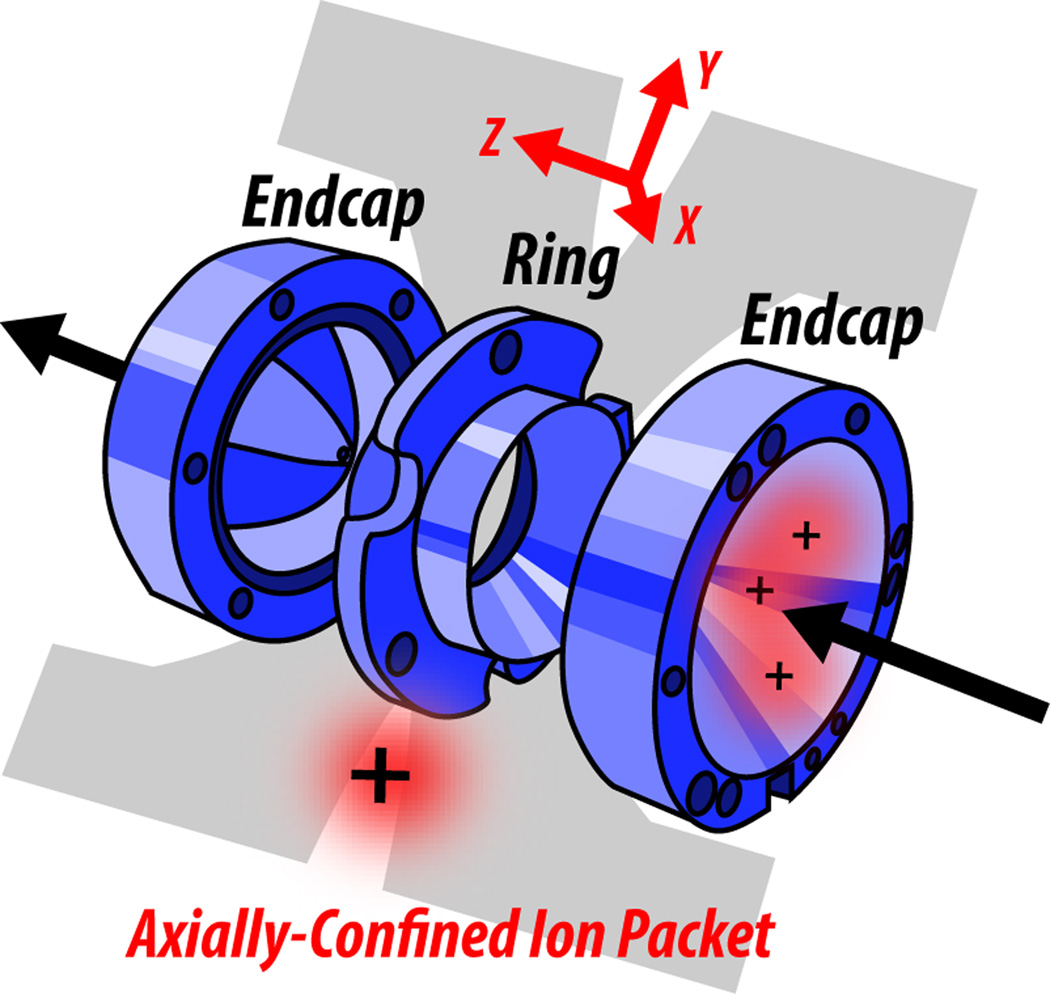
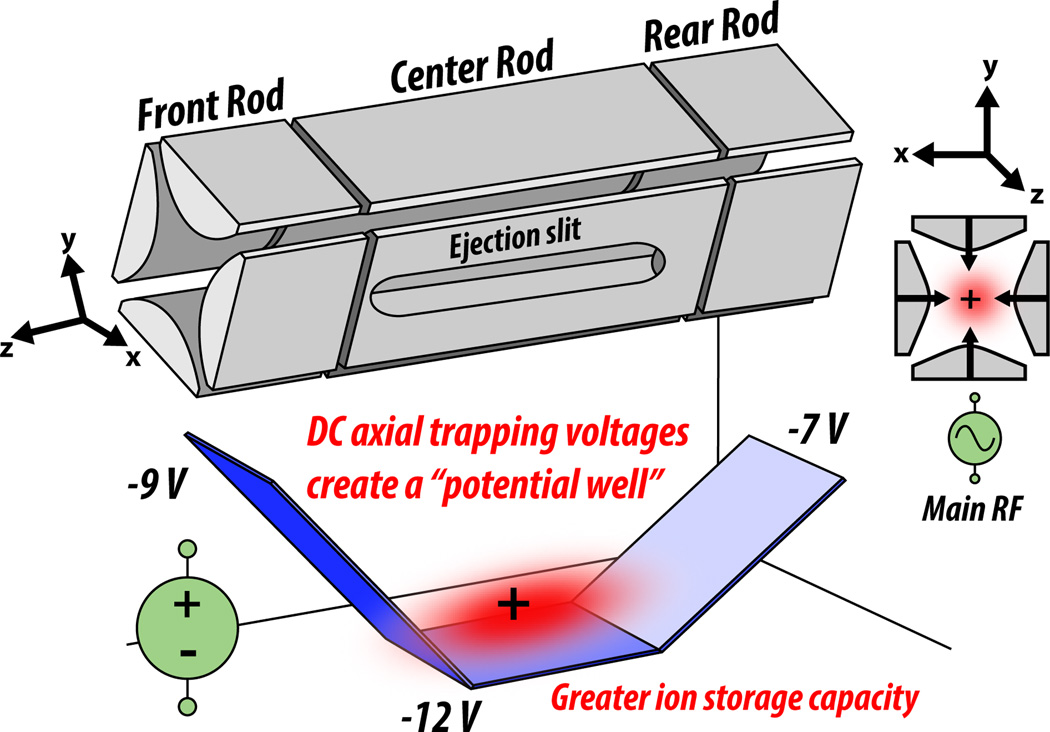
Ion trap analyzers are composed of four rod-shaped electrodes, to which DC and AC are applied to produce electric fields that confine ions in space. In three dimensional traps, which are used less often, electromagnetic forces act on the ions in the x, y, and z dimensions: x and y are the radial dimensions, and z is the axial dimension (Figure 3). In the more common two dimensional trap, also known as the linear ion trap (LIT), forces act on the ions only in the x and y dimensions; this allows them to spread out axially and increases the ion capacity compared to three dimensional traps (Figure 4). AC is applied to pairs of electrodes at equal amplitude and opposite sign at a frequency of 1.2 MHz, which is within the RF range. This AC is referred to as the “main RF” and serves to confine the ions radially, like ink in a pen is confined radially within a plastic tube (Figure 4). Axially, the ions are confined by the creation of a potential well generated by DC offsets; the four ion trap electrodes are cut into three sections and each of these sections has their own DC applied to them (Figure 4). Since it is more common and has an increased ion storage capacity, the two dimensional trap will be the subject of the remaining discussion on ion trap functionality.
Figure 3. The three-dimensional ion trap.
The ring and endcap electrodes of the 3D ion trap are shown, which apply electromagnetic forces in the x, y, and z dimensions to tightly confine ion packets within the trap. Because of the force in the axial dimension, the ions are confined as a tight packet. This is not the case in 2D ion traps, where ions are allowed to spread out in the axial dimension; thus, 2D traps have an increased ion storage capacity.
Figure 4. The two-dimensional ion trap.
The four quadrupolar rods of the 2D ion trap are segmented thrice, with each set of segments bearing DC axial trapping voltages to create a potential well to confine ion packets. AC applied to all four rods and all three segments, called the “main RF”, acts as a radially-confining force. The linear design and lack of force in the axial dimension allows ions to spread out, offering greater ion storage capacity than the 3D trap.
Once the ions are trapped, their radial confinement depends on their movement within the trap, which in turn depends on how much force is applied to them. Though the main RF exerts a force on the ions to confine them radially, it also induces ion motion. Ion motion is proportional to the main RF amplitude and the mass of the ion. Thus, we must keep two things in mind: 1) the larger the amplitude, the larger the force, and thus the more ion motion in response; 2) the larger the ion, the more force is required to move it. In response to the main RF, ions go into “secular motion,” which can be envisioned as a cork-screw motion within the trap. At the time of entry into the trap, all the ions adopt secular motion in response to the main RF, with smaller ions moving about more than the larger ones. We can now use the Mathieu equation to determine how much movement is tolerated before the ions are no longer trappable.
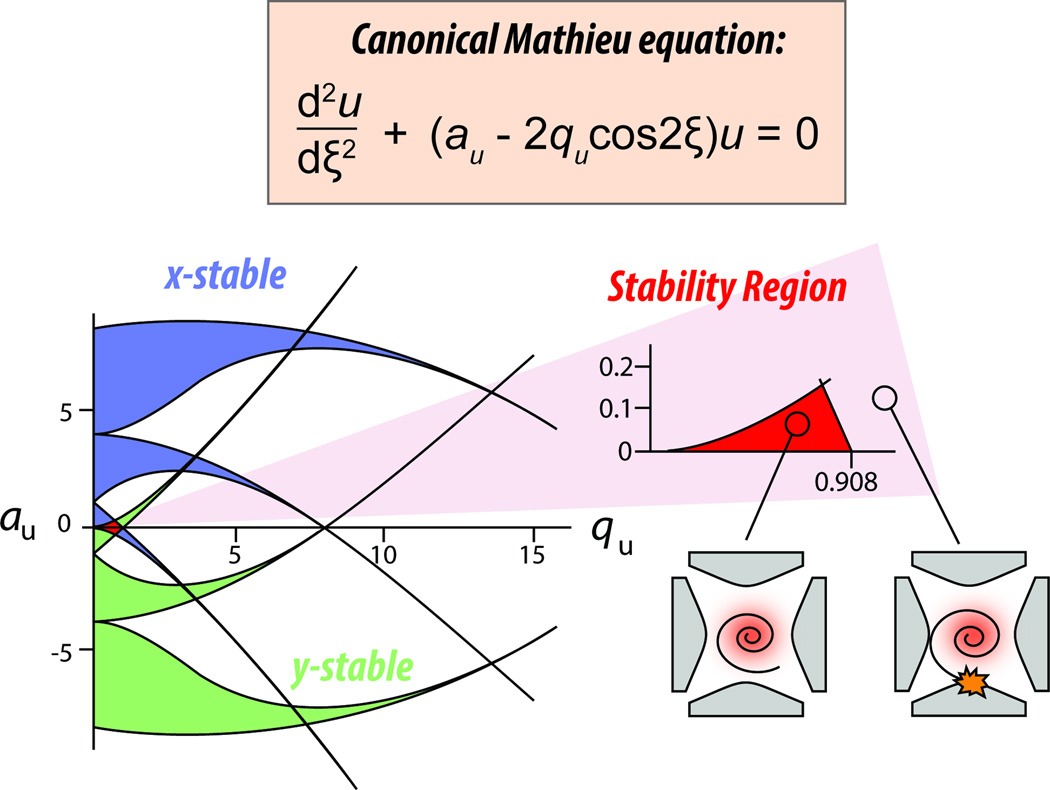
The Mathieu equation, and its unit-less variables q and a, defines the range of ion m/z’s that will be contained within the trap in response to a given main RF amplitude. The equation can be represented graphically with an x- and y-axis, where q is on the x-axis and a is on the y-axis (Figure 5). In ion traps we only deal with the q dimension, which is a measure of ion secular motion frequency (we’ll discuss the a dimension in the quadrupole mass filter section). The range of ion stability is from a q of 0 to 0.908. Above q = 0.908, the ion’s secular motion surpasses the physical boundaries of the trap. That said, when ions enter the trap they adopt secular motion corresponding to q values, which are themselves dependent on the amplitude of the main RF and the size of the ions (smaller ions have larger q values). Importantly, the q value for ions of a given m/z can be changed by adjusting the main RF voltage; increasing RF voltage increases ion q by increasing ion secular motion. Knowing this, you could imagine performing a scan if we put detectors outside the trap, increased the main RF voltage steadily, and measured escaping ions at the detectors as their q’s exceeded the natural stability limit of 0.908. Because we would know the main RF voltage at the time of detection we could calculate the m/z of the ions just detected. In theory this works but in practice we do something a little more nuanced.
Figure 5. Stability region of the linear ion trap, x and y stable solutions to Mathieu’s stability equations.
The inset shows the most important stability region where x and y stability bounds overlap, resulting in a small triangular stability region in a and q space. In the absence of quadrupolar DC, which is used in quadrupolar mass filters (QMFs) but not used in linear ion traps, a is always equal to 0; thus, ion stability is explained only by q. Here, ions are stable if their q is between 0 and 0.908. Within this region (0 ≤ q ≤ 0.908) ions will be contained within the trap without colliding with electrodes or escaping.
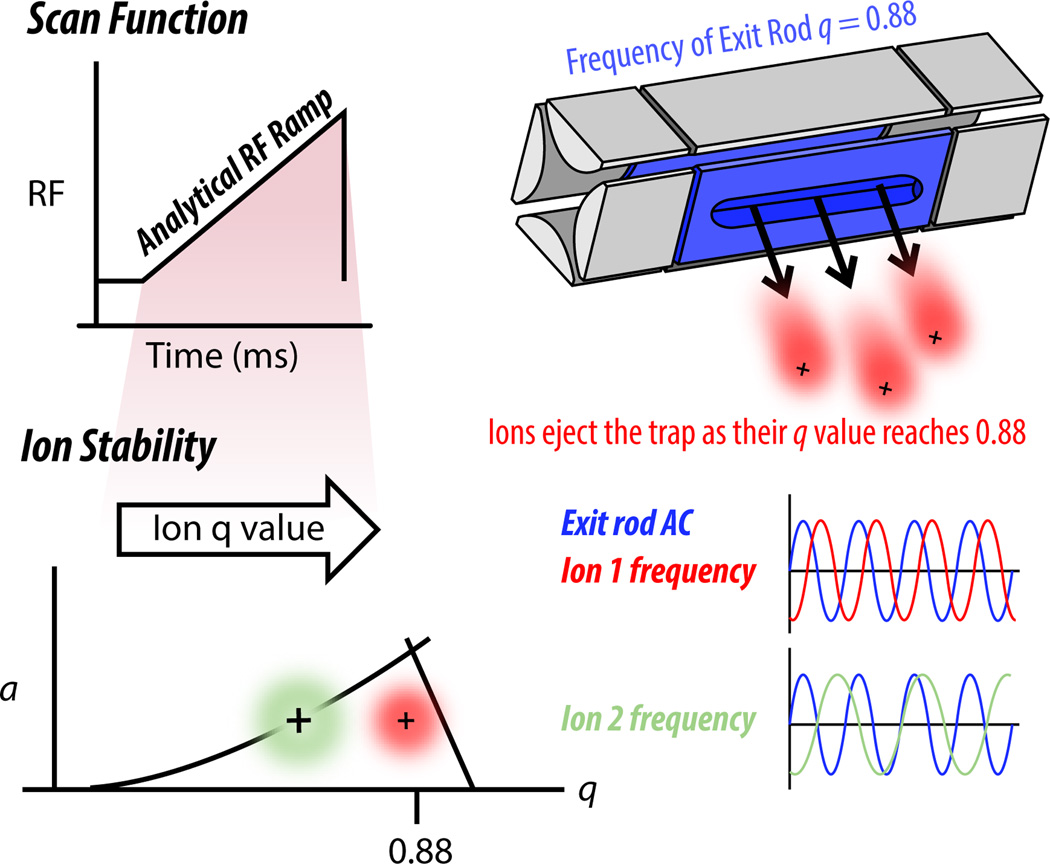
Current ion trap scanning employs “resonance ejection,” a process which depends on the application of an additional AC to the exit rods within the trap. The exit rods are the two quadrupolar rods that contain slits cut through the rods for ions to pass out (Figure 4). The exit rod AC is applied in equal amplitude but opposite phase to each rod. For practical applications, we set the frequency of the exit rod AC to correspond to a q of 0.88 (Figure 6). When the main RF causes the frequency of ion secular motion to match the frequency of exit rod AC (q = 0.88), that ion will begin to resonate back and forth between the exit rods until it picks up enough energy to be ejected from the trap through the exit rod slits. To perform a scan, the main RF is ramped up steadily so that ions of different m/z values sequentially increase their q to 0.88, enter resonance with the exit rod AC, and eject through the exit rod slits. To standardize the time it takes for ions of different m/z values to resonate before exiting, the voltage of the exit rod AC is also increased steadily throughout the scan, with larger ions requiring more voltage.
Figure 6. 2D linear ion traps eject ions to detectors via resonance ejection.
The main RF applied to the rods is ramped to increase ions’ secular motion until they resonate with the q of the exit rods, determined by a separate AC applied to the exit rods only and typically set to 0.88 (exit rods shown in blue). In the example above, the red ion packet comes into resonance with the frequency of the exit rod AC and picks up enough energy to eject the trap through the exit rod slits. The green ion packet, however, has greater m/z and thus a lower q, and therefore will reach q = 0.88 and eject later in the scan function.
Having explained ion resonance in the context of ejection and scanning, we can now describe other features of the ion trap that use ion resonance, namely, isolation and fragmentation.
Ion Trap: isolation and fragmentation
Ion isolation—the process whereby ions of one m/z are isolated from a complex mixture—is a preliminary step before ions can be fragmented and thus further characterized by tandem MS (MS/MS). It is achieved by performing resonance ejection on all the unwanted ions in the trap simultaneously while keeping the ions of interest in the trap. We saw above how resonance ejection works with a scan: main RF voltage is ramped so that ions of increasing size sequentially come into resonance with the exit rod AC, commonly set to q = 0.88. In a scan ions are sequentially ejected, but during ion isolation they are simultaneously ejected. The “superposition principle” in physics explains how we can achieve this.
Imagine the trap contained five populations of ions of differing m/z values: 200, 400, 600, 800, and 1000. Within the trap remember that each of these ion populations is moving about with a secular frequency corresponding to a particular q value in response to the main RF voltage. For purely illustrative purposes let us imagine m/z 200 has q = 0.6, m/z 400 has q = 0.4, m/z 600 has q = 0.3, m/z 800 has q = 0.25, and m/z 1000 has q = 0.2. One way to eject each of these ions would be to do a scan as described above, where we adjust each of the ions’ secular motion q by adjusting the main RF voltage. But another way would be to adjust the q of the exit rod AC—by adjusting its frequency—so that it matches each of the ions’. With the hypothetical ions here we could first bring the exit rod AC to a q of 0.6 and resonantly eject m/z 200, then bring it to a q of 0.4 and resonantly eject m/z 400, then bring it to q of 0.3 and resonantly eject m/z 600, and so forth. If we wanted to isolate the 800 m/z population rather than eject it, we would simply avoid bringing the exit rod AC to the q that matches the secular motion of the population of interest, in this case q = 0.25.
The above process would achieve ion isolation, but it would take time and it would not be simultaneous. However, all we have to do to achieve simultaneous resonance ejection of all the unwanted ions is to overlay (superimpose) the exit rod AC waves used for ejecting each of the ions individually. This superimposed wave is a complex waveform containing waves with q values matching each of the ions’ secular motions. The fascinating part is that although the exit rod AC wave is now a complex waveform, each of the ions experiences its own corresponding wave as if it were the only one being applied. The result is that all four unwanted ions resonantly eject simultaneously. To summarize ion isolation, we superimpose exit rod AC waves that span q space from 0 to 0.908 (the region of stability for trapped ions). We then drop out the wave(s) from the superimposed wave corresponding to the m/z range we want to isolate. In doing so, all the ions except for those whose corresponding wave is missing from the superimposed waveform resonantly eject. We call the superimposed waveform the “isolation waveform.”
We typically isolate packets of ions in an MS experiment with the intent of fragmenting them to aid in identifying the isolated species. The most common form of fragmentation in an ion trap is “collision-induced dissociation” (CID). CID, like resonance ejection, depends on ion resonance. It also depends on the presence of inert gas molecules (commonly helium) pumped into the trap. Ions of interest are brought into resonance with the exit rod AC during the process of fragmentation. Unlike in resonance ejection, however, the voltage of the exit rod AC is kept lower than that required to eject them. In theory, any ion in resonance would eventually eject, but in the presence of ~1 Torr helium the ions stay in resonance until they collide multiple times with the neutral background atoms, become vibrationally excited, and finally break. Once they break along the peptide backbone, the resulting fragment ions are now different masses and thus have secular motions with differing q’s. Therefore, the fragment ions are no longer in resonance with the exit rod AC being applied. The extent of ion fragmentation depends on how long ions spend in resonance, which is proportional to the number of collisions with helium gas they experience. The resonance or “activation” time is user-defined, and can be manipulated based on the experiment.
A final point on CID regards the q of the exit rod AC used to bring the ions into resonance for CID in the process of activation. For peptides a q of 0.25 is commonly used; for proteins it is commonly 0.4. Why do we use q values relatively low on the q axis (Figure 5)? And why do we use different q values for proteins compared to peptides? Once a polypeptide breaks, the resulting fragments will be smaller, and thus will have higher q values for their secular motion—because the main RF voltage stays the same and smaller ions are affected more than larger ions. Therefore, a low activation q is used to maximize the number of fragment ions that remain within the natural stability limit (q = 0 – 0.908) upon fragmentation.
But this begs another question: why not fragment at the lowest q possible and maximize the trapping capacity available to capture the resulting fragments? It has to do with the force from the main RF that confines the ions radially. During resonance, ions continue to experience the force from the main RF. So, although they are resonating back and forth between the exit rods, they also experience the main RF force acting against them, which contributes to maintaining them in resonance rather than immediately being ejected through the exit rod slits. If a very low activation q was used, say 0.01, this would mean that the ion secular frequency q to achieve resonance would also be q = 0.01. Since ion secular motion depends on the main RF voltage, a q value this small would mean there is very little radial confinement force acting on the ions. The result would be that ions in resonance would exit the trap before having enough time to collide with helium and break. A q of 0.25 provides enough radial confinement force to keep the peptides in resonance long enough to fragment. This also explains the answer to the other question above—why proteins use a different q than peptides. Since intact proteins are bigger than peptides they require a larger radial confinement force to keep them in resonance.
Quadrupole Mass Filter
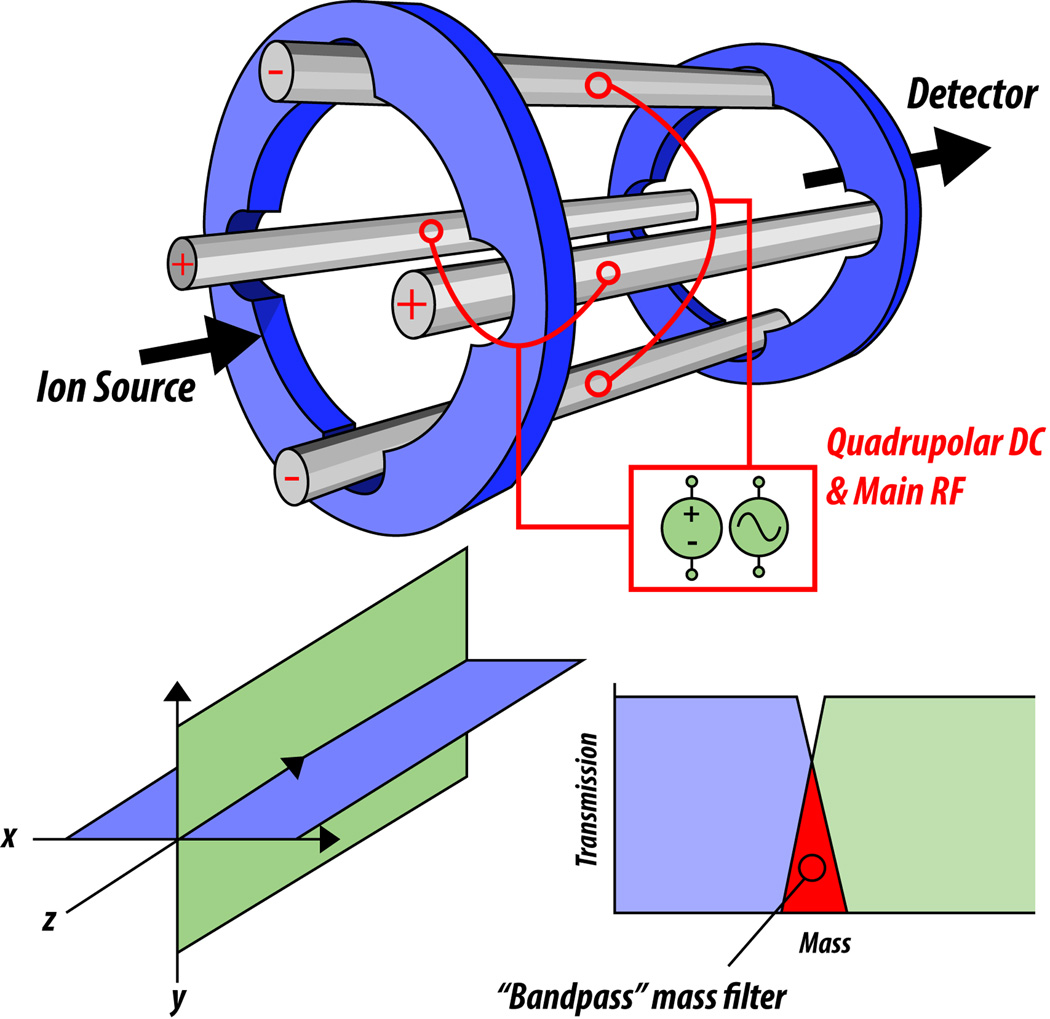
Having addressed topics of ion manipulation in a 2D quadrupolar trap, we shall now turn to a discussion of the quadrupole mass filter (QMF), also referred to as a “resolving quadrupole.” We will begin by saying that the Mathieu diagram has, in addition to the q axis that was the focal point of the 2D trap discussion, a vertical y-axis that represents a, another unit-less variable related to ion motion within a quadrupolar field. The difference between a quadrupolar trap and a resolving quadrupole is that the latter has a quadrupolar DC applied to its rods. This quadrupolar DC is brought about by applying an equal amplitude but opposite sign voltage to rod pairs of the quadrupole. The rods opposite of each other in space have the same sign (for example, they are both positive) while the other pair of rods opposite each other are of the opposite sign (Figure 7). This difference in sign is what differentiates the effect of quadrupolar DC from the potential well of the ion trap. Because the quadrupolar DC is of opposite sign, it produces a complex effect on the field in the resolving quadrupole.
Figure 7. The quadrupole mass filter (QMF) acts as a bandpass mass filter.
The rods of the QMF have applied AC and DC that affect the transmission of ions through the structure. As before, the main RF serves to radially confine ions, while extra quadrupolar DC, applied at equal amplitude but opposite sign to different rod pairs, allows the selection of a narrow m/z range of ions due to stability in the separate x-z and y-z dimensions.
Much like the ion trap, the resolving quadrupole also uses AC to confine ions radially. Resolving quadrupole AC maintains the same frequency throughout operations but its amplitude is adjusted for scanning functions, just as in the ion trap. By increasing the AC amplitude the q values of ions within the field increase as more force is applied to them. But, because of the quadrupolar DC that is also applied within the resolving quad, we are no longer just dealing with the stability on the q axis as in the ion trap. Ion stability within the field now depends on the a variable from the Mathieu equation as well. The parameter a is determined by the amplitude of the quadrupolar DC.
It is useful to think of ion motion within a QMF in two dimensions: the x-z (left/right and lengthwise) and the y-z (up/down and lengthwise; see lower left of Figure 7). By changing the AC amplitude and the DC amplitude, movement in both of these dimensions is influenced depending on the m/z of the ion. Let us think about the x-z dimension first, which is fine because forces in each of the dimensions within the QMF are experienced by the ions independently of the other dimension. In QMFs, as opposed to ion traps, the ions are moving from one end to the other. Ions that make it through and out the other side go on to be detected or further analyzed. Ions that do not make it out are no longer available for analysis. So, why would ions not make it out?
In the x-z dimension, the ion motion resulting from increasing the amplitude of the AC applied to all the rods influences ions in the same way that it does in the trap. The electromagnetic force determined by the AC amplitude affects smaller m/z ions to a greater extent than it does larger m/z ions. This force, remember, determines the ions’ q value (the frequency with which it moves within the field). For a given AC amplitude, the smaller ions experience more force and thus more secular motion. If the secular motion is too great the ion will bump against the rods (and fall out as a neutral molecule) or slip out between rods in the radial dimension. This property is used to employ what is called the “high mass pass filter:” the mass above which the trajectory of ions in the x-z dimension is stable enough for the ions to make it out the other side. For example, one could set a high mass pass filter so that only ions above m/z 1000 make it through. To increase the pass filter—for example, so that only ions above m/z 1200 make it through—the AC voltage is increased.
In the y-z dimension within the QMF, ion motion is also subject to forces. Because the DC being applied to the rod pairs is of opposite sign, one set of the rods is negative. This means the ions, which are positive in most proteomic applications because they are polypeptides in low pH solvent, are drawn to the negative rods. However, while they are being drawn to these rods, the radial confinement force from the AC amplitude pushes back against them. For small ions, the radial confinement force is large enough to overcome the attractive force of the quadrupolar DC; these ions are pushed back into the central path and make it out the other side of the QMF. Larger ions, on the other hand, have too much inertia and are not pushed back in—the radial confinement force is not big enough for these large ions. Therefore, the large ions either bump into the rods and fall out as neutrals or escape through the space between rods in the radial dimension—either way they are gone from the analysis. Thus, the attractive quadrupolar DC produces the “low mass pass filter:” the mass at which ions must be below in order to pass through the QMF (Figure 7, lower right).
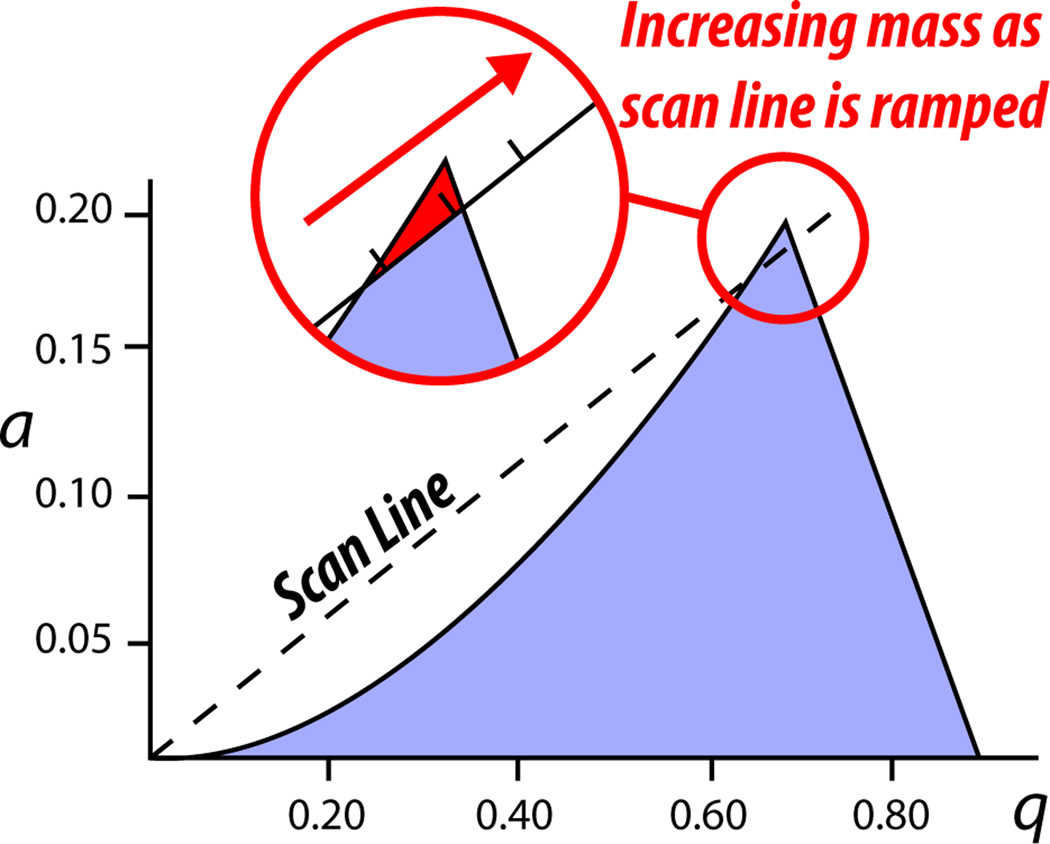
So, within a QMF there is the attractive quadrupolar DC force drawing ions to the negative poles, while, at the same time, there is the AC being applied that exerts radial confinement force as well as induces secular motion (indicated by q). The m/z range where ions are big enough so that their secular motion is confined (low q value), yet small enough so that the radial confinement force is larger than the attractive quadrupolar DC force for that ion, is adjusted by applying a DC amplitude that elevates the x-axis on the Mathieu diagram vertically so that the triangular region of stability shrinks compared to that of the ion trap (Figure 8). For example, with the application of quadrupolar DC, instead of all ions within q of 0 – 0.908 being stable, now ions with a of, say, 0.15 to 0.20 (numbers are purely illustrative in this example) and a q of 0.6 to 0.8 exhibit a stable trajectory within the quadrupole and make it out the other side.
Figure 8. Scanning and stability in the QMF.
In terms of the Mathieu stability equation, ion stability in the QMF is dependent on both a and q parameters, which are themselves dependent on the quadrupolar DC and main RF, respectively. The m/z range of stability is adjusted by modulating the DC and AC so that the triangular region of ion stability shrinks to include just the tip of the stability region for ion traps. To pass through the QMF, ions must have a large enough m/z so that they are confined radially (their q is low enough) but small enough so that as they experience attraction to the negatively charged poles resulting from quadrupolar DC they are pushed back into the central path due to the radial confinement force pushing back on them (larger ions gain too much inertia to be pushed back on path). See text for full description.
Having described these two dimensions of stability and instability operative within a QMF, we can now describe how a scan is performed using a QMF. While keeping the proportion of AC amplitude to DC amplitude the same, which maintains the stability triangle at the a and q values throughout the mass range, each of these amplitudes are ramped up resulting in ions of increasing mass sequentially passing through the quadrupole. As the AC amplitude rises, the motion of the ions in the x-z dimension becomes influenced and those ions of sufficiently low mass experience too much secular motion to be contained within the rods (their q is too high). But, the AC amplitude also produces a radial confinement force that pushes back on the ions that are being drawn to the negative DC poles. If the ions are small enough, that radial confinement force pushes them back into the path of the QMF. Importantly, as the AC amplitude increases during the voltage ramp to increase ion secular motion, and thus bring ions of increasing size into the q range of stability (top of triangle, Figure 8), the radial confinement force is also increasing. In order to compensate for that increase in radial confinement force and continue to draw the ions toward the negatively charged DC poles, the DC amplitude is increased proportionally to the AC ramp. Taken together, we have just described a QMF scan.
The resolving quadrupole is frequently used as a mass filter (QMF) upstream of other mass analyzers in hybrid instruments or in combination with additional resolving quadrupoles, as is the case with triple quad instruments for multiple reaction monitoring (MRM) experiments. For filtering the mass of interest—that is, letting only the m/z of interest pass through the resolving quadrupole—the amplitude of the AC and DC needed to let that ion pass is calculated and applied. All the other ions do not make it out, only the ions within the defined isolation window (the triangle of stability in the Mathieu diagram) do.
Fourier-Transform Mass Analysis (Orbitrap)
So far we have discussed quadrupolar mass analyzers (ion traps and resolving quadrupoles). How do these compare to Fourier-Transform (FT)-based analyzers? In quadrupole analyzers mass-to-charge of ions is measured as a function of ion stability within the electromagnetic field. In FT-based analyzers, however, mass-to-charge is measured as a function of ion frequency during oscillatory motion. The Orbitrap uses an electromagnetic field to get the ions into oscillatory motion. The older cousin of the Orbitrap is the FT ion cyclotron resonance instrument, which uses a superconducting magnet to confine ions and establish oscillatory motion. FTMS is therefore a general term encompassing both types of FT mass spectrometers that offer 100–1000 times greater resolving power and mass accuracy than either quadrupoles or ion traps.
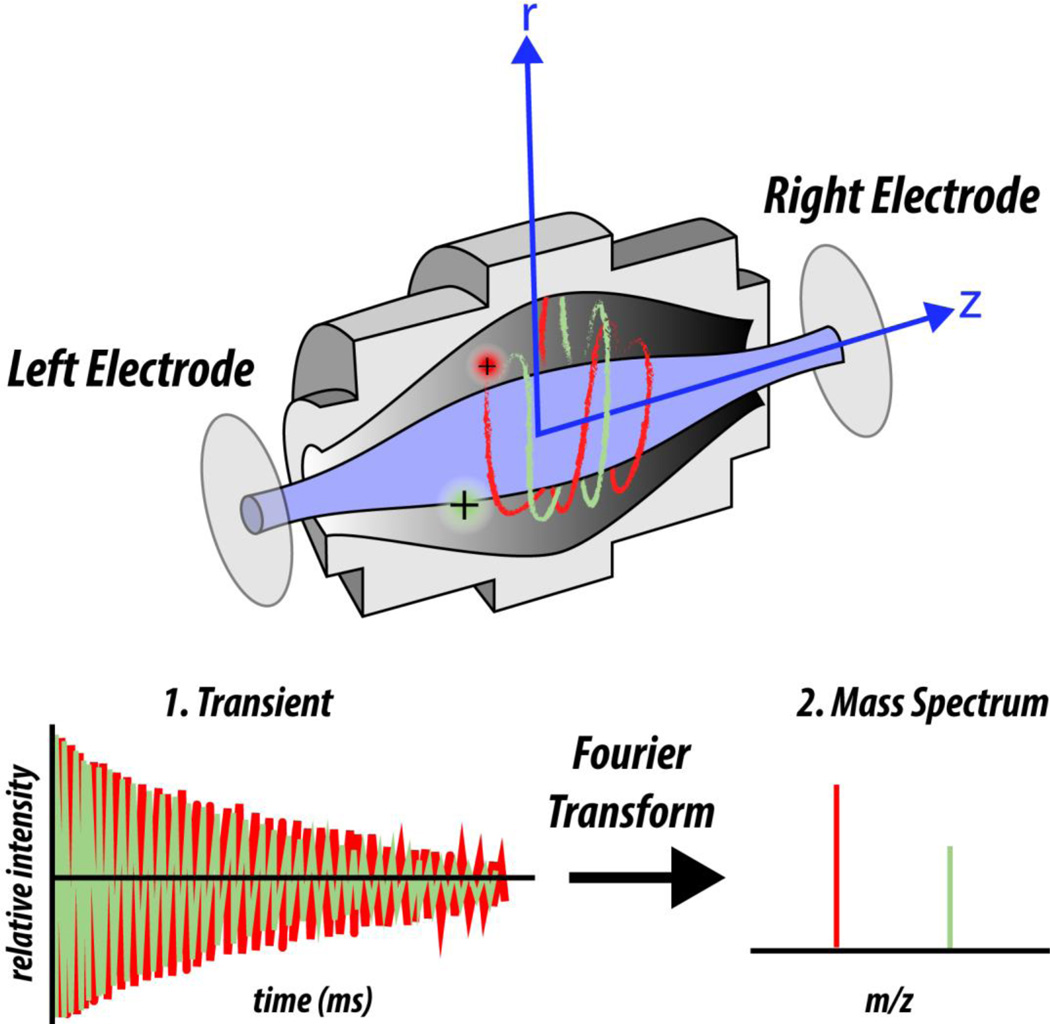
Within the Orbitrap the frequency of ion oscillation in the time domain is measured, with all m/z species measured simultaneously (Figure 9). Due to electromagnetic forces experienced by the ions from the quadrologarithmic field generated by the Orbitrap electrodes, ions oscillate in the axial dimension while also orbiting around a central electrode (Figure 9). It is the frequency of oscillatory motion in the axial dimension that is measured for each ion. To measure the frequency, the Orbitrap is cut cross-sectionally in two such that there is a left and a right electrode (Figure 9). As ions oscillate in the axial dimension they move from the region of one electrode to the other. Because ions are charged, the electrodes sense the moving charge; this is the signal that is collected for ion oscillatory frequency. Ion oscillatory frequency depends on ion m/z, analogous to how ion stability in quadrupole analyzers depends on m/z. To perform a scan, ions within a range of m/z are injected into the Orbitrap and the oscillatory motion of each population is measured simultaneously. To produce a mass spectrum, the time domain oscillation data is converted to the frequency domain using the Fourier transformation, which is then converted to m/z spectral data (Figure 9). Although the math is complex, the critical point to remember is that we know the parameters of the electromagnetic field and we also know how m/z’s respond to that field. After measuring how ions respond we can calculate their masses.
Figure 9. The Orbitrap FT mass analyzer.
In the Orbitrap, ions oscillate around a central spindle-like electrode while also oscillating in the axial dimension. Axial oscillation is detected by electrodes to yield a transient, which is transformed into the resulting mass spectrum by the Fourier transformation. The transient is the frequency of ion oscillation in the axial dimension and will be unique for each m/z. Unlike in ion traps and QMFs that require a voltage ramp to detect different m/z’s sequentially, in the Orbitrap all m/z’s are detected simultaneously.
When ions first enter the Orbitrap, an electric potential ramp is applied that causes the ions to squeeze close to the central axial electrode. Ions squeeze in proportion to their m/z, with lower m/z populations squeezing tighter to the axis. This ion squeezing allows for multiple different m/z populations to oscillate about the axial electrode simultaneously without bumping into each other; they adopt different diameters of orbit in the radial direction due to the mass-dependent effect this radial force has upon them. The measured amount of time of the ion current passing between the electrodes is directly proportional to the resolution of the resulting m/z spectrum. Thus, the longer the measurement the better the resolution, with one exception: de-phasing.
During oscillation within the Orbitrap, ions that entered and started oscillation as a nice tight packet start to de-phase, or forgo being a tight packet. De-phasing presents a problem for the Fourier transformation, as it averages the oscillatory signal across the length of the time-domain measurement, recorded in a “transient”. A transient that starts out great but ends up poor—due to ion de-phasing—will be negatively affected by the poor part of the transient. In an Orbitrap, there are ‘poor’ parts of the transient at the very beginning and toward the end, depending on transient duration. At the beginning, ion transient signal may not be stable until the ions settle into their oscillations. Toward the end, subtle ion collisions have added up to cause noticeable de-phasing. Software modifications allow what is called “apodization,” the removal of the front and back section of the transient signal from consideration in the FT calculation. Thus, apodization improves the resolution of the resulting mass spectrum. Another way to improve the quality of the transient is to wait to collect data until ions have settled into stable oscillatory motion within the trap.
Concluding Remarks
While this tutorial is far from comprehensive, our hope is that it will provide fundamental insight into how mass spectrometers work. With that fundamental insight in mind, readers are encouraged to go to the literature and supplement what they have learned here. There are a number of high quality papers for each aspect of mass spectrometry that we have discussed, including ion traps [9], quadrupole mass filters [10], and Orbitraps [5, 11, 12]. Readers will also find papers for all the other types of mass analyzers not described in this paper. With all mass spectrometers following the same basic principle—ions are controlled and measured in response to electromagnetic fields—we are confident the fundamentals laid out here will enable successful review of the literature, even for those not inclined toward complex math and physics. Ultimately, our hope is that biological and biomedical researchers from biology and clinical backgrounds will have improved ability to interact with domain experts to better translate the conversion of data to knowledge and improved research outcomes.
Acknowledgments
This work was supported by the National Institutes of Health P41 GM108569 and created to enhance its training and outreach activities. Any opinions, findings, conclusions or recommendations expressed in this material are those of the authors and do not necessarily reflect the views of the National Institutes of Health, the National Resource for Translational and Developmental Proteomics, or Northwestern University.
Footnotes
Conflict of Interest
NLK declares a conflict of interest with Thermo Fisher Scientific.
“Electric potential” or just “potential” are terms that indicate DC is being applied to an electrode and is thus producing an electric field. For example, a potential of -3 volts was applied to a multipole.
References
- 1.Guilhaus M. Principles and instrumentation in time-of-flight mass spectrometry. Journal of Mass Spectrometry. 1995;30:1519–1532. [Google Scholar]
- 2.Guilhaus M, Selby D, Mlynski V. Orthogonal acceleration time-of-flight mass spectrometry. Mass Spectrom Rev. 2000;19:65–107. doi: 10.1002/(SICI)1098-2787(2000)19:2<65::AID-MAS1>3.0.CO;2-E. [DOI] [PubMed] [Google Scholar]
- 3.Karas M, Hillenkamp F. Laser desorption ionization of proteins with molecular masses exceeding 10,000 daltons. Analytical chemistry. 1988;60:2299–2301. doi: 10.1021/ac00171a028. [DOI] [PubMed] [Google Scholar]
- 4.Marshall AG, Hendrickson CL, Jackson GS. Fourier transform ion cyclotron resonance mass spectrometry: a primer. Mass Spectrom Rev. 1998;17:1–35. doi: 10.1002/(SICI)1098-2787(1998)17:1<1::AID-MAS1>3.0.CO;2-K. [DOI] [PubMed] [Google Scholar]
- 5.Amster IJ. Fourier transform mass spectrometry. Journal of Mass Spectrometry. 1996;31:1325–1337. [Google Scholar]
- 6.Han X, Aslanian A, Yates JR. Mass Spectrometry for Proteomics. Current opinion in chemical biology. 2008;12:483–490. doi: 10.1016/j.cbpa.2008.07.024. [DOI] [PMC free article] [PubMed] [Google Scholar]
- 7.Patti GJ, Yanes O, Siuzdak G. Innovation: Metabolomics: the apogee of the omics trilogy. Nature reviews. Molecular cell biology. 2012;13:263–269. doi: 10.1038/nrm3314. [DOI] [PMC free article] [PubMed] [Google Scholar]
- 8.Lange V, Picotti P, Domon B, Aebersold R. Selected reaction monitoring for quantitative proteomics: a tutorial. Molecular systems biology. 2008;4:222. doi: 10.1038/msb.2008.61. [DOI] [PMC free article] [PubMed] [Google Scholar]
- 9.March RE. An introduction to quadrupole ion trap mass spectrometry. Journal of Mass Spectrometry. 1997;32:351–369. [Google Scholar]
- 10.Miller PE, Denton MB. The quadrupole mass filter: Basic operating concepts. Journal of Chemical Education. 1986;63:617–623. [Google Scholar]
- 11.Perry R, Cooks R, Noll R. Orbitrap mass spectrometry: Instrumentation, ion motion and application. Mass Spectrometry Reviews. 2008;27:661–699. doi: 10.1002/mas.20186. [DOI] [PubMed] [Google Scholar]
- 12.Scigelova M, Hornshaw M, Giannakopulos A, Makarov A. Fourier transform mass spectrometry. Molecular & Cellular Proteomics. 2011;10 doi: 10.1074/mcp.M111.009431. [DOI] [PMC free article] [PubMed] [Google Scholar]


