Publisher's Note: There is an Inside Blood Commentary on this article in this issue.
Key Points
Most AD-HIES mutations destabilize STAT3 protein, contributing to impaired STAT3 function.
STAT3 function is improved in immune cells from patients and a mouse model of AD-HIES by small-molecule protein stabilizers.
Abstract
Autosomal dominant hyper-IgE syndrome (AD-HIES) is caused by dominant-negative mutations in STAT3; however, the molecular basis for mutant STAT3 allele dysfunction is unclear and treatment remains supportive. We hypothesized that AD-HIES mutations decrease STAT3 protein stability and that mutant STAT3 activity can be improved by agents that increase chaperone protein activity. We used computer modeling to characterize the effect of STAT3 mutations on protein stability. We measured STAT3 protein half-life (t1/2) and determined levels of STAT3 phosphorylated on tyrosine (Y) 705 (pY-STAT3) and mRNA levels of STAT3 gene targets in Epstein-Barr virus–transformed B (EBV) cells, human peripheral blood mononuclear cells (PBMCs), and mouse splenocytes incubated without or with chaperone protein modulators—HSF1A, a small-molecule TRiC modulator, or geranylgeranylacetone (GGA), a drug that upregulates heat shock protein (HSP) 70 and HSP90. Computer modeling predicted that 81% of AD-HIES mutations are destabilizing. STAT3 protein t1/2 in EBV cells from AD-HIES patients with destabilizing STAT3 mutations was markedly reduced. Treatment of EBV cells containing destabilizing STAT3 mutations with either HSF1A or GGA normalized STAT3 t1/2, increased pY-STAT3 levels, and increased mRNA levels of STAT3 target genes up to 79% of control. In addition, treatment of human PBMCs or mouse splenocytes containing destabilizing STAT3 mutations with either HSF1A or GGA increased levels of cytokine-activated pY-STAT3 within human CD4+ and CD8+ T cells and numbers of IL-17–producing CD4+ mouse splenocytes, respectively. Thus, most AD-HIES STAT3 mutations are destabilizing; agents that modulate chaperone protein function improve STAT3 stability and activity in T cells and may provide a specific treatment.
Introduction
Autosomal dominant hyper-IgE syndrome (AD-HIES), or Job syndrome, is a life-shortening primary immunodeficiency and multisystem disorder characterized by developmental abnormalities, poor wound healing, and recurrent infections.1-7 There is no specific therapeutic intervention for patients with AD-HIES.8,9 Although a haploidentical donor hematopoietic stem cell transplant (HSCT) recently performed in an adolescence with AD-HIES restored immune function,10 an earlier attempt at bone marrow transplant was reported not to be successful,8 and syngeneic HSCT in a mouse model of AD-HIES only partially restored resistance to bacterial infection.11
AD-HIES is caused by dominant-negative mutations in signal transducer and activator of transcription 3 (STAT3), a transcription factor that plays a central role in the signal transduction pathway of multiple cytokines, growth factors, and other peptide hormones.2-4,6,7,12 In resting cells, STAT3 is located predominantly within the cytoplasm dimerized N-terminal-to-N-terminal (head-to-head).13 In peptide hormone–stimulated cells, STAT3 is recruited to phosphotyrosyl (pY) peptide motifs within activated receptor complexes through its Src homology 2 (SH2) domain, becomes phosphorylated at Y705, then dimerizes C-terminal-to-C-terminal (tail-to-tail). Tail-to-tail STAT3 homodimers accumulate within the nucleus, where they bind DNA and activate the promoters of genes involved in tissue injury repair, inflammation, and immunity.14 STAT3 mutations associated with AD-HIES are usually single-amino-acid missense mutations or single in-frame deletions that occur at 46 residues within the protein, predominantly within the DNA-binding domain (DBD) or the SH2 domain of STAT3.2-4,6,7 The dominant-negative effect of these mutations results from dilution of functional wild-type tail-to-tail (WT:WT) dimers by a threefold excess of dysfunctional dimers—mutant:mutant (M:M) and M:WT. A key issue remaining in understanding the molecular pathogenesis of AD-HIES is the specific molecular mechanism for dysfunction for each of the mutant STAT3 alleles and whether these mechanisms overlap and can be targeted for therapeutic benefit.
Our laboratory and others have shown that STAT3 requires chaperones to achieve its native conformation and function within the cell.12,15,16 Specifically, STAT3 requires interaction with the eukaryotic protein-folding machine or chaperonin, tailless-complex polypeptide-1 (TCP-1) ring complex (TRiC), for its biogenesis and folding.16 Multiple additional chaperones play a role in optimizing STAT3 protein function, especially heat shock proteins (HSP) 90 and HSP70, which raises the possibility that some mutated STAT3 proteins may be less stable and exceed chaperone capacity, resulting in misfolded STAT3 protein. Our results strongly support the hypotheses that AD-HIES STAT3 mutations reduce STAT3 function by decreasing STAT3 stability within the cell and that STAT3 function can be improved in cells from AD-HIES patients and a mouse model of AD-HIES by upregulating chaperone protein activity.
Methods
Stability modeling
To predict the impact of AD-HIES mutations on STAT3 stability, 5 protein stability predictors (PoPMuSiC 2.1,17 I-Mutant 2.0,18 MU Pro,19 SDM,20 and DFIRE21) were used to analyze the 77 STAT3 mutations identified in patients with AD-HIES that result in single-amino-acid residue substitutions or deletions. In addition, the functional importance of each mutated STAT3 residue was estimated using real-valued evolutionary trace methodology.22 See supplemental Data, available on the Blood Web site, for additional details.
Plasmids
Site-directed mutagenesis was performed for AD-HIES mutations R382W, V463del, V637M, and Y657S using a kit (QuikChange II; Agilent Technologies) and the pSG5 vector containing the human Flag-tagged STAT3 cDNA (kind gift of Shuo Dong, PhD, Baylor College of Medicine). Primers were designed using QuikChange Primer Design Program (www.genomics.agilent.com/primerDesignProgram.jsp). The sequence of each STAT3 mutant–containing plasmid was confirmed by sequencing.
In vitro transcription and translation
In vitro transcription and translation reactions (50 μL) were carried out using a rabbit reticulocyte lysate (RRL) system, as described.23 Briefly, RRL (TNTT7 Quick Coupled Transcription/Translation System; Promega) reactions included [35S]-methionine and 1 μg of pSG5 vector containing the insert of interest and were incubated for 30 minutes at 30°C, then terminated by the addition of 2 mM puromycin, 5 mM ethylenediamine tetraacetic acid, and 1 mM azide.
TRiC immunoprecipitation
TRiC immunoprecipitation was performed, as described.16 See supplemental Data for more details.
EBV cells and PBMCs
Venous blood samples were obtained from AD-HIES and non-AD-HIES patients at Texas Children’s Hospital (TCH) in Houston, Texas, and at the National Institutes of Health using institutional review board–approved protocols. PBMCs were isolated from anticoagulated blood by Ficoll-Hypaque sedimentation and a portion infected with Epstein-Barr virus (EBV) to generate EBV cells, as described.24 See supplemental Data for more details.
Cycloheximide chase assays
Cycloheximide (CHX) was purchased from Sigma-Aldrich and dissolved in cell media. EBV cells were treated with CHX (100 μM) to stop new protein synthesis, as previously described.25 Total STAT3 protein levels were measured over time using a Luminex bead-based assay and normalized to glyceraldehyde-3-phosphate dehydrogenase (GAPDH), which has a half-life (t1/2) of >72 hours, as previously described.26
Luminex assays
Luminex assays for pY-STAT3, total (t) STAT3, GAPDH, activated caspase 3, HSP70, and HSP90 was performed, as described.27 See supplemental Data for more details.
Quantitative RT-PCR
Quantitative reverse-transcription polymerase chain reaction (RT-PCR) was performed, as described.27 See supplemental Data for more details.
Cytokines, HSF1A, and GGA
Recombinant human IL-6 and IL-21 were obtained from R&D Systems. The chemical structure of HSF1A was obtained28 and custom synthesized by ChemBridge Corporation. HSF1A was dissolved using dimethyl sulfoxide (DMSO) to a concentration of 25 mg/mL. GGA was purchased from Sigma-Aldrich and suspended in DMSO at 10 mg/mL. See supplemental Data for more details.
Phosphoflow
PBMCs from healthy donors and AD-HIES patients were isolated by Ficoll-Paque density gradient (GE Healthcare), cryopreserved in fetal bovine serum (GE Biosciences) containing 10% DMSO (Fisher Scientific), and stored at −140 °C until further use. After thawing, PBMCs were resuspended in RPMI 1640 supplemented with 10% fetal bovine serum, glutamine, penicillin, and streptomycin (GIBCO) and incubated for 48 hours in the presence of GGA, HSF1A, or vehicle (DMSO) at a final concentration of 3 μM added daily to the cultures. After 2 days, PBMCs were washed; resuspended; rested for 2 hours in serum-free RPMI 1640 supplemented with GGA, HSF1A, or vehicle; then stained and analyzed as described in supplemental Data.
Th17 cell polarization and IL-17 intracellular staining
Total CD4+ T cells were enriched from splenocytes isolated from mut-Stat311 and cage-control, wild-type (WT) mice (6-10 weeks old) using a Mojosort mouse CD4+ T-cell isolation kit (BioLegend). CD4+ cells were incubated under Th17 cell polarizing conditions,29 washed, stimulated for 5 hours with the cell activation cocktail (BioLegend), permeabilized, and stained with anti–IL-17A APC (clone eBio17B7, eBioscience). Data were collected with BD LSR II and analyzed with Flowjo software (Tree Star).
Statistical analysis
STATa 11.2 was used for statistical analysis. See supplemental Data for more details.
Results
Computer modeling predicts that most STAT3 AD-HIES mutations are destabilizing and separates them into 3 categories: functional, structural, and structural-functional
We identified 87 unique STAT3 mutations reported in the literature.2-4,6,7,30-38 Seventy-four mutations are single-amino-acid missense mutations (involving 46 residues), 3 mutations are in-frame deletions, and 10 mutations contain larger deletions or duplications. We analyzed the 77 single-amino-acid substitutions and in-frame deletions using 5 computer-based programs to predict their impact on protein stability (supplemental Table 1). Each individual program predicted that most mutations are destabilizing; a composite analysis of all 5 programs predicted that 62 (81%) mutations were destabilizing (supplemental Table 1).
We next used Evolutionary Trace (ET) methodology to predict the functional importance of the STAT3 residues mutated in AD-HIES.39 Based on its location within the STAT3 crystal structure40 and other considerations, each STAT3 mutation has a high ET ranking, indicating a strong effect on STAT3 function (supplemental Table 2; supplemental Figure 1). We completed a second ET analysis for STAT3 mutations located within the SH2 domain, which allowed us to differentiate the predicted effect of a mutation on SH2 domain stability from its aggregate effect on STAT protein function (supplemental Table 2). Combining the ET ranking, solvent accessibility, and distance from the DNA-binding site or SH2 dimerization interface, we determined that 20 mutations were predicted to impair DNA binding, 25 mutations were predicted to impair dimerization, and 20 mutations were predicted to impair the folding of STAT3 (supplemental Table 2).
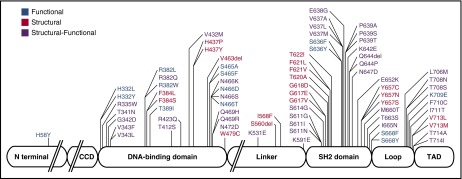
Combining this analysis with the stability predictions, we categorized each of the 77 mutations into 1 of 3 groups: functional, structural, or structural-functional (supplemental Table 3). Functional (F) mutations affect a domain-specific function of STAT3, such as DNA-binding or tail-to-tail dimerization, without affecting STAT3 stability. This category includes 15 mutations, such as the most common AD-HIES mutation, R382W, which is thought to directly impair DNA binding.40 Structural (S) mutations destabilize and impair the folding of STAT3, thereby indirectly affecting STAT3 functions such as DNA binding, phosphotyrosylation, or dimerization. This category includes 20 mutations, including the second most common AD-HIES mutation, V463del, located in the DBD, as well as several mutations in the SH2 domain “hot spot” at residue Y657 (ie, Y657S, Y657C, and Y657N). Structural-functional (S-F) mutations are predicted to be both destabilizing and to directly impair a domain-specific STAT3 function. This category includes 42 mutations, such as V637M, the most common mutation in the SH2 domain and the third most common AD-HIES mutation, overall (Figure 1; supplemental Table 3; supplemental Figure 2).
Figure 1.
Schematic model of STAT3 delineating the domain location and category assignment for each AD-HIES single-amino-acid missense mutation or in-frame deletion. Functional mutations are shown in blue; structural mutations are shown in red; structural-functional mutations are shown in purple.
STAT3 protein t1/2 and activity within AD-HIES patient EBV cells supports the computer-based categorization and stability predictions of STAT3 mutations
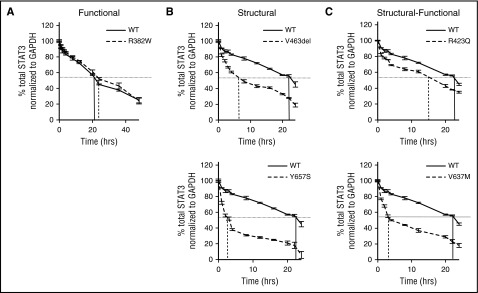
To test our computer-based categorization and stability predictions, we determined STAT3 protein t1/2, a surrogate marker for stability, using CHX chase assays in EBV cells from 8 AD-HIES patients and 2 controls (Figure 2; Table 1). Total STAT3 protein levels were measured over time after the addition of CHX, which inhibited new protein synthesis. The t1/2 of STAT3 protein within EBV cells containing STAT3 S or S-F mutations was reduced by 79% compared with control cells (P < .05; Figure 2B-C; Table 1). In contrast, the t1/2 of STAT3 protein in EBV cells containing the STAT3 F mutation, R382W, was similar to control cells (Figure 2A; Table 1). These results strongly support our computer-based categorization of AD-HIES STAT3 mutations and their predicted effect on STAT3 protein stability.
Figure 2.
STAT3 protein t1/2measurements in EBV cells from AD-HIES patients. Single representative experiments are shown for EBV cells with WT STAT3 and STAT3 F mutation R382W (A), EBV cells with STAT3 S mutations V463del or Y657S (B), and EBV cells with STAT3 S-F mutations R423Q or V637M (C). STAT3 protein t1/2 was determined as time after CHX addition until STAT3 levels decreased to 50% of starting level, as indicated by vertical lines.
Table 1.
Computer modeling accurately predicts STAT3 protein t1/2 in EBV cells generated from 8 of 8 AD-HIES patients
| Mutation category | Genotype (N)* | Stability prediction (stable = 0; unstable = 2) | Measured t1/2 ± SD (h) |
|---|---|---|---|
| None | wt/wt (N = 8) | Stable (0) | 25 ± 2 |
| Functional | R382W/wt (N = 4) | Stable (0.4) | 25.5 ± 3.3 |
| Structural | V463del/wt (N = 6) | Destabilizing (1) | 6.8 ± 4.8† |
| Y657S/wt (N = 6) | Significantly destabilizing (1.8) | 5.5 ± 4.1† | |
| T622I/wt (N = 4) | Destabilizing (0.6) | 18 ± 5.8‡ | |
| Structural-functional | R423Q/wt (N = 4) | Destabilizing (0.6) | 20 ± 2.3‡ |
| S611N/wt (N = 4) | Destabilizing (1.4) | 7 ± 3.6† | |
| N647D/wt (N = 4) | Destabilizing (0.8) | 18.5 ± 3‡ | |
| V637M/wt (N=4) | Destabilizing (1) | 5.3 ± 4.5† |
N = number of experiments performed with each EBV cell.
P < .0001 compared with WT.
P < .05 compared with WT.
Similar to results reported previously,41 cytokine induction of suppressor of cytokine signaling (SOCS) 3, a gene transcriptionally activated by STAT3, was reduced by 75% compared with controls in EBV cells in both the DBD mutation subgroup and the SH2 domain mutation subgroup (supplemental Figure 3A), which could be attributed, in the case of the SH2 domain subgroup, to reduced levels of cytokine-induced pY-STAT3 (supplemental Figure 3C-D) but not to reduced levels of total STAT3 (supplemental Figure 3B). Re-examination of the SOCS3 induction data after subgrouping AD-HIES EBV cells into F, S, and S-F categories revealed that EBV cells in each subgroup demonstrated reduced SOCS3 induction, as expected (supplemental Figure 3E). Of note, however, EBV cells in the STAT S-F mutation subgroup not only had reduced pY-STAT3 levels to explain reduced SOCS3 induction (supplemental Figure 3G-H), but their reduced pY-STAT3 levels could be explained by reduced levels of total STAT3 protein (supplemental Figure 3F). Thus, our categorization system revealed a new mechanism for reduced STAT3 function in AD-HIES patient cells (ie, reduced levels of total STAT3 protein).
STAT3 S mutant proteins have decreased interaction with TRiC and decreased biogenesis in vitro; STAT3 biogenesis and function can be improved by modulating TRiC levels or activity
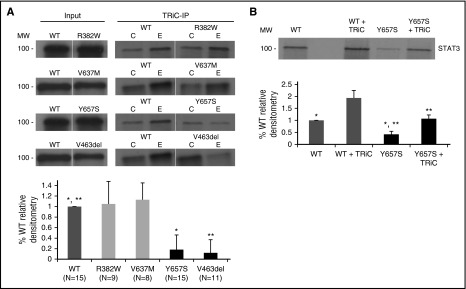
We recently demonstrated that interaction with TRiC is required for optimal STAT3 biogenesis and function.16 To determine whether impaired interaction with TRiC contributes to decreased stability and function of some mutant STAT3 proteins, 35S-labeled mutant and WT STAT3 proteins were expressed in rabbit reticulocyte lysates (RRL) and subjected to TRiC immunoprecipitation. STAT3 S mutant proteins, V463del and Y657S, demonstrated markedly reduced TRiC binding compared with STAT3 WT protein (P < .001; Figure 3A). In contrast, STAT3 F mutation R382W protein and S-F mutation V637M protein each had equivalent TRiC binding compared with WT protein. In addition to reduced binding to TRiC, the level of STAT3 S mutation Y657S protein produced in RRL was reduced to 47% of WT protein. Of note, addition of exogenous purified bovine TRiC (120 nM) normalized levels of STAT3 S mutation Y657S protein, indicating that the impaired biogenesis of STAT3 S mutant protein by RLL could be overcome by increasing the level and/or activity of TRiC (Figure 3B).
Figure 3.
STAT3 proteins containing S mutations have decreased interaction with TRiC. In vitro transcription/translation reactions were performed in RLL containing 35S-methionine and equivalent amounts of cDNA constructs encoding WT or mutant STAT3 without or with exogenous bovine TRiC (120 nM; TRiC) as indicated. In the top half of panels A and B, an equivalent fraction of each reaction was separated by sodium dodecyl sulfate polyacrylamide gel electrophoresis, in the case of panel A either before (Input) or after immunoprecipitation with anti-TRiC (TRiC-IP; column E) or control antibody (column C). Gels were dried and autoradiographed. In the bottom half of panels A and B, bands from multiple experiments (N as indicated or ≥3 where noted) were quantitated by densitometry and the mean ± SD plotted for each STAT3 cDNA construct. Differences in means of mutant constructs from WT are indicated by asterisks (*,** P < .001, Student t test).
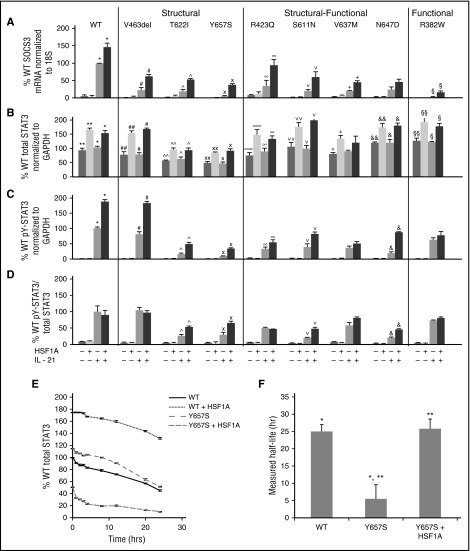
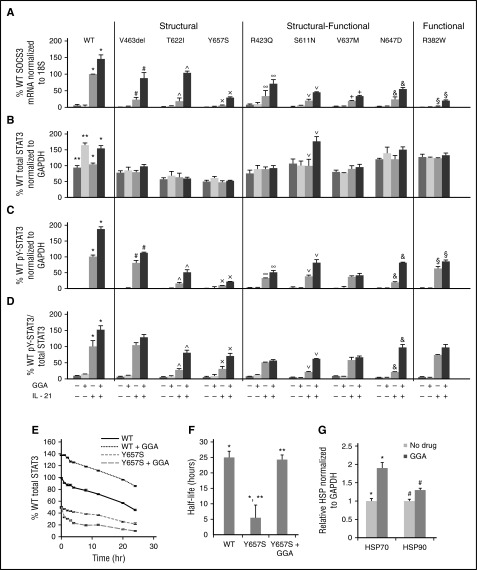
HSF1A is a small molecule reported to ameliorate protein misfolding in a cell line model of polyQ-mediated neurodegeneration by binding to and modulating TRiC function.28 To determine whether HSF1A could increase STAT3 levels and/or function, EBV cells from control and AD-HIES patients were incubated with HSF1A (3 μM) for 48 hours (conditions demonstrated to be optimal for maximizing cytokine-induced pY-STAT3 levels in EBV cells with STAT3 S mutation Y657S; supplemental Figure 4). Cytokine-induced SOCS3 mRNA levels in EBV cells containing S mutation V463del, T622I, or Y657S increased from 5.4% to 23% of WT to 38% to 62% of WT (P < .01; Figure 4A). Cytokine-induced SOCS3 mRNA levels also were increased by HSF1A in EBV cells containing S-F mutation R423Q, S611N, V637M, or N647D EBV cells from 20% to 34% of WT to 45% to 94% of WT (P < .01; Figure 4A). Cytokine-induced SOCS3 mRNA levels also were increased by HSF1A in EBV cells containing F mutation R382W, but the magnitude of improvement was less than seen in S and S-F mutations, as expected (P < .01; Figure 4A). To further confirm these results, we measured mRNA levels of additional STAT3 target genes, Bcl-6 and PRDM1 (supplemental Figure 5). HSF1A treatment of EBV cells containing S mutation Y657S or V463del increased cytokine-induced mRNA levels of Bcl-6 and PRDM by four- to 11-fold. HSF1A treatment in EBV cells containing S-F mutation V637M also increased mRNA levels of Bcl-6 and PRDM by 2.3- to 3.3-fold.
Figure 4.
HSF1A increased STAT3 function in AD-HIES patient EBV cells. EBV cells were treated with HSF1A (3 μM) for 48 hours, then stimulated with IL-21 (50 ng/mL). SOCS3 expression was measured by quantitative RT-PCR 120 minutes after stimulation (A). Total and phosphotyrosylated STAT3 and GAPDH were measured by Luminex 30 minutes after stimulation and results shown (B-D). STAT3 protein t1/2 determined (E-F; n ≥4 for each experiment). Comparisons of means marked by symbols *, **, #, ##, ^, ^^, ×, ××, ∞∞, ∨, ∨∨, +, &, &&, §, §§ indicate P < .01; ∞ indicates P < .05 ([A-D] analysis of variance [ANOVA]; [F] Student t test).
All cell lines demonstrated increased total STAT3 levels after treatment with HSF1A (Figure 4B) and all cell lines but 2 (S-F mutation V637M and F mutation R382W) demonstrated increased levels of cytokine-stimulated pY-STAT3 (Figure 4C-D), indicating that HSF1A improves STAT3 activity, at least in part by increasing total STAT3 levels in the cell. We next repeated the STAT3 protein t1/2 experiments with Y657S EBV cells after 48 hours of treatment with 3 μM HSF1A. Remarkably, HSF1A normalized the t1/2 of STAT3 in EBV cells containing S mutation Y657S (Figure 4E-F).
Geranylgeranylacetone (GGA) improved STAT3 function in AD-HIES patient EBV cells
In addition to TRiC, STAT3 requires interaction with HSP70 and HSP90 for optimal function in the cell.12,15 GGA is an antiulcer drug that induces expression of HSP70 and HSP90. When given to rats during intracerebral hemorrhage, GGA increased pY-STAT3 levels without affecting total STAT3, leading to decreased cell apoptosis and improved functional recovery.42 EBV cells from control and AD-HIES patients were incubated with GGA (3 μM) for 48 hours (conditions demonstrated to be optimal for maximizing cytokine-induced pY-STAT3 levels in EBV cells with S mutation Y657S; supplemental Figure 6). Cytokine-induced SOCS3 mRNA levels in EBV cells with S mutation V463del, T622I, or Y657S were increased from 5.4% to 23% of WT to 29% to 104% of WT with GGA treatment (P < .01). Cytokine-induced SOCS3 mRNA levels in EBV cells with S-F mutations R423Q, S611N, V637M, or N647D also were increased from 20% to 34% of WT to 34% to 71% of WT after GGA treatment (P < .01; Figure 5A). In addition, cytokine-induced SOCS mRNA levels in EBV cells containing F mutation R382W increased from 2.4% to 20% of WT with GGA treatment (P < .01; Figure 5A). GGA treatment also increased levels of cytokine-induced mRNA levels of Bcl-6 and PRDM1 three- to 12-fold in EBV cells with S mutation Y657S or V463del and by 1.8- to threefold in EBV cells containing the S-F mutation V637M (supplemental Figure 7).
Figure 5.
GGA increased STAT3 function in AD-HIES patient EBV cells. EBV cells were treated with GGA (3 μM) for 48 hours, then stimulated with IL-21 (50 ng/mL). SOCS3 expression was measured by quantitative RT-PCR 120 minutes after stimulation (A). Total and phosphotyrosylated STAT3 and GAPDH were measured by Luminex 30 minutes after stimulation (B-D). STAT3 protein t1/2 in a single representative experiment (E) and in multiple experiments (F; N = 3). Comparisons of means marked by symbols *, **, #, ^, ×,∨, +, &, §, indicate P < .01; ∞ indicates P < .05. Levels of HSP70 and HSP90 were determined without and with GGA in 2 experiments (G); *, # indicates P < .05.
Unlike HSF1A, treatment with GGA increased total STAT3 levels only in EBV cells containing STAT3 WT or STAT3 S-F mutation S611N (Figure 5B). In contrast, treatment with GGA increased cytokine-stimulated pY-STAT3 in all cell lines tested except one containing S-F mutation V637M (Figure 5C-D). We next performed STAT3 protein t1/2 experiments with Y657S EBV cells after 48 hours of GGA treatment. Like HSF1A, GGA normalized STAT3 protein t1/2 in EBV cells containing S mutation Y657S (Figure 5E-F).
As expected, GGA treatment increased levels of HSP70 protein by 1.9-fold and levels of HSP90 protein by 1.3-fold in EBV cells (Figure 5G; P < .05 for both), suggesting that increases in both HSPs contributed to increased STAT3 protein t1/2 and function. To further support the conclusion that the effect of GGA was mediated directly by its effects on HSP levels, especially levels of HSP70, we expressed GFP-HSP70 in EBV cells from a normal control (WT), or EBV cells containing STAT3 mutations V463del or Y657S, and measured levels of IL-21–induced SOCS3 mRNA (supplemental Figure 9). Ectopic expression of GFP-HSP70 resulted in increased IL-21–induced expression of SOCS3, especially in V463del EBV cells, supporting the conclusion that GGA increased STAT3 function by increasing HSP70 activity.
HSF1A and GGA increased levels of cytokine-induced pY-STAT3 in CD4+ and CD8+ T cells
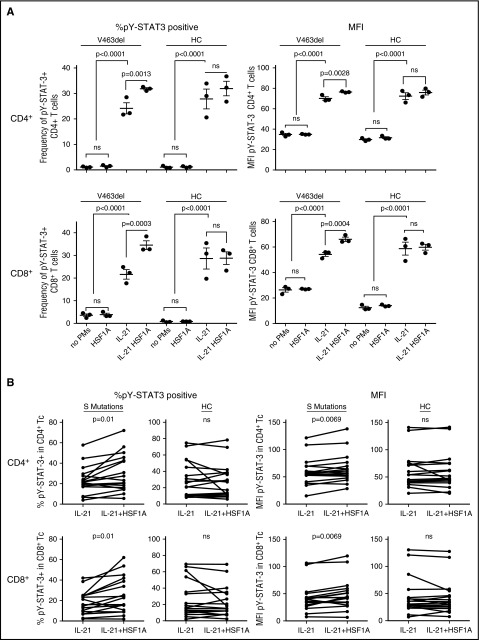
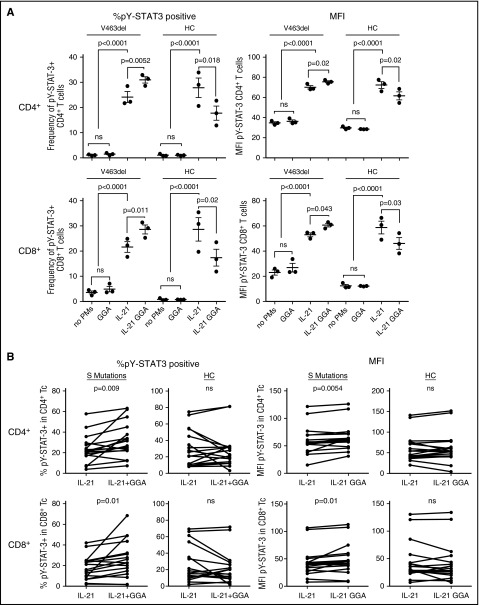
To determine if either HSF1A or GGA could improve STAT3 activity in primary immune cells from AD-HIES patients, PBMCs were isolated from a patient with V463del, the second most common STAT3 mutation overall and the most common STAT3 S mutation, and a healthy control. PBMCs were incubated in HSF1A or GGA in triplicate aliquots and examined by multiparametric flow cytometry for level of pY-STAT3 after stimulation with IL-21. Preincubation with HSF1A (Figure 6A) or GGA (Figure 7A) increased the percentage of IL-21–stimulated pY-STAT3–positive CD4+ T cells by 31% and 29% (P = .0013 and .0052, respectively) and their median fluorescence intensity (MFI) by 9% and 7% (P = .0028 and .02, respectively). Pretreatment with HSF1A or GGA also increased the percentage of pY-STAT3–positive CD8+ T cells by 60% and 32% (P = .0003 and .011, respectively) and their MFI by 24% and 14% (P = .0004 and .043, respectively). In contrast, preincubation of healthy control PBMCs with HSF1A did not change the percentage of pY-STAT3–positive cells or their MFI in either CD4+ or CD8+ T lymphocytes upon stimulation with IL-21, whereas preincubation with GGA, actually decreased pY-STAT3 frequencies and MFI in both CD4+ and CD8+ T cells (P < .03 for all). This effect of GGA to reduce pY-STAT3 frequencies and MFI was observed in ∼50% of PBMCs from healthy controls and indicates that the ability of GGA to increase the frequency of pY-STAT3–positive cells and the levels of pY-STAT3 per cell after IL-21 stimulation is specific to patient cells containing a mutant STAT3 allele.
Figure 6.
HSF1A increased STAT3 function in AD-HIES patient PBMCs. PBMCs from a patient with STAT3 S mutation V463del or a healthy control were each preincubated in triplicate aliquots with HSF1A and stimulated with IL-21, as noted before (A). PBMCs from 3 patients with STAT3 S mutation V463del, 1 patient with STAT3 S mutation F621V, and 7 healthy controls were incubated with HSFA1 and stimulated with IL-21, as noted before, each on ≥4 occasions (B). Results shown are percentage of pY-STAT3–positive cells and MFI in CD4+ and CD8+ T cells determined by multiparametric flow cytometry ([A] ANOVA; [B] paired Student t test). ns, not significant.
Figure 7.
GGA increased STAT3 function in AD-HIES patient PBMC. PBMC from a patient with STAT3 S mutation V463del or a healthy control were each preincubated in triplicate aliquots with GGA and stimulated with IL-21, as noted before (A). PBMCs from 3 patients with STAT3 S mutation V463del, 1 patient with STAT3 S mutation F621V, and 7 healthy controls were incubated with GGA and stimulated with IL-21, as noted before, each on ≥4 occasions (B). Results shown are percentage of pY-STAT3–positive cells and MFI in CD4+ and CD8+ T cells determined by multiparametric flow cytom ([A] ANOVA; [B] paired Student t test). ns, not significant.
To determine the robustness of these observations, PBMCs from 4 different AD-HIES patients with S mutations (3 patients with V463del and 1 patient with F621V) and 7 healthy controls were incubated in medium containing HSF1A (3 μM), GGA (3 μM), or vehicle for 48 hours and stimulated with IL-21 for 30 minutes. Each patient was tested in at least 4 independent experiments. Pretreatment with HSF1A (Figure 6B) or GGA (Figure 7B) increased the percentage of IL-21–stimulated pY-STAT3–positive CD4+ T cells by 28% and 35% (P ≤ .01 for both) and their MFI by 8% and 9% (P = .0069 and .0055, respectively). HSF1A and GGA also increased the percentage of pY-STAT3–positive CD8+ T cells by 39% and 45% (P = .01 for both) and their MFI by 13% for both (P = .0069 and .01, respectively). In contrast, preincubation of healthy control PBMCs with either PM had no effect indicating, as stated before, that the IL-21–stimulated increase in frequency of pY-STAT3–positive cells and the levels of pY-STAT3 per cell is specific to patient cells containing a mutant STAT3 allele.
HSF1A and GGA increase numbers of IL-17–producing CD4+ cell in cultures of mut-Stat3 mouse splenocytes
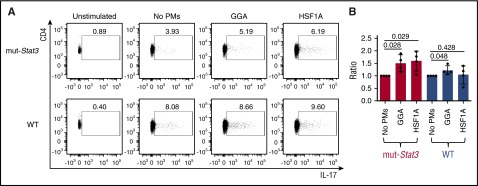
To determine whether GGA or HSF1A treatment can improve Th17 numbers, we incubated splenic CD4+ T cells isolated from the mut-Stat3 or cage-control, WT mice under conditions that support Th17 polarization in the absence or presence of GGA or HSF1A (Figure 8). All cells within the mut-Stat3 mouse contain 2 copies of the V463del STAT3 transgene, in addition to 2 WT Stat3 alleles; the mut-Stat3 mouse phenocopies AD-HIES patients, including their reduced ability to generate Th17 cells.11 As expected, the percentage of IL-17–producing CD4+ T cells in cell cultures from mut-Stat3 (3.12 ± 2.10) were reduced compared with those from WT mice (6.34 ± 3.37). Co-incubation of CD4+ cells from mut-Stat3 mouse spleens with GGA or HSF1A increased IL-17–producing cells by 49% (P = .028) and 59% (P = .029), respectively. In contrast, co-incubation of CD4+ cells from WT mouse spleens with GGA or HSF1A increased IL-17–producing cells by only 21% for GGA (P = .048) and not significantly for HSF1A (4%; P = .428), respectively.
Figure 8.
GGA and HSF1A increased IL-17A–producing cells within CD4+splenocytes from mut-Stat3 mice. Representative flow cytometry analysis (A) of TCR+ CD4+ T cells in splenocytes from mut-Stat3 or WT mice; IL-17A intracellular staining was performed upon isolation without PMA/Ionomycin stimulation (Unstimulated) or after incubation in Th17 polarizing conditions either without proteostasis modulators (no PMs) or with GGA (3 μM) or HSF1A (3 μM) and stimulation with PMA/Ionomycin. (B) The percentage of IL-17A–producing TCR+CD4+ cells measured in the presence of GGA or HSF1A was normalized to the percentage in the absence of proteostasis modulators and the mean and SD (vertical bars) plotted for each mouse in both the mut-Stat3 and WT groups (n = 4; P values determined using paired Student t test are shown).
Discussion
Using computer modeling, we assigned each STAT3 mutation reported in AD-HIES patients that results in a single amino acid substitution or deletion (77/87 known mutations) to 1 of 3 categories—functional (F), structural (S), or structural-functional (S-F). Mutations falling into the S and S-F categories were predicted to be destabilizing. Measurement of STAT3 protein t1/2 within EBV cells from AD-HIES patients confirmed the computer-based stability predictions. STAT3 S mutant proteins also demonstrated decreased interaction with TRiC, the major eukaryotic chaperonin, and were synthesized at a reduced rate in RRL, which was normalized by the addition of exogenous purified TRiC. Importantly, treatment of EBV cells containing STAT3 S or S-F mutations with HSF1A, a TRiC-activity modulator, or GGA, an inducer of HSP70 and HSP90, substantially increased cytokine-stimulated STAT3 transcriptional activity in AD-HIES EBV cells. Of note, HSF1A and GGA also improved the ability of STAT3 within AD-HIES patient CD4+ and CD8+ T cells to undergo cytokine-stimulated activation and the increased the number of IL-17–producing CD4+ T cells within cultures of mut-Stat3 splenocytes. These findings support the use of chaperone protein modulators as a novel treatment approach for AD-HIES patients, particularly those with STAT3 S and S-F mutations.
The dominant-negative effect of STAT3 mutations likely results from dilution of fully functional WT:WT tail-to-tail dimers by a threefold excess of dysfunctional dimers—M:M and M:WT. In cells containing a DBD mutation, the dysfunctional M:M and M:W dimers are tail-to-tail dimers unable to bind DNA with sufficient affinity to achieve gene activation.4 In cells containing an SH2 domain mutation, dysfunctional M:M and M:W dimers are locked in the head-to-head conformation because they are unable to form stable tail-to-tail dimers.43 Alternatively, the dominant-negative effect of AD-HIES STAT3 mutations may be caused, in part, by misfolding, aggregation, mistrafficking, or increased degradation of both the mutant and WT STAT3 protein. Retinitis pigmentosa and neurodegenerative diseases are examples of such diseases caused by autosomal dominant mutations.44
Our understanding of the molecular basis for dysfunction of each of the 87 AD-HIES STAT3 mutant alleles is evolving. STAT3 mutant dysfunction was initially linked to dysfunction of the domain containing the mutation, eg, STAT3 protein within EBV cells from AD-HIES patients with DBD mutations demonstrated impaired DNA binding but normal cytokine-induced STAT3 tyrosine phosphorylation4; STAT3 protein within EBV cells from AD-HIES patients with SH2 mutations demonstrated reduced cytokine-induced pY-STAT3 levels and/or dimerization but normal DNA binding.6 However, subsequent reports using EBV cells with DBD mutations demonstrated variable levels of cytokine-induced pY-STAT3 ranging from equivalent to significantly less than WT EBV cells45; an explanation for this additional abnormality was not provided. Our results indicate that STAT3 dysfunction within EBV cells containing DBD mutations extends beyond impaired STAT3 DNA binding to include reduced cytokine-induced pY-STAT3 levels, as well as reduced total STAT3 levels, both of which can be attributed to our finding that most DBD STAT3 mutations are destabilizing. Likewise, we showed that EBV cells containing S mutations, Y657S and T622I, within the SH2 domain have both impaired cytokine-induced tyrosine phosphorylation, as well as decreased levels of total STAT3 compared with WT, which has not been reported previously. Thus, our findings indicate that the molecular basis for defective STAT3 function in AD-HIES not only involves dysfunction of the domain in which the mutated residue is found, but also may be because the mutation has on overall STAT3 protein stability.
In this study, we examined the effects of 2 modulators of chaperone proteins, HSF1A and GGA, on STAT3 protein activity in EBV cells and PBMCs from AD-HIES patients. HSF1A increased cytokine-induced expression of STAT3 target genes in 7 of 8 patients’ EBV cells by as much as 79% of WT. In addition, HSF1A increased the percentages of cytokine-stimulated pY-STAT3 levels and the MFI per cell in CD4+ and CD8+ T cells within PBMCs of AD-HIES patients. HSF1A is a benzyl pyrazole derivative that binds to TRiC and was shown to alleviate aggregation and cytotoxicity of polyQ proteins expressed in neuronal precursor cells, as well as in a fruit fly model of polyQ-dependent toxicity.28 Our results showed that HSF1A increased STAT3 transcriptional activity in AD-HIES patients’ EBV cells by increasing levels of pY-STAT3 in 6 of 8 patients’ EBV cells. The increase in pY-STAT3 levels was mediated largely through an increase in the level of total STAT3 protein, which is consistent with the possibility that HSF1A improved the ability of TRiC to fold nascent mutant STAT3 protein.
GGA has been shown to bind to the substrate-binding domain of HSP70, which down-modulates its activity and increases proteostasis stress. Proteostasis stress has been shown to promote heat shock factor (HSF) 1 activation, resulting in induction of HSP expression, primarily HSP70, and, to a lesser degree, HSP90.28 Similar to HSF1A, GGA increased the STAT3 transcriptional activity in AD-HIES patients’ EBV cells by increasing levels of cytokine-stimulated pY-STAT3 in 8 of 8 patients’ EBV cells However, unlike HSF1A, GGA increased total STAT3 levels in only 1 of 8 patients’ EBV cells, suggesting its effects are not mediated through improved synthesis and folding of nascent STAT3 protein, rather through improved function of native STAT3. Importantly, GGA also increased levels of cytokine-stimulated pY-STAT3 in CD4+ and CD8+ cells within PBMCs of AD-HIES patients and increased IL-17A–producing CD4+ cells in cultured splenocytes from mut-Stat3 mice. GGA has been used safely as an anti-ulcer drug for >30 years in Japan; adverse reactions include headache, nausea, anorexia, diarrhea, constipation, skin rash, itching, and elevated liver enzymes, which are treated symptomatically and are self-limited. Thus, GGA merits further development into a potential treatment of AD-HIES either alone or in combination with HSCT. HSCT alone may resolve the immune cell deficiencies in AD-HIES,10 but residual STAT3 dysfunction, most likely in nonimmune cells, appears to cause persistent problems.8,11,46 Alternative approaches to increasing STAT3 levels and/or function in AD-HIES, such as gene therapy, pose the risk of increased rates of malignancy.47-49
In addition to suggesting novel approaches to AD-HIES, we believe that the findings reported here will have broader implications because modulation of protein stability may be beneficial in other primary immunodeficiencies that result from mutations in transcription factors, such as STAT150,51 and STAT5b,52 which are dominant-negative, because they function as homodimers, and may be destabilizing.
Acknowledgments
The authors thank John J. O’Shea (National Institutes of Health) for providing founder mut-Stat3 mice, the patients who donated blood samples for this research, their families, and Javier Chinen, who provided EBV cells lines from Texas Children’s Hospital patients under his care; Laura Segatori (Rice University), I. Celine Hanson, and Steven Ludtke for their input and guidance; and Jane Bocchini for her help with Adobe Illustrator.
This study was funded by the National Institutes of Health, National Eye Institute grant PN1EY016525 (D.J.T.), Eunice Kennedy Shriver National Institute of Child Health and Human Development grant K12 HD041648 (C.E.B.), and National Institute of General Medical Sciences grants GM79656 and GM66099 (O.L.); Cancer Prevention and Treatment Institute of Texas grant RP110291) (D.J.T.); the Stanley A. Plotkin Sanofi Pasteur Pediatric Infectious Disease Society Fellowship Award (D.J.T.); and National Science Foundation grants CCF-0905536 and DBI-1062455 (O.L.).
Footnotes
The online version of this article contains a data supplement.
The publication costs of this article were defrayed in part by page charge payment. Therefore, and solely to indicate this fact, this article is hereby marked “advertisement” in accordance with 18 USC section 1734.
Authorship
Contribution: C.E.B., K.N., and S.K. helped design and perform experiments, interpreted data, and helped write the manuscript; P.K. and O.L. performed evolutionary trace analysis and helped write the manuscript; M.M.K. and A.F. performed experiments; G.M. designed experiments and helped write the manuscript; and D.J.T. designed experiments, interpreted data, and helped write the manuscript.
Conflict-of-interest disclosure: The authors declare no competing financial interests.
Correspondence: David J. Tweardy, University of Texas MD Anderson Cancer Center, 1400 Pressler St, FCT12.5069, Unit 1463, Houston, TX 77030-3772; e-mail: djtweardy@mdanderson.org.
References
- 1.Davis SD, Schaller J, Wedgwood RJ. Job’s Syndrome. Recurrent, “cold”, staphylococcal abscesses. Lancet. 1966;1(7445):1013-1015. [DOI] [PubMed] [Google Scholar]
- 2.Holland SM, DeLeo FR, Elloumi HZ, et al. . STAT3 mutations in the hyper-IgE syndrome. N Engl J Med. 2007;357(16):1608-1619. [DOI] [PubMed] [Google Scholar]
- 3.Jiao H, Tóth B, Erdos M, et al. . Novel and recurrent STAT3 mutations in hyper-IgE syndrome patients from different ethnic groups. Mol Immunol. 2008;46(1):202-206. [DOI] [PubMed] [Google Scholar]
- 4.Minegishi Y, Saito M, Tsuchiya S, et al. . Dominant-negative mutations in the DNA-binding domain of STAT3 cause hyper-IgE syndrome. Nature. 2007;448(7157):1058-1062. [DOI] [PubMed] [Google Scholar]
- 5.Freeman AF, Avila EM, Shaw PA, et al. . Coronary artery abnormalities in Hyper-IgE syndrome. J Clin Immunol. 2011;31(3):338-345. [DOI] [PMC free article] [PubMed] [Google Scholar]
- 6.Renner ED, Rylaarsdam S, Anover-Sombke S, et al. . Novel signal transducer and activator of transcription 3 (STAT3) mutations, reduced T(H)17 cell numbers, and variably defective STAT3 phosphorylation in hyper-IgE syndrome. J Allergy Clin Immunol. 2008;122(1):181-187. [DOI] [PMC free article] [PubMed] [Google Scholar]
- 7.Woellner C, Gertz EM, Schäffer AA, et al. . Mutations in STAT3 and diagnostic guidelines for hyper-IgE syndrome. J Allergy Clin Immunol. 2010;125(2):424-432.e8. [DOI] [PMC free article] [PubMed] [Google Scholar]
- 8.Gennery AR, Flood TJ, Abinun M, Cant AJ. Bone marrow transplantation does not correct the hyper IgE syndrome. Bone Marrow Transplant. 2000;25(12):1303-1305. [DOI] [PubMed] [Google Scholar]
- 9.Kimata H. High-dose intravenous gamma-globulin treatment for hyperimmunoglobulinemia E syndrome. J Allergy Clin Immunol. 1995;95(3):771-774. [DOI] [PubMed] [Google Scholar]
- 10.Patel NC, Gallagher JL, Torgerson TR, Gilman AL. Successful haploidentical donor hematopoietic stem cell transplant and restoration of STAT3 function in an adolescent with autosomal dominant hyper-IgE syndrome. J Clin Immunol. 2015;35(5):479-485. [DOI] [PubMed] [Google Scholar]
- 11.Steward-Tharp SM, Laurence A, Kanno Y, et al. . A mouse model of HIES reveals pro- and anti-inflammatory functions of STAT3. Blood. 2014;123(19):2978-2987. [DOI] [PMC free article] [PubMed] [Google Scholar]
- 12.Sato N, Yamamoto T, Sekine Y, et al. . Involvement of heat-shock protein 90 in the interleukin-6-mediated signaling pathway through STAT3. Biochem Biophys Res Commun. 2003;300(4):847-852. [DOI] [PubMed] [Google Scholar]
- 13.Novak U, Ji H, Kanagasundaram V, Simpson R, Paradiso L. STAT3 forms stable homodimers in the presence of divalent cations prior to activation. Biochem Biophys Res Commun. 1998;247(3):558-563. [DOI] [PubMed] [Google Scholar]
- 14.Levy DE, Darnell JE Jr. Stats: transcriptional control and biological impact. Nat Rev Mol Cell Biol. 2002;3(9):651-662. [DOI] [PubMed] [Google Scholar]
- 15.Ghoshal S, Rao I, Earp JC, Jusko WJ, Wetzler M. Down-regulation of heat shock protein 70 improves arsenic trioxide and 17-DMAG effects on constitutive signal transducer and activator of transcription 3 activity. Cancer Chemother Pharmacol. 2010;66(4):681-689. [DOI] [PMC free article] [PubMed] [Google Scholar]
- 16.Kasembeli M, Lau WC, Roh SH, et al. . Modulation of STAT3 folding and function by TRiC/CCT chaperonin. PLoS Biol. 2014;12(4):e1001844. [DOI] [PMC free article] [PubMed] [Google Scholar]
- 17.Dehouck Y, Kwasigroch JM, Gilis D, Rooman M. PoPMuSiC 2.1: a web server for the estimation of protein stability changes upon mutation and sequence optimality. BMC Bioinformatics. 2011;12:151. [DOI] [PMC free article] [PubMed] [Google Scholar]
- 18.Capriotti E, Fariselli P, Casadio R. I-Mutant2.0: predicting stability changes upon mutation from the protein sequence or structure. Nucleic Acids Res. 2005;33(Web Server issue):W306-W310. [DOI] [PMC free article] [PubMed] [Google Scholar]
- 19.Zhou H, Zhou Y. Distance-scaled, finite ideal-gas reference state improves structure-derived potentials of mean force for structure selection and stability prediction. Protein Sci. 2002;11(11):2714-2726. [DOI] [PMC free article] [PubMed] [Google Scholar]
- 20.Worth CL, Preissner R, Blundell TL. SDM–a server for predicting effects of mutations on protein stability and malfunction. Nucleic Acids Res. 2011;39(Web Server issue):W215-W222. [DOI] [PMC free article] [PubMed] [Google Scholar]
- 21.Cheng J, Randall A, Baldi P. Prediction of protein stability changes for single-site mutations using support vector machines. Proteins. 2006;62(4):1125-1132. [DOI] [PubMed] [Google Scholar]
- 22.Mihalek I, Res I, Lichtarge O. A family of evolution-entropy hybrid methods for ranking protein residues by importance. J Mol Biol. 2004;336(5):1265-1282. [DOI] [PubMed] [Google Scholar]
- 23.Beckler GS, Thompson D, Van Oosbree T. In vitro translation using rabbit reticulocyte lysate. Methods Mol Biol. 1995;37:215-232. [DOI] [PubMed] [Google Scholar]
- 24.Mizuno F, Aya T, Osato T. Growth in semisolid agar medium of human cord leukocytes freshly transformed by Epstein-Barr virus. J Natl Cancer Inst. 1976;56(1):171-173. [DOI] [PubMed] [Google Scholar]
- 25.Cherney BW, Bhatia K, Tosato G. A role for deregulated c-Myc expression in apoptosis of Epstein-Barr virus-immortalized B cells. Proc Natl Acad Sci USA. 1994;91(26):12967-12971. [DOI] [PMC free article] [PubMed] [Google Scholar]
- 26.Franch HA, Sooparb S, Du J, Brown NS. A mechanism regulating proteolysis of specific proteins during renal tubular cell growth. J Biol Chem. 2001;276(22):19126-19131. [DOI] [PubMed] [Google Scholar]
- 27.Bharadwaj U, Eckols TK, Kolosov M, et al. . Drug-repositioning screening identified piperlongumine as a direct STAT3 inhibitor with potent activity against breast cancer. Oncogene. 2015;34(11):1341-1353. [DOI] [PMC free article] [PubMed] [Google Scholar]
- 28.Neef DW, Turski ML, Thiele DJ. Modulation of heat shock transcription factor 1 as a therapeutic target for small molecule intervention in neurodegenerative disease. PLoS Biol. 2010;8(1):e1000291. [DOI] [PMC free article] [PubMed] [Google Scholar]
- 29.McAllister F, Bailey JM, Alsina J, et al. . Oncogenic Kras activates a hematopoietic-to-epithelial IL-17 signaling axis in preinvasive pancreatic neoplasia. Cancer Cell. 2014;25(5):621-637. [DOI] [PMC free article] [PubMed] [Google Scholar]
- 30.Schimke LF, Sawalle-Belohradsky J, Roesler J, et al. . Diagnostic approach to the hyper-IgE syndromes: immunologic and clinical key findings to differentiate hyper-IgE syndromes from atopic dermatitis. J Allergy Clin Immunol. 2010;126(3):611-617, e611. [DOI] [PubMed] [Google Scholar]
- 31.Freeman AF, Renner ED, Henderson C, et al. . Lung parenchyma surgery in autosomal dominant hyper-IgE syndrome. J Clin Immunol. 2013;33(5):896-902. [DOI] [PubMed] [Google Scholar]
- 32.Papanastasiou AD, Mantagos S, Papanastasiou DA, Zarkadis IK. A novel mutation in the signal transducer and activator of transcription 3 (STAT3) gene, in hyper-IgE syndrome. Mol Immunol. 2010;47(7-8):1629-1634. [DOI] [PubMed] [Google Scholar]
- 33.Heimall J, Davis J, Shaw PA, et al. . Paucity of genotype-phenotype correlations in STAT3 mutation positive Hyper IgE Syndrome (HIES). Clin Immunol. 2011;139(1):75-84. [DOI] [PMC free article] [PubMed] [Google Scholar]
- 34.Powers AE, Bender JM, Kumánovics A, et al. . Coccidioides immitis meningitis in a patient with hyperimmunoglobulin E syndrome due to a novel mutation in signal transducer and activator of transcription. Pediatr Infect Dis J. 2009;28(7):664-666. [DOI] [PubMed] [Google Scholar]
- 35.Ma CS, Chew GYJ, Simpson N, et al. . Deficiency of Th17 cells in hyper IgE syndrome due to mutations in STAT3. J Exp Med. 2008;205(7):1551-1557. [DOI] [PMC free article] [PubMed] [Google Scholar]
- 36.Avery DT, Deenick EK, Ma CS, et al. . B cell-intrinsic signaling through IL-21 receptor and STAT3 is required for establishing long-lived antibody responses in humans. J Exp Med. 2010;207(1):155-171. [DOI] [PMC free article] [PubMed] [Google Scholar]
- 37.Kim HJ, Kim JH, Shin YK, Lee SI, Ahn KM. A novel mutation in the linker domain of the signal transducer and activator of transcription 3 gene, p.Lys531Glu, in hyper-IgE syndrome. J Allergy Clin Immunol. 2009;123(4):956-958. [DOI] [PubMed] [Google Scholar]
- 38.van de Veerdonk FL, Marijnissen R, Joosten LAB, et al. . Milder clinical hyperimmunoglobulin E syndrome phenotype is associated with partial interleukin-17 deficiency. Clin Exp Immunol. 2010;159(1):57-64. [DOI] [PMC free article] [PubMed] [Google Scholar]
- 39.Wilkins A, Erdin S, Lua R, Lichtarge O. Evolutionary trace for prediction and redesign of protein functional sites. Methods Mol Biol. 2012;819:29-42. [DOI] [PMC free article] [PubMed] [Google Scholar]
- 40.Becker S, Groner B, Müller CW. Three-dimensional structure of the Stat3beta homodimer bound to DNA. Nature. 1998;394(6689):145-151. [DOI] [PubMed] [Google Scholar]
- 41.He J, Shi J, Xu X, et al. . STAT3 mutations correlated with hyper-IgE syndrome lead to blockage of IL-6/STAT3 signalling pathway. J Biosci. 2012;37(2):243-257. [DOI] [PubMed] [Google Scholar]
- 42.Sinn D-I, Chu K, Lee S-T, et al. . Pharmacological induction of heat shock protein exerts neuroprotective effects in experimental intracerebral hemorrhage. Brain Res. 2007;1135(1):167-176. [DOI] [PubMed] [Google Scholar]
- 43.Mohr A, Fahrenkamp D, Rinis N, Müller-Newen G. Dominant-negative activity of the STAT3-Y705F mutant depends on the N-terminal domain. Cell Commun Signal. 2013;11:83. [DOI] [PMC free article] [PubMed] [Google Scholar]
- 44.Price BA, Sandoval IM, Chan F, et al. . Rhodopsin gene expression determines rod outer segment size and rod cell resistance to a dominant-negative neurodegeneration mutant. PLoS One. 2012;7(11):e49889. [DOI] [PMC free article] [PubMed] [Google Scholar]
- 45.Chandesris MO, Melki I, Natividad A, et al. . Autosomal dominant STAT3 deficiency and hyper-IgE syndrome: molecular, cellular, and clinical features from a French national survey. Medicine (Baltimore). 2012;91(4):e1-e19. [DOI] [PMC free article] [PubMed] [Google Scholar]
- 46.Yanagimachi M, Ohya T, Yokosuka T, et al. . The Potential and Limits of Hematopoietic Stem Cell Transplantation for the Treatment of Autosomal Dominant Hyper-IgE Syndrome. J Clin Immunol. 2016;36(5):511-516. [DOI] [PubMed] [Google Scholar]
- 47.Dong G, Chen Z, Kato T, Van Waes C. The host environment promotes the constitutive activation of nuclear factor-kappaB and proinflammatory cytokine expression during metastatic tumor progression of murine squamous cell carcinoma. Cancer Res. 1999;59(14):3495-3504. [PubMed] [Google Scholar]
- 48.Yadav SPS, Chanda R, Gathwala G, Yadav RK. Actinomycosis of tonsil masquerading as tumour in a 12-year old child. Int J Pediatr Otorhinolaryngol. 2002;63(1):73-75. [DOI] [PubMed] [Google Scholar]
- 49.Yu H, Pardoll D, Jove R. STATs in cancer inflammation and immunity: a leading role for STAT3. Nat Rev Cancer. 2009;9(11):798-809. [DOI] [PMC free article] [PubMed] [Google Scholar]
- 50.Sampaio EP, Bax HI, Hsu AP, et al. . A novel STAT1 mutation associated with disseminated mycobacterial disease. J Clin Immunol. 2012;32(4):681-689. [DOI] [PMC free article] [PubMed] [Google Scholar]
- 51.Tsumura M, Okada S, Sakai H, et al. . Dominant-negative STAT1 SH2 domain mutations in unrelated patients with Mendelian susceptibility to mycobacterial disease. Hum Mutat. 2012;33(9):1377-1387. [DOI] [PMC free article] [PubMed] [Google Scholar]
- 52.Varco-Merth B, Feigerlová E, Shinde U, Rosenfeld RG, Hwa V, Rotwein P. Severe growth deficiency is associated with STAT5b mutations that disrupt protein folding and activity. Mol Endocrinol. 2013;27(1):150-161. [DOI] [PMC free article] [PubMed] [Google Scholar]


