

Abstract
By using fluorescence imaging, we provide a time-resolved single-cell view on coupled defects in transcription, translation, and growth during expression of heterologous membrane proteins in Lactococcus lactis. Transcripts encoding poorly produced membrane proteins accumulate in mRNA-dense bodies at the cell poles, whereas transcripts of a well-expressed homologous membrane protein show membrane-proximal localization in a translation-dependent fashion. The presence of the aberrant polar mRNA foci correlates with cessation of cell division, which is restored once these bodies are cleared. In addition, activation of the heat-shock response and a loss of nucleoid-occluded ribosomes are observed. We show that the presence of a native-like N-terminal domain is key to SRP-dependent membrane localization and successful production of membrane proteins. The work presented gives new insights and detailed understanding of aberrant membrane protein biogenesis, which can be used for strategies to optimize membrane protein production.
Author Summary
Malfunctioning of particular membrane proteins lies at the heart of some detrimental human diseases. The discovery and correction of bottlenecks in the cellular production of high quantities of membrane proteins for structure/function or drug discovery studies is a huge challenge. Single-cell studies have drastically improved our understanding of microbial physiology but have not been applied yet to protein production. We have studied transcriptional, post-transcriptional, and translational processes in single cells of the protein production host Lactococcus lactis and reveal new post-transcriptional obstructions in the synthesis pathway of heterologous membrane proteins. Recalcitrant membrane proteins do not form inclusion bodies but, instead, their transcripts accumulate at the cell poles in severely stressed L. lactis cells. Importantly, we show that the introduction of a new N-terminal fusion protein that improves recalcitrant membrane protein production coincided with a switch from polar mRNA accumulation to membrane-proximal mRNA localization.
Introduction
Integral membrane proteins are key elements in essential cellular processes such as signal transmission and membrane transport. Elucidation of their molecular structure is important since their malfunctioning lies at the heart of a great number of diseases and because they constitute important drug targets [1]. Cell-based expression systems are widely employed to produce convenient amounts of recombinant membrane protein for downstream biochemical characterization. In this respect, bacterial species are considered valuable production hosts, next to yeast and insect cells [2–4]. A significant bottleneck in the drug discovery pipeline, however, is that overexpression of membrane proteins in bacterial hosts such as Escherichia coli and Lactococcus lactis for structural and drug-screening studies remains a significant challenge. Therefore, ample research has aimed to elucidate the physiological responses of these bacteria to overexpression of membrane proteins by means of, for instance, transcriptomic and proteomic analyses in order to identify cellular constraints hampering production [5–7]. Although the ‘omics’ data give a good representation of the average state of the cells in a culture, they do not record problems in membrane protein production at the level of individual cells. Impediments might occur anywhere along the process, from transcription to translation to the insertion of correctly folded proteins in the cytoplasmic membrane. Functional synthesis of most polytopic membrane proteins is dependent on co-translational translocation realized by the signal recognition particle (SRP) pathway, which is responsible for the timely delivery of elongating, membrane protein-producing ribosomes to the membrane [8]. With the rise of techniques to peek inside single cells, the spatiotemporal background of processes that underlie problematic synthesis can now be identified and examined in great detail.
Recently, it was shown in E. coli that mRNA species encoding SRP-dependent proteins (mostly integral membrane proteins) display translation-dependent membrane localization, including polycistronic mRNAs containing ORFs for both soluble and integral membrane proteins [9–11]. All other mRNAs, including those of the SecB-dependent periplasmic and outer membrane proteins, were maintained throughout the cytoplasm [9]. The SRP-dependent pathway is conserved among all kingdoms of life, but the subset of molecular components deviate between species [12]. The notion that mRNAs of SRP-dependent proteins have a defined spatial organization in bacteria is extremely important in this context. Since codon choice and tRNA-availability differ between cells of prokaryotic or eukaryotic origin, the signal that is responsible for SRP interaction may be unavailable when trying to express a non-optimized gene in an evolutionarily distinct host. It is therefore tempting to speculate that mRNAs, and the heterologous membrane proteins they encode, might not be properly targeted to the membrane due to a lack of the correct bacterial ZIP-code for balanced SRP-dependent membrane delivery.
To address the impact and effect of mRNA targeting on heterologous production of membrane proteins, we investigated the spatial organization of membrane protein-encoding mRNAs in L. lactis at the single cell level. In contrast to mRNAs of well-expressed membrane proteins that localize at the membrane in agreement with previous studies, our results indicate that poorly expressed membrane proteins experience obstacles during translation, which eventually leads to accumulation of mRNA transcripts at the cell poles. These immobile mRNA clusters are spatially distinct from the location of protein aggregation seeds and from the site where the mRNAs are transcribed. They are also formed when translation is obstructed. Once their disassembly is initiated, a synchronized restoration of translation and growth takes place. Our findings add an empirical understanding of why heterologous membrane proteins are poorly expressed in bacterial hosts, and provide a time-resolved single-cell view on coupled defects in transcription, translation, and growth during aberrant synthesis.
Results
Transcripts of poorly expressing membrane proteins accumulate in immobile polar foci
Differential localization of bacterial mRNAs of SRP-dependent proteins has thus far only been shown to exist in E. coli [9–11]. Therefore, we first tested, by widefield fluorescence microscopy, whether mRNAs specifying either integral membrane proteins or cytoplasmic proteins adopt different subcellular sites in the Gram-positive bacterium L. lactis. L. lactis bcaP mRNA was chosen as a model encoding a well-expressed endogenous amino acid transporter [7,13]. L. lactis codY mRNA, coding for a central regulator of nitrogen metabolism [13], and gfp mRNA were utilized as representatives specifying cytoplasmic proteins. Fluorescence in situ hybridization (FISH) was adapted in order to be able to image transcripts with the same probe (ms2) by appending the transcripts with repetitive MS2 binding sites (12bs) (For validation of the method see S1 Text) [14,15]. The MS2 binding sites were chosen because these also allow for live cell imaging of the transcripts, as discussed below. Since we were specifically interested in the fate of various membrane-protein-mRNAs upon their overproduction, the nisin-induction system for overexpression (NICE) was used to produce recombinant mRNA and cognate proteins [16]. The successful production of STREPII-tagged BcaP and CodY proteins was confirmed by immunoblotting (S1A Fig). After 1 hr of induction with 5 ng/ml nisin, starting at mid-exponential phase, codY12bs and gfp12bs mRNAs were mainly detected in the cytoplasm outside the area occupied by the chromosome (Fig 1A and S1B Fig), while the bcaP12bs transcripts appeared as fluorescent patches along the inside of the cytoplasmic membrane (Fig 1B). We realize that pinpointing the location of overexpressed transcripts does not reflect the native situation. However, the production of recombinant membrane proteins traditionally uses multi-copy number expression vectors. Hence, we wanted to study the temporal and subcellular factors of membrane protein biogenesis in a malfunctioning scenario to understand (over)expression bottlenecks.
Fig 1. Transcripts of poorly expressing membrane proteins accumulate in immobile polar foci.
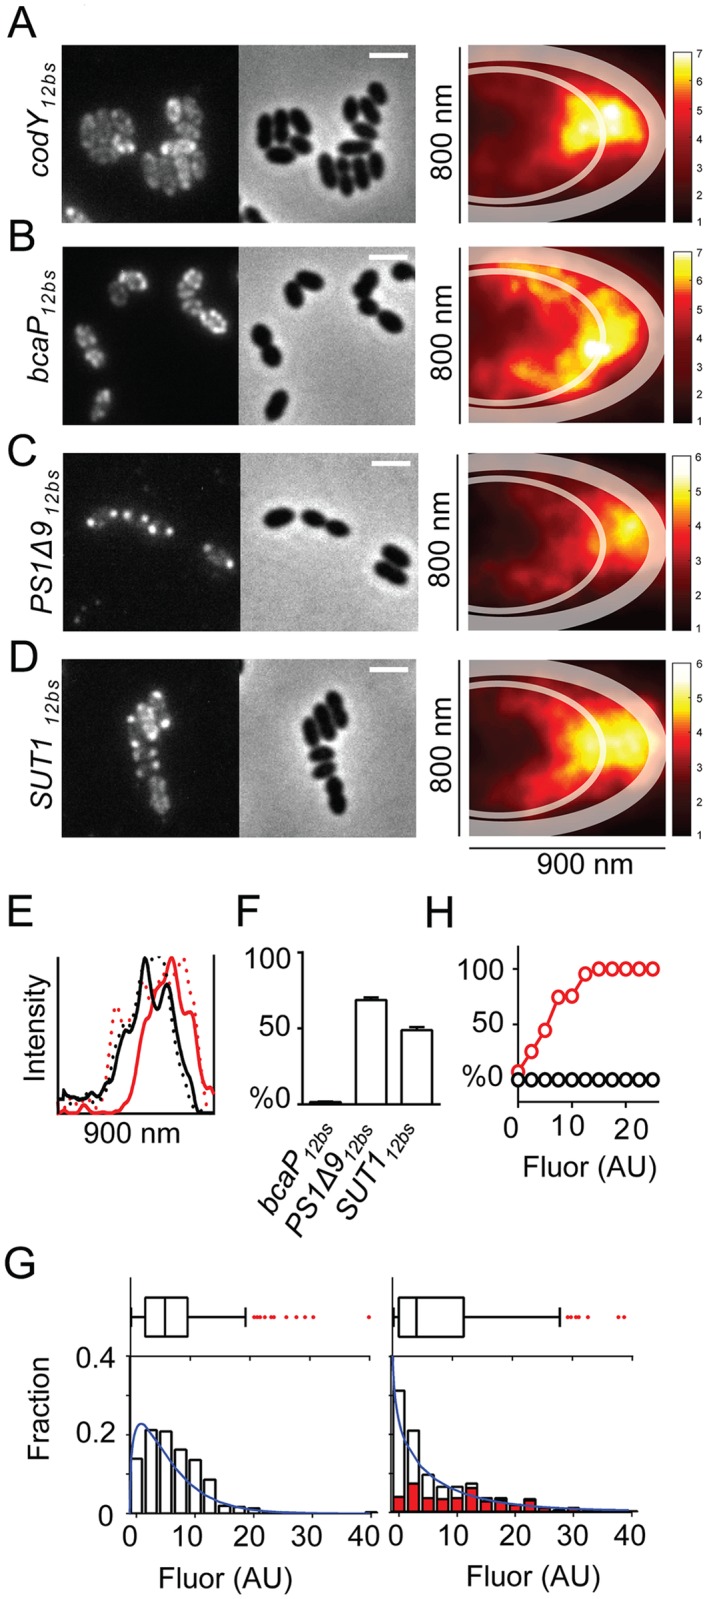
(A-D) Left panels: Localization of codY12bs, bcaP12bs, PS1Δ912bs or SUT112bs transcripts in L. lactis NZ9000 cells. Center panels: Corresponding phase contrast images. Scale bar = 2 μm. Colored panels: Location maps constructed from fluorescent TAMRA spots observed in 1185, 877, 765, and 661 cells, respectively, highlighting the preferential localization of each overexpressed mRNA in one half of a model cell. Thick transparent lines: Cell boundaries including the portion occupied by cell wall and membrane as approximated using BcaP-GFP expressing cells (See S1C Fig). Thin transparent lines: Boundaries of chromosomal areas as approximated using DAPI staining in living cells (See S1C Fig). Scale bars depict the relative density of each mRNA species. (E) Intensity profiles drawn along the center of the X-axis of the location maps ((A-D), colored panels) of cells expressing bcaP12bs (solid black line), codY12bs (dotted black line), PS1Δ912bs (solid red line) or SUT112bs (dotted red line). (F) The percentage of cells with bcaP12bs, PS1Δ912bs, or SUT112bs polar mRNA clusters. Error bars: Standard errors. (G) The population-wide distribution of bcaP12bs or PS1Δ912bs mRNA content obtained from single-cell measurements depicted in box plots and histograms (lower panels). Red bars (right panel): The fraction of cells with polar PS1Δ912b mRNA clusters. Blue lines: Gamma distributions fitted to expression data. Fluor = fluorescence. (H) The percentage of cells containing polar bcaP12bs (black) or PS1Δ912bs (red) mRNA clusters plotted as a function of intracellular TAMRA levels (corresponding to bcaP12bs or PS1Δ912bs mRNA levels).
Next, we employed FISH to examine the localization of mRNAs encoding two poorly expressed heterologous membrane proteins: A sucrose transporter from Solanum tuberosum (SUT1) and the human γ-secretase component, Presenilin 1 missing exon 9 (PS1Δ9). Both proteins are only produced to levels less than 10% of that of BcaP [7,17]. In contrast to bcaP12bs, SUT112bs and PS1Δ912bs transcripts appeared as single bright fluorescent foci in one or both poles in the majority of cells (Fig 1C and 1D). We ruled out that the polar mRNA foci were methodological artifacts by visualizing untagged PS1Δ9 and bcaP mRNA with gene-specific FISH probes (S1 Text). In order to get a population-wide view of the subcellular distribution of the overexpressed transcripts, >600 randomly chosen cells expressing either bcaP12bs, SUT112bs, bcaP12bs, or codY12bs were further examined. Fluorescent spots inside the cells, as well as spot coordinates relative to the cell contour, were obtained using a Gaussian fitting algorithm in the ImageJ ISBatch plug-in [18]. The peak coordinates were normalized, and all spots were jointly projected in one half of a model cell (dimensions: 800×900 nm, based on the average length and width of L. lactis cells grown in GCDM*; S1C Fig). Location maps of subcellular fluorescence and intensity profiles thereof enabled further discriminating mRNA encoding CodY, BcaP, PS1Δ9, and SUT1 (Fig 1A–1E). bcaP12bs mRNA is localized along the cytoplasmic membrane, codY12bs mRNA molecules tend to accumulate at the periphery of the chromosome, while SUT112bs and PS1Δ912bs mRNA foci are mostly confined to the cell poles. Approximately half of the imaged cells expressing PS1Δ9 or SUT1 contained densely packed, polar mRNA clusters (Fig 1F) marked by spatially confined, yet bright fluorescence (S1D Fig). This type of mRNA-dense spots was far less pronounced or absent in cells expressing bcaP12bs or codY12bs, respectively (S1D Fig).
In a previous study, no clear differences in the population-averaged levels of transcripts were observed when producing different membrane proteins in L. lactis [17]. FISH analysis revealed that the population averages of bcaP12bs and PS1Δ912bs transcript levels were roughly similar, but that the distribution of mRNA levels per cell differed quite considerably between the two populations (Fig 1G). After induction, an increase in bcaP12bs transcript levels was evident when compared to non-induced cells, but this was less so in cells expressing PS1Δ912bs mRNA (Fig 1G). Instead, 50% of the latter cells contained very little, or no PS1Δ912bs mRNA. In cells with detectable levels of PS1Δ912bs mRNA, 90% had polar mRNA clusters (Fig 1G). A small fraction of these cells contained extremely high levels of PS1Δ912bs mRNA; cells with high levels of overexpressed mRNA were absent in the bcaP12bs-expressing population. In the remaining ~10% of cells, the PS1Δ912bs mRNA localized in a manner similar to that of overexpressed bcaP12bs transcripts. Higher intracellular levels of PS1Δ912bs mRNA correlated with a greater disposition for a cell to carry polar mRNA clusters (Fig 1H). This suggests that there is an expression window for this particular transcript above which cluster formation prevails (mRNA level >10 AU).
Live cell imaging reveals spatiotemporal aberration of heterologous-membrane-protein mRNA and a decline in transcription
FISH only provides a static view on mRNA localization. We implemented the MS2 system to label mRNAs in living cells to examine mRNA dynamics (For validation of the method see S1 Text) [11,19,20]. In this approach, transcripts extended with MS2 binding sites are specifically recognized by MS2 phage coat proteins fused to GFP. To detect the MS2 binding site-extended transcripts, L. lactis LG010 was created in which the MS2-GFP protein (MG4: optimized for use in L. lactis; see S1 Text) can be expressed from the chromosomal pseudo10 locus [21] using the inducible nisA promoter. Importantly, GFP in this study refers to a monomeric superfolder GFP optimized for L. lactis ([22]; see Materials and Methods). The spatial distribution of the different MS2-GFP-tagged mRNAs was similar to that observed with FISH (S2 Fig). Time-lapse movies revealed that many bcaP12bs mRNA foci were relatively slow-moving clusters that seemed to be associated with the membrane (S1 Movie). codY12bs mRNAs diffused as highly dynamic moieties; slow-moving foci similar to those present in bcaP12bs-expressing cells were absent (S2 Movie). PS1Δ912bs and SUT112bs mRNA formed static and long-lived clusters (>1 hr) at the cell pole (S3 and S4 Movies).
Growth of, and mRNA localization in PS1Δ912bs-expressing cells were followed over time using MS2-GFP (MG4). One-third of the cells did not grow and polar foci remained visible for up to 4 hrs (S5 Movie and Fig 2A and 2B). In another population tertile, polar foci redistributed into multiple smaller foci synchronously with a switch from prolonged (~3 hrs) growth arrest to cell expansion with disturbed division (S6 Movie and Fig 2A and 2B). The last fraction contained less intense fluorescent foci, an indication that PnisA-induced expression had been relatively low in these cells, that disappeared within 1 hr, after which growth continued as normal (S7 Movie and Fig 2A and 2B). Hence, only mild expression at the initiation of the time-lapse experiment led to microcolony formation after removal of polar mRNA clusters (Fig 2C). We identified a clear sequence of post-transfer PS1Δ912bs mRNA patterns (S5 and S6 Movies and Fig 2D). First, mRNA formed crescent patches at the poles. Then, a redistribution to spots with Gaussian distributions occurred. These spots eventually fell apart into multiple smaller foci and ultimately disappeared. Under identical conditions, bcaP12bs-expressing cells did not cease to grow, and PnisA-driven expression continued for 60–90 min after transfer from liquid medium to microscopy slides lacking the inducer nisin (S8 Movie and Fig 2E).
Fig 2. Time-resolved analysis of PS1Δ912bs mRNA abundance and localization using time-lapse microscopy.
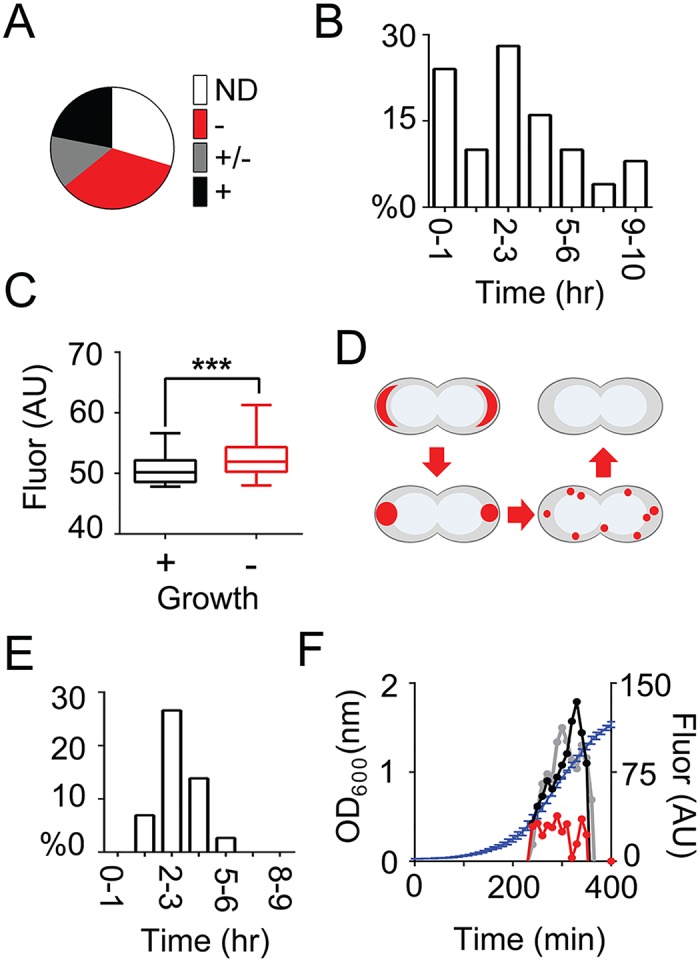
(A) PS1Δ912bs mRNA expression in L. lactis LG010 cells was induced following a standard regime after which the cells were transferred to a microscopy slide carrying a thin layer of 1.5% agarose dissolved in GCDM* lacking nisin, for time-lapse fluorescence microscopy analysis. Shown are the portions of 100 tracked cells that contain polar PS1Δ912bs mRNA clusters that do not divide after transfer (ND), that grow very poorly and adopt swollen and deviating cell shapes (-), that grow at a moderate rate (+/-) and that grow at a normal rate (+). (B) Histogram displaying the time it takes for 100 individual cells to remove MS2-GFP-tagged PS1Δ912bs mRNA clusters from their poles, as visualized with time-lapse microscopy. (C) Box plots displaying the initial MS2-GFP expression levels, which is directly correlated to the mRNA level, in PS1Δ912bs-expressing cells that either resumed growth (+) or remained in a non-growing state (-). A Students t-test was performed to test for significance (p<0.005). (D) Schematic representation of the post-transfer sequence of patterns adopted by MS2-GFP-tagged PS1Δ912bs mRNA (colored red). (E) Histogram displaying the time it takes for 100 individual cells to stop nisin A-driven transcription of bcaP12bs mRNA upon transfer of induced liquid cultures to agarose pads with growth medium lacking nisin A, as determined from MS2-GFP distributions in cells using time-lapse microscopy. (F) MS2-GFP expression (right axis) monitored in L. lactis LG010 cells after standard induction, expressing nothing (empty vector control; grey), BcaP (black), or PS1Δ9 (red) and their averaged growth (blue line, left axis). The MS2-GFP fluorescence values are normalized for OD600.
Using MS2-GFP, we consistently observed that there are at least two deviant subpopulations of PS1Δ912bs-expressing cells: Non-growing cells with mRNA clusters and dividing cells without any visible PS1Δ912bs mRNA. Presumably, the latter cells grew because they were either not (yet) induced or already had terminated PnisA-controlled transcription. PnisA-driven co-expression of MS2-GFP with PS1Δ9, but not with BcaP, decreased without affecting the population-wide growth (Fig 2F). Hence, either transcription from at least the nisA promoter or translation in general is abrogated in L. lactis cells producing recalcitrant membrane proteins. In any case, both scenarios create a negative feedback that contributes to reduced production yields.
Polar mRNA clusters are spatially unrelated to protein aggregation seeds
To examine if polar mRNA clusters correspond to sites of protein aggregation, BcaP and PS1Δ9 were fused to GFP. Even though GFP fused to the extra-cytoplasmic PS1Δ9 C-terminus likely interferes with its membrane insertion, information can still be gained on completion of translation, protein targeting, and protein-mRNA co-localization. The cells were induced to express BcaP-GFP or PS1Δ9-GFP for 1 hr, after which the level and subcellular localization of each of the GFP-tagged proteins and their respective mRNAs were examined using FISH. Cells with polar bcaP-gfp12bs mRNA clusters (<1% of the population) contained the highest amount of bcaP-gfp12bs transcripts, and held relatively high levels of BcaP-GFP (Fig 3A). The production window for bcaP12bs, defined as the range of mRNA levels that do not lead to mRNA clusters, was significantly wider than that of PS1Δ912bs mRNA (Fig 3B). PS1Δ9-GFP was clearly detected albeit at levels at least an order of magnitude lower than BcaP-GFP (Fig 3A–3C). No reports on inclusion bodies in L. lactis exist, but misfolded membrane proteins are known to co-fractionate with the membrane proteome [23]. In agreement, we occasionally observed membrane-proximal fluorescent protein aggregates, even in BcaP-GFP-expressing cells (S3A Fig). The protein aggregates did not typically co-occur with polar clusters of bcaP-gfp12bs mRNA. When present in the same cell, they did not co-localize (S3A Fig). No signs of PS1Δ9-GFP membrane insertion were detected. Rather, PS1Δ9-GFP was present as aggregation seeds [24] at the membrane (Fig 3C and S3B Fig). Of the larger PS1Δ9-GFP aggregates, the majority (90%) did not co-localize with, but was often found in the proximity of polar mRNA foci (Fig 3C).
Fig 3. Polar mRNA clusters are spatially unrelated to protein aggregation seeds.

(A) Single-cell bcaP-gfp12bs mRNA content plotted as a function of intracellular BcaP-GFP protein abundance. Red encircled dots: Cells with polar bcaP-gfp12bs clusters. (B) Single-cell PS1Δ9-gfp12bs mRNA content plotted as a function of intracellular PS1Δ9-GFP protein abundance. Red encircled dots: Cells with polar PS1Δ9-gfp12bs clusters. (C) Co-visualization of bcaP-gfp12bs or PS1Δ9-gfp12bs mRNA (FISH) with their protein products. Bottom panels: false-colored overlays of mRNA (red) and protein (cyan). Images were subjected to deconvolution to enhance the contrast. (D) Time course of fold changes (FC) of DnaK-GFP expression in L. lactis LG029, a strain in which dnaK was replaced with dnaK-gfp, after induction of expression of PS1Δ9 (red squares) or BcaP (black squares) compared to control cells (dashed grey line). (E) Co-visualization of DnaK-GFP and overexpressed PS1Δ912bs or bcaP12bs mRNA in L. lactis LG029. Right panels: False colored-overlays of DnaK-GFP (cyan) and mRNA (red). (F) DnaK-GFP levels in single L. lactis LG029 cells displayed as a function of levels of bcaP12bs mRNA (grey filled circles) or PS1Δ912bs mRNA (black dots). Black dots encircled in red: Cells with polar PS1Δ912bs clusters. Scale bar = 2 μm. Yellow lines indicate cell contours.
We attempted to indirectly detect (aggregates of) truncated or incompletely translated fusion proteins by localizing the molecular chaperone DnaK. DnaK associates with protein aggregates and inclusion bodies in E. coli [24,25]. Levels of DnaK-GFP were significantly elevated 15 min after initiation of PS1Δ912bs expression (Fig 3D). The cellular distribution of DnaK-GFP was examined in combination with FISH to visualize PS1Δ912bs or bcaP12bs mRNA. The distribution of DnaK-GFP inside bcaP12bs expressing cells was similar to that of DnaK-GFP in control cells (Fig 3E and S3C Fig). Clusters of DnaK-GFP only formed in PS1Δ9-expressing cells, but hardly ever at the pole(s), where PS1Δ912bs mRNA gathers (Fig 3E and S3C Fig). Rather, DnaK-GFP localized to the most intense PS1Δ9-GFP protein foci: DnaK foci are on average a similar distance away from polar PS1Δ912bs mRNA clusters as were the PS1Δ9-GFP foci (S3D Fig). Location maps of PS1Δ9-GFP and DnaK-GFP foci show that they have very comparable intracellular distributions, which are quite different from that of PS1Δ912bs mRNA (S3E Fig). Although no overlap in localization between polar PS1Δ912bs mRNA clusters and DnaK-GFP was observed, elevated levels of DnaK-GFP are correlated with the presence of polar PS1Δ912bs mRNA clusters, indicating that those cells are, or have been, under severe stress (Fig 3F).
Plasmids predominantly co-localize with the nucleoid, not with mRNA-dense polar clusters
We entertained the possibility that pNZ8048 plasmids are predominantly present in the cell pole(s) like other multi-copy number plasmids, which might seed the formation of foci for mRNAs of poorly expressed membrane proteins due to high local transcription [26–28]. Plasmid pNZ8048 was visualized using a Gram-positive ParB/parS system (M. Kjos, J. Siebring, J.W. Veening, personal communication) and DNA FISH. A parS site was introduced in pNZ8048, pLG-BcaP and pLG-PS1Δ9, and L. lactis LG045a was constructed, a strain that constitutively produces low levels of ParB-GFP (the parS binding protein fused to GFP). The L. lactis NZ9000 genome does not contain a ParA homolog [29], allowing visualization of the subcellular location of parS-labeled pNZ8048 derivatives (Fig 4 and S4 Fig).
Fig 4. pNZ8048 plasmids predominantly localize in the chromosomal area, not with mRNA-dense polar clusters.
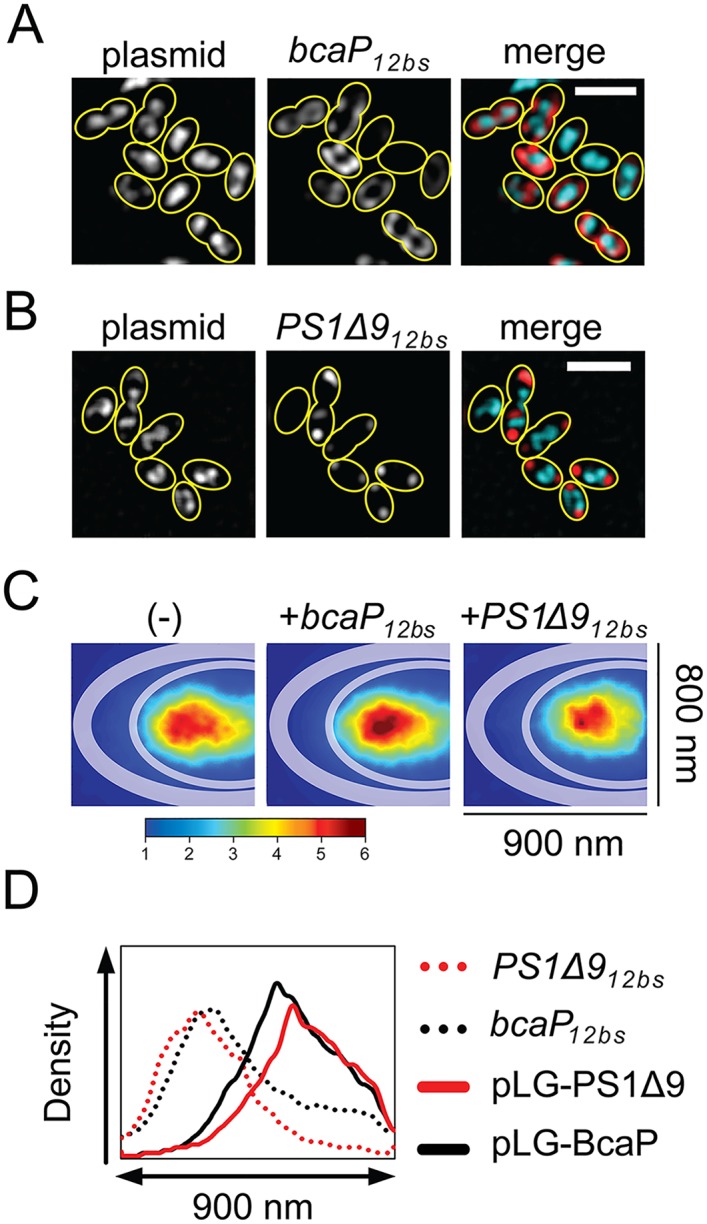
Plasmids tagged with parS/ParB-GFP were co-visualized with overexpressed bcaP12bs mRNA (A) or PS1Δ912bs mRNA (B) using FISH. Right panels show false-colored images in which mRNA and plasmids are represented in red and cyan, respectively. Images were subjected to deconvolution to enhance the contrast. Scale bar = 2 μm. Yellow lines indicate cell contours. (C) ParB-GFP in all of the captured cells (± 200 cells per experiment) were traced with the ImageJ PeakFinder plug-in and jointly projected into one half of a model cell as described earlier. The intracellular distribution of ParB-GFP foci under various gene expression scenarios (empty vector control (-), BcaP or PS1Δ9 expression) is represented as location maps to highlight the predominant sites of plasmid localization averaged over all cells. (D) Intensity profiles of overexpressed mRNA and co-visualized plasmids created from the location maps to illustrate differences in distribution of pLG-BcaP (black solid line), pLG-PS1Δ9 (red solid line), bcaP12bs (black dotted line), and PS1Δ912bs (red dotted line) along the X-axis of the model cells. Scale bars in microscopy images represent 2 μm.
ParB-GFP expressed in cells carrying pNZ8048 without a parS sequence distributed homogeneously (S4A Fig). Unlike some high-copy plasmids in other bacterial species [26–28], pNZ8048 primarily populates the area occupied by the chromosome in L. lactis (S4 Fig). Co-visualization of the plasmids and the full-length transcripts they specify shows that they are spatially separated (Fig 4A, 4B and 4D). Since our plasmid imaging approach does not have the time-resolution required to monitor rapid spatiotemporal changes, we cannot rule out the possibility that transertion, the coupled transcription, translation and translocation of membrane proteins, does not occur here [30]. Adding nisin to induce expression of bcaP12bs or PS1Δ912bs transcripts did not severely affect the location of pNZ8048-derived plasmids, but location maps of plasmids show that induction of PS1Δ9 caused the area occupied by plasmids to slightly shrink compared to control cells (Fig 4C and 4D).
Because polar clustering of PS1Δ912bs transcripts cannot be explained by the spatial distribution of pNZ8048, we reasoned that downstream processes, including targeting of mRNA for degradation or complications in synthesis of PS1Δ9 might be involved. The shrinkage of the area occupied by the plasmids (and nucleoid) suggests that transertion of PS1Δ9 is inhibited under these conditions.
The relationship between mRNA cluster formation, translation activity, and mRNA degradation
What is the effect of translation on the localization and degradation of the studied mRNAs? Are polar mRNA clusters still available for translation or could they correspond to bacterial analogs of dedicated mRNA degradation hubs that are found in eukaryotic cells during stress? In E. coli, treatment with translation-inhibiting kasugamycin results in a loss of membrane-localized mRNAs [9]. We observed the same with overexpressed MS2-GFP-visualized bcaP12bs mRNAs when L. lactis cells were treated with translation-inhibiting antibiotics erythromycin (Ery) and chloramphenicol (Cm) (Fig 5A). The bulky MS2-labeled mRNAs did not enter the nucleoid region due to chromosome condensation induced by Ery/Cm treatment [31–33] (S5A Fig). In contrast to bcaP12bs, PS1Δ912bs mRNA remained visible in the poles after antibiotics treatment. These structures apparently do not readily release transcripts upon inhibition of translation. To further investigate the effect of translation on mRNA localization, we mutated the aaggagg ribosomal binding site (RBS) on gfp12bs transcripts by changing it to aattcgg (S5B Fig), and employed the same strategy to disrupt the RBS on bcaP12bs and PS1Δ912bs. Using FISH, we observed that a high percentage of the cells expressing RBS-less bcaP12bs or PS1Δ912bs mRNA contained transcript clusters (Fig 5B and 5C). This suggests that the punctuate foci correspond to mRNAs that are blocked from translation. Closer examination (Fig 5D) of the population-wide localization of the RBS-less mRNAs revealed that they cluster more closely to the nucleoid (and thus also to the expression plasmids), while the RBS-containing PS1Δ912bs mRNA clusters are predominantly present at the cell poles (see also Fig 1C).
Fig 5. Effect of polar clustering and ribosome binding on degradation and localization of overexpressed mRNAs.

(A) L. lactis LG010 cells with MS2-GFP-tagged bcaP12bs or PS1Δ912bs mRNA treated or not with Cm and Ery. (B) FISH images of L. lactis NZ9000 cells expressing bcaP12bs or PS1Δ912bs mRNAs with or without functional RBS, and visualized by ms2 probe hybridization. (C) The percentage of cells (n = 500) expressing bcaP12bs or PS1Δ912bs with (+) or without (-) RBS and containing mRNA clusters. Error bars = standard errors. (D) Location maps constructed from FISH images of 500 cells showing the predominant distribution of bcaP12bs or PS1Δ912bs with or without RBS. (E) Snap shots of time-lapse microscopy of L. lactis(rpsB::rpsB-eYFP) cells expressing bcaP12bs or PS1Δ912bs. (F) Boxplots of the ratio between the S2-eYFP protein spread along the long cell axis and total cell length obtained from 100 cells expressing BcaP or PS1Δ9, as well as representative pictures of the corresponding S2-eYFP distributions. ***: A Student’s t-test was performed to test for significance (p<0.005). (G) Time (hr) required for individual PS1Δ912bs-expressing cells (n = 100) to restore growth after transfer to agarose pads lacking nisin, as determined by time-lapse microscopy. (H) Examples of PS1Δ912bs and SUT112bs transcripts remaining in cells after 32 min treatment with rifampicin. (I) RnY-GFP localization in fixed L. lactis LG024a cells expressing nothing (-), bcaP12bs, or PS1Δ912bs. Strain LG024a constitutively expresses rnY-gfp ectopically from its own promoter. The fusion gene was introduced additional to rnY to not interfere with essential mRNA breakdown.
The localization of ribosomes in L. lactis is similar to that in other bacteria: The major fraction of the S2-eYFP protein—and therefore ribosomes—localizes outside the nucleoid [32,34,35] (Fig 5E and S5C Fig). Time-lapse movies similar to those described above reveal that non-growing cells expressing PS1Δ9 undergo a reorganization of S2-eYFP localization from typically nucleoid-occluded to highly homogeneously distributed (Fig 5E). Since 70S ribosomes are not able to freely diffuse into the nucleoid [32,34,35], a homogenous distribution indicates a loss of 70S ribosomes, and thus of translation. Non-induced cells transferred to agarose slides lacking nutrients showed a similar phenotype, suggesting that the loss of 70S ribosomes overlaps with entry into a stationary-like growth phase (S5C Fig). Surprisingly, S2-eYFP is excluded from the poles in PS1Δ9-expressing cells (Fig 5F), which indirectly suggests that polar PS1Δ912bs mRNA clusters are not accessible for ribosomes. The finding that Ery/Cm treatment does not lead to a release of mRNA from polar clusters strengthens this supposition. Under similar conditions, in about the same time required for cells to get rid of polar MS2-labeled PS1Δ912bs clusters (Fig 2B), S2-eYFP localization and growth were restored to wild-type (Fig 5G).
Determining the lifetimes of mRNAs might help understanding the cause of the polar mRNA accumulation observed here. We treated cells expressing different transcripts and cognate proteins with rifampicin to stop translation, and used FISH to follow the level of each mRNA at several time points after rifampicin addition. We used FISH instead of Northern hybridization to obtain a population-wide quantifiable view on mRNA degradation. Thus, we were able to distinguish subpopulations of cells with significantly altered mRNA degradation parameters (see below). Considerable amounts of PS1Δ912bs (t½ = 10.9 min) and SUT112bs (t½ = 19.7) transcripts were still present after a 32-min treatment with rifampicin, in contrast to codY12bs (t½ = 7.1 min) and bcaP12bs (t½ = 6.2 min) (Fig 5H and S5D Fig). The degradation rate of codY12bs and bcaP12bs were in agreement with those reported previously (S5E Fig) [36], which shows that mRNA degradation rates in L. lactis are generally lower than those measured in other fast-growing bacterial species such as E. coli and B. subtilis [37–39]. Despite considerable deviations between experimental replicates, the half-lives of PS1Δ912bs and SUT112bs transcripts did not differ substantially from the estimated median half-life of all mRNAs in L. lactis (t½ = 10.9 min; S5E Fig). Separation of cells into populations that did or did not contain polar mRNA clusters, and recalculation of their half-lives, revealed that, in cells without polar mRNA clusters, PS1Δ912bs and SUT112bs mRNA is degraded at much higher rates than similar mRNA trapped inside polar mRNA clusters (PS1Δ912bs: t½ = 4.6 min and t½ (cluster) = 16.1 min; SUT112bs: t½ = 6.2 min and t½ (cluster) = 22.4 min; S5F Fig). Degradation of overexpressed PS1Δ912bs or bcaP12bs mRNA lacking an RBS takes place at a higher rate (t½ = ~2.5 and ~1.7 min, respectively) than the original transcripts (t½ = ~10.9 and ~ 6.2 min, respectively; S5G Fig). The fact that the RBS-less PS1Δ912bs and bcaP12bs mRNAs yielded nearly identical degradation curves indicates that the mRNA half-life of at least these two mRNA species is mainly influenced by ribosome occupancy in L. lactis. These results also imply that the observed slow degradation of PS1Δ9 mRNA does not originate from intrinsic signals in the alien mRNA sequence, but depends on binding of ribosomes and/or downstream processes. Importantly, the positioning of the major ribonuclease in Gram-positive bacteria, membrane-tethered RNase Y [40], remains unaffected by PS1Δ912bs or bcaP12bs overexpression (Fig 5I).
The presence of an endogenous N-terminal domain is key to SRP-dependent membrane localization
Could a defect in proper targeting of mRNA-ribosome complexes to the membrane play a role the mislocalization of the recombinant mRNAs? It is well known that SRP-dependent targeting is important for co-translational translocation, and that recognition of a membrane protein emerging from the ribosomes by SRP is dependent on signals located on the N-terminal domain of SRP-dependent proteins [9,41]. Optimization strategies by which slow codons are incorporated at specific sites might stimulate timely SRP recognition [42], and fusion tags can improve the guiding or initial insertion of heterologous RNC-ribosome-mRNA complexes to the membrane [43–45]. To test if the N-terminal domain of PS1Δ9 (PS1Δ9N) is less adequate for membrane-targeting in L. lactis than that of BcaP (BcaPN), we swapped both regions, including the first two transmembrane domains, and re-examined their mRNA localization (Fig 6A and 6B). Indeed, a high number of bcaPN-PS1Δ912bs transcripts was now localized at the membrane instead of in polar clusters (Fig 6B and 6C). Vice versa, PS1Δ9N-bcaP12bs mRNAs were mainly found in polar clusters (Fig 6B and 6C). Overexpression of the corresponding proteins was monitored using quantitative blotting, in which the membrane protein fractions of L. lactis cells were collected and directly spotted onto nitrocellulose membranes. In agreement, the replacement of the N-terminal domain of PS1Δ9 with that of BcaP dramatically elevated production yields, while the presence of the N-terminal PS1Δ9 domain lowered BcaP production (Fig 6E and 6F).
Fig 6. N-terminal domain of membrane proteins influences mRNA localization and protein production.
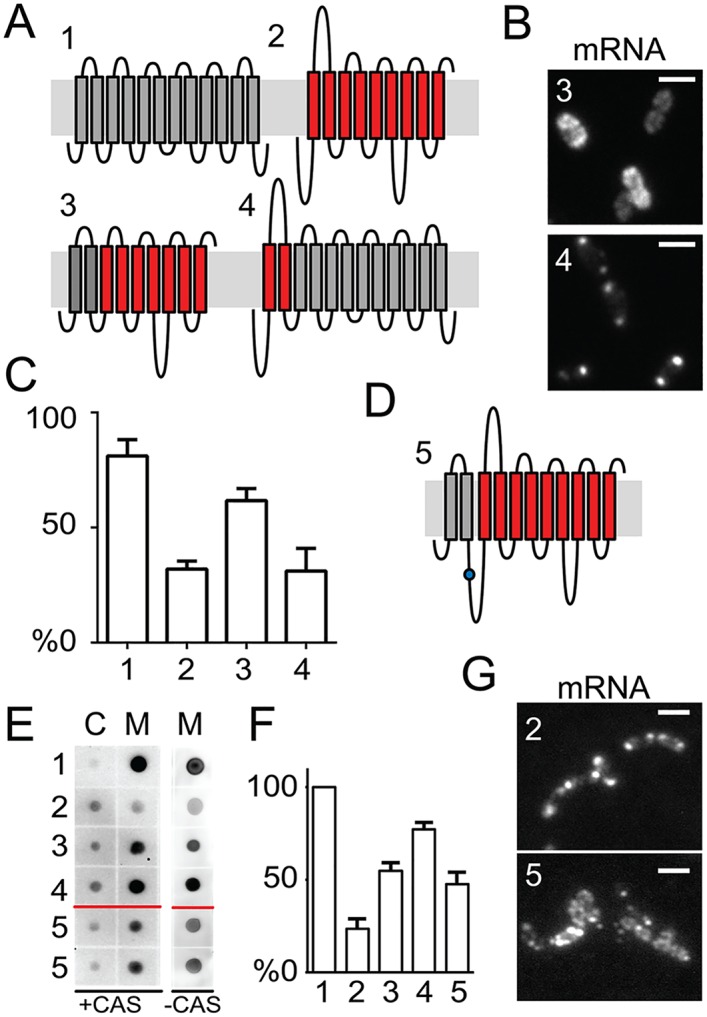
(A) Schematic representation of the transmembrane domains, as predicted by TMHMM, of BcaP (1) and PS1Δ9 (2) and chimeric proteins in which a portion of N-terminal domains of PS1Δ9 (PS1Δ9N) is replaced by those of BcaP (3) and vice versa (4). (B) mRNA localization in representative cells expressing bcaPN-PS1Δ912bs (3) or PS1Δ9N-bcaP12bs (4) transcripts. (C) The percentage of cells (n = 400) without polar mRNA of the proteins depicted in A. (D) Schematic representation of PS1Δ9 (red bars) fused via its N-terminal domain and a flexible linker containing a TEV protease site (blue dot) to the newly developed fusion partner BLS (for BcaP Leading Segment; grey bars). (E) Dotblots of cytoplasmic fractions (C) and membrane fractions (M) of L. lactis NZ9000 cells grown in GCDM* or GCDM* supplemented with 1.5% casitone, and expressing the proteins shown in A and D. (F) Quantification of dotblot signals. Averaged signals are displayed as percentages of the signals obtained for BcaP expression. (G) Representative image of cells expressing PS1Δ912bs or BLS-PS1Δ912bs mRNA as visualized by FISH. Numbers in B, C, E, and F refer to the construct numbers in A and D.
The finding that polar mRNA accumulation of PS1Δ9N-bcaP12bs had decreased while the corresponding protein production had improved prompted us to design a general optimization strategy for improved production of recalcitrant membrane proteins. The same N-terminal domain of BcaP was now fused to the N-terminus of PS1Δ9 via a flexible linker that included a TEV protease cleavage site (Fig 6D). We coined this new fusion partner BcaP leading segment (BLS). To test the effectiveness of BLS on PS1Δ9 production, the various L. lactis NZ9000 strains were grown in two types of media: GCDM* and GCDM* supplemented with extra peptides through the addition of casitone. The latter has been shown to positively affect the production of membrane proteins [46]. Induction was performed according to the standard regime, after which the quantity of original and chimeric membrane proteins in the membrane fraction was examined as described above. In both types of media an increased signal of BLS-PS1Δ9 over PS1Δ9 was observed, indicating that production of PS1Δ9 had improved (Fig 6E and 6F). Moreover, mRNA of BLS-PS1Δ9 was more often observed at the membrane than clustered in the cell poles (Fig 6G). Although follow-up studies are required to address the quality of overexpressed BLS-PS1Δ9, we conclude that the BLS-tag has great potential as a fusion partner to elevate the levels of recalcitrant (heterologous) membrane proteins in L. lactis by guiding their insertion in the cytoplasmic membrane.
Membrane protein mRNAs of the AT-rich L. lactis contain an increased U-density over other mRNAs
Thus far, we were able to show a subset of cellular consequences of polar mRNA clusters, and excluded the localization of plasmids, protein aggregates, the chaperone DnaK, and the main constituent of the RNA degradosome, RNase Y, as a direct cause for cluster formation. What then, besides ribosome exclusion, could drive the predisposition of mRNAs of recalcitrant membrane proteins at the poles? Codons for hydrophobic amino acid residues that constitute the transmembrane domains of membrane proteins have a strong uracil (U) bias [47]. This is more pronounced in bacteria such as E. coli than in higher, eukaryotic cells through differences in codon choice. The increased U-density of membrane protein mRNA was suggested to function as a post-transcriptional zip code for membrane targeting. Since L. lactis is an AT-rich organism, the general U-density of transcripts is intrinsically higher than that of E. coli. If the U-density of transcripts is of evolutionary importance, we would expect to see an adapted, higher U-bias in the preferred codons specifying hydrophobic amino acid residues in L. lactis. This is indeed the case for hydrophobic amino acid residues in L. lactis, whereas this bias is less pronounced in E. coli (Fig 7A). Therefore, despite the AT-rich genomic sequence of L. lactis, the U-density of membrane protein-encoding mRNA is significantly higher than that of mRNAs of cytosolic proteins, but also than that of membrane protein-encoding mRNAs of E. coli (Fig 7B). This suggests that in AT-rich organisms the deployment of mostly relatively U-rich codons for hydrophobic amino acid residues has been selected for, through which the relative difference between the general U-density of mRNAs encoding membrane or cytoplasmic proteins is maintained.
Fig 7. Increased uracil density in L. lactis genes encoding membrane proteins.

(A) The relative codon bias for all hydrophobic amino acids in L. lactis MG1363 (left bars) and E. coli K12 (right bars). The red bars indicate the codon(s) with the highest uracil content. (B) Boxplots show that the uracil density of transcripts encoding membrane proteins is increased in both species. A Student’s t-test was performed: the uracil density was significantly different (p < 0.0001; indicated by ****) between the two types of transcripts for both E. coli and L. lactis.
Discussion
L. lactis has emerged as a suitable host for membrane protein production, although expression of heterologous membrane proteins is still suboptimal. To gain insights into potential obstacles, we examined the fate of transcripts of well and poorly expressing membrane proteins, and the relationship between mRNA localization, transcription, translation, and degradation. In E. coli, transcripts for many integral membrane proteins are present in SRP-dependent co-translational translocation complexes during the major part of their lifetime [9]. Transcripts encoding the homologous transporter BcaP localized to the membrane in L. lactis while disruption of their translation led to loss of membrane-proximal mRNA foci, suggesting that a similar transertion system operates in this bacterium. Transcripts of poorly expressed membrane proteins, H. sapiens PS1Δ9 and S. tuberosum SUT1, formed distinctive polar clusters in L. lactis. Importantly, neither the expression vector pNZ8048 nor protein aggregates co-localized at the poles. Although high-copy number plasmids have been localized predominantly at the cell poles of bacteria [26–28], pNZ8048-derivatives randomly distributed in the cells, with a predisposition in the area where the chromosomal DNA is also situated. The ColE1-derived plasmid pBluescript, with ~50 copies per cell, does not adopt any specific subcellular location in E. coli [48]. Both this and our study show that high-copy number plasmids do not necessarily cluster at the poles.
The occurrence of polar mRNA clusters was translation-dependent, positively correlated to the level of heterologous transcripts, and was always accompanied by severe growth defects, loss of nucleoid-occluded ribosomes, and activation of the heat-shock response. Furthermore, PS1Δ9-expressing cells displayed confined plasmid distribution and delayed degradation of polar PS1Δ912bs mRNA clusters. The disappearance of polar mRNA foci was a prerequisite for cells to be able to grow again, and was accompanied by a loss of nisin-driven transcription but also by relocalization and increase of ribosomal protein S2-eYFP. The sudden release of many PS1Δ912bs transcripts from polar foci, however, severely impacted growth, often leading to defects in cell division. All of these observations are an indication that cells with polar mRNA clusters adopt an altered cellular state. Previous ensemble studies of L. lactis overproducing membrane proteins suggested that the stringent response might be involved [17]. High alarmone ((p)ppGpp) levels in E. coli and B. subtilis lead to a shift from transcription of rRNA genes to transcription of genes involved in nutrient generation, preparing the cell for survival in a nutrient-poor environment [49,50]. In Staphylococcus aureus, (p)ppGpp inhibits ribosome assembly by binding GTPases involved in the maturation of ribosomal subunits [51]. It is therefore tempting to speculate that the loss of active ribosomes in L. lactis is triggered by the stringent response due to nutrient limitation or expression of the heterologous protein PS1Δ9.
The presence of polar mRNA clusters correlated to cells with a strong induction, as evidenced by both the level of overexpressed mRNAs and co-expressed MS2-GFP. As with the E. coli Walker strains, in which T7 RNA polymerase-driven transcription is reduced compared to the parent strain [52,53], the synthesis of less mRNA might improve the production of recalcitrant membrane proteins in L. lactis. Lowering the inducer concentration would be a straightforward solution albeit that nisin A-driven expression triggers a heterogeneous response at doses below 0.5 ng ml-1 [54]. Interestingly, mutations in the sensor histidine kinase NisK led to a 2- to 8-fold improvement in membrane protein production due to an increase in leaky expression in L. lactis DML1-3 strains [23]. We can now assume that this background transcription causes a steady state production of low levels of recombinant mRNA that do not lead to mRNA clustering or proteotoxic stress, prior to induction of gene expression.
The question remains what exactly causes the mRNA cluster formation. Below, three scenarios are discussed.
Availability for ribosomes
Overexpressed mRNAs encoding soluble proteins were mainly present in the nucleoid-free space, whereas RBS-less transcripts accumulated at the boundaries of the chromosomal area instead of the poles. A model on the spatial organization of intracellular mRNA localization in bacteria predicts that a great portion of transcripts reside in the nucleoid-free space and that a cyclic pattern of ribosome flow occurs, in which ribosomes that have finished translation in the nucleoid-free space pick up new transcripts from the nucleoid [55]. Transcripts might thus not readily diffuse away from their site of production without effective binding by ribosomes, resulting in the cluster formation at the nucleoid periphery observed here. Importantly, the adaxial clusters of untranslatable bcaP12bs or PS1Δ912bs transcripts resembled polar mRNA clusters in terms of density, while S2-eYFP was excluded from the poles whenever PS1Δ9 was produced. Abrogated translation of PS1Δ912bs transcripts might therefore be the cause of their polar clustering.
Uracil-density
In agreement with a previous study in E. coli [47], the uracil density of membrane protein-encoding mRNA in the AT-rich L. lactis is significantly higher than that of mRNAs of cytosolic proteins. The fact that, through codon bias, this uracil-richness has been preserved in bacteria strengthens the idea that it might play a role in membrane protein biogenesis. Recently, two cold-shock proteins, CspE and CspC, were shown to interact with uracil-rich transcripts and the inner membrane of E. coli [56]. This suggests that these CSPs not only stabilize transcripts during cold shock, but also deliver specific U-rich cargos to the cytoplasmic membrane. Remarkably, gene expression of most CSPs in L. lactis was downregulated upon PS1Δ9 expression but not upon BcaP-expression [7,17]. Because bcaP mRNA (0.36) and other endogenous membrane protein transcripts contain a higher U-density than the heterologous PS1Δ9 (0.29) and SUT1 (0.31) mRNA, it is tempting to hypothesize that the homologous bcaP12bs mRNA is recognized (better) by L. lactis homologs of E. coli CspE and CspC, such as CspE, CspB, and CspD2. This is supported by the notion that even RBS-less PS1Δ912bs transcripts are still more prone to accumulate in dense clusters than RBS-less bcaP12bs transcripts, the latter of which might be pulled away from the cell center, resulting in fewer mRNA clusters. If CSPs exert similar functions in L. lactis and E. coli, the decline in these membrane-targeting factors observed during PS1Δ9-expression would lead to a loss of membrane-proximal mRNA localization, and possibly to polar predisposition instead.
SRP recognition
When SRP recognition and delivery fails, synthesis of membrane proteins continues in the hydrophilic cytoplasm, leading to protein misfolding and aggregation [12]. A consensus SRP-specific signal peptide on integral membrane proteins has never been identified, but recent data suggest that translational pausing at mRNA elements 30–40 codons downstream of the codons that specify the SRP binding site triggers SRP-binding [41,57]. Neither the gene encoding PS1Δ9 nor that for SUT1 was codon-optimized for L. lactis. Due to differences in codon choice and tRNA-availability, cis-acting signals that promote SRP-binding might be absent when trying to express a non-optimized gene in an evolutionarily distinct host [41,57]. The idea that the timely targeting of ribosomes to the membrane by SRP constitutes a bottleneck during membrane protein overproduction has been explored in E. coli [58,59]. Competition between binding to the ribosome-nascent chain of trigger factor (TF), a folding chaperone for cytoplasmic proteins, and SRP influences efficient targeting of membrane proteins [59]. An increase in correctly inserted membrane proteins was established by decreasing the amount of TF while at the same time elevating the SRP level. Some N-terminal fusion proteins are known to improve membrane protein production, putatively through promoting SRP-dependent targeting and/or membrane insertion of the overexpressed protein [43,60–62]. We show here that these adaptations could also be responsible for guiding ribosomes carrying alien mRNA to the membrane: Interchanging the N-terminal domains of PS1Δ9 and BcaP resulted in a reversal in mRNA localization patterns and improved production of PS1Δ9. We delivered a proof-of-principle by introducing the BcaP N-terminal domain as a new L. lactis-specific fusion partner, BLS, which improves the heterologous production of recalcitrant membrane proteins such as PS1Δ9.
Methods
Bacterial strains, media and culture conditions
Bacterial strains and plasmids used in this study are listed in S1 Table. For cloning purposes, Lactococcus lactis NZ9000 was grown as a standing culture at 30°C in Difco M17 medium (BD, Franklin Lakes, NJ, USA) containing 0.5% (w/v) glucose (GM17). When required, chloramphenicol and/or erythromycin were added at a final concentration of 5 μg ml-1 or 3 μg ml-1, respectively. For all other analyses, L. lactis was grown in chemically defined medium (CDM; pH 6.8) with 0.5% glucose [63] lacking riboflavin (GCDM*), in which it reaches a growth rate of ~0.55 h-1. When stated, 1.5% (w/v) pancreatic digest of casein (Bacto Casitone; BD Biosciences, Franklin Lakes, NJ, USA) was added to GCDM* Chemically defined SA medium with 0.5% (w/v) glucose and 20 μg ml-1 5-fluoro-orotic acid (5-FOA; Sigma-Aldrich, St. Louis, MO, USA) as a sole pyrimidine source was used for the generation of chromosomal knock-ins, as described previously [64]. Escherichia coli DH5α (Life Technologies, Gaithersburg, MD, USA) was used for cloning purposes; it was grown aerobically at 37°C in LB medium (Formedium, Norfolk, UK) with, when required, erythromycin or ampicillin at a final concentration of 150 or 100 μg ml-1, respectively. All antibiotics were obtained from Sigma-Aldrich.
Recombinant DNA techniques and oligonucleotides
Standard molecular cloning techniques were performed essentially as described [65]. Chromosomal DNA from L. lactis was isolated using the Wizard Genomic DNA Purification Kit (Promega Life Sciences, Madison, WI, USA). Plasmids and PCR products were isolated and purified using the High Pure Plasmid Isolation and PCR Purification kit (Roche Applied Science, Mannheim, Germany) and the NucleoSpin Gel and PCR Clean-up kit (Macherey-Nagel, Düren, Germany) according to the manufacturers’ instructions. Enzymes were purchased from Fermentas (Thermo Fisher Scientific Inc, Waltham, MA, USA) and New England Biolabs (Ipswich, MA, USA). PCR reactions were performed with Phusion or DreamTaq polymerase (both from Fermentas) according to the manufacturer’s protocol. In case DNA fragments were prepared for uracil-excision DNA-based engineering, PfuX7 polymerase was employed (Morten HH Nørholm, DTU, Denmark) [66]. The obtained PCR fragments were mixed and treated with the USER enzyme mixture (New England Biolabs), yielding 9–12 nt-long overhangs annealing to complementary overhangs. No ligation was required, and USER-treated mixtures were directly used to transform L. lactis or E. coli. Oligonucleotides employed in this study are listed in S2 Table and were purchased from Biolegio BV (Nijmegen, The Netherlands). Competent E. coli cells were transformed using heat-shock, while electrocompetent L. lactis cells were transformed using electroporation with a Bio-Rad Gene Pulser (Bio-Rad Laboratories, Richmond, CA). All nucleotide sequencing was performed at Macrogen Europe (Amsterdam, The Netherlands).
Plasmid and strain construction
Nucleotide sequences of the primers and their role in the construction work described below are presented in S1 Text and S2 Table. Pertinent regions of all plasmids were sequenced to confirm their proper nucleotide sequences. All plasmids and strains that were used or constructed during this study are listed in S1 Table.
Protein analysis, western blotting, and immunodetection
L. lactis NZ9000 carrying pLG-BcaP or pLG-CodY was inoculated 1:100 in chemically-defined medium containing 0.5% (w/v) glucose (GCDM; (18)) and grown as standing culture at 30°C to an OD600 of 0.4, and induced with 5 ng ml-1 of nisin A (Sigma-Aldrich). Cells were harvested 2 hrs post-induction by centrifugation at 9,000×g for 15 min at 4°C, washed with ice-cold 100 mM potassium phosphate (KPi) pH 7.0 and resuspended to OD600 of 1 in ice-cold 100 mM KPi. For lysis, glass beads were added to 1 ml of the cell suspension, and cells were broken by 3×35 sec incubations in a mini-bead beater (Biospec Products, Bartlesville, OK) with 1-min intervals of cooling at 4°C. Cell debris was removed by centrifugation at 7650×g for 15 min (4°C). To detect overexpressed StrepII-tagged BcaP, membrane fractions were collected by high-speed centrifugation (267,000×g for 30 min at 4°C) in an Optima TLX Ultracentrifuge (Beckman Coulter, Brea, CA, USA). For immunodetection of StrepII-tagged BcaP, membranes were washed with 10 mM KPi buffer containing 10% glycerol, resuspended in 2×SDS loading buffer (1M Tris-HCl, pH 6.8, 10% SDS, 20% (v/v) glycerol, 25% (v/v) β-mercaptoethanol, 0.05% bromophenol blue), boiled for 5 min, subjected to SDS-(12.5%) PAGE. For immunodetection of StrepII-tagged CodY, cleared cell lysates were mixed with 2×SDS loading buffer, boiled for 5 min, and separated by SDS-(12.5%) PAGE. Proteins were transferred by semi-dry blotting to a polyvinylidene difluoride membrane (Roche Applied Sciences). For dot-blotting, strains were grown and fractionated as described above. Membrane and cytoplasmic proteins were directly spotted onto a nitrocellulose membrane (0.45 μm, Bio-Rad). Immunodetection of transferred or spotted StrepII-tagged proteins was performed as follows. Membranes were washed with 1×TBS-T (20 mM Tris, 150mM NaCl, and 0.1% Tween 20, pH 7.5) blocked with 5% bovine serum albumin in TBS-T, blocked with 0.001% avidin in 1×TBS-T for 20 min, washed with 1×TBS-T, after which the proteins were detected with StrepMAB-Classic (IBA, Göttingen, Germany), using Amersham anti-mouse polyclonal antibodies from sheep, conjugated to horseradish peroxidase and ECL detection (both from GE Healthcare Europe GmbH, Eindhoven, The Netherlands) according to manufacturers’ instructions.
Preparation of cells for in vivo fluorescence microscopy imaging or RNA FISH
Generally, L. lactis was grown overnight in GM17 with appropriate antibiotics prior to microscopy analysis. Overnight cultures were washed in sterile 1×PBS (137 mM NaCl, 2.7 mM KCl, 10 mM Na2HPO4, 1.8 mM KH2PO4, pH 6.8) and inoculated 1:100 in GCDM*, to limit background fluorescence, and antibiotics when required. Cultures were grown to mid-exponential phase (equivalent to OD600 of ~0.4) and induced with nisin A at a final concentration of 5 ng ml-1. Depending on the experiment, cells were incubated for another 0 to 90 min.
For in vivo fluorescence microscopy imaging, 0.4 μl of a culture was transferred onto a microscopy slide that was prepared as follows: Multitest-slides (MP Biomedical, Santa Ana, CA, USA) were cleaned using 5M KOH and MilliQ, after which they were coated with 1.5% agarose (Sigma-Aldrich) dissolved in fresh GCDM*.
To stop translation, both chloramphenicol and erythromycin were added to an induced culture, each to a final concentration of 200 μg ml-1. Cultures were then incubated for another 30 min, after which cells were examined using fluorescence microscopy (see below).
To determine the degradation rate of overexpressed transcripts, the mRNAs were produced for 1 hr in the presence of 5 ng ml-1 of nisin A. Then rifampicin was added to a final concentration of 200 μg ml-1 to inhibit transcription. Cells were fixed (see below) at different time points after rifampicin addition (0, 1, 2, 4, 8, 16, 32, and 64 min) and prepared essentially as described in the following paragraph. This procedure was repeated at least twice for each mRNA on separate days. The final mRNA half-lives were determined as further described in Data analysis.
For RNA FISH, performed essentially as described [14] and adapted for E. coli cells [15], the cells were fixed by directly adding formaldehyde to the cultures to a final concentration of 3.7%. After incubation for 30 min at RT, the treated cells were washed twice with dyethylpyrocarbonate (DEPC)-treated 1×PBS, resuspended in 1×PBS containing 10 mg ml-1 lysozyme (Sigma-Aldrich), incubated for 30 min at 37°C, washed twice with 1×PBS and permeabilized in 70% ethanol. Permeabilized cells were washed twice with RNA FISH wash buffer (40% formaline and 2×SSC (150 mM NaCl, 15 mM sodium citrate, pH 7.0) in DEPC-treated MilliQ), resuspended in RNA FISH hybridization buffer (10% (w/v) PEG6000 (Sigma-Aldrich), 2 mM vanadyl ribonucleoside complex (VRC, 200 mM; New England Biolabs), 1 mg ml-1 yeast RNA, 40% formaline, and 2×SSC in DEPC-treated MilliQ) containing 1 mM of each FISH probe and incubated for 16 hrs in a water bath at 30°C. Prior to imaging, excess probe was removed by two washings with 200 μl RNA FISH wash buffer. Finally, the cells were resuspended in 2×SSC and transferred to a microscopy slide coated with 1.5% agarose in 1×PBS.
For DNA FISH, the cells were treated similar to preparation for RNA FISH, except for the following changes. An RNase (Roche) step (50 μg ml-1, 1 hr, and 37°C) was incorporated after permeabilization with ethanol and cells were washed twice with 1×PBS. Prior to 16-hrs probe hybridization step, cells were heated to 78°C for 10 min in hybridization buffer, after which the TAMRA-labeled ms2 probe was added to a final concentration of 1 mM.
The oligonucleotide probes used are summarized in S3 Table. All probes were purchased from Biolegio BV and were covalently linked at both ends to carboxytetramethylrhodamine (TAMRA) dyes. The ms2 FISH probe was designed to specifically hybridize to each of the 12 MS2 binding sites fused to the 3’-ends of overexpressed transcripts, leading to a theoretical 24-fold amplification of the signal. The three bcaP-FISH or PS1Δ9-FISH probes were designed to anneal next to each other and to target the middle of the protein-coding region of the transcripts.
Fluorescence microscopy
All micrographs were obtained with a DeltaVision Elite inverted epifluorescence microscope (Applied Precision, GE Healthcare, Issaquah, WA, USA) equipped with a stage holder, a climate chamber, a seven-color combined set InsightSSI Solid-State Illumination module, and an sCMOS camera (PCO AG, Kelheim, Germany). A 100× phase-contrast objective (NA 1.4, oil-immersion, DV) was used for image capturing, in combination with SoftWorX 3.6.0 software (Applied Precision) to control the microscope setup and to perform single-time-point or time-lapse imaging of cells. The following standard fluorescence filter sets were used for visualization: GFP, excitation at 475/28 nm and emisson at 525/48 nm; TAMRA/TRITC, excitation at 542/27 nm and emission at 597/45 nm; DAPI, excitation at 390/18 nm and emission at 435/48 nm (all using a polychroic beam splitter suitable for DAPI, FITC, TRITC, Cy5); eYFP, excitation at 438/24 nm, emission at 548/48, using a polychroic beam splitter suitable for CFP/eYFP/mCherry. TAMRA images were captured with 1 sec exposure time, S2-eYFP with 5 sec exposure time, and GFP fusions with 0.5 to 1 sec exposure time. If stated in the figure legends, deconvolution was performed using SoftWorX 3.6.0 software (GE Healthcare Bio-Sciences, Pittsburgh, PA, USA).
Fluorescence measurements using a plate reader
L. lactis was grown overnight in GM17 with appropriate antibiotics. Cells were collected by centrifugation, washed in sterile 1×PBS, inoculated 1:100 in GCDM* with 5 μg ml-1 chloramphenicol, and divided as quintuplos in wells of a transparent 96-wells microtitre plate. Fluorescence was measured with the following equipment and settings: Infinite F200 plate reader (Tecan Group Ltd., Männedorf, Switzerland) with I-control 1.10.4.0 software (Tecan Group Ltd.), GFP filter set (excitation at 485 nm and emission at 535 nm). GFP signals were collected as top readings with a gain setting of 60. GFP fluorescence was divided by the corresponding OD600 measurements to correct for cell density effects. The cultures were grown at 30°C to mid-exponential phase (equivalent to an OD600 of ~0.4) and induced with nisin A at a final concentration of 5 ng ml-1. L. lactis LG029(pNZ8048) was used as an empty vector control to obtain fold changes in expression of DnaK-GFP.
Data analysis
MATLAB-based (Mathworks, Natick, MA, USA) MicrobeTracker (http://microbetracker.org) or Oufti (http://www.oufti.org) software were used to automatically track cell contours [67,68]. Both ImageJ (http://imagej.net/ImageJ) and MicrobeTracker software were used to detect fluorescent spots or measure single-cell fluorescence.
Spot detection was performed using a Gaussian fit algorithm available in the ImageJ plug-in ISBatch [18], collecting the coordinates of the spots relative to the image file as well as the Gaussian fitting parameters of each spot. Spots corresponding to intracellular signals were obtained using the tracked cell meshes, and those lying outside the meshes were discarded. The remaining spot coordinates were transformed and normalized to intracellular coordinates to fit in the dimension of one half of a coccoid model cell. To construct the model cell, the average L. lactis cell outline and nucleoid size were extracted from image files of live DAPI-stained L. lactis NZ9000 cells using cell and nucleoid tracking (S1C Fig). The membrane-width inside the cell outline was estimated using images of cells expressing the fluorescent membrane protein BcaP-GFP. The resulting demi-coccoid form had a dimension of 800×900 nm, representing the average width×0.5(length) of an L. lactis cell grown in GCDM*. Remaining spots were conjointly projected into this model cell, and the resulting spot occupancy was plotted as density maps using MATLAB. The Gaussian fitting parameters obtained from the ISBatch plug-in were used to calculate the intensity (I) of fluorescent spots (I = πw2h, where w = full-width at half-maximum (FWHM); h = height or maximum of Gaussian fit parameter).
To obtain mRNA degradation curves, FISH was employed to obtain total TAMRA signals per cell for each time point after rifampicin addition as described in Preparation of cells for in vivo fluorescence microscopy imaging or RNA FISH. TAMRA signals minus background were extracted using MicrobeTracker. Bootstrapping (5×500 randomly picked cells per population) was performed to examine the accuracy of the sampling distribution. Single exponential decay curves described by N(t) = N0e−λt were fitted to the averages of normalized median values obtained from independent experiments using MATLAB. Transcript half-lives were calculated from the decay coefficients (λ) using .
The ObjectJ plug-in for ImageJ was employed to track cell lengths and S2-eYFP distribution along the Y-axes of the cells (https://sils.fnwi.uva.nl/bcb/objectj). All box-and-whisker plots (box plots) are represented according to the Tukey method for plotting whiskers.
To the determine the U-density of transcript groups representing cytoplasmic proteins or membrane proteins, the nucleotide sequences of genes encoding all cytoplasmic proteins and membrane proteins were identified and extracted from the genome sequences of L. lactis MG1363 and E. coli K12 using tools available at https://genome2d.molgenrug.nl. The number of thymines was divided by the total number of nucleotides of each gene to obtain the uracil density per gene. The codon usage indexes for both organism were obtained from http://genomes.urv.es/CAIcal.
Supporting Information
(A) Analysis of overexpressed StrepII-tagged CodY (30.2 kDa) in cell-free extracts and of StrepII-tagged BcaP (50.6 kDa) in membrane fractions of L. lactis NZ9000 by Western hybridization using anti-StrepII antibodies. BcaP is known to migrate faster than expected on the basis of its molecular mass and typically forms a band at a position where proteins of around 37.5 kDa would migrate [13]. Control (-), empty-vector control. (B) Micrographs of L. lactis NZ9000 cells expressing gfp12bs mRNA and GFP protein. PC = phase contrast. Scale bar represents 2 μm. (C) To obtain the model cell which served as a projection space used for the localization maps, we analyzed the area occupied by the nucleoid and the membrane inside of the obtained cell meshes. Using MicrobeTracker, we measured the length and width of the cell meshes (cell outline) as well as the nucleoids stained by DAPI (cyan) of 200 living cells in various states of division (left panel). Furthermore, we extracted the average thickness occupied by the membrane by analyzing living cells expressing the fluorescent membrane protein BcaP-GFP (left panel). For each of these parameters, a population average was obtained. Right panel depicts a schematic, scaled representation of a cell that had just divided, including the obtained length and width averages (displayed in μm). Black lines represent cell contour obtained from cell meshes, turquoise lines depict chromosomal area, and green lines depict cell membrane and cell wall. (D) The Gaussian fit parameters FWHM (full-width at half maximum of spot height (h)), and the spot intensity I (π(FWHM)2h) obtained from spot detection analyses were used to visualize the spatial distribution of transcripts within foci formed by bcaP12bs, codY12bs, PS1Δ912bs, or SUT112bs mRNA. Heat maps were reconstructed from the FWHM values of each focus, all of which were plotted as a function of reciprocal magnitudes for all four transcripts. The white dashed lines serve as a reference and indicate the cut-off of maximal FWHM values reached of spots with increased FWHM-to-brightness ratios. Contrast bar: low (blue) to high (yellow) density of spot parameter distribution.
(TIF)
Overexpressed codY12bs, bcaP12bs, PS1Δ912bs or SUT112bs transcripts visualized in vivo with co-expressed MS2-GFP in L. lactis LG010 cells (left panels). Corresponding phase contrast pictures are shown in the center panels. Scale bar = 5 μm. Location maps of spot projections (right panels) from the MS2 datasets obtained from 794, 1290, 609, and 841 cells, respectively, highlighting the preferential localization of each overexpressed mRNA (Method described in Material and methods). Thick transparent lines: Cell boundaries including the portion occupied by cell wall and membrane as approximated using BcaP-GFP expressing cells (See S1C Fig). Thin transparent lines: Boundaries of chromosomal areas as approximated using DAPI staining in living cells (See S1C Fig). Scale bars depict the relative density of each mRNA species.
(TIF)
(A) Deconvolved fluorescence micrographs of co-visualized bcaP12bs mRNA and the corresponding membrane protein BcaP fused to GFP. The upper panels show cells in which BcaP-GFP aggregation seeds are present, while cells with dense polar bcaP-gfp12bs mRNA clusters in combination with membrane-localized BcaP-GFP are exemplified in the lower panels. The yellow arrowhead in the right-upper panel indicates an overlapping fluorescent mRNA and protein focus. Right panels: false-colored overlays (red: mRNA; cyan: protein). (B) Fluorescence micrographs of L. lactis NZ9000 cells with TAMRA-labeled PS1Δ9-gfp12bs transcripts (left panel), PS1Δ9-GFP (second panel from the left) and a deconvolved false-colored overlay (third panel from the left; red: PS1Δ9-gfp12bs; cyan: PS1Δ9-GFP). Right-most panel: Original false-colored overlay image. Yellow arrowheads indicate signals that show proximal localization of PS1Δ9-GFP protein and mRNA. (C) Upper two panels show fluorescence micrographs of DnaK-GFP localization in L. lactis LG029 cells collected and examined during exponential growth without stress. The upper left panel displays the effect on DnaK-GFP localization of fixation with 3.7% paraformaldehyde (PFA). The upper right panel shows the distribution of DnaK-GFP in living cells. The lower panels depict DnaK-GFP localization in L. lactis LG029 cells expressing either bcaP12bs or PS1Δ912bs. Cells were fixed with 3.7% PFA and prepared for FISH analysis prior to imaging. (D) Histograms and their fitted normal distributions of the distances between centers of PS1Δ9-GFP (grey) or DnaK-GFP (red) foci and polar PS1Δ9-gfp12bs mRNA clusters in 100 single NZ9000 or LG029 cells, respectively. (E) Location maps of preferential localization of PS1Δ912bs mRNA, PS1Δ9-GFP, and DnaK-GFP. Intracellular coordinates of fluorescent foci corresponding to overexpressed PS1Δ912bs mRNA, and of co-visualized PS1Δ9-GFP or DnaK-GFP, reconstructed as described in Data analysis. Scale bars in all micrographs correspond to 2 μm.
(TIF)
(A) Fluorescence micrographs of L. lactis LG045a cells constitutively expressing ParB-GFP, either carrying pNZ8048 without parS sequence (left panel) or pNZ8048 with consensus parS sequence (right panel). (B) pLG-BcaP plasmids visualized in L. lactis NZ9000 using DNA FISH and the TAMRA labeled ms2 probes after non-induced cells were treated with RNase I to remove (complementary) RNA.
(TIF)
(A) Fluorescence microscopy L. lactis LG010 cells expressing MS2-GFP, with or with Cm/Ery treatment. Treated cells display a partial exclusion of MS2-GFP from the nucleoid region. This is not the case in the non-treated cells. Scale bar is 2 μm. (B) The fluorescence of L. lactis NZ9000 cells overexpressing gfp12bs transcripts with or without ribosomal binding sites (RBS). (C) Snap shots of time-lapse microscopy following the subcellular S2-eYFP distribution in L. lactis(rpsB::rpsB-eYFP) grown in nutrition-rich or nutrition-limiting conditions. Cells were grown to mid-exponential phase in GCDM*, after which samples were transferred to a microscope slide with an agarose patch either dissolved in GCDM* or 1×PBS supplemented with 0.5% glucose (GPBS). (D) The relative level of overexpressed codY12bs (black), bcaP12bs (red), PS1Δ912bs (grey), and SUT112bs (blue) transcripts as a function of time after rifampicin addition (at t = 0) was monitored using FISH. The data was fitted to single exponential decay, of which the curves are shown as solid lines. Error bars depict standard deviations obtained from bootstrapped datasets. (E) The dataset of [36] was used to determine the mRNA degradation rates of lactococcal transcripts. The log values of median half-lives, , of a total of 994, 787, and 996 transcripts at growth rate (μ) of 0.11, 0.51, and 0.80 h−1, respectively, were extracted and plotted as a function of the respective growth rates (open black circles). A best fit to the data (dashed black line) followed from . The closed black circle indicates the median at μ = 0.55h−1, corresponding to a median of 10.9 min. A similar strategy was employed to estimate the values of codY (open red circle) and bcaP (open blue circle) mRNA at μ = 0.55h−1, resulting in (dotted red line) and (dotted blue line). The lifetime of codY12bs mRNA (t1/2 = 7.1 min) was in good agreement with that previously reported for codY mRNA (t1/2 = 7.4 min for μ = 0.55 h-1). This corresponds to a for codY or bcap mRNA of 6.4 min or 11.5 min, respectively, at μ = 0.55h−1. Breakdown of overexpressed bcaP12bs mRNA () was at least not slower than that of endogenous bcaP mRNA. Note that media composition differs substantially between our measurements and those performed by Dressaire et al., possibly influencing specific mRNA lifetimes. (F) Degradation curves of PS1Δ912bs (grey squares) or SUT112bs (blue squares) of cells containing polar mRNA clusters (filled squares, solid lines) or cells without such foci (open squares, dashed lines). The data were fitted to single exponential decay functions, of which corresponding curves are depicted in the graph. (G) Degradation curves of bcaP12bs or PS1Δ912bs transcripts with (red and grey dashed lines, respectively; replicated from (D)) or without functional RBS (red and grey solid lines).
(TIF)
(MOV)
(MOV)
(MOV)
(MOV)
Cells from a nisin-induced culture were transferred to a microscope slide with an agarose patch in growth medium without additional inducer. Scale bar represents 2 μm.
(AVI)
Cells from a nisin-induced culture were transferred to a microscope slide with an agarose patch in growth medium without additional inducer. Scale bar represents 2 μm.
(AVI)
Cells from a nisin-induced culture were transferred to a microscope slide with an agarose patch in growth medium without additional inducer nisin. Scale bar represents 2 μm.
(AVI)
Cells from a nisin-induced culture were transferred to a microscope slide with an agarose patch in growth medium without additional inducer. Scale bar represents 2 μm.
(AVI)
Abr = Antibiotic resistance. Amp = ampicillin, Cm = chloramphenicol, Ery = erythromycin.
(DOCX)
Underlined nucleotides highlight restriction enzyme sites.
(DOCX)
(DOCX)
Content: 1. Validation of single-probe FISH for transcript visualization in L. lactis. 2. Evaluation of the MS2 system for visualization of overproduced transcripts in living L. lactis cells. 3. Plasmid and strain construction. 4. S1 Text—Figures. 5. S1 Text—References.
(DOCX)
Acknowledgments
We thank M. Kjos for helpful discussion and critical reading of the manuscript.
Data Availability
All relevant data are within the paper and its Supporting Information files.
Funding Statement
The work was supported by a TOP-GO program granted by the Netherlands Organization for Scientific Research (NWO), project 700.10.353 (http://www.nwo.nl/). The funders had no role in study design, data collection and analysis, decision to publish, or preparation of the manuscript.
References
- 1.von Heijne G. The membrane protein universe: what’s out there and why bother? J Intern Med. 2007;261: 543–57. 10.1111/j.1365-2796.2007.01792.x [DOI] [PubMed] [Google Scholar]
- 2.Zweers JC, Barák I, Becher D, Driessen AJ, Hecker M, Kontinen VP, et al. Towards the development of Bacillus subtilis as a cell factory for membrane proteins and protein complexes. Microb Cell Fact. 2008;7: 10 10.1186/1475-2859-7-10 [DOI] [PMC free article] [PubMed] [Google Scholar]
- 3.Schlegel S, Hjelm A, Baumgarten T, Vikström D, de Gier J-W. Bacterial-based membrane protein production. Biochim Biophys Acta. 2014;1843: 1739–49. 10.1016/j.bbamcr.2013.10.023 [DOI] [PubMed] [Google Scholar]
- 4.Kunji ERS, Slotboom D-J, Poolman B. Lactococcus lactis as host for overproduction of functional membrane proteins. Biochim Biophys Acta. 2003;1610: 97–108. [DOI] [PubMed] [Google Scholar]
- 5.Zweers JC, Wiegert T, van Dijl JM. Stress-responsive systems set specific limits to the overproduction of membrane proteins in Bacillus subtilis. Appl Environ Microbiol. 2009;75: 7356–64. 10.1128/AEM.01560-09 [DOI] [PMC free article] [PubMed] [Google Scholar]
- 6.Klepsch MM, Persson JO, de Gier J-WL. Consequences of the overexpression of a eukaryotic membrane protein, the human KDEL receptor, in Escherichia coli. J Mol Biol. Elsevier Ltd; 2011;407: 532–42. 10.1016/j.jmb.2011.02.007 [DOI] [PMC free article] [PubMed] [Google Scholar]
- 7.Pinto JPC, Kuipers OP, Marreddy RKR, Poolman B, Kok J. Efficient overproduction of membrane proteins in Lactococcus lactis requires the cell envelope stress sensor/regulator couple CesSR. PLoS One. 2011;6: e21873 10.1371/journal.pone.0021873 [DOI] [PMC free article] [PubMed] [Google Scholar]
- 8.Driessen AJM, Nouwen N. Protein translocation across the bacterial cytoplasmic membrane. Annu Rev Biochem. 2008;77: 643–67. 10.1146/annurev.biochem.77.061606.160747 [DOI] [PubMed] [Google Scholar]
- 9.Moffitt JR, Pandey S, Boettiger AN, Wang S, Zhuang X. Spatial organization shapes the turnover of a bacterial transcriptome. Elife. 2016;5 10.7554/eLife.13065 [DOI] [PMC free article] [PubMed] [Google Scholar]
- 10.Fei J, Singh D, Zhang Q, Park S, Balasubramanian D, Golding I, et al. RNA biochemistry. Determination of in vivo target search kinetics of regulatory noncoding RNA. Science. 2015;347: 1371–4. 10.1126/science.1258849 [DOI] [PMC free article] [PubMed] [Google Scholar]
- 11.Nevo-Dinur K, Nussbaum-Shochat A, Ben-Yehuda S, Amster-Choder O. Translation-independent localization of mRNA in E. coli. Science. 2011;331: 1081–4. 10.1126/science.1195691 [DOI] [PubMed] [Google Scholar]
- 12.Akopian D, Shen K, Zhang X, Shan S. Signal recognition particle: an essential protein-targeting machine. Annu Rev Biochem. Annual Reviews; 2013;82: 693–721. 10.1146/annurev-biochem-072711-164732 [DOI] [PMC free article] [PubMed] [Google Scholar]
- 13.den Hengst CD, Groeneveld M, Kuipers OP, Kok J. Identification and Functional Characterization of the Lactococcus lactis CodY-Regulated Branched-Chain Amino Acid Permease BcaP (CtrA). J Bacteriol. 2006;188: 3280–3289. 10.1128/JB.188.9.3280-3289.2006 [DOI] [PMC free article] [PubMed] [Google Scholar]
- 14.Raj A, van Oudenaarden A. Single-molecule approaches to stochastic gene expression. Annu Rev Biophys. 2009;38: 255–70. 10.1146/annurev.biophys.37.032807.125928 [DOI] [PMC free article] [PubMed] [Google Scholar]
- 15.Skinner SO, Sepúlveda LA, Xu H, Golding I. Measuring mRNA copy number in individual Escherichia coli cells using single-molecule fluorescent in situ hybridization. Nat Protoc. 2013;8: 1100–13. 10.1038/nprot.2013.066 [DOI] [PMC free article] [PubMed] [Google Scholar]
- 16.de Ruyter PG, Kuipers OP, de Vos WM. Controlled gene expression systems for Lactococcus lactis with the food-grade inducer nisin. Appl Environ Microbiol. 1996;62: 3662–7. [DOI] [PMC free article] [PubMed] [Google Scholar]
- 17.Marreddy RKR, Pinto JPC, Wolters JC, Geertsma ER, Fusetti F, Permentier HP, et al. The response of Lactococcus lactis to membrane protein production. PLoS One. 2011;6: e24060 10.1371/journal.pone.0024060 [DOI] [PMC free article] [PubMed] [Google Scholar]
- 18.Caldas VEA, Punter CM, Ghodke H, Robinson A, van Oijen AM. iSBatch: a batch-processing platform for data analysis and exploration of live-cell single-molecule microscopy images and other hierarchical datasets. Mol BioSyst. 2015;11: 2699–2708. 10.1039/c5mb00321k [DOI] [PubMed] [Google Scholar]
- 19.Golding I, Cox EC. RNA dynamics in live Escherichia coli cells. Proc Natl Acad Sci U S A. 2004;101: 11310–5. 10.1073/pnas.0404443101 [DOI] [PMC free article] [PubMed] [Google Scholar]
- 20.Montero Llopis P, Jackson AF, Sliusarenko O, Surovtsev I, Heinritz J, Emonet T, et al. Spatial organization of the flow of genetic information in bacteria. Nature. 2010;466: 77–81. 10.1038/nature09152 [DOI] [PMC free article] [PubMed] [Google Scholar]
- 21.Pinto JPC, Zeyniyev A, Karsens H, Trip H, Lolkema JS, Kuipers OP, et al. pSEUDO, a genetic integration standard for Lactococcus lactis. Appl Environ Microbiol. 2011;77: 6687–90. 10.1128/AEM.05196-11 [DOI] [PMC free article] [PubMed] [Google Scholar]
- 22.Overkamp W, Beilharz K, Detert Oude Weme R, Solopova A, Karsens H, Kovacs AT, et al. Benchmarking Various Green Fluorescent Protein Variants in Bacillus subtilis, Streptococcus pneumoniae, and Lactococcus lactis for Live Cell Imaging. Appl Environ Microbiol. 2013;79: 6481–6490. 10.1128/AEM.02033-13 [DOI] [PMC free article] [PubMed] [Google Scholar]
- 23.Linares DM, Geertsma ER, Poolman B. Evolved Lactococcus lactis strains for enhanced expression of recombinant membrane proteins. J Mol Biol. Elsevier Ltd; 2010;401: 45–55. 10.1016/j.jmb.2010.06.002 [DOI] [PubMed] [Google Scholar]
- 24.Winkler J, Seybert A, König L, Pruggnaller S, Haselmann U, Sourjik V, et al. Quantitative and spatio-temporal features of protein aggregation in Escherichia coli and consequences on protein quality control and cellular ageing. EMBO J. 2010;29: 910–923. 10.1038/emboj.2009.412 [DOI] [PMC free article] [PubMed] [Google Scholar]
- 25.Carrió MM, Villaverde A. Localization of chaperones DnaK and GroEL in bacterial inclusion bodies. J Bacteriol. 2005;187: 3599–601. 10.1128/JB.187.10.3599-3601.2005 [DOI] [PMC free article] [PubMed] [Google Scholar]
- 26.Reyes-Lamothe R, Tran T, Meas D, Lee L, Li AM, Sherratt DJ, et al. High-copy bacterial plasmids diffuse in the nucleoid-free space, replicate stochastically and are randomly partitioned at cell division. Nucleic Acids Res. 2014;42: 1042–51. 10.1093/nar/gkt918 [DOI] [PMC free article] [PubMed] [Google Scholar]
- 27.Eliasson A, Bernander R, Dasgupta S, Nordström K. Direct visualization of plasmid DNA in bacterial cells. Mol Microbiol. 1992;6: 165–70. [DOI] [PubMed] [Google Scholar]
- 28.Niki H, Hiraga S. Subcellular distribution of actively partitioning F plasmid during the cell division cycle in E. coli. Cell. 1997;90: 951–7. [DOI] [PubMed] [Google Scholar]
- 29.Pinho MG, Kjos M, Veening J-W. How to get (a)round: mechanisms controlling growth and division of coccoid bacteria. Nat Rev Microbiol. 2013;11: 601–14. 10.1038/nrmicro3088 [DOI] [PubMed] [Google Scholar]
- 30.Libby E a, Roggiani M, Goulian M. Membrane protein expression triggers chromosomal locus repositioning in bacteria. Proc Natl Acad Sci U S A. 2012;109: 7445–50. 10.1073/pnas.1109479109 [DOI] [PMC free article] [PubMed] [Google Scholar]
- 31.Kuhlman TE, Cox EC. Gene location and DNA density determine transcription factor distributions in Escherichia coli. Mol Syst Biol. 2012;8: 610 10.1038/msb.2012.42 [DOI] [PMC free article] [PubMed] [Google Scholar]
- 32.Sanamrad A, Persson F, Lundius EG, Fange D, Gynnå AH, Elf J. Single-particle tracking reveals that free ribosomal subunits are not excluded from the Escherichia coli nucleoid. Proc Natl Acad Sci U S A. 2014;111: 11413–8. 10.1073/pnas.1411558111 [DOI] [PMC free article] [PubMed] [Google Scholar]
- 33.Bakshi S, Bratton BP, Weisshaar JC. Subdiffraction-Limit Study of Kaede Diffusion and Spatial Distribution in Live Escherichia coli. Biophys J. 2011;101: 2535–2544. 10.1016/j.bpj.2011.10.013 [DOI] [PMC free article] [PubMed] [Google Scholar]
- 34.Bakshi S, Siryaporn A, Goulian M, Weisshaar JC. Superresolution imaging of ribosomes and RNA polymerase in live Escherichia coli cells. Mol Microbiol. 2012;85: 21–38. 10.1111/j.1365-2958.2012.08081.x [DOI] [PMC free article] [PubMed] [Google Scholar]
- 35.Lewis PJ, Thaker SD, Errington J. Compartmentalization of transcription and translation in Bacillus subtilis. EMBO J. 2000;19: 710–718. 10.1093/emboj/19.4.710 [DOI] [PMC free article] [PubMed] [Google Scholar]
- 36.Dressaire C, Picard F, Redon E, Loubière P, Queinnec I, Girbal L, et al. Role of mRNA Stability during Bacterial Adaptation. Mata J, editor. PLoS One. 2013;8: e59059 10.1371/journal.pone.0059059 [DOI] [PMC free article] [PubMed] [Google Scholar]
- 37.Bernstein JA, Khodursky AB, Lin P-H, Lin-Chao S, Cohen SN. Global analysis of mRNA decay and abundance in Escherichia coli at single-gene resolution using two-color fluorescent DNA microarrays. Proc Natl Acad Sci U S A. 2002. July 23;99(15):9697–702. 10.1073/pnas.112318199 [DOI] [PMC free article] [PubMed] [Google Scholar]
- 38.Selinger DW, Saxena RM, Cheung KJ, Church GM, Rosenow C. Global RNA Half-Life Analysis in Escherichia coli Reveals Positional Patterns of Transcript Degradation. Genome Res. 2003. February;13(2):216–23. 10.1101/gr.912603 [DOI] [PMC free article] [PubMed] [Google Scholar]
- 39.Hambraeus G, von Wachenfeldt C, Hederstedt L. Genome-wide survey of mRNA half-lives in Bacillus subtilis identifies extremely stable mRNAs. Mol Genet Genomics. 2003;269: 706–14. 10.1007/s00438-003-0883-6 [DOI] [PubMed] [Google Scholar]
- 40.Lehnik-Habrink M, Newman J, Rothe FM, Solovyova AS, Rodrigues C, Herzberg C, et al. RNase Y in Bacillus subtilis: a Natively disordered protein that is the functional equivalent of RNase E from Escherichia coli. J Bacteriol. 2011;193: 5431–41. 10.1128/JB.05500-11 [DOI] [PMC free article] [PubMed] [Google Scholar]
- 41.Pechmann S, Chartron JW, Frydman J. Local slowdown of translation by nonoptimal codons promotes nascent-chain recognition by SRP in vivo. Nat Struct Mol Biol. 2014;21: 1100–5. 10.1038/nsmb.2919 [DOI] [PMC free article] [PubMed] [Google Scholar]
- 42.Morgunov AS, Babu MM. Optimizing membrane-protein biogenesis through nonoptimal-codon usage. Nat Struct Mol Biol. 2014. December;21(12): 1023–5. 10.1038/nsmb.2926 [DOI] [PubMed] [Google Scholar]
- 43.Monné M, Chan KW, Slotboom D-J, Kunji ERS. Functional expression of eukaryotic membrane proteins in Lactococcus lactis. Protein Sci. 2005;14: 3048–56. 10.1110/ps.051689905 [DOI] [PMC free article] [PubMed] [Google Scholar]
- 44.Luo J, Choulet J, Samuelson JC. Rational design of a fusion partner for membrane protein expression in E. coli. Protein Sci. 2009;18: 1735–44. 10.1002/pro.189 [DOI] [PMC free article] [PubMed] [Google Scholar]
- 45.Xu Y, Kong J, Kong W. Improved membrane protein expression in Lactococcus lactis by fusion to Mistic. Microbiology. 2013;159: 1002–9. 10.1099/mic.0.066621-0 [DOI] [PubMed] [Google Scholar]
- 46.Marreddy RKR, Geertsma ER, Permentier HP, Pinto JPC, Kok J, Poolman B. Amino acid accumulation limits the overexpression of proteins in Lactococcus lactis. PLoS One. 2010;5: e10317 10.1371/journal.pone.0010317 [DOI] [PMC free article] [PubMed] [Google Scholar]
- 47.Prilusky J, Bibi E. Studying membrane proteins through the eyes of the genetic code revealed a strong uracil bias in their coding mRNAs. Proc Natl Acad Sci U S A. 2009;106: 6662–6. 10.1073/pnas.0902029106 [DOI] [PMC free article] [PubMed] [Google Scholar]
- 48.Wang Y, Penkul P, Milstein JN, Ricci JCD, Hernández ME, Silva F, et al. Quantitative Localization Microscopy Reveals a Novel Organization of a High-Copy Number Plasmid. Biophys J. Elsevier; 2016;111: 467–479. 10.1016/j.bpj.2016.06.033 [DOI] [PMC free article] [PubMed] [Google Scholar]
- 49.Krásný L, Gourse RL. An alternative strategy for bacterial ribosome synthesis: Bacillus subtilis rRNA transcription regulation. EMBO J. EMBO Press; 2004;23: 4473–83. 10.1038/sj.emboj.7600423 [DOI] [PMC free article] [PubMed] [Google Scholar]
- 50.Traxler MF, Summers SM, Nguyen H-T, Zacharia VM, Hightower GA, Smith JT, et al. The global, ppGpp-mediated stringent response to amino acid starvation in Escherichia coli. Mol Microbiol. 2008;68: 1128–48. 10.1111/j.1365-2958.2008.06229.x [DOI] [PMC free article] [PubMed] [Google Scholar]
- 51.Corrigan RM, Bellows LE, Wood A, Gründling A, Harwood CS. ppGpp negatively impacts ribosome assembly affecting growth and antimicrobial tolerance in Gram- positive bacteria. Proc Natl Acad Sci U S A. 2016. March 22;113(12):E1710–9. 10.1073/pnas.1522179113 [DOI] [PMC free article] [PubMed] [Google Scholar]
- 52.Wagner S, Klepsch MM, Schlegel S, Appel A, Draheim R, Tarry M, et al. Tuning Escherichia coli for membrane protein overexpression. Proc Natl Acad Sci U S A. 2008;105: 14371–6. 10.1073/pnas.0804090105 [DOI] [PMC free article] [PubMed] [Google Scholar]
- 53.Miroux B, Walker JE. Over-production of proteins in Escherichia coli: mutant hosts that allow synthesis of some membrane proteins and globular proteins at high levels. J Mol Biol. 1996;260: 289–98. 10.1006/jmbi.1996.0399 [DOI] [PubMed] [Google Scholar]
- 54.King MS, Boes C, Kunji ERS. Membrane protein expression in Lactococcus lactis. Methods in enzymology. 2015. pp. 77–97. 10.1016/bs.mie.2014.12.009 [DOI] [PubMed] [Google Scholar]
- 55.Castellana M, Hsin-Jung Li S, Wingreen NS. Spatial organization of bacterial transcription and translation. Proc Natl Acad Sci U S A. 2016. August 16;113(33):9286–91. 10.1073/pnas.1604995113 [DOI] [PMC free article] [PubMed] [Google Scholar]
- 56.Benhalevy D, Bochkareva ES, Biran I, Bibi E. Model Uracil-Rich RNAs and Membrane Protein mRNAs Interact Specifically with Cold Shock Proteins in Escherichia coli. PLoS One. 2015;10: e0134413 10.1371/journal.pone.0134413 [DOI] [PMC free article] [PubMed] [Google Scholar]
- 57.Fluman N, Navon S, Bibi E, Pilpel Y. mRNA-programmed translation pauses in the targeting of E. coli membrane proteins. Elife. eLife Sciences Publications Limited; 2014;3: e03440 10.7554/eLife.03440 [DOI] [PMC free article] [PubMed] [Google Scholar]
- 58.Chen Y, Song J, Sui S, Wang D-N. DnaK and DnaJ facilitated the folding process and reduced inclusion body formation of magnesium transporter CorA overexpressed in Escherichia coli. Protein Expr Purif. 2003;32: 221–31. 10.1016/S1046-5928(03)00233-X [DOI] [PubMed] [Google Scholar]
- 59.Nannenga BL, Baneyx F. Reprogramming chaperone pathways to improve membrane protein expression in Escherichia coli. Protein Sci. 2011;20: 1411–20. 10.1002/pro.669 [DOI] [PMC free article] [PubMed] [Google Scholar]
- 60.Su P-C, Si W, Baker DL, Berger BW. High-yield membrane protein expression from E. coli using an engineered outer membrane protein F fusion. Protein Sci. Wiley-Blackwell; 2013;22: 434–43. 10.1002/pro.2224 [DOI] [PMC free article] [PubMed] [Google Scholar]
- 61.Roosild TP, Greenwald J, Vega M, Castronovo S, Riek R, Choe S. NMR structure of Mistic, a membrane-integrating protein for membrane protein expression. Science. 2005;307: 1317–21. 10.1126/science.1106392 [DOI] [PubMed] [Google Scholar]
- 62.Leviatan S, Sawada K, Moriyama Y, Nelson N. Combinatorial method for overexpression of membrane proteins in Escherichia coli. J Biol Chem. 2010;285: 23548–56. 10.1074/jbc.M110.125492 [DOI] [PMC free article] [PubMed] [Google Scholar]
- 63.Poolman B, Konings WN. Relation of growth of Streptococcus lactis and Streptococcus cremoris to amino acid transport. J Bacteriol. 1988;170: 700–7. [DOI] [PMC free article] [PubMed] [Google Scholar]
- 64.Solem C, Defoor E, Jensen PR, Martinussen J. Plasmid pCS1966, a new selection/counterselection tool for lactic acid bacterium strain construction based on the oroP gene, encoding an orotate transporter from Lactococcus lactis. Appl Environ Microbiol. 2008;74: 4772–5. 10.1128/AEM.00134-08 [DOI] [PMC free article] [PubMed] [Google Scholar]
- 65.Sambrook J, Russell DW. Molecular Cloning: A Laboratory Manual, Volume 1 CSHL Press; 2001. [Google Scholar]
- 66.Nørholm MMH. A mutant Pfu DNA polymerase designed for advanced uracil-excision DNA engineering. BMC Biotechnol. 2010; 16;10:21 10.1186/1472-6750-10-21 [DOI] [PMC free article] [PubMed] [Google Scholar]
- 67.Garner EC. MicrobeTracker: quantitative image analysis designed for the smallest organisms. Mol Microbiol. 2011;80: 577–9. 10.1111/j.1365-2958.2011.07580.x [DOI] [PubMed] [Google Scholar]
- 68.Paintdakhi A, Parry B, Campos M, Irnov I, Elf J, Surovtsev I, Jacobs-Wagner C. Oufti: an integrated software package for high-accuracy, high-throughput quantitative microscopy analysis. Mol Microbiol. 2015; 99: 767–777. 10.1111/mmi.13264 [DOI] [PMC free article] [PubMed] [Google Scholar]
Associated Data
This section collects any data citations, data availability statements, or supplementary materials included in this article.
Supplementary Materials
(A) Analysis of overexpressed StrepII-tagged CodY (30.2 kDa) in cell-free extracts and of StrepII-tagged BcaP (50.6 kDa) in membrane fractions of L. lactis NZ9000 by Western hybridization using anti-StrepII antibodies. BcaP is known to migrate faster than expected on the basis of its molecular mass and typically forms a band at a position where proteins of around 37.5 kDa would migrate [13]. Control (-), empty-vector control. (B) Micrographs of L. lactis NZ9000 cells expressing gfp12bs mRNA and GFP protein. PC = phase contrast. Scale bar represents 2 μm. (C) To obtain the model cell which served as a projection space used for the localization maps, we analyzed the area occupied by the nucleoid and the membrane inside of the obtained cell meshes. Using MicrobeTracker, we measured the length and width of the cell meshes (cell outline) as well as the nucleoids stained by DAPI (cyan) of 200 living cells in various states of division (left panel). Furthermore, we extracted the average thickness occupied by the membrane by analyzing living cells expressing the fluorescent membrane protein BcaP-GFP (left panel). For each of these parameters, a population average was obtained. Right panel depicts a schematic, scaled representation of a cell that had just divided, including the obtained length and width averages (displayed in μm). Black lines represent cell contour obtained from cell meshes, turquoise lines depict chromosomal area, and green lines depict cell membrane and cell wall. (D) The Gaussian fit parameters FWHM (full-width at half maximum of spot height (h)), and the spot intensity I (π(FWHM)2h) obtained from spot detection analyses were used to visualize the spatial distribution of transcripts within foci formed by bcaP12bs, codY12bs, PS1Δ912bs, or SUT112bs mRNA. Heat maps were reconstructed from the FWHM values of each focus, all of which were plotted as a function of reciprocal magnitudes for all four transcripts. The white dashed lines serve as a reference and indicate the cut-off of maximal FWHM values reached of spots with increased FWHM-to-brightness ratios. Contrast bar: low (blue) to high (yellow) density of spot parameter distribution.
(TIF)
Overexpressed codY12bs, bcaP12bs, PS1Δ912bs or SUT112bs transcripts visualized in vivo with co-expressed MS2-GFP in L. lactis LG010 cells (left panels). Corresponding phase contrast pictures are shown in the center panels. Scale bar = 5 μm. Location maps of spot projections (right panels) from the MS2 datasets obtained from 794, 1290, 609, and 841 cells, respectively, highlighting the preferential localization of each overexpressed mRNA (Method described in Material and methods). Thick transparent lines: Cell boundaries including the portion occupied by cell wall and membrane as approximated using BcaP-GFP expressing cells (See S1C Fig). Thin transparent lines: Boundaries of chromosomal areas as approximated using DAPI staining in living cells (See S1C Fig). Scale bars depict the relative density of each mRNA species.
(TIF)
(A) Deconvolved fluorescence micrographs of co-visualized bcaP12bs mRNA and the corresponding membrane protein BcaP fused to GFP. The upper panels show cells in which BcaP-GFP aggregation seeds are present, while cells with dense polar bcaP-gfp12bs mRNA clusters in combination with membrane-localized BcaP-GFP are exemplified in the lower panels. The yellow arrowhead in the right-upper panel indicates an overlapping fluorescent mRNA and protein focus. Right panels: false-colored overlays (red: mRNA; cyan: protein). (B) Fluorescence micrographs of L. lactis NZ9000 cells with TAMRA-labeled PS1Δ9-gfp12bs transcripts (left panel), PS1Δ9-GFP (second panel from the left) and a deconvolved false-colored overlay (third panel from the left; red: PS1Δ9-gfp12bs; cyan: PS1Δ9-GFP). Right-most panel: Original false-colored overlay image. Yellow arrowheads indicate signals that show proximal localization of PS1Δ9-GFP protein and mRNA. (C) Upper two panels show fluorescence micrographs of DnaK-GFP localization in L. lactis LG029 cells collected and examined during exponential growth without stress. The upper left panel displays the effect on DnaK-GFP localization of fixation with 3.7% paraformaldehyde (PFA). The upper right panel shows the distribution of DnaK-GFP in living cells. The lower panels depict DnaK-GFP localization in L. lactis LG029 cells expressing either bcaP12bs or PS1Δ912bs. Cells were fixed with 3.7% PFA and prepared for FISH analysis prior to imaging. (D) Histograms and their fitted normal distributions of the distances between centers of PS1Δ9-GFP (grey) or DnaK-GFP (red) foci and polar PS1Δ9-gfp12bs mRNA clusters in 100 single NZ9000 or LG029 cells, respectively. (E) Location maps of preferential localization of PS1Δ912bs mRNA, PS1Δ9-GFP, and DnaK-GFP. Intracellular coordinates of fluorescent foci corresponding to overexpressed PS1Δ912bs mRNA, and of co-visualized PS1Δ9-GFP or DnaK-GFP, reconstructed as described in Data analysis. Scale bars in all micrographs correspond to 2 μm.
(TIF)
(A) Fluorescence micrographs of L. lactis LG045a cells constitutively expressing ParB-GFP, either carrying pNZ8048 without parS sequence (left panel) or pNZ8048 with consensus parS sequence (right panel). (B) pLG-BcaP plasmids visualized in L. lactis NZ9000 using DNA FISH and the TAMRA labeled ms2 probes after non-induced cells were treated with RNase I to remove (complementary) RNA.
(TIF)
(A) Fluorescence microscopy L. lactis LG010 cells expressing MS2-GFP, with or with Cm/Ery treatment. Treated cells display a partial exclusion of MS2-GFP from the nucleoid region. This is not the case in the non-treated cells. Scale bar is 2 μm. (B) The fluorescence of L. lactis NZ9000 cells overexpressing gfp12bs transcripts with or without ribosomal binding sites (RBS). (C) Snap shots of time-lapse microscopy following the subcellular S2-eYFP distribution in L. lactis(rpsB::rpsB-eYFP) grown in nutrition-rich or nutrition-limiting conditions. Cells were grown to mid-exponential phase in GCDM*, after which samples were transferred to a microscope slide with an agarose patch either dissolved in GCDM* or 1×PBS supplemented with 0.5% glucose (GPBS). (D) The relative level of overexpressed codY12bs (black), bcaP12bs (red), PS1Δ912bs (grey), and SUT112bs (blue) transcripts as a function of time after rifampicin addition (at t = 0) was monitored using FISH. The data was fitted to single exponential decay, of which the curves are shown as solid lines. Error bars depict standard deviations obtained from bootstrapped datasets. (E) The dataset of [36] was used to determine the mRNA degradation rates of lactococcal transcripts. The log values of median half-lives, , of a total of 994, 787, and 996 transcripts at growth rate (μ) of 0.11, 0.51, and 0.80 h−1, respectively, were extracted and plotted as a function of the respective growth rates (open black circles). A best fit to the data (dashed black line) followed from . The closed black circle indicates the median at μ = 0.55h−1, corresponding to a median of 10.9 min. A similar strategy was employed to estimate the values of codY (open red circle) and bcaP (open blue circle) mRNA at μ = 0.55h−1, resulting in (dotted red line) and (dotted blue line). The lifetime of codY12bs mRNA (t1/2 = 7.1 min) was in good agreement with that previously reported for codY mRNA (t1/2 = 7.4 min for μ = 0.55 h-1). This corresponds to a for codY or bcap mRNA of 6.4 min or 11.5 min, respectively, at μ = 0.55h−1. Breakdown of overexpressed bcaP12bs mRNA () was at least not slower than that of endogenous bcaP mRNA. Note that media composition differs substantially between our measurements and those performed by Dressaire et al., possibly influencing specific mRNA lifetimes. (F) Degradation curves of PS1Δ912bs (grey squares) or SUT112bs (blue squares) of cells containing polar mRNA clusters (filled squares, solid lines) or cells without such foci (open squares, dashed lines). The data were fitted to single exponential decay functions, of which corresponding curves are depicted in the graph. (G) Degradation curves of bcaP12bs or PS1Δ912bs transcripts with (red and grey dashed lines, respectively; replicated from (D)) or without functional RBS (red and grey solid lines).
(TIF)
(MOV)
(MOV)
(MOV)
(MOV)
Cells from a nisin-induced culture were transferred to a microscope slide with an agarose patch in growth medium without additional inducer. Scale bar represents 2 μm.
(AVI)
Cells from a nisin-induced culture were transferred to a microscope slide with an agarose patch in growth medium without additional inducer. Scale bar represents 2 μm.
(AVI)
Cells from a nisin-induced culture were transferred to a microscope slide with an agarose patch in growth medium without additional inducer nisin. Scale bar represents 2 μm.
(AVI)
Cells from a nisin-induced culture were transferred to a microscope slide with an agarose patch in growth medium without additional inducer. Scale bar represents 2 μm.
(AVI)
Abr = Antibiotic resistance. Amp = ampicillin, Cm = chloramphenicol, Ery = erythromycin.
(DOCX)
Underlined nucleotides highlight restriction enzyme sites.
(DOCX)
(DOCX)
Content: 1. Validation of single-probe FISH for transcript visualization in L. lactis. 2. Evaluation of the MS2 system for visualization of overproduced transcripts in living L. lactis cells. 3. Plasmid and strain construction. 4. S1 Text—Figures. 5. S1 Text—References.
(DOCX)
Data Availability Statement
All relevant data are within the paper and its Supporting Information files.