Significance
The exploration of the internal conformational fluctuation dynamics of an enzyme during a catalytic event can have significant implications in the field of enzymology. How an enzyme modulates its conformations under mechanical perturbation while still retaining its activity to a significant extent can be of particular interest in the area of protein engineering. Using single-molecule total internal reflection fluorescence microscopy-guided confocal spectroscopy combined with magnetic tweezers we have interrogated the conformational dynamics of horseradish peroxidase enzyme. We have identified the presence of complex conformations during the product releasing step. However, the complexity is narrowed or even eliminated when the enzyme is deformed or unfolded under magnetic pulling force.
Keywords: enzymatic conformational dynamics, magnetic tweezers, mechanical force manipulation, enzymatic product releasing, fluorogenic substrate
Abstract
Unraveling the conformational details of an enzyme during the essential steps of a catalytic reaction (i.e., enzyme–substrate interaction, enzyme–substrate active complex formation, nascent product formation, and product release) is challenging due to the transient nature of intermediate conformational states, conformational fluctuations, and the associated complex dynamics. Here we report our study on the conformational dynamics of horseradish peroxidase using single-molecule multiparameter photon time-stamping spectroscopy with mechanical force manipulation, a newly developed single-molecule fluorescence imaging magnetic tweezers nanoscopic approach. A nascent-formed fluorogenic product molecule serves as a probe, perfectly fitting in the enzymatic reaction active site for probing the enzymatic conformational dynamics. Interestingly, the product releasing dynamics shows the complex conformational behavior with multiple product releasing pathways. However, under magnetic force manipulation, the complex nature of the multiple product releasing pathways disappears and more simplistic conformations of the active site are populated.
Enzymes are capable of enhancing biological reaction activity by millions or even billions of times (1). A typical enzymatic turnover cycle involves multiple steps: substrate (S) binding to the active site of the enzyme (E) in forming an enzyme–substrate complex E+S→[E·S]; enzymatic reaction converting substrate to nascent product (P), [E·S]→[E·P]; and product releasing from the enzyme active site, [E·P]→E+P, which completes an enzymatic reaction turnover (2–4). In recent years, it has been widely identified that conformational dynamics plays a crucial role in regulating enzymatic reactions (2, 4–7). The advent of site-specific mutagenesis, single-molecule (SM) spectroscopic technique, and molecular dynamics simulations have demonstrated complex dynamics involving multiple conformational states during a catalytic cycle (4, 5, 7–13). Fundamentally, not only the enzymatic active site conformational dynamics but also the overall conformational fluctuation dynamics of the protein matrix, providing the required entropy, enthalpy, and corresponding energy landscape, has a profound impact on an enzyme to ultimately possess the power of enhancing reaction rates. Nevertheless, capturing an individual snapshot of each intermediate conformational step remains challenging, mainly due to the transient nature of those intermediate structures, inadequacy of the conventional structure analysis methods to seize those fluctuating structures, and lack of molecular probes that can specifically report the active site environment at each step of an enzymatic reaction. More often than not, the rate-limiting step is the product release from the active site (14). However, a thorough and comprehensive picture of the product release mechanism is still insufficient, mostly due to the complexity and inhomogeneity of the enzymatic dynamics. For example, by what exact mechanism a product exits the active site and the energetically preferential configurations of an enzyme to release the product are still not clear. Few studies have tried to address these questions and related effects on other macroscopic parameters directly through experimental approaches (9, 15–19). We recently reported that horseradish peroxidase (HRP) can involve multiple intermediate conformational states and pathways during product releasing, and a significant pathway is that the product molecules are spilled out from the enzymatic reaction site; however, releasing the product molecules through a loosely bound enzyme-product state and an open active site remain parallel product releasing pathways (9). Further, very recently our group has reported that HRP retains a significant amount of its activity even under conformational perturbations (20). Here, we aim to systematically characterize not only the mechanism and dynamics involved in product release of HRP but also the complex conformational dynamics involved in each step of a catalytic cycle by directly manipulating the reaction coordinates. We further extended our study and applied our newly developed SM approach of actively manipulating the reaction coordinates using combined SM time-resolved photon time-stamping spectroscopy and magnetic tweezers to understand the effect of conformational perturbation on the conformational dynamics and mechanism of enzymatic product release.
The biological function of an enzyme is presumably followed in real time by using mainly three kinds of fluorescent reporter molecules: (i) intrinsic fluorescent residues (e.g., tryptophan or tyrosine), (ii) site-specific labeling, and (iii) fluorogenic substrate (8, 11, 21). Application of fluorogenic substrate (nonfluorescent) is a direct approach to follow enzymatic reaction turnovers as it gets converted into a fluorescent product molecule by the enzyme. As the product molecule quickly exits the detection volume within microseconds it provides a direct readout of enzymatic reactions with single turnover resolution (5, 8, 9, 22–24). Additionally, fluorescent product molecules are produced continuously in turnover cycles and this eliminates the negative impact of photobleaching, and thereby long time trajectories from a single enzyme can be recorded (8, 9). In this work, we extend the SM fluorogenic assay and imaging analysis to a new dimension by combing the total internal reflection fluorescence microscopy (TIRFM)-guided confocal time-resolved SM photon time-stamping spectroscopic approach and the SM fluorogenic assay combined with magnetic tweezers force manipulation of molecular conformations: We used the nascent formed fluorescent product as an in situ probe to study the active site conformational fluctuation dynamics during the enzymatic reaction from the moment the product incipiently formed to the releasing of the fluorescent product from the active site (9, 20, 25). It is a conceptual and technical advancement to use a nascent-formed fluorogenic product molecule serving as a probe for enzymatic reaction active site with perfectly fitted position with the critical molecular interactions without perturbing the active site as in the case of site-specific labeling. Furthermore, magnetic tweezers give us the edge over chemical denaturation by introducing conformational perturbation in a noninvasive and controlled way (20, 26), that is, we are able to deform the enzymatic conformations under enzymatic conditions, which is beyond the conventional protein structure denature assays that are carried out under chemical conditions, such as pH, electrolytes, and chemical denaturants, which are not physiological enzymatic reaction conditions.
Results
HRP is a 44-kDa monomeric metalloenzyme containing a heme prosthetic group and each substrate turnover is produced from a single catalytic cycle (27, 28). HRP oxidizes both organic and inorganic compounds in the presence of hydrogen peroxide (H2O2) as an oxidizing agent (28–30). We have used Amplex Red (10-acetyl-3,7-dihydroxyphenoxazine) as nonfluorescent substrate, which is converted into highly fluorescent resorufin by HRP in the presence of H2O2 (Fig. 1A) (23).
Fig. 1.
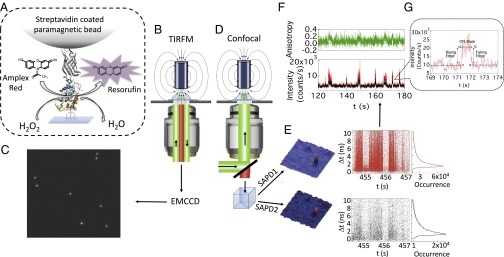
Conceptual representation of our system and analysis method. (A) Single HRP enzyme is immobilized on a modified glass coverslip at one end and tethered to a paramagnetic bead at the other end through biotin–streptavidin linking. A magnetic field of ∼2,000 Gauss at ∼2 mm is applied to 1-μm-diameter paramagnetic beads to generate ∼2 pN of pulling force on the beads and hence to the enzyme molecules (Supporting Information). (B) Schematic of wide-field excitation in TIRFM under an applied magnetic field. (C) Typical snapshot of an image from an electron multiplying CCD (EMCCD). (D) Schematic of the confocal microscope under an applied magnetic field. (E) Fluorescence confocal images collected in two polarization components from the single photon avalanche photodiodes (SAPD1 and SAPD2) and corresponding typical raw data of SM photon time stamping. (F) Intensity and anisotropy trajectories calculated from time-stamping data. (G) The rising edge, ON state, and the falling edge of a catalytic event.
We used TIRFM to pinpoint spatially randomly located enzymes from the stochastic on–off fluorescence signals originating from catalytic cycles (Fig. 1 B and C). Successively using the confocal time-resolved SM photon time-stamping technique, we followed enzymatic turnover events for two different polarizations, vertical and parallel with respect to the excitation light polarization (Fig. 1 D and E) (see Supporting Information for details). In an SM photon time-stamping measurement, for each detected photon (here each data point in Fig. 2E) two parameters are recorded: chronic arrival time (t) and delay time between the photo excitation and each emitted photon (Δt) (31). The histogram of the delay times (Δt) gives a typical SM fluorescence lifetime (Fig. 1E) and the intensity trajectory is calculated from the distribution of arrival time (t) within a given bin time (Fig. 1F, Lower). Further, from the intensity trajectories in two different polarizations, rotational anisotropy can be calculated (Fig. 1F, Upper). Simultaneous measurements of photon chronic arrival time and delay time along with rotational anisotropy improve the resolution of detection of individual species and provide rich information about the properties of a fluorophore and its surrounding environment (9, 31–36). In this regard our study is unique and advanced in interrogating the product-releasing mechanism and associated conformational dynamics. In our assay, HRP was tethered to the glass coverslip according to Fig. 1A (see Supporting Information for details). In previous reports, typically ∼100 nM substrate and from micromolar to millimolar concentrations of H2O2 have been used to avoid enzymatic side reactions, autoxidation, and photooxidation of nonfluorescent substrate to fluorescent product (5, 24, 37, 38). The reaction solution in the current work contains 200 nM Amplex Red and 2 mM H2O2. A low turnover rate (∼0.1–0.3 s−1) is recorded due to the low substrate concentration. Additionally, only those isolated events with a high fluorescence photon count (>1,000 photons over the entire catalytic event) are considered and analyzed subsequently. The low turnover rate helps us to identify single enzymatic events distinctly, which remains the main focus of this study. However, we cannot completely exclude the effect of steric hindrance of tethered enzymes on turnover rate (39).
Fig. 2.
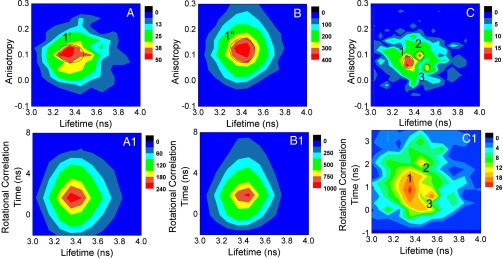
Two-dimensional joint distribution of anisotropy and lifetime (Upper) and rotational correlation time and lifetime (Lower) calculated from 281 catalytic turnovers. Two-dimensional joint distribution of anisotropy and lifetime at (A) the rising edge, (B) ON state, and at (C) the falling edge. Two-dimensional joint distribution of rotational correlation time and lifetime at (A1) the rising edge, (B1) ON state, and (C1) the falling edge.
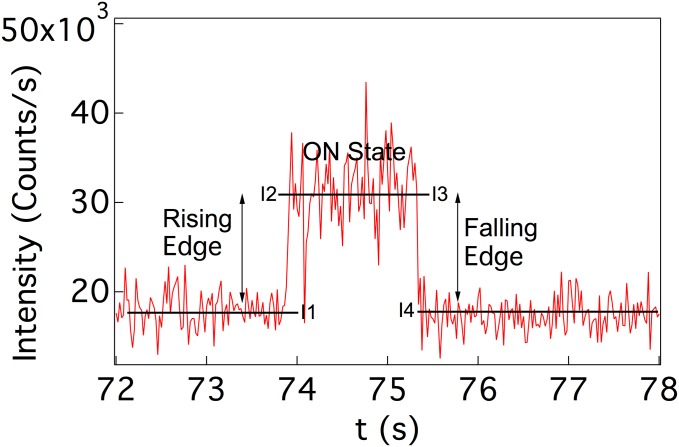
Fig. 1F shows a portion of anisotropy trajectory and the corresponding intensity trajectories in two polarization channels. Single enzymatic events can be detected as photon bursts with amplitudes above the background noise. The fluorescence signal from the product can be detected only when it is still confined within the active site. The microsecond diffusion time of product fluorescent molecule essentially eliminates the possibility of acquiring a fluorescence signal from diffusing fluorescent molecules (40). As evident from Fig. 1F, the anisotropy fluctuates around zero between consecutive fluorescent bursts or events. During a catalytic event, anisotropy increases drastically to a higher value. The higher anisotropy value signifies that during a catalytic event the fluorescent product exhibits relatively confined motion inside the active site of the enzyme. The anisotropy fluctuations can arise from the dynamic conformational fluctuation of the protein matrix and nearby local environment. Aromatic substrates form a stable 1:1 complex with HRP through hydrophobic interactions and hydrogen bonds involving the amino acid residues arginine, histidine, and proline (27, 28). The rigid interaction of resorufin with active-site residues through hydrogen bonding and hydrophobic interaction prevents the product from rotating freely inside the active site. The relatively confined rotation of fluorescent product is reflected in the measured high anisotropy, which also reflects the conformational dynamics of active site, specifically the solvent-exposed heme prosthetic group (9). To identify the specific nature of enzyme–substrate and enzyme–product interactions at the active site we have divided a catalytic event into three parts probed from the signals (Fig. 1G): the rising edge, ON state, and falling edge. The rising edge corresponds to the nascent product formation, which is the onset of an enzymatic turnover, ON time represents the duration when the product is still confined to the active site, and falling edge corresponds to the moment just before the product is released from the active site of the enzyme (Supporting Information). Dividing a catalytic event into different parts gives us insight about how the active-site conformation evolves with time as the reaction proceeds along the reaction coordinate.
To investigate in detail, we have plotted the 2D joint distribution of lifetime (τf) and anisotropy (r) (32, 41). Fig. 2 A–C shows the 2D joint distribution of fluorescence lifetime and anisotropy at the rising edges, during the ON states, and at the falling edges, respectively, from 281 catalytic events. SM fluorogenic product lifetime is calculated as the average delay times of all of the photons in 20-ms bin times for both polarizations. Fig. 2A clearly shows only one domain exists (domain 1′) in anisotropy and lifetime joint distribution at the rising edge. Domain 1′ centers around τf = 3.3 ± 0.2 ns and r = 0.11 ± 0.04. All of the error bars are calculated as two SDs so that 95% of the data fall within two SDs from the mean and the SDs for all of the domains are calculated from the data that fall within the black circles. The similar conformation continues to persist along the reaction coordinate because only one domain (domain 1′′) is present during ON state centering on τf = 3.4 ± 0.1 ns and r = 0.12 ± 0.06, similar as domain 1′ (Fig. 2B). This result strongly suggests that the active site conformation populated during the rising edge (i.e., when the nascent product is formed) continues to persist as the reaction proceeds. The large SDs of domain 1′ and 1′′ represent the large-scale conformational motions involved. Interestingly, the 2D joint distribution of falling edge (Fig. 2C) exhibits three distinct domains (domains 1, 2, and 3). The presence of multiple distinct domains reveals that multiple distinct conformations of the active site of HRP are populated during the time the product resorufin is released from the active site. Domain 1 is centered on τf = 3.3 ± 0.1 ns and r = 0.07 ± 0.04, domain 2 is centered at τf = 3.5 ± 0.04 ns and r = 0.10 ± 0.04, and domain 3 is centered on τf = 3.5 ± 0.04 ns and r = 0.05 ± 0.02. We further calculated the corresponding rotational correlation time (τr) for all of the domains (Supporting Information). Domain 1′ of the rising edge is centered on 1.8 ns, which has a τr similar to domain 1′′ of the ON state (τr = 2.0 ns). In the falling edge, the corresponding τr for domains 1, 2, and 3 are 0.9, 1.5, and 0.6 ns, respectively. It is interesting to observe that in the falling edge domain 2 has a τr comparable to that of at the rising edge and ON state. Resorufin has a rotational correlation time of ∼0.1 ns in water (42). The higher anisotropy and τr (1.5 ns) in domain 2 correspond to a confined environment or tightly bound state for resorufin. Domains 1 and 3 have lifetime values similar to those of other domains but much smaller anisotropy and hence a faster rotational correlation time, which may represent a much looser state of the HRP active site. Loose enzyme–product states present in domains 1 and 3 are most likely associated with the enzyme active site’s opening up to release the product into the solution. Loosely bound domains 1 and 3 have 54% and 18% relative population, respectively, and tightly bound domain 2 has 27% relative population (population percentages are calculated for the data that fall within the black circles in Fig. 2). The significant population of domain 2 indicates that even tightly bound conformations have favorable electrostatic interactions and other possible interactions. Plausible explanations could be that (i) domain 2 represents intermediate conformational states of the enzyme in the final product-releasing step while waiting for the right orientation of the amino acid residues necessary to open the active site for product release, thereby populating loosely bound domain 1 and 3, and (ii) domains 1 and 3 are populated as parallel pathways along with domain 2 to release the product. The presence of tightly bound states (domain 2) suggests that the product is expelled from the active site into the solution. The existence of both loose states (domain 1 and 3) and a tightly bound state (domain 2) suggests complex conformational dynamics of the active site before the product diffuses away. Although the 2D joint histogram successfully unravels the existence of structurally distinct multiple forms of the active site in the product-releasing step, the low time resolution of our experimental setup limits us from revealing the sequence of appearance of the intermediate conformations in the falling edges of the photon bursts. High time resolution and further structural studies are required to validate a definite conclusion. The corresponding 2D joint distributions of lifetime and rotational correlation time at the rising edge, ON state, and falling edge are shown in Fig. 2 A1–C1, respectively. Consistent with 2D joint distribution of lifetime and anisotropy, 2D joint distribution of lifetime and rotational correlation time also shows complex multiple conformational populations in the falling edge.
The formation of a distinct intermediate conformational state in the product release step has also been reported recently. A study with lysozyme showed that an intermediate “unlocked” state is populated to facilitate product release and large-scale conformational fluctuations exist along the catalytic cycle modulating the interaction with the product necessary for releasing it (15). Further, a recent study revealed that dihydrofolate reductase from Escherichia coli releases product in two parallel pathways, an intrinsic pathway and an allosteric pathway, and the enzyme’s conformational dynamics plays a critical role in controlling product release (16). Experimentally observed continual change in the coupled protein–water hydrogen-bond dynamics during catalytic cycle further supports our finding that different conformational intermediates are formed during a catalytic cycle (10, 43).
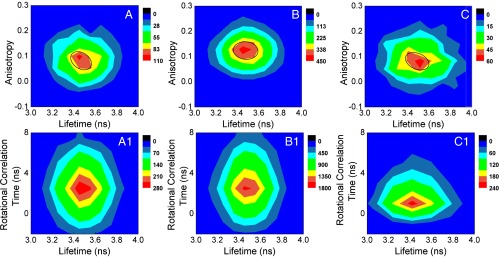
To acquire deeper insight about active-site conformational fluctuation during a catalytic event, we characterized the effect of mechanical perturbation on the conformational dynamics. For that purpose we used magnetic tweezers applying a pulling force of ∼2 pN. Although the applied force is much weaker than the force needed to break a hydrogen bond (6–9 pN), previous reports suggest that the 1- to 2-pN external pulling force can deform or unfold an enzyme by 30–100%, thereby weakening the enzyme–substrate interaction (20, 44) (see Supporting Information for the force calibration curve). Fig. 3 A–C shows the 2D joint distribution of lifetime and anisotropy at the rising edges, during the ON states, and at the falling edges from 356 catalytic events under the magnetic pulling force of ∼2 pN. The rising edge centers on τf = 3.4 ± 0.10 ns, r = 0.12 ± 0.06 and the corresponding τr is 2.1 ns. The ON state is centered on τf = 3.5 ± 0.14 ns, r = 0.12 ± 0.04 and the corresponding τr is 2.1 ns. Interestingly, falling edge under 2-pN magnetic pulling force consists of only a single domain centering on τf = 3.5 ± 0.2 ns, r = 0.07 ± 0.04, and corresponding τr is 1.0 ns. Additionally, the domain at the falling edge centers on lower anisotropy, hence the lower rotational correlation time than that at the rising edge or ON state. The 1.0-ns rotational correlation time at the falling edge under force pulling matches with the rotational correlation time of domains 1 and 3 of the falling edge under no force pulling. This suggests that under force manipulation the enzyme undergoes conformational deformation and loses its native active-site thermal conformational fluctuation to a certain extent. Upon losing its rigid active-site structure the enzyme ceases to have a distinct tightly bound conformational population like domain 2 under no force pulling. At this conjecture, it is important to note that conformational fluctuation of the enzymatic active site due to thermal fluctuation has a critical role in enzymatic activity. As a result of that fluctuation the enzyme will still be able to explore all other subsets of active-site conformations even after being perturbed by a piconewton external pulling force. However, as can be seen from Fig. 3C, the clear separation between the conformational domains seen in Fig. 2C is lost under the force-pulling condition and the distribution centers on a lower rotational correlation time (1.0 ns). It is well known that enzyme interacts with the transition state much more tightly than the substrate or the product (45). Because we have applied a much weaker pulling force (∼2.0 pN) than that needed to break a hydrogen bond, we expect that the interaction of the product with the active site at the rising edge and ON state remains much stronger and hence unaffected by the piconewton external pulling force. The high rotational correlation time at the rising edge and ON state under force pulling (∼2.0 ns) corroborates this. However, at the falling edge when the enzyme is ready to release the product the interaction further weakens due to the pulling force and the loosely bound state becomes the dominant product-releasing state, which is reflected by faster rotational anisotropy.
Fig. 3.
Two-dimensional joint distribution of anisotropy and lifetime (Upper) and rotational correlation time and lifetime (Lower) calculated from 356 catalytic turnovers under ∼2 pN of magnetic pulling force. Two-dimensional joint distribution of anisotropy and lifetime at (A) the rising edge, (B) ON state, and (C) the falling edge. Two-dimensional joint distribution of rotational correlation time and lifetime at (A1) the rising edge, (B1) ON state, and (C1) the falling edge.
A central conjecture in enzymology is that the efficiency of catalysis is mainly directed by the strong structural interaction between enzyme and substrate. However, recent experimental developments reveal significant effects of conformational dynamics on enzymatic reaction rate (2, 4–7). Considering our experimental findings that multiple conformational states are populated during the product release step, we anticipate that the charge redistribution in an enzymatic reaction, as seen in X-ray crystallography (27), may trigger dramatic conformational changes in the enzyme active site, which also can be seen in Fig. 2C.
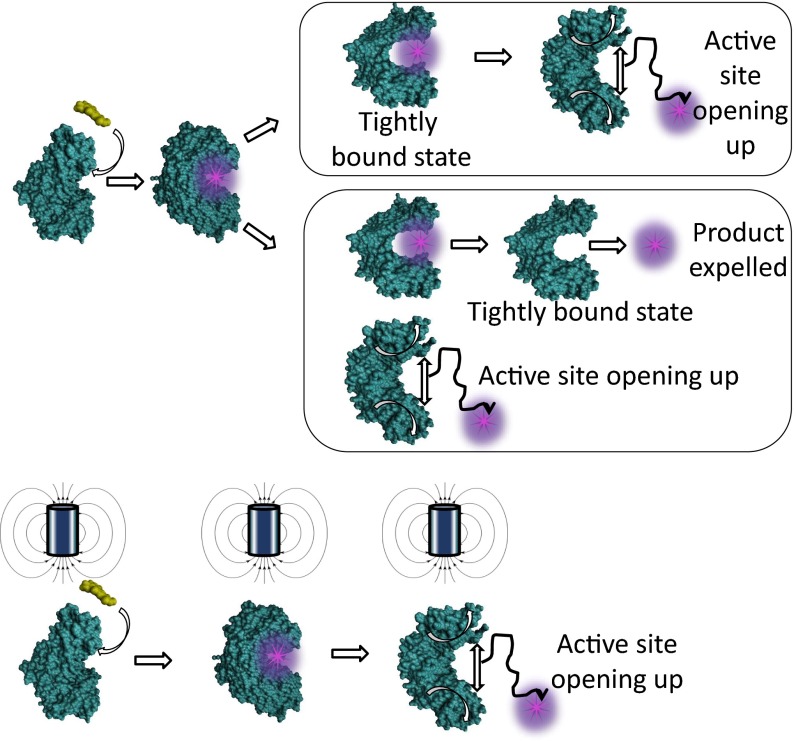
The multiple conformations populated due to the effective charge redistribution facilitate release of the product from the active site either by opening the active site after exploring tightly bound states or by populating multiple parallel pathways where the product is expelled from a tightly bound active site along with a loosely bound open active site. Under a piconewton external pulling force HRP retains its activity but loses the complex conformational dynamics in the product-releasing step. Interestingly, even after structure deformation, HRP retains its wild-type (or unperturbed) conformational dynamics to a large extent that rely on flexibility. A conceptual representation in Fig. 4 illustrates our finding that the external mechanical force changes not only the enzymatic reaction activity but also the mechanism (i.e., the pathway of the enzymatic reaction).
Fig. 4.
Schematic representation of the product-releasing pathways.
Conclusion
We have presented a study of HRP conformational dynamics and mechanism during catalysis of oxidation of Amplex Red, demonstrating that a piconewton mechanical force manipulation is able not only to change the enzymatic active-site conformations but also to manipulate the enzymatic reaction pathways. Magnetic tweezers combined with TIRFM-guided SM photon time-stamping spectroscopy has been used to recognize different intermediate conformational states during a catalytic cycle. Our unique approach of using a fluorogenic product and detailed analysis of different catalytic steps of product formation and release gives us the advantage of identifying conformational changes directly associated with enzymatic reaction in real time with single-turnover resolution. The study demonstrated that although the active site populates a single conformation with large-scale fluctuations at the nascent product formation, the conformational dynamics becomes more complex at the product-releasing step. The product-releasing process involves, alongside an open active-site conformational state, distinct tightly bound intermediate states right at the nascent product release from the enzymatic active site, showing parallel product solvation and releasing pathway and product spilling-out pathway. The presence of multiple conformational states and pathways in the product-releasing step indicates that the mechanism by which product exits the active site is much more complex than what has been reported so far. Observing a comparatively simpler conformational population when the enzyme is mechanically perturbed by a piconewton mechanical force further supports this conclusion. Although further experimental, structural, and simulation studies are necessary to draw a generalized picture about the product release mechanism, the insightful information obtained in this study can be significantly useful in understanding the enzymatic reaction mechanism and the related free energy landscape.
Materials and Methods
Materials.
The HRP-catalyzed reaction converts nonfluorescent Amplex Red into fluorescent resorufin in the presence of H2O2. In our system, streptavidin-coated paramagnetic beads were covalently linked to the HRP enzymes through a biotin–streptavidin link.
Sample Preparation.
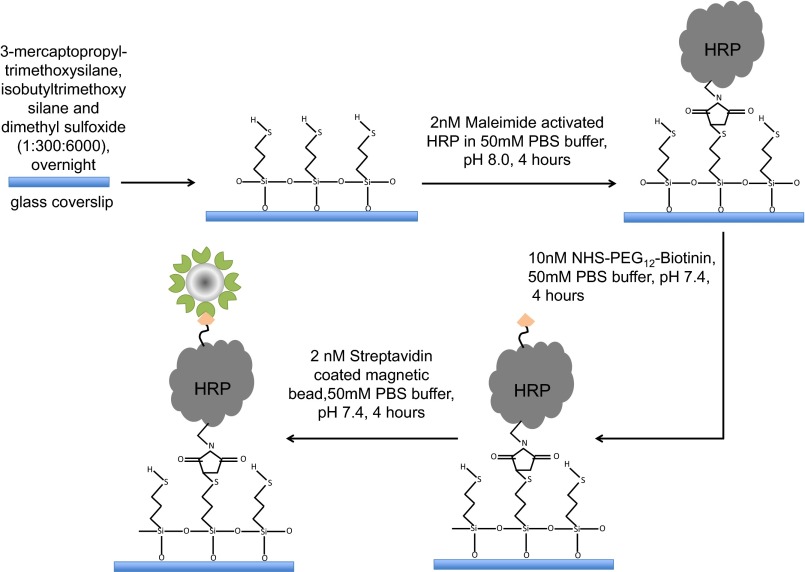
Maleimide-activated HRP was linked to the sulfhydryl (−SH) group of the silanated glass coverslip. HRP has six lysine residues. The -NHS end of the linker NHS-PEG12-biotin reacts with the -NH2 group of lysine residues. Next, biotin binds with streptavidin coated on the paramagnetic beads. The reaction solution with 200 nM Amplex Red and 2 mM H2O2 in PBS buffer (pH 7.4) was prepared just before the experiment (see Supporting Information for details).
Experimental Setup.
We used a home-built TIRFM-guided confocal fluorescence spectroscope combined with magnetic tweezers based on an inverted microscope (Axiovert 200M; Carl Zeiss) equipped with a 63× oil-immersion objective (N.A. 1.4, Plan-Apochromat; Zeiss). The TIRFM mode helps us to pinpoint spatially randomly distributed enzymes from stochastic fluorescence bursts originating from catalytic events and the confocal mode is used to acquire photon time-stamping data. We acquired SM data while simultaneously applying a pulling magnetic force via magnetic tweezers. Cover glass tethered with HRP was attached at the bottom of the sample chamber and a lid was placed on the top of the chamber to prevent evaporation during data acquisition (see Supporting Information for details).
Details of Sample Preparation
Chemicals.
Maleimide-activated HRP enzyme was purchased from Thermo Scientific (31485). EZ-Link NHS-PEG12-biotin was purchased from Thermo Scientific (21312). Streptavidin-coated paramagnetic beads were purchased from Invitrogen (Dynabeads MyOne Streptavidin T1). Amplex Red was bought from Life Technologies (A22188). All other chemicals were purchased from Sigma-Aldrich and used without further purification.
Sample Preparation.
The glass coverslips (Gold Seal, 3306; Thomas Scientific) are first washed in chromic acid to eliminate grease and fluorescent impurities. After washing with water, the cover glasses are sonicated in acetone, methanol, and water, respectively. After drying with nitrogen gas, the cover glasses are treated overnight (∼12 h) with a solution of 3-mercaptopropyl-trimethoxysilane (175617; Aldrich), isobutyltrimethoxysilane (444065; Aldrich), and dimethyl sulfoxide (D4540; Sigma) mixed in a volume ratio of 1:300:6,000. The silanated cover glasses were washed with methanol and water. Then the coverslips were incubated in about 2 nM maleimide-activated HRP prepared in 50 mM PBS (pH 8.0) for 4 h, followed by rinsing with water. PBS buffer was prepared by mixing potassium phosphate dibasic solution (P8584; Sigma-Aldrich) and potassium phosphate monobasic solution (P8709; Sigma-Aldrich). Maleimide-activated HRP was linked to the sulfhydryl (−SH) group of 3-mercaptopropyl-trimethoxysilane on the coverslip. HRP has six lysine residues: 65, 84, 149, 174, 232, and 241. Next, we incubated the coverslips in 10 nM NHS-PEG12-biotin solution in 50 mM PBS buffer, pH 7.4, for 4 h. The -NHS end of the linker NHS-PEG12-biotin reacts with the -NH2 group of lysine residues. After washing the coverslips, we incubated them in 2 nM streptavidin-coated paramagnetic bead solution in 50 mM PBS buffer, pH 7.4 for 4 h. Streptavidin, which is coated on the paramagnetic beads, binds with biotin (Fig. S1). Substrate Amplex Red solution was prepared in dimethyl sulfoxide and stored at −20 °C in the dark.
Fig. S1.
Sample preparation method.
Enzymatic Reaction Essay
HRP enzyme is tethered to the surface of coverslip at one end and attached to a paramagnetic bead at the other end. The reaction solution with 200 nM Amplex Red and 2 mM H2O2 in PBS buffer (pH 7.4) was prepared just before the experiment. A home-built chamber was filled with about 300 μL of reaction solution. A cover glass tethered with HRP was attached at the bottom of the chamber and a lid placed on the top of the chamber to prevent evaporation during data acquisition.
We conducted control experiments to ensure the enzymatic activity for each sample and each imaging measurement. For example, in an enzymatic fluorogenic imaging assay, when no enzyme molecule was present in the imaging focal volume no stochastic fluorescence burst was observed, but only rare background noise was recorded in fluorescence intensity trajectories. Meanwhile, the average fluorescence intensity of the background increases with time as more and more fluorescent resorufin was produced by surrounding single-molecule HRP and the fluorescent product diffused into the imaging focal volume. Those typical observations indicated that the HRP enzyme was active during the experiment (5, 9, 20, 24, 38).
Experimental Setup and Measurement Concept
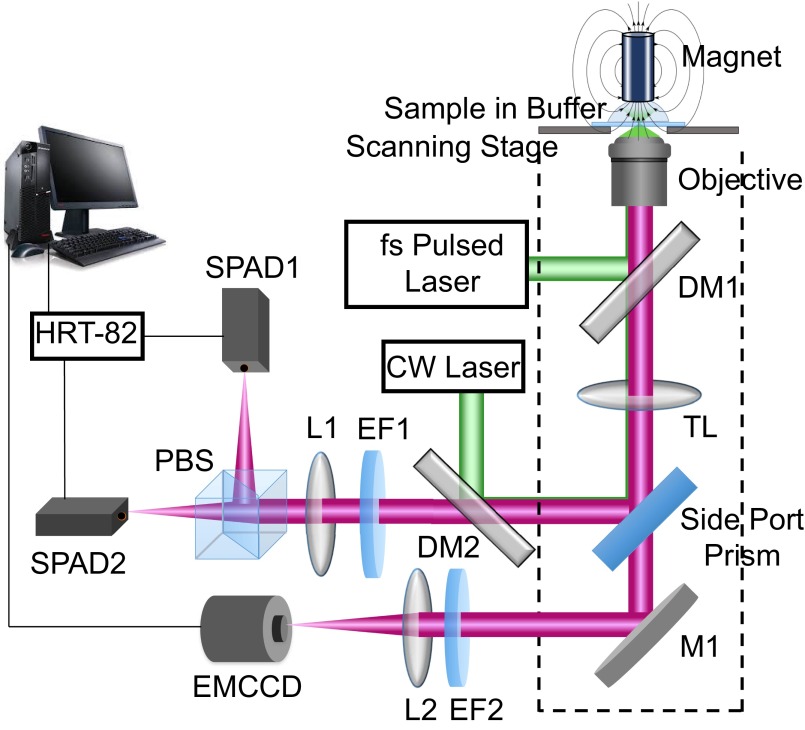
We used a highly sensitive home-built TIRFM-guided confocal fluorescence spectroscopy setup based on an inverted confocal microscope (Axiovert 200M; Carl Zeiss) equipped with a 63× oil-immersion objective (N.A. 1.4, Plan-Apochromat; Zeiss) (9, 25). The TIRFM mode pinpoints spatially randomly located enzymes from the stochastic on–off fluorescence signals originating from a catalytic cycle and confocal mode is used to measure the time-resolved dynamics of target enzyme. A home-developed software combines TIRFM mode and the confocal mode. After accurately registering the fluorescent spot of interest in TIRFM mode, the excitation focus of the confocal mode is shifted to the point of interest for confocal measurements (9, 25). Fig. S2 shows the experimental setup schematically. The details of the experimental setup are described elsewhere (25). Briefly, in the confocal mode, a femtosecond pulse laser (Chameleon Discovery, instrument response function ∼350 ps; Coherent) is used. The horizontally polarized pulse laser at 1,064 nm is frequency-doubled by a β-barium borate crystal and enters through the back port of the microscope, reflected by the dichroic mirror beam splitter (DM1) and focused on the cover glass–solution interface by the objective. The reaction solution is filled in a chamber placed on the piezoelectric scanning stage (Nano-H100; MCL). The fluorescence bursts are collected by the same objective. After passing through DM1, the signal is reflected by the side port prism and transmitted through DM2 and an emission filter EF1. A remagnification lens (L1) refocuses fluorescence signals to the SPAD1 and SPAD2 (SPCM-AQR-14 and SPCM-AQR-16; PerkinElmer) entrances. The polarization beam splitter separates the fluorescence signal into parallel and perpendicular polarization components with respect to the excitation. The signals from SPADs are routed by the HRT-82 module and then connected with the single-photon counting module (SPC-830; Becker & Hickl GmbH) to record both photon arrival time (t) and delay time (Δt) between the excitation pulse and excited state emission of each single photon. In the TIRFM mode, a CW laser (GCL-050-L; CrystaLaser) enters the microscope through the side port by a dichroic mirror (DM2) then is reflected by the side port prism and focused by the tube lens (TL) on the back focal plane of the objective. By slightly increasing the angle of incidence from 45° by rotating DM2, the incident angle at the cover glass/solution interface is adjusted to exceed the critical angle for total internal reflection. After the fluorescence emission is collected by the same microscope objective, it is passed through the side port prism and reflected by M1 to enter the EMCCD (PhotonMax 512B; Princeton Instruments). An emission filter (EF2) purifies the fluorescence signal.
Fig. S2.
Experimental setup. PBS, polarization beam splitter.
When excited by a polarized light, the molecules that have absorption dipole moments oriented within a particular range of angle with respect to the excitation polarization will have maximum probability of absorption. If the molecules are in a constraint environment, then the emitted fluorescence will also have the polarization within the same range of angle to the excitation. Hence, typically the fluorescence intensity decays in parallel and perpendicular polarization with respect to excitation will be distinct. Fluorescence anisotropy helps to unravel the inherent properties of a fluoroscent probe as well as its surrounding environment (34). Time-resolved anisotropy decays are generally acquired by exciting the fluorophore with a vertically polarized light. We have divided the fluorescence signal into parallel III(t) and perpendicular I⊥(t) components relative to excitation by using a polarizer beam splitter. The total fluorescence intensity and the anisotropy is given by
| [S1] |
| [S2] |
G is the correction factor due to the polarization-dependent sensitivity of the detectors and other instrumental factors. The G factor for our instrumental setup is measured to be 1.9. Fluorescence lifetime is calculated as the average of the arrival time of all of the photons that come within a 20-ms bin time. The rotation correlation time can be calculated using Perrin’s equation as
| [S3] |
Here, r is steady-state anisotropy, r0 is the fundamental anisotropy in the absence of molecular rotation, τf is the fluorescence lifetime, and τr is rotational correlation time. The fundamental anisotropy of the resorufin is 0.318 measured in 80% glycerol solution (9, 35, 36).
Force Calibration for Magnetic Tweezers
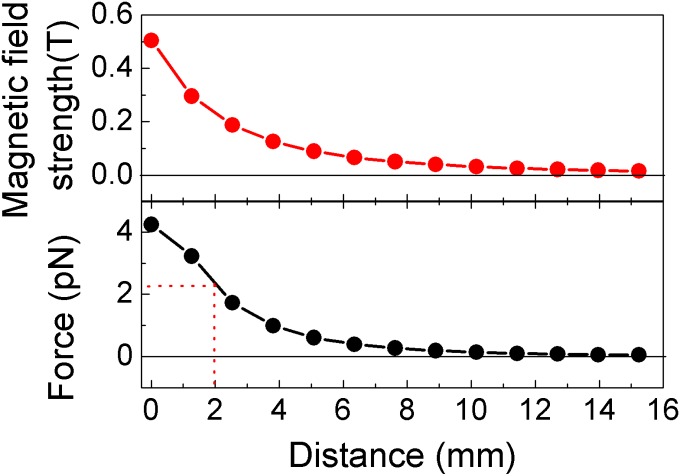
A cylindrical permanent magnet is the key component of our magnetic tweezers. The magnet is placed on an independent 3D rotational movement stage to control the movement of the magnet. In the absence of the magnetic field, the magnetic moment of each atom in the magnetic bead points in a random direction. However, in the presence of an external magnetic field the paramagnetic bead is magnetized and acts as a tiny magnet and moves toward the higher magnetic flux. We controlled the magnitude of the force by moving the magnet vertically. In our system, we calculated the mechanical force on HRP enzyme through the tethered paramagnetic bead by measuring the magnetic field by placing the probe of a Gaussmeter at different distances away from the permanent magnet. A magnetic field strength curve (Fig. S3) was obtained as a function of the distance between the magnet surface and the sample. Force is calculated by taking the gradient of the magnetic field strength (B). For a given magnetic bead, the force can be calculated with the following equation:
| [S4] |
where m is the magnetic moment of the paramagnetic bead and is the product of volume magnetization (M) and volume (V). For our system M is 43 × 103 Am−1 and V is 0.6 × 10⁻¹⁸ m3. Thus, according to the calculation, an external force of 2.0 pN can be applied on the paramagnetic beads when the distance between the glass coverslip and the surface of the magnet is ∼2 mm. The force calibration curve is shown in Fig. S3.
Fig. S3.
Magnetic force calibration curve.
In the experiments, the cylindrical permanent magnet of our magnetic tweezers is placed on an independent translation stage. The sample chamber is put on an x-y translational stage. The distance between the magnet and the sample glass coverslip is maintained at ∼2 mm applying ∼2 kG magnetic field on the paramagnetic beads.
Rising Edge, ON State, and Falling Edge
Each catalytic event is divided into three parts: the rising edge, ON state, and falling edge. The rising edge corresponds to the time when nascent product is just formed, which is the onset of an enzymatic turnover, ON time represents the period when the product is still confined in the active site, and falling edge corresponds to the moment just before the product exits the active site. The limits of the rising edge, ON state, and falling edge are identified as the time interval between the intensity values I1 and I2, I2 and I3, and I3 and I4, respectively. (Fig. S4). The thresholds I1 and I4 are set as the mean value of the background intensity, whereas I2 and I3 are set as the mean value of high-photon intensity of a particular photon burst. Basically, I1 and I4 are set at the same value for a particular trajectory whereas I2 and I3 are set at the same value for a particular event.
Fig. S4.
Identifying the rising edge, ON state, and falling edge.
Acknowledgments
This work was supported by the NIH, National Institute of General Medical Sciences, and the Ohio Eminent Scholar Endowment.
Footnotes
The authors declare no conflict of interest.
This article is a PNAS Direct Submission.
This article contains supporting information online at www.pnas.org/lookup/suppl/doi:10.1073/pnas.1613404114/-/DCSupplemental.
References
- 1.Johnson KA. A century of enzyme kinetic analysis, 1913 to 2013. FEBS Lett. 2013;587(17):2753–2766. doi: 10.1016/j.febslet.2013.07.012. [DOI] [PMC free article] [PubMed] [Google Scholar]
- 2.English BP, et al. Ever-fluctuating single enzyme molecules: Michaelis-Menten equation revisited. Nat Chem Biol. 2006;2(2):87–94. doi: 10.1038/nchembio759. [DOI] [PubMed] [Google Scholar]
- 3.Segel IH. Enzyme Kinetics: Behavior and Analysis of Rapid Equilibrium and Steady State. Wiley; New York: 1993. [Google Scholar]
- 4.Benkovic SJ, Hammes GG, Hammes-Schiffer S. Free-energy landscape of enzyme catalysis. Biochemistry. 2008;47(11):3317–3321. doi: 10.1021/bi800049z. [DOI] [PubMed] [Google Scholar]
- 5.Edman L, Földes-Papp Z, Wennmalm S, Rigler R. The fluctuating enzyme: A single molecule approach. Chem Phys. 1999;247(1):11–22. [Google Scholar]
- 6.Henzler-Wildman KA, et al. Intrinsic motions along an enzymatic reaction trajectory. Nature. 2007;450(7171):838–844. doi: 10.1038/nature06410. [DOI] [PubMed] [Google Scholar]
- 7.Lu HP, Xun L, Xie XS. Single-molecule enzymatic dynamics. Science. 1998;282(5395):1877–1882. doi: 10.1126/science.282.5395.1877. [DOI] [PubMed] [Google Scholar]
- 8.Blank K, De Cremer G, Hofkens J. Fluorescence-based analysis of enzymes at the single-molecule level. Biotechnol J. 2009;4(4):465–479. doi: 10.1002/biot.200800262. [DOI] [PubMed] [Google Scholar]
- 9.Zheng D, Lu HP. Single-molecule enzymatic conformational dynamics: Spilling out the product molecules. J Phys Chem B. 2014;118(31):9128–9140. doi: 10.1021/jp5014434. [DOI] [PMC free article] [PubMed] [Google Scholar]
- 10.Dielmann-Gessner J, et al. Enzymatic turnover of macromolecules generates long-lasting protein-water-coupled motions beyond reaction steady state. Proc Natl Acad Sci USA. 2014;111(50):17857–17862. doi: 10.1073/pnas.1410144111. [DOI] [PMC free article] [PubMed] [Google Scholar]
- 11.Guha S, et al. Slow solvation dynamics at the active site of an enzyme: Implications for catalysis. Biochemistry. 2005;44(25):8940–8947. doi: 10.1021/bi0473915. [DOI] [PubMed] [Google Scholar]
- 12.Cao J. Michaelis-Menten equation and detailed balance in enzymatic networks. J Phys Chem B. 2011;115(18):5493–5498. doi: 10.1021/jp110924w. [DOI] [PubMed] [Google Scholar]
- 13.Wang Y, Gan L, Wang E, Wang J. Exploring the dynamic functional landscape of adenylate kinase modulated by substrates. J Chem Theory Comput. 2013;9(1):84–95. doi: 10.1021/ct300720s. [DOI] [PubMed] [Google Scholar]
- 14.Sierks MR, Sico C, Zaw M. Solvent and viscosity effects on the rate-limiting product release step of glucoamylase during maltose hydrolysis. Biotechnol Prog. 1997;13(5):601–608. doi: 10.1021/bp9700824. [DOI] [PubMed] [Google Scholar]
- 15.De Simone A, Aprile FA, Dhulesia A, Dobson CM, Vendruscolo M. Structure of a low-population intermediate state in the release of an enzyme product. eLife. 2015;4:1–13. doi: 10.7554/eLife.02777. [DOI] [PMC free article] [PubMed] [Google Scholar]
- 16.Oyen D, Fenwick RB, Stanfield RL, Dyson HJ, Wright PE. Cofactor-mediated conformational dynamics promote product release from Escherichia coli dihydrofolate reductase via an allosteric pathway. J Am Chem Soc. 2015;137(29):9459–9468. doi: 10.1021/jacs.5b05707. [DOI] [PMC free article] [PubMed] [Google Scholar]
- 17.Muddana HS, Sengupta S, Mallouk TE, Sen A, Butler PJ. Substrate catalysis enhances single-enzyme diffusion. J Am Chem Soc. 2010;132(7):2110–2111. doi: 10.1021/ja908773a. [DOI] [PMC free article] [PubMed] [Google Scholar]
- 18.Riedel C, et al. The heat released during catalytic turnover enhances the diffusion of an enzyme. Nature. 2015;517(7533):227–230. doi: 10.1038/nature14043. [DOI] [PMC free article] [PubMed] [Google Scholar]
- 19.Golestanian R. Enhanced diffusion of enzymes that catalyze exothermic reactions. Phys Rev Lett. 2015;115(10):108102. doi: 10.1103/PhysRevLett.115.108102. [DOI] [PubMed] [Google Scholar]
- 20.Guo Q, He Y, Lu HP. Interrogating the activities of conformational deformed enzyme by single-molecule fluorescence-magnetic tweezers microscopy. Proc Natl Acad Sci USA. 2015;112(45):13904–13909. doi: 10.1073/pnas.1506405112. [DOI] [PMC free article] [PubMed] [Google Scholar]
- 21.Lippitz M, Erker W, Decker H, van Holde KE, Basché T. Two-photon excitation microscopy of tryptophan-containing proteins. Proc Natl Acad Sci USA. 2002;99(5):2772–2777. doi: 10.1073/pnas.052662999. [DOI] [PMC free article] [PubMed] [Google Scholar]
- 22.Ehrl BN, Liebherr RB, Gorris HH. Single molecule kinetics of horseradish peroxidase exposed in large arrays of femtoliter-sized fused silica chambers. Analyst (Lond) 2013;138(15):4260–4265. doi: 10.1039/c3an00809f. [DOI] [PubMed] [Google Scholar]
- 23.Gorris HH, Walt DR. Mechanistic aspects of horseradish peroxidase elucidated through single-molecule studies. J Am Chem Soc. 2009;131(17):6277–6282. doi: 10.1021/ja9008858. [DOI] [PubMed] [Google Scholar]
- 24.Hassler K, et al. Dynamic disorder in horseradish peroxidase observed with total internal reflection fluorescence correlation spectroscopy. Opt Express. 2007;15(9):5366–5375. doi: 10.1364/oe.15.005366. [DOI] [PubMed] [Google Scholar]
- 25.Zheng D, Kaldaras L, Lu HP. Total internal reflection fluorescence microscopy imaging-guided confocal single-molecule fluorescence spectroscopy. Rev Sci Instrum. 2012;83(1):013110. doi: 10.1063/1.3677334. [DOI] [PMC free article] [PubMed] [Google Scholar]
- 26.Stirnemann G, Kang SG, Zhou R, Berne BJ. How force unfolding differs from chemical denaturation. Proc Natl Acad Sci USA. 2014;111(9):3413–3418. doi: 10.1073/pnas.1400752111. [DOI] [PMC free article] [PubMed] [Google Scholar]
- 27.Berglund GI, et al. The catalytic pathway of horseradish peroxidase at high resolution. Nature. 2002;417(6887):463–468. doi: 10.1038/417463a. [DOI] [PubMed] [Google Scholar]
- 28.Veitch NC. Horseradish peroxidase: A modern view of a classic enzyme. Phytochemistry. 2004;65(3):249–259. doi: 10.1016/j.phytochem.2003.10.022. [DOI] [PubMed] [Google Scholar]
- 29.Carlsson GH, Nicholls P, Svistunenko D, Berglund GI, Hajdu J. Complexes of horseradish peroxidase with formate, acetate, and carbon monoxide. Biochemistry. 2005;44(2):635–642. doi: 10.1021/bi0483211. [DOI] [PubMed] [Google Scholar]
- 30.Henriksen A, et al. Structural interactions between horseradish peroxidase C and the substrate benzhydroxamic acid determined by X-ray crystallography. Biochemistry. 1998;37(22):8054–8060. doi: 10.1021/bi980234j. [DOI] [PubMed] [Google Scholar]
- 31.He Y, Lu M, Lu HP. Single-molecule photon stamping FRET spectroscopy study of enzymatic conformational dynamics. Phys Chem Chem Phys. 2013;15(3):770–775. doi: 10.1039/c2cp42944f. [DOI] [PMC free article] [PubMed] [Google Scholar]
- 32.Lu M, Lu HP. Probing protein multidimensional conformational fluctuations by single-molecule multiparameter photon stamping spectroscopy. J Phys Chem B. 2014;118(41):11943–11955. doi: 10.1021/jp5081498. [DOI] [PMC free article] [PubMed] [Google Scholar]
- 33.Rothwell PJ, et al. Multiparameter single-molecule fluorescence spectroscopy reveals heterogeneity of HIV-1 reverse transcriptase:primer/template complexes. Proc Natl Acad Sci USA. 2003;100(4):1655–1660. doi: 10.1073/pnas.0434003100. [DOI] [PMC free article] [PubMed] [Google Scholar]
- 34.Batista MRB, Martínez L. Dynamics of nuclear receptor Helix-12 switch of transcription activation by modeling time-resolved fluorescence anisotropy decays. Biophys J. 2013;105(7):1670–1680. doi: 10.1016/j.bpj.2013.07.032. [DOI] [PMC free article] [PubMed] [Google Scholar]
- 35.Gustavsson T, et al. Rotational diffusion of the 7-diethylamino-4-methylcoumarin C1 dye molecule in polar protic and aprotic solvents. Photochem Photobiol Sci. 2003;2(3):329–341. doi: 10.1039/b211755j. [DOI] [PubMed] [Google Scholar]
- 36.Horng ML, Gardecki JA, Maroncelli M. Rotational dynamics of coumarin 153: Time-dependent friction, dielectric friction, and other nonhydrodynamic effects. J Phys Chem A. 1997;101(6):1030–1047. [Google Scholar]
- 37.Zhao B, Summers FA, Mason RP. Photooxidation of Amplex Red to resorufin: Implications of exposing the Amplex Red assay to light. Free Radic Biol Med. 2012;53(5):1080–1087. doi: 10.1016/j.freeradbiomed.2012.06.034. [DOI] [PMC free article] [PubMed] [Google Scholar]
- 38.Edman L, Rigler R. Memory landscapes of single-enzyme molecules. Proc Natl Acad Sci USA. 2000;97(15):8266–8271. doi: 10.1073/pnas.130589397. [DOI] [PMC free article] [PubMed] [Google Scholar]
- 39.Northrup SH, Erickson HP. Kinetics of protein-protein association explained by Brownian dynamics computer simulation. Proc Natl Acad Sci USA. 1992;89(8):3338–3342. doi: 10.1073/pnas.89.8.3338. [DOI] [PMC free article] [PubMed] [Google Scholar]
- 40.Nie S, Chiu DT, Zare RN. Probing individual molecules with confocal fluorescence microscopy. Science. 1994;266(5187):1018–1021. doi: 10.1126/science.7973650. [DOI] [PubMed] [Google Scholar]
- 41.Widengren J, et al. Single-molecule detection and identification of multiple species by multiparameter fluorescence detection. Anal Chem. 2006;78(6):2039–2050. doi: 10.1021/ac0522759. [DOI] [PubMed] [Google Scholar]
- 42.Kurnikova MG, Balabai N, Waldeck DH, Coalson RD. Rotational relaxation in polar solvents. Molecular dynamics study of solute-solvent interaction. J Am Chem Soc. 1998;120(24):6121–6130. [Google Scholar]
- 43.Grossman M, et al. Correlated structural kinetics and retarded solvent dynamics at the metalloprotease active site. Nature. 2013;18(9):1199–1216. doi: 10.1038/nsmb.2120. [DOI] [PMC free article] [PubMed] [Google Scholar]
- 44.Guo Q, He Y, Lu HP. Manipulating and probing enzymatic conformational fluctuations and enzyme-substrate interactions by single-molecule FRET-magnetic tweezers microscopy. Phys Chem Chem Phys. 2014;16(26):13052–13058. doi: 10.1039/c4cp01454e. [DOI] [PubMed] [Google Scholar]
- 45.Pauling L. Molecular architecture and biological reactions. Chem Eng News. 1946;10:1375–1376. [Google Scholar]


