

Abstract
Summary
Measurement of marrow fat (MF) is important to the study of bone fragility. We measured MF on iliac biopsies and by spine/hip magnetic resonance spectroscopy in the same subjects. Noninvasively assessed spine MF a nd histomorphometrically assessed MF correlated well. MF quantity and relationships with bone volume differed by measurement site.
Introduction
Excess marrow fat has been implicated in the pathogenesis of osteoporosis in several populations. In the bone marrow, adipocytes and osteoblasts share a common precursor and are reciprocally regulated. In addition, adipocytes may secrete toxic fatty acids and adipokines that adversely affect osteoblasts. Measurement of marrow fat is important to the study of mechanisms of bone fragility. Marrow fat can be quantified on bone biopsy samples by histomorphometry and noninvasively by proton magnetic resonance spectroscopy (1H-MRS). In this study, we evaluate relationships between marrow fat assessed using both methods in the same subjects for the first time.
Methods
Sixteen premenopausal women, nine with idiopathic osteoporosis and seven normal controls, had marrow fat measured at the iliac crest by bone biopsy and at the lumbar spine (L3) and proximal femur by 1H-MRS.
Results
At L3, fat fraction by 1H-MRS correlated directly and significantly with marrow fat variables on iliac crest biopsies (r=0.5–0.8). In contrast, there were no significant correlations between fat fraction at the femur and marrow fat on biopsies. Marrow fat quantity (%) was greater at the femur than at L3 and the iliac crest and correlated inversely with total hip and femoral neck BMD by DXA.
Conclusions
In summary, measurement of marrow fat in transiliac crest biopsies correlates with marrow fat at the spine but not the proximal femur by 1H-MRS. There were site-specific differences in marrow fat quantity and in the relationships between marrow fat and bone volume.
Keywords: 1H-MRS, Bone biopsy, Histomorphometry, Marrow fat
Introduction
Fat and bone interact at both the systemic and the local cellular level. Recent studies show that obesity, particularly abdominal obesity, is associated with lower bone mass [1–7] and increased fracture risk [8–12]. Several factors have been implicated as mediators of complex relationships between fat and bone, including sclerostin, insulin-like growth factor 1, adipokines, inflammatory cytokines, and lipids [1, 3, 7, 13].
Fat and bone interactions may be particularly important at the local, bone marrow level. In the bone marrow, osteoblasts and adipocytes derive from a common mesenchymal precursor cell [14]. Recent work suggests that control of differentiation of this precursor cell into either an adipocyte or an osteoblast is an important determinant of bone structural integrity [15–24]. A reciprocal relationship between marrow adipocytes and osteoblasts has been observed in osteoporosis related to aging, menopause, anorexia nervosa, glucocorticoids, and thiazolidinediones [15–22]. Marrow fat may also suppress osteoblast proliferation and function through paracrine mechanisms involving local secretion of adipokines and fatty acids [25]. Some human imaging studies suggest that alterations in marrow fat may contribute to bone fragility and fracture risk independent of BMD [23, 24, 26]. Moreover, animal studies suggest that bone marrow adipocytes and osteoblasts are regulated independently [27–29].
Marrow adipocytes can be quantified directly on transiliac crest bone biopsy samples [21, 30], yielding measurements of adipocyte number, size, density, and percent of marrow volume. We have previously reported results from such analyses in 104 premenopausal women (64 with idiopathic osteoporosis (IOP), 40 controls). Those with IOP had significantly and substantially higher adipocyte number (by 22 %), size (by 24 %), and volume (by 26 %) than controls (p<0.0001 for all), even after adjusting for age, BMI, and trabecular bone volume fraction by micro-CT [30].
Additionally, marrow fat can be measured noninvasively at the spine and hip using proton magnetic resonance spectroscopy (1H-MRS), expressed as fat fraction (%) within a region of interest in the marrow space [2, 22, 31, 32]. Eleven of the 104 previously studied subjects [30] and 5 newly recruited subjects had 1H-MRS in addition to transiliac biopsy. To our knowledge, this is the first study to examine relationships between marrow fat assessed by 1H-MRS and marrow adipocytes measured on transiliac bone biopsy samples in the same subjects. We hypothesized that there would be strong, direct correlations between marrow fat measured by these different techniques at different anatomical sites.
Methods
Patient population
We studied 16 premenopausal women, aged 18–45 years, either enrolled in a larger cross-sectional, case-control transiliac bone biopsy study of 64 women with idiopathic osteoporosis (IOP) and 40 healthy controls or undergoing biopsy prior to teriparatide treatment for a study of teriparatide in IOP. Participation in the MRS substudy was offered to all 32 subjects who enrolled in the studies after the technique became available in 2009. Subjects were recruited at Columbia University Medical Center, New York, NY, and Creighton University, Omaha, NE. Inclusion and exclusion criteria for the IOP studies were previously reported [30, 33]. We defined premenopausal status as regular menses off hormonal contraception and early follicular phase follicle-stimulating hormone (FSH) levels <20 mIU/mL. In subjects and controls, secondary causes of osteoporosis were excluded by detailed history, physical, and biochemical evaluation: estrogen deficiency, eating disorders associated with amenorrhea, endocrinopathies, celiac or other gastrointestinal diseases, abnormal mineral metabolism, marked hypercalciuria (>300 mg/gCr), and drug exposures. No subject was receiving medications to treat osteoporosis (e.g., teriparatide, bisphosphonates, denosumab). Bone biopsy and 1H-MRS scanning were performed within 3 months of each other.
All subjects provided written informed consent. The institutional review boards of both institutions approved these studies.
Areal BMD and body composition by DXA
Areal BMD at the lumbar spine, total hip, femoral neck and distal radius, and whole body (excluding head) and trunk fat were measured by DXA (Discovery, Hologic Inc., Walton, MA) at Columbia and Creighton University Medical Centers as previously described [34].
Transiliac bone biopsy
After double labeling with tetracycline, transiliac biopsy was performed using a Bordier-type trephine with an inner diameter of 7.5 mm [35]. The intact biopsy specimens were fixed and dehydrated in ethanol. Biopsy specimens were embedded in polymethylmethacrylate for quantitative histomorphometry, sectioned (7 μm), and stained (Goldner trichrome) according to established procedures [36]. Histomorphometry was performed with a digitizing image-analysis system (OsteoMeasure, Version 4.00C, OsteoMetrics, Inc, Atlanta, GA). All structural and remodeling variables were calculated according to American Society for Bone and Mineral Research recommendations [37].
Biopsy-based adipocyte analyses
In biopsy specimens with an intact marrow/cancellous bone compartment and two cortices, adipocyte parameters were assessed in a blinded manner according to the method of Syed et al.[21] and as we have previously published [30] on sections stained with Goldner’s trichrome. We analyzed a uniform number of fields in all sections. Each biopsy was oriented with the thinner of the two cortices at the top of the microscopic field. Starting at the farthest left-hand margin of the endocortical surface of the uppermost cortex, the observer moved three fields to the right and three fields down. This randomly selected field was the first of four fields (two consecutive fields on top followed by the two consecutive fields immediately below) that were analyzed with a ×20 objective using the OsteoMeasure analysis system (OsteoMetrics Inc., Decatur, IL). Fields with a significant artefact (e.g., a fold in the section) were excluded and the immediately adjacent field analyzed. The total tissue area of the four measurement fields at the magnification used (×200) was 1.09 mm2. The mean value of the marrow/cancellous compartment area within each section in these samples was 29.27 mm2. The number, perimeter, and area of adipocytes and the field area in those sampled fields were measured and expressed as total adipocyte area (Ad.Ar, mm2), total adipocyte perimeter (measured by tracing each individual adipocyte in all of the fields analyzed and summing the individual values; Ad.Pm, mm), adipocyte number per square millimeter in the analyzed fields including marrow tissue area and bone area (Ad.N, 1/mm2), percent adipocyte volume per marrow volume (Ad.V/Ma.V, %), and adipocyte density (adipocyte number per square mm of marrow tissue area in the analyzed fields; Ad.D, n/mm2).
To assess representativeness of adipocyte parameters, we compared two different areas of the biopsy sample (top, as previously described, and center) in ten subjects. Correlation coefficients between adipocyte parameters between the two regions ranged from 0.65 to 0.90 (p=0.0003–0.04) [30], and intraclass correlation coefficients ranged from 0.59 to 0.85 (results not shown).
1H-MRS
1H-MRS acquisition
All MR images were acquired on a research-dedicated 1.5-T whole-body Signa “LX” MR system (General Electric, Milwaukee, WI) at Columbia University.
L3-vertebral 1H-MRS
A spine array coil was used to acquire 1H-MRS with the fifth coil (L5 coil) centered at L3 [32]. L3 was chosen because optimal coil positioning is facilitated by surface landmarks (iliac crests). After scout images in the transverse, coronal, and sagittal planes were acquired, T1-weighted transverse images (repetition time ms/echo time ms, 450/1; section thickness, 4 mm with 0.4-mm gap; field of view, 325 mm; matrix, 256 by 256; number of signals acquired, 2) were acquired to guide positioning of a volume of interest (VOI) within L3. VOI size is prescribed as one half of the height, width, and length of the L3 vertebra and ranges from 1.9 to 5.1 cm3 (voxel dimensions 10.8–20.1 mm (height)×11.4–21.2 mm (width)×12.2–18 mm (length)). After local shimming, data were acquired at a spectral bandwidth of 1000 Hz, and 64 non-water-suppressed signals were obtained by using a point resolved spectroscopic sequence (PRESS) (3000/25) [P. A. Bottomley, US Patent 4480 228 (1984)] [23, 24, 32, 38–41].
Femoral 1H-MRS
A body matrix-phased array coil was positioned over the pelvis region centered on the left great trochanter. A voxel measuring 12 × 12 × 12 mm (1.7 mL) was positioned within the proxi mal femoral metaphysis at the intertrochanteric region. A coronal image scout view was used to place the MRS voxel according to specific reproducible anatomical landmarks. In each subject, the center of the voxel was aligned linearly with the lower edge of the greater trochanter. This required voxel size was too large to allow assessment at the femoral neck site. Single voxel 1H-MRS using the same non-water-suppressed PRESS pulse sequence was performed [22].
Spectra acquired from L3 and the femur were exported and analyzed using a time-domain fitting routine known as Advanced Method for Accurate, Robust, and Efficient Spectral fitting (AMARES) of 1H-MRS data with use of prior knowledge in the jMRUI software [32, 41]. Manually selected resonance frequency and line width of water (4.65 ppm) and fat 1.3 ppm) peaks were used as starting values in the nonlinear least square fitting algorithm. Vertebral body fat fraction, defined as the relative fat signal intensity amplitude in terms of a percentage of total signal intensity amplitude (Swater and Sfat), was calculated according to the following equation [23]: Fat fraction=[Sfat /(Sfat +Swater)].
Statistical methods
Statistical analyses were performed using SAS software (SAS Institute, Cary NC, USA). Correlation analyses were used to describe relationships between variables in this population. Because all marrow fat variables were normally distributed (Kolmogorov-Smirnov test), Pearson correlations were used. Multivariate linear regression analyses were used to control for covariates. All data are expressed as mean ± standard deviation (SD). Results were considered significant with p < 0.05.
Results
Marrow fat measurements on both biopsy samples and by 1H-MRS were available in 16 subjects, 9 with IOP and 7 controls. Baseline characteristics are shown in Table 1. Subjects and controls differed only in terms of BMD by DXA.
Table 1.
Subject characteristics (mean±SD)
| All subjects n=16 | IOP n=9 | Controls n=7 | % difference IOP vs controls |
p: IOP vs controls |
|
|---|---|---|---|---|---|
| Age (years) | 35.9±7 | 34.8±6.6 | 37.2±7.9 | 0.5 | |
| BMI (kg/m2) | 23.1 ±3.1 | 22.4±3.6 | 24.0±2.4 | 0.3 | |
| Body fat by DXA (%) | |||||
| Whole body fat | 32.7±8.8 | 31.9±9.7 | 33.7±8.2 | 0.7 | |
| Trunk fat | 28.7±9.6 | 27.9±10.5 | 29.8±9.1 | 0.7 | |
| BMD Z-score | |||||
| Lumbar spine | −0.86±1.62 | −2.04±0.74 | 0.66±1.05 | <0.0001 | |
| Total hip | −0.48±1.21 | −1.24±1.01 | 0.49±0.58 | 0.013 | |
| Femoral neck | −0.84±1.22 | −1.61±0.96 | 0.14±0.69 | 0.001 | |
| Distal radius | 033±0.99 | −0.00±0.96 | 0.76±0.93 | 0.1 | |
| Histomorphometry | |||||
| Trabecular BV/TV (%) | 20.30±4.34 | 19.06±3.23 | 21.90±5.28 | 0.2 | |
| Cancellous BFR (mm2/mm/year) | 0.013±0.009 | 0.012±0.009 | 0.014±0.010 | 0.7 | |
| 1H-MRS fat fraction | |||||
| Spine (L3; %) | 35.0±9.2 | 36.4±10.3 | 33.2±8.0 | 10 % higher | 0.5 |
| Femur (%) | 66.3±13.2 | 71.0±14.8 | 60.2±8.3 | 18 % higher | 0.1 |
| Adipocyte measures on biopsies | |||||
| Ad.V/Ma.V (%) | 27.2±7.8 | 30.7±6.8 | 22.5±6.8 | 36 % higher | 0.03 |
| Ad.Ar (mm2) | 0.24±0.08 | 0.28±0.07 | 0.20±0.07 | 40 % higher | 0.02 |
| Ad.Pm (mm) | 25.3±8.3 | 28.3±8.8 | 21.5±6.0 | 32 % higher | 0.1 |
| Ad.N (n/mm2 tissue) | 187±58 | 211 ±61 | 156±37 | 35 % higher | 0.06 |
| Ad.D.(n/mm2 marrow) | 209±56 | 230±60 | 182±38 | 26 % higher | 0.09 |
BV/TV bone volume/total volume, BFR bone formation rate/bone surface, Ad.Ar Adipocyte area, Ad.Pm total adipocyte perimeter, Ad.N adipocyte number per square millimeter tissue area, Ad.V/Ma.V percent adipocyte volume per marrow volume, Ad.D adipocyte density (adipocyte number per square mm marrow tissue area)
Measures of marrow fat at the three anatomical locations (spine and femur by 1H-MRS (Fig. 1), iliac crest on biopsy sample) show evidence of site-specific differences in the fraction (%) occupied by fat (Fig. 2). Consistent with our earlier publication in a larger cohort, certain adipocyte parameters from transiliac biopsies (Ad.V/Ma.V and Ad.Ar) were significantly higher in women with IOP. Others (Ad.N, Ad.D, and Ad.Pm) and femoral marrow fat measures by 1H-MRS tended to be higher in women with IOP than controls (Table 1).
Fig. 1.
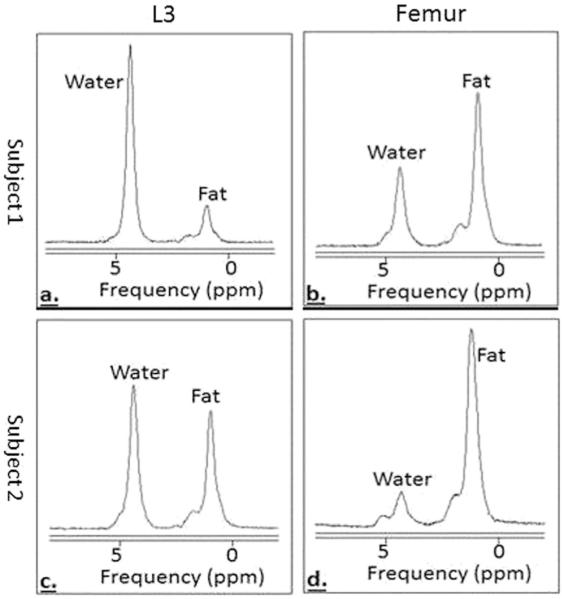
MRS spectra of bone marrow fat. Subject 1 (a L3, b femur) has less bone marrow fat than subject 2 (c L3, d femur)
Fig. 2.
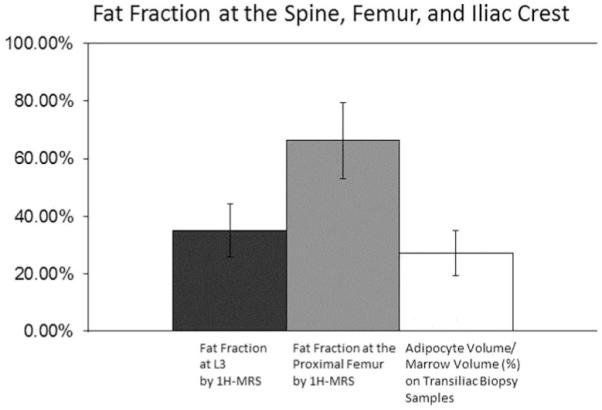
Fat fraction at the spine, femur, and iliac crest
Correlations between marrow fat by 1H-MRS and marrow fat assessed on biopsies
Fat fraction measured at L3 correlated positively and significantly with all marrow fat variables assessed on biopsies. In contrast, there were no correlations between fat fraction at the femur and marrow fat on biopsies (Fig. 3, Table 2). When IOP subjects and controls were examined separately, this finding was accentuated in the IOP subjects (Ad.V/Ma.V vs L3: r=0.77, p = 0.02; vs femur: r = −0.09, p = 0.8), whereas no significant relationships were found in the controls (Ad.V/Ma.V vs L3: r=0.25, p=0.6; vs femur: r=−0.52, p=0.2). Adjustment for age, BMI, and bone volume fraction did not attenuate the relationship between biopsy measures and L3 fat fraction (for Ad.V/Ma.V vs L3: R=0.67; p=0.01), and had no effect on the relationship with femur fat fraction.
Fig. 3.

Relationships between marrow fat fraction by MRS and marrow fat measures on transiliac bone biopsy. a. Adipocyte volume/marrow volume, b adipocyte perimeter, c adipocyte density. Pearson correlations (R, p) are shown
Table 2.
Correlations between marrow fat variables assessed at different sites
| Pearson correlation: R, p | L3 fat fraction by 1H-MRS |
Femur fat fraction by 1H-MRS |
|---|---|---|
| Adipocyte volume/marrow volume | 0.57, 0.02 | 0.07, 0.8 |
| Adipocyte area | 0.53, 0.04 | 0.09, 0.7 |
| Adipocyte perimeter | 0.56, 0.02 | −0.01, 0.9 |
| Adipocyte number | 0.57, 0.02 | −0.05, 0.9 |
| Adipocyte density | 0.63, 0.009 | −0.09, 0.7 |
Correlations between marrow fat, bone volume, and body fat
BMD by DXA correlated inversely or tended to correlate inversely with marrow fat measures at all three sites (Table 3). The strongest relationships were seen between femoral marrow fat and femoral BMD by DXA. Although some trends were seen for BMI, marrow fat did not correlate with DXA body fat measures.
Table 3.
Correlations between marrow fat and body fat, bone volume, and bone remodeling
| Pearson correlation: R, p | L3 fat fraction by 1H-MRS |
Femur fat fraction by 1H-MRS |
Ad.V/Ma.Vat the iliac crest |
|---|---|---|---|
| BMI | − 0.44, 0.09 | − 0.48, 0.06 | −0.13, 0.6 |
| Body fat by DXA (%) | |||
| Whole body fat | −0.30, 0.3 | −0.28, 0.3 | 0.19, 0.5 |
| Trunk fat | −0.29, 0.3 | −0.23, 0.4 | 0.17, 0.5 |
| BMD (g/cm2) | |||
| Lumbar spine | −0.12, 0.7 | − 0.43, 0.09 | − 0.42, 0.1 |
| Total hip | −0.29, 0.3 | − 0.68, 0.004 | − 0.39, 0.1 |
| Femoral neck | − 0.42, 0.1 | − 0.65, 0.006 | − 0.49, 0.06 |
| Distal radius | −0.28, 0.3 | −0.14, 0.6 | − 0.54, 0.03 |
| Biopsy samples | |||
| Bone volume/total volume | 0.32, 0.2 | −0.20, 0.4 | −0.20, 0.5 |
| Bone formation rate | 0.24, 0.4 | −0.09, 0.7 | −0.20, 0.5 |
Discussion
To our knowledge, this is the first study to evaluate relationships between marrow fat measured noninvasively by 1H-MRS at L3 and the proximal femur and marrow fat assessed by quantitative histomorphometry on bone biopsy samples in the same subjects. We found positive and significant correlations between marrow fat fraction at L3 by 1H-MRS and all marrow fat variables assessed on iliac crest biopsies. In contrast, we found no correlations between marrow fat fraction at the proximal femur and marrow fat on biopsies. In addition, we observed that the fraction (%) of marrow fat relative to total 1H-MRS signal or tissue volume was markedly higher at the femur than the other two sites and that only marrow fat at the femur was inversely correlated with BMD by DXA.
We previously reported that, at the iliac crest, premenopausal women with IOP have significantly and substantially higher adipocyte number (by 22 %), size (by 24 %), and volume (by 26 %) than controls (p<0.0001 for all), even after adjusting for age, BMI, and trabecular bone volume fraction by micro-CT [30]. In this study, which includes 11 of the 104 previously reported and 5 additional subjects, we also found that marrow adipocyte parameters were higher (by 26 to 40 %) in women with IOP than controls. However, some differences, although larger than detected in our previous study, did not reach statistical significance, likely because of the smaller sample size. We also found that marrow fat by 1H-MRS tended to be higher in women with IOP than controls, but more so at the proximal femur than at L3. Although the small sample size may explain the lack of significant differences seen by 1H-MRS, it is also possible that IOP may have site-specific effects on marrow adiposity.
As hypothesized, we found that marrow fat fraction on biopsy samples correlated positively and significantly with marrow fat fraction by 1 H-MRS at the L3 vertebra, particularly in the IOP subjects (r=0.77, p=0.02). However, contrary to our hypothesis, no relationships were detected between adipocyte parameters measured on biopsies and marrow fat fraction assessed by 1H-MRS at the femur. Further investigations will be required to determine whether the mechanisms governing the marrow fat compartment may be site specific. One possible explanation for this centers on the site-specific differences in marrow composition. Both L3 and the iliac crest are rich in cancellous bone and filled with red, more hematopoietically active, marrow; in contrast, the intertrochanteric region is adjacent to the long-bone cavity that contains more yellow marrow [42]. Additional studies will be required to determine whether the yellow marrow fat fraction and red marrow fat fraction are regulated differently. Our previous study also showed that total body marrow fat (predominantly yellow marrow fat) showed weaker correlation with BMD than the red marrow-rich pelvic region [31].
Several studies have documented inverse relationships between bone mass and marrow fat [22, 31, 38]. We previously reported that trabecular bone volume fraction by micro-CT on biopsies was inversely related to marrow fat measured on iliac crest biopsies in 39 healthy premenopausal women but not in 64 IOP subjects [30]. The inverse relationship between BMD by DXA and marrow fat that we observed in this considerably smaller study is consistent with prior reports [43–45] but we did not detect any significant relationships between bone volume fraction and marrow fat parameters, either in the group as a whole or in the subgroups. The small sample size may have limited our ability to detect the relationships.
Prior studies have shown that both obesity [2] and undernutrition/anorexia nervosa [22] are associated with higher marrow adiposity in premenopausal women. In this small but diverse sample, we did not detect significant relationships between body fat and marrow fat at any site.
This study has several limitations. Although the inclusion of both subjects affected and unaffected by osteoporosis permitted us to include a broad range of bone volumes, the sample size was likely too small to detect between group differences in the relationships between marrow fat and bone volume. Bone volume results presented here are based upon histomorphometry, not micro-CT, assessments. Only premenopausal women were studied, thus limiting generalizability to other populations such as children, postmenopausal women, and men.
In conclusion, we compared marrow fat assessments at three different sites in the same subjects, using both invasive biopsy and noninvasive 1H-MRS techniques. Fat fraction measured at L3 correlated positively and significantly with all marrow fat variables assessed on transiliac biopsies, while no such correlations were seen with fat fraction at the femur. Additionally, we found site-specific differences in marrow fat quantity, and in the relationships between marrow fat and bone volume. Further investigation will be required to determine whether the regulation of marrow fat may be site specific.
Footnotes
Conflicts of interest Adi Cohen, Wei Shen, David W. Dempster, Hua Zhou, Robert R. Recker, Joan M. Lappe, Anna L. Kepley, Mafo Y. Kamanda-Kosseh, Mariana Bucovsky, Emily M. Stein, Thomas L. Nickolas, and Elizabeth Shane declare that they have no conflict of interest.
References
- 1.Bredella MA, Torriani M, Ghomi RH, Thomas BJ, Brick DJ, Gerweck AV, Harrington LM, Breggia A, Rosen CJ, Miller KK. Determinants of bone mineral density in obese premenopausal women. Bone. 2011;48:748–754. doi: 10.1016/j.bone.2010.12.011. [DOI] [PMC free article] [PubMed] [Google Scholar]
- 2.Bredella MA, Torriani M, Ghomi RH, Thomas BJ, Brick DJ, Gerweck AV, Rosen CJ, Klibanski A, Miller KK. Vertebral bone marrow fat is positively associated with visceral fat inversely associated with IGF-1 in obese women. Obesity (Silver Spring) 2011;19:49–53. doi: 10.1038/oby.2010.106. [DOI] [PMC free article] [PubMed] [Google Scholar]
- 3.Gilsanz V, Chalfant J, Mo AO, Lee DC, Dorey FJ, Mittelman SD. Reciprocal relations of subcutaneous and visceral fat to bone structure and strength. J Clin Endocrinol Metab. 2009;94:3387–3393. doi: 10.1210/jc.2008-2422. [DOI] [PMC free article] [PubMed] [Google Scholar]
- 4.Pollock NK, Laing EM, Hamrick MW, Baile CA, Hall DB, Lewis RD. Bone and fat relationships in postadolescent black females: a pQCT study. Osteoporos Int. 2011;22:655–665. doi: 10.1007/s00198-010-1266-6. [DOI] [PubMed] [Google Scholar]
- 5.Janicka A, Wren TA, Sanchez MM, Dorey F, Kim PS, Mittelman SD, Gilsanz V. Fat mass is not beneficial to bone in adolescents and young adults. J Clin Endocrinol Metab. 2007;92:143–147. doi: 10.1210/jc.2006-0794. [DOI] [PubMed] [Google Scholar]
- 6.Zhao LJ, Liu YJ, Liu PY, Hamilton J, Recker RR, Deng HW. Relationship of obesity with osteoporosis. J Clin Endocrinol Metab. 2007;92:1640–1646. doi: 10.1210/jc.2006-0572. [DOI] [PMC free article] [PubMed] [Google Scholar]
- 7.Sheu Y, Cauley JA. The role of bone marrow and visceral fat on bone metabolism. Curr Osteoporos Rep. 2011;9:67–75. doi: 10.1007/s11914-011-0051-6. [DOI] [PMC free article] [PubMed] [Google Scholar]
- 8.Nielson CM, Marshall LM, Adams AL, LeBlanc ES, Cawthon PM, Ensrud K, Stefanick ML, Barrett-Connor E, Orwoll ES. BMI and fracture risk in older men: the osteoporotic fractures in men study (MrOS) J Bone Miner Res. 2011;26:496–502. doi: 10.1002/jbmr.235. [DOI] [PMC free article] [PubMed] [Google Scholar]
- 9.Hsu YH, Venners SA, Terwedow HA, Feng Y, Niu T, Li Z, Laird N, Brain JD, Cummings SR, Bouxsein ML, et al. Relation of body composition, fat mass, and serum lipids to osteoporotic fractures and bone mineral density in Chinese men and women. Am J Clin Nutr. 2006;83:146–154. doi: 10.1093/ajcn/83.1.146. [DOI] [PubMed] [Google Scholar]
- 10.Compston JE, Watts NB, Chapurlat R, Cooper C, Boonen S, Greenspan S, Pfeilschifter J, Silverman S, Diez-Perez A, Lindsay R, et al. Obesity is not protective against fracture in postmenopausal women: GLOW. Am J Med. 2011;124:1043–1050. doi: 10.1016/j.amjmed.2011.06.013. [DOI] [PMC free article] [PubMed] [Google Scholar]
- 11.Laslett LL, Just Nee Foley SJ, Quinn SJ, Winzenberg TM, Jones G. Excess body fat is associated with higher risk of vertebral deformities in older women but not in men: a cross-sectional study. Osteoporos Int. 2012;23:67–74. doi: 10.1007/s00198-011-1741-8. [DOI] [PubMed] [Google Scholar]
- 12.Goulding A, Grant AM, Williams SM. Bone and body composition of children and adolescents with repeated forearm fractures. J Bone Miner Res. 2005;20:2090–2096. doi: 10.1359/JBMR.050820. [DOI] [PubMed] [Google Scholar]
- 13.Cohen A, Dempster D, Recker R, Lappe J, Zhou H, Wirth AJ, Van Lenthe GH, Zwahlen A, Muller R, Zhao B, et al. Abdominal fat is associated with lower bone formation and lower trabecular bone volume in healthy premenopausal women: a transiliac bone biopsy study. J Clin Endocrinol Metab. 2013;98:2562–2572. doi: 10.1210/jc.2013-1047. [DOI] [PMC free article] [PubMed] [Google Scholar]
- 14.Rosen CJ, Bouxsein ML. Mechanisms of disease: is osteoporosis the obesity of bone? Nat Clin Pract Rheumatol. 2006;2:35–43. doi: 10.1038/ncprheum0070. [DOI] [PubMed] [Google Scholar]
- 15.Lecka-Czernik B, Moerman EJ, Grant DF, Lehmann JM, Manolagas SC, Jilka RL. Divergent effects of selective peroxisome proliferator-activated receptor-gamma 2 ligands on adipocyte versus osteoblast differentiation. Endocrinology. 2002;143:2376–2384. doi: 10.1210/endo.143.6.8834. [DOI] [PubMed] [Google Scholar]
- 16.Grey A. Thiazolidinedione-induced skeletal fragility—mechanisms and implications. Diabetes Obes Metab. 2009;11:275–284. doi: 10.1111/j.1463-1326.2008.00931.x. [DOI] [PubMed] [Google Scholar]
- 17.Canalis E, Mazziotti G, Giustina A, Bilezikian JP. Glucocorticoid-induced osteoporosis: pathophysiology and therapy. Osteoporos Int. 2007;18:1319–1328. doi: 10.1007/s00198-007-0394-0. [DOI] [PubMed] [Google Scholar]
- 18.Meunier P, Aaron J, Edouard C, Vignon G. Osteoporosis and the replacement of cell populations of the marrow by adipose tissue. A quantitative study of 84 iliac bone biopsies. Clin Orthop Relat Res. 1971;80:147–154. doi: 10.1097/00003086-197110000-00021. [DOI] [PubMed] [Google Scholar]
- 19.Justesen J, Stenderup K, Ebbesen EN, Mosekilde L, Steiniche T, Kassem M. Adipocyte tissue volume in bone marrow is increased with aging and in patients with osteoporosis. Biogerontology. 2001;2:165–171. doi: 10.1023/a:1011513223894. [DOI] [PubMed] [Google Scholar]
- 20.Verma S, Rajaratnam JH, Denton J, Hoyland JA, Byers RJ. Adipocytic proportion of bone marrow is inversely related to bone formation in osteoporosis. J Clin Pathol. 2002;55:693–698. doi: 10.1136/jcp.55.9.693. [DOI] [PMC free article] [PubMed] [Google Scholar]
- 21.Syed FA, Oursler MJ, Hefferanm TE, Peterson JM, Riggs BL, Khosla S. Effects of estrogen therapy on bone marrow adipocytes in postmenopausal osteoporotic women. Osteoporos Int. 2008;19:1323–1330. doi: 10.1007/s00198-008-0574-6. [DOI] [PMC free article] [PubMed] [Google Scholar]
- 22.Bredella MA, Fazeli PK, Miller KK, Misra M, Torriani M, Thomas BJ, Ghomi RH, Rosen CJ, Klibanski A. Increased bone marrow fat in anorexia nervosa. J Clin Endocrinol Metab. 2009;94:2129–2136. doi: 10.1210/jc.2008-2532. [DOI] [PMC free article] [PubMed] [Google Scholar]
- 23.Schellinger D, Lin CS, Hatipoglu HG, Fertikh D. Potential value of vertebral proton MR spectroscopy in determining bone weakness. AJNR Am J Neuroradiol. 2001;22:1620–1627. [PMC free article] [PubMed] [Google Scholar]
- 24.Schellinger D, Lin CS, Lim J, Hatipoglu HG, Pezzullo JC, Singer AJ. Bone marrow fat and bone mineral density on proton MR spectroscopy and dual-energy X-ray absorptiometry: their ratio as a new indicator of bone weakening. AJR Am J Roentgenol. 2004;183:1761–1765. doi: 10.2214/ajr.183.6.01831761. [DOI] [PubMed] [Google Scholar]
- 25.Bermeo S, Gunaratnam K, Duque G. Fat and bone interactions. Curr Osteoporos Rep. 2014;12:235–242. doi: 10.1007/s11914-014-0199-y. [DOI] [PubMed] [Google Scholar]
- 26.Patsch JM, Li X, Baum T, Yap SP, Karampinos DC, Schwartz AV, Link TM. Bone marrow fat composition as a novel imaging biomarker in postmenopausal women with prevalent fragility fractures. J Bone Miner Res. 2013;28:1721–1728. doi: 10.1002/jbmr.1950. [DOI] [PMC free article] [PubMed] [Google Scholar]
- 27.Justesen J, Mosekilde L, Holmes M, Stenderup K, Gasser J, Mullins JJ, Seckl JR, Kassem M. Mice deficient in 11beta-hydroxysteroid dehydrogenase type 1 lack bone marrow adipocytes, but maintain normal bone formation. Endocrinology. 2004;145:1916–1925. doi: 10.1210/en.2003-1427. [DOI] [PubMed] [Google Scholar]
- 28.Martin RB, Zissimos SL. Relationships between marrow fat and bone turnover in ovariectomized and intact rats. Bone. 1991;12:123–131. doi: 10.1016/8756-3282(91)90011-7. [DOI] [PubMed] [Google Scholar]
- 29.Tornvig L, Mosekilde LI, Justesen J, Falk E, Kassem M. Troglitazone treatment increases bone marrow adipose tissue volume but does not affect trabecular bone volume in mice. Calcif Tissue Int. 2001;69:46–50. doi: 10.1007/s002230020018. [DOI] [PubMed] [Google Scholar]
- 30.Cohen A, Dempster DW, Stein EM, Nickolas TL, Zhou H, McMahon DJ, Muller R, Kohler T, Zwahlen A, Lappe JM, et al. Increased marrow adiposity in premenopausal women with idiopathic osteoporosis. J Clin Endocrinol Metab. 2012;97:2782–2791. doi: 10.1210/jc.2012-1477. [DOI] [PMC free article] [PubMed] [Google Scholar]
- 31.Shen W, Chen J, Punyanitya M, Shapses S, Heshka S, Heymsfield SB. MRI-measured bone marrow adipose tissue is inversely related to DXA-measured bone mineral in Caucasian women. Osteoporos Int. 2007;18:641–647. doi: 10.1007/s00198-006-0285-9. [DOI] [PMC free article] [PubMed] [Google Scholar]
- 32.Shen W, Gong X, Weiss J, Jin Y. Comparison among T1-weighted magnetic resonance imaging, modified Dixon method, and magnetic resonance spectroscopy in measuring bone marrow fat. J Obes. 2013;2013:298675. doi: 10.1155/2013/298675. [DOI] [PMC free article] [PubMed] [Google Scholar]
- 33.Cohen A, Dempster DW, Recker RR, Stein EM, Lappe JM, Zhou H, Wirth AJ, van Lenthe GH, Kohler T, Zwahlen A, et al. Abnormal bone microarchitecture and evidence of osteoblast dysfunction in premenopausal women with idiopathic osteoporosis. J Clin Endocrinol Metab. 2011;96:3095–3105. doi: 10.1210/jc.2011-1387. [DOI] [PMC free article] [PubMed] [Google Scholar]
- 34.Cohen A, Recker RR, Lappe J, Dempster DW, Cremers S, McMahon DJ, Stein EM, Fleischer J, Rosen CJ, Rogers H, et al. Premenopausal women with idiopathic low-trauma fractures and/or low bone mineral density. Osteoporos Int. 2012;23:171–182. doi: 10.1007/s00198-011-1560-y. [DOI] [PMC free article] [PubMed] [Google Scholar]
- 35.Dempster D, Shane E. Principles and practice of endocrinology and metabolism. Philadelphia, PA: 2002. Bone quantification and dynamics of bone turnover; pp. 475–479. K. B. [Google Scholar]
- 36.Cohen A, Dempster DW, Muller R, Guo XE, Nickolas TL, Liu XS, Zhang XH, Wirth AJ, van Lenthe GH, Kohler T, et al. Assessment of trabecular and cortical architecture and mechanical competence of bone by high-resolution peripheral computed tomography: comparison with transiliac bone biopsy. Osteoporos Int. 2010;21:263–273. doi: 10.1007/s00198-009-0945-7. [DOI] [PMC free article] [PubMed] [Google Scholar]
- 37.Dempster DW, Compston JE, Drezner MK, Glorieux FH, Kanis JA, Malluche H, Meunier PJ, Ott SM, Recker RR, Parfitt AM. Standardized nomenclature, symbols, and units for bone histomorphometry: a 2012 update of the report of the ASBMR Histomorphometry Nomenclature Committee. J Bone Miner Res. 2013;28:2–17. doi: 10.1002/jbmr.1805. [DOI] [PMC free article] [PubMed] [Google Scholar]
- 38.Griffith JF, Yeung DK, Antonio GE, Lee FK, Hong AW, Wong SY, Lau EM, Leung PC. Vertebral bone mineral density, marrow perfusion, and fat content in healthy men and men with osteoporosis: dynamic contrast-enhanced MR imaging and MR spectroscopy. Radiology. 2005;236:945–951. doi: 10.1148/radiol.2363041425. [DOI] [PubMed] [Google Scholar]
- 39.Griffith JF, Yeung DK, Antonio GE, Wong SY, Kwok TC, Woo J, Leung PC. Vertebral marrow fat content and diffusion and perfusion indexes in women with varying bone density: MR evaluation. Radiology. 2006;241:831–838. doi: 10.1148/radiol.2413051858. [DOI] [PubMed] [Google Scholar]
- 40.Schellinger D, Lin CS, Fertikh D, Lee JS, Lauerman WC, Henderson F, Davis B. Normal lumbar vertebrae: anatomic, age, and sex variance in subjects at proton MR spectroscopy— initial experience. Radiology. 2000;215:910–916. doi: 10.1148/radiology.215.3.r00jn42910. [DOI] [PubMed] [Google Scholar]
- 41.Vanhamme L, van den Boogaart A, Van Huffel S. Improved method for accurate and efficient quantification of MRS data with use of prior knowledge. J Magn Reson. 1997;129:35–43. doi: 10.1006/jmre.1997.1244. [DOI] [PubMed] [Google Scholar]
- 42.Vande Berg BC, Malghem J, Lecouvet FE, Maldague B. Magnetic resonance imaging of normal bone marrow. Eur Radiol. 1998;8:1327–1334. doi: 10.1007/s003300050547. [DOI] [PubMed] [Google Scholar]
- 43.Shen W, Scherzer R, Gantz M, Chen J, Punyanitya M, Lewis CE, Grunfeld C. Relationship between MRI-measured bone marrow adipose tissue and hip and spine bone mineral density in African-American and Caucasian participants: the CARDIA study. J Clin Endocrinol Metab. 2012;97:1337–1346. doi: 10.1210/jc.2011-2605. [DOI] [PMC free article] [PubMed] [Google Scholar]
- 44.Shen W, Chen J, Gantz M, Punyanitya M, Heymsfield SB, Gallagher D, Albu J, Engelson E, Kotler D, Pi-Sunyer X, Shapses S. Ethnic and sex differences in bone marrow adipose tissue and bone mineral density relationship. Osteoporos Int. 2012;23:2293–2301. doi: 10.1007/s00198-011-1873-x. [DOI] [PMC free article] [PubMed] [Google Scholar]
- 45.Shen W, Chen J, Gantz M, Punyanitya M, Heymsfield SB, Gallagher D, Albu J, Engelson E, Kotler D, Pi-Sunyer X, Gilsanz V. MRI-measured pelvic bone marrow adipose tissue is inversely related to DXA-measured bone mineral in younger and older adults. Eur J Clin Nutr. 2012;66:983–988. doi: 10.1038/ejcn.2012.35. [DOI] [PMC free article] [PubMed] [Google Scholar]