There was substantial agreement between readers for background parenchymal enhancement as detected at contrast material–enhanced spectral mammography and MR imaging.
Abstract
Purpose
To assess the extent of background parenchymal enhancement (BPE) at contrast material–enhanced (CE) spectral mammography and breast magnetic resonance (MR) imaging, to evaluate interreader agreement in BPE assessment, and to examine the relationships between clinical factors and BPE.
Materials and Methods
This was a retrospective, institutional review board–approved, HIPAA-compliant study. Two hundred seventy-eight women from 25 to 76 years of age with increased breast cancer risk who underwent CE spectral mammography and MR imaging for screening or staging from 2010 through 2014 were included. Three readers independently rated BPE on CE spectral mammographic and MR images with the ordinal scale: minimal, mild, moderate, or marked. To assess pairwise agreement between BPE levels on CE spectral mammographic and MR images and among readers, weighted κ coefficients with quadratic weights were calculated. For overall agreement, mean κ values and bootstrapped 95% confidence intervals were calculated. The univariate and multivariate associations between BPE and clinical factors were examined by using generalized estimating equations separately for CE spectral mammography and MR imaging.
Results
Most women had minimal or mild BPE at both CE spectral mammography (68%–76%) and MR imaging (69%–76%). Between CE spectral mammography and MR imaging, the intrareader agreement ranged from moderate to substantial (κ = 0.55–0.67). Overall agreement on BPE levels between CE spectral mammography and MR imaging and among readers was substantial (κ = 0.66; 95% confidence interval: 0.61, 0.70). With both modalities, BPE demonstrated significant association with menopausal status, prior breast radiation therapy, hormonal treatment, breast density on CE spectral mammographic images, and amount of fibroglandular tissue on MR images (P < .001 for all).
Conclusion
There was substantial agreement between readers for BPE detected on CE spectral mammographic and MR images.
© RSNA, 2016
Introduction
Background parenchymal enhancement (BPE) is a well-known phenomenon demonstrated at breast magnetic resonance (MR) imaging and is caused by enhancement of normal breast tissue after intravenous contrast material administration (1–5). The degree of BPE is related to the vascular supply and permeability of breast parenchyma and is usually present in a bilateral, symmetrical distribution. BPE is known to fluctuate with varying hormone levels, as determined by menopausal status and possibly the phase of the menstrual cycle in premenopausal women (1,3,5–7). Some recommend that breast MR imaging be performed during days 7–14 of the menstrual cycle (1); however, others did not find that the time of the menstrual cycle in which MR imaging was performed affected rates of cancer detection, callbacks, or positive biopsy results (4,8,9). Hormonal therapy and radiation therapy for breast cancer have been demonstrated to alter BPE levels (10–14). Controversy exists as to whether BPE negatively affects the sensitivity and specificity of MR image interpretation by obscuring enhancing malignancies or causing enhancement patterns that mimic cancerous lesions, respectively (9). Furthermore, BPE is an important parameter to evaluate because it has been demonstrated to be an independent predictor of breast cancer risk, even when compared with the well-studied mammographic breast density (15,16).
Contrast material–enhanced (CE) digital mammography is a relatively new breast imaging modality in which contrast enhancement is used with digital mammography to depict tumor vascularity in a fashion similar to MR imaging (17–21). CE spectral mammography has been demonstrated to be more sensitive than mammography for the detection of breast cancer. Its sensitivity is comparable to that of MR imaging at 96%–100% for detection of the index lesion in patients with breast cancer on the basis of previous studies (22–24). While it is slightly less sensitive for the detection of additional sites of disease, there are fewer false-positive findings at CE spectral mammography in the preoperative setting (22–24). Because of its low cost, potential broad availability, and ability to be used in women who cannot undergo MR imaging because of metallic implants or claustrophobia, CE spectral mammography is a promising addition to current breast imaging techniques. In the course of evaluating this technique, BPE has been noted. However, to our knowledge, no formal evaluation of BPE at CE spectral mammography has been conducted. The goals of this study were to assess the extent of BPE at CE spectral mammography and breast MR imaging, to evaluate interreader agreement in BPE assessment, and to examine the relationships between clinical factors and BPE.
Materials and Methods
Study Design and Patients
The institutional review board granted a waiver of authorization regarding patient consent for this Health Insurance Portability and Accountability Act–compliant retrospective study. Two hundred seventy-eight consecutive patients over 21 years of age who were undergoing evaluation for increased risk (>15% lifetime risk) of developing breast cancer or for newly diagnosed breast cancer between 2010 and 2014 were included. The population included all women from a prospective study of 66 patients with cancer to determine the utility of CE spectral mammography for detecting and staging breast cancer. The remainder of the patients was from a prospective study in which CE spectral mammography was compared with MR imaging for screening women with more than 15% risk of developing breast cancer. All 212 patients who had completed evaluation at the time we began the BPE investigation were included. Patients who were pregnant or lactating or who had renal insufficiency or a history of contrast agent allergy were excluded. CE spectral mammography was required to be performed within 30 days of MR imaging. One hundred three of these patients were included in prior published studies (24,25); however, the focus of this study was on BPE, which was not addressed in those studies.
Patient information was obtained from the electronic medical record. Patients were categorized as premenopausal or postmenopausal (defined as having a last menstrual period more than 12 months prior to imaging). For the premenopausal women, menstrual cycle timing was determined by the date of their last menstrual period at the time of imaging and was categorized as day 1–7, day 8–14, day 15–21, or day 22–28. Menstrual cycle timing was recorded in relation to both MR imaging and CE spectral mammography. Perimenopausal patients with irregular menstrual cycles more than 29 days apart and those without a documented last menstrual period were excluded from the menstrual cycle timing analysis. Of note, 13 premenopausal women underwent imaging on different days but within the same phase of their menstrual cycle, while 21 premenopausal women underwent imaging in different phases of their menstrual cycles, which ranged from 8 to 25 days apart. Current or recent use of hormonal breast cancer treatment was recorded, including selective estrogen receptor modulators and aromatase inhibitors used within the past 3 years. Patients who were using hormone replacement therapy or hormonal contraceptives (14 patients) were excluded from the hormonal treatment analysis. Prior breast radiation therapy was also documented. The amount of fibroglandular tissue on MR images and the breast density at CE spectral mammography were obtained from the original reports in the electronic medical record. They were graded according to the Breast Imaging Reporting and Data System (BI-RADS) as predominately fatty (BI-RADS category 1), scattered fibroglandular densities (BI-RADS category 2), heterogeneously dense (BI-RADS category 3), or extremely dense (BI-RADS category 4).
CE Spectral Mammography and MR Imaging Technique
All CE spectral mammography was performed at our institution by using a state-of-the-art digital mammography unit (Senobright; GE, Buc, France). Intravenous administration of 1.5 mL of iohexol (Omnipaque 350; GE, Shanghai, China) per kilogram of body weight was performed at an injection rate of 3 mL/sec. Once the injection was completed, the patient was positioned to acquire the first mammographic image, which was obtained approximately 2.5 minutes after injection. All four images (craniocaudal and mediolateral oblique images of each breast) were obtained within 5 minutes. For each view, a low-energy exposure (26–30 kVp) and a high-energy exposure (45–49 kVp) were acquired. A recombination algorithm was used to subtract unenhanced breast tissue and provided a subtracted image on which areas of contrast enhancement were highlighted. The low-energy exposure images were used to determine breast density. All four views were used for BPE evaluation, except in patients who had undergone radiation therapy to one breast. In those patients, only the two views of the nonradiated breast were evaluated.
All but 13 MR imaging examinations were performed at our institution. Only examination data from outside institutions that were deemed of equal technical quality to those generated at our institution were used for evaluation. This quality determination was performed by interpreting radiologists at our institution prior to inclusion in the study. All studies were performed with a 1.5-T or 3.0-T commercially available system. Those from our institution were performed on state-of-the-art imaging units (GE, Milwaukee, Wis) by using a dedicated surface breast coil. Integrated parallel acquisition techniques were used for imaging both breasts simultaneously. The standard examination included a localizing sequence, followed by sagittal fat-suppressed T2-weighted and T1-weighted sequences. A T1-weighted, three-dimensional, fat-suppressed fast spoiled gradient-echo sequence was then performed before and three times after delivery of a rapid bolus injection of gadolinium-based contrast agent. CE image acquisitions were obtained in a sagittal projection until 2013, when axial images were used. Unenhanced images were subtracted from CE images on a pixel-by-pixel basis to produce subtraction images. The first CE images were used for BPE evaluation.
CE Spectral Mammographic and MR Image Interpretation
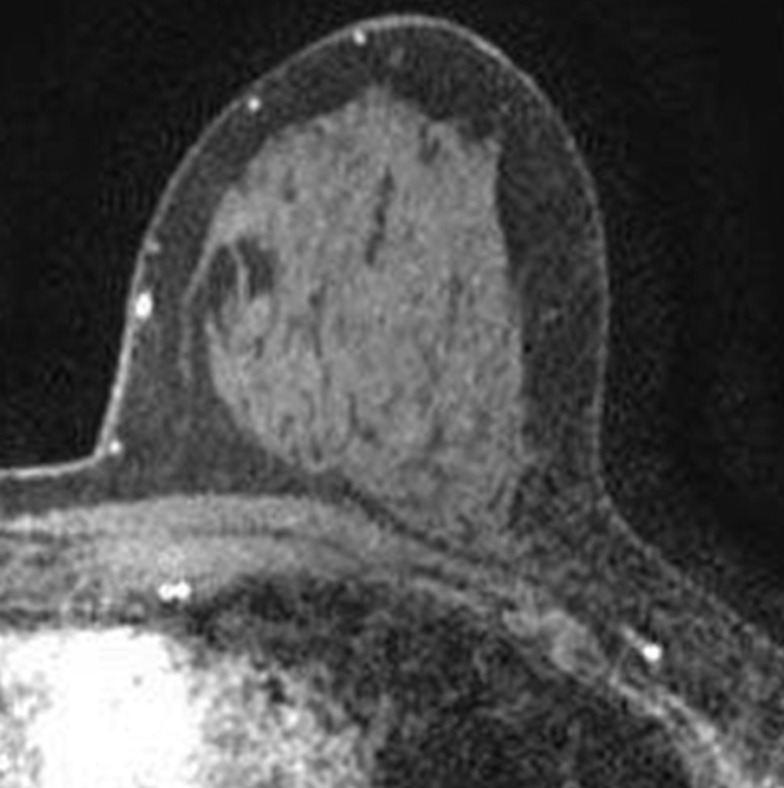
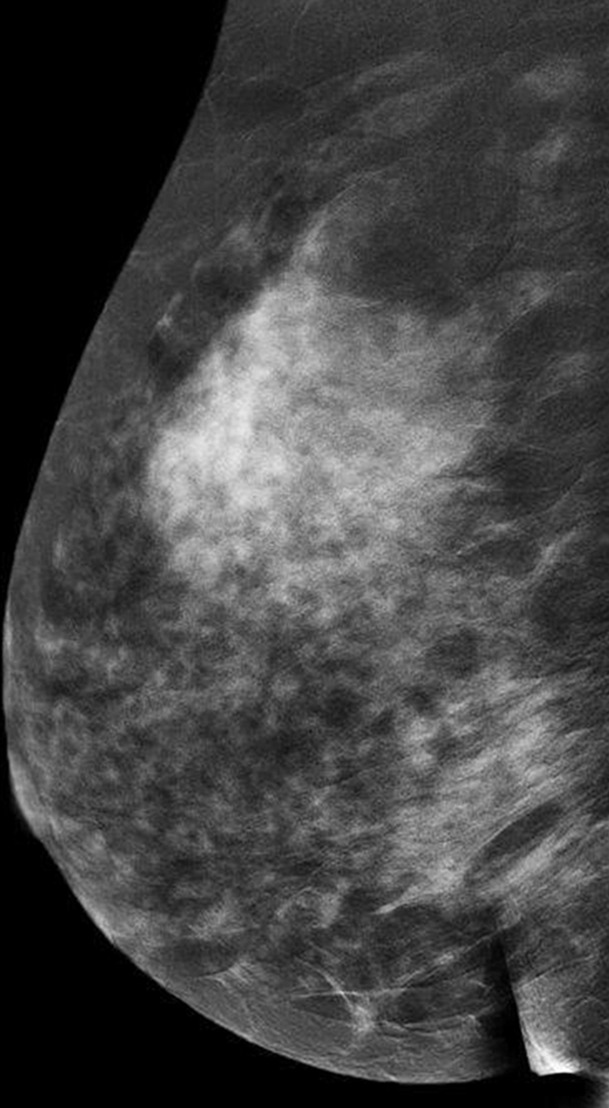
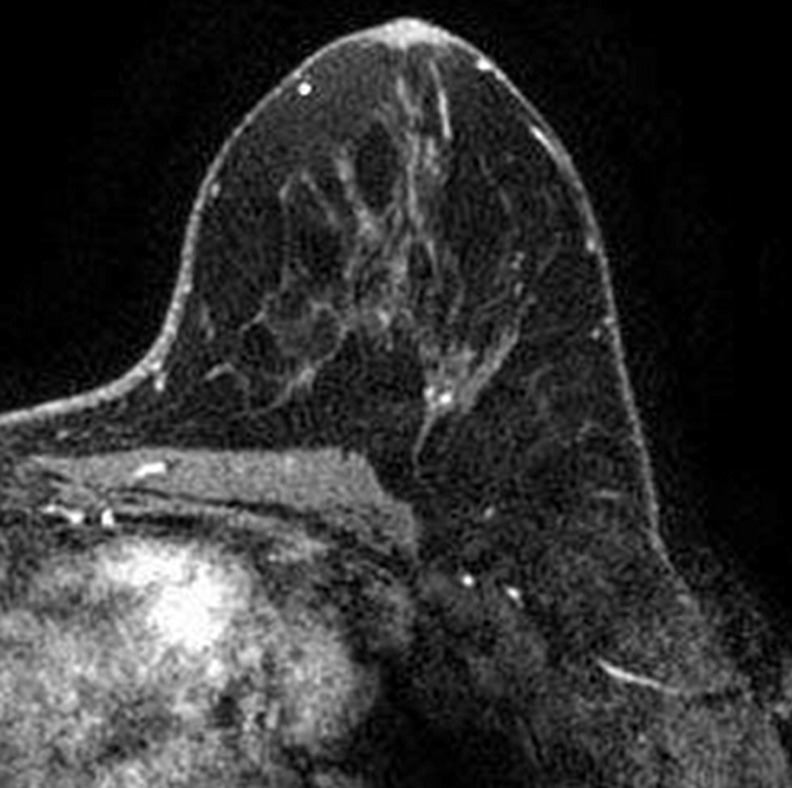
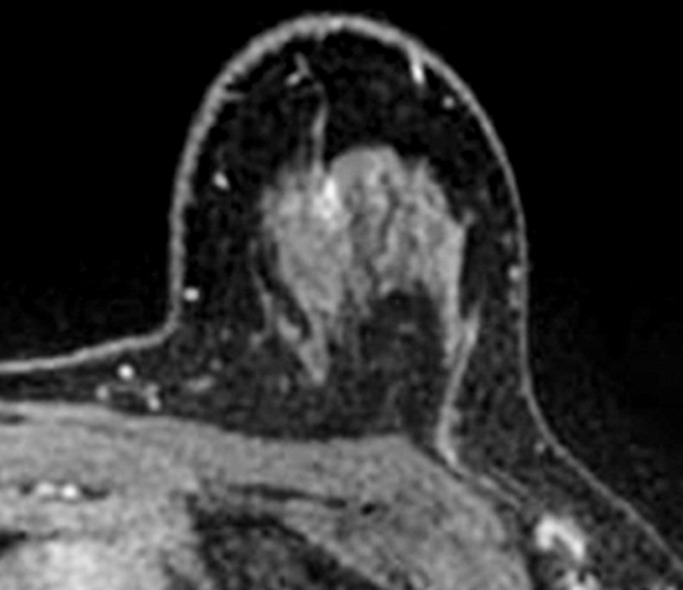
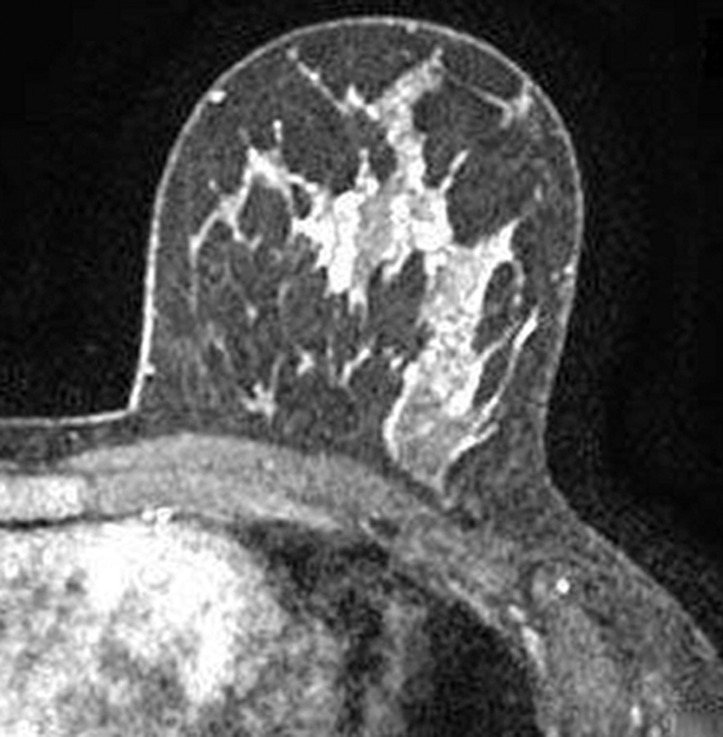
Images were reviewed by three radiologists (E.A.M., J.B.K., and D.D.) with 10–20 years of breast imaging experience. Prior to image review, the readers examined a standardized set of eight cases that demonstrated BPE categories on CE spectral mammographic and MR images. The CE spectral mammographic and MR images of all 278 patients were reviewed by all three readers independently in randomized fashion. The volume and intensity of enhancement were categorized according to the BI-RADS system as minimal, mild, moderate, or marked (Figs 1, 2).
Figure 1a:
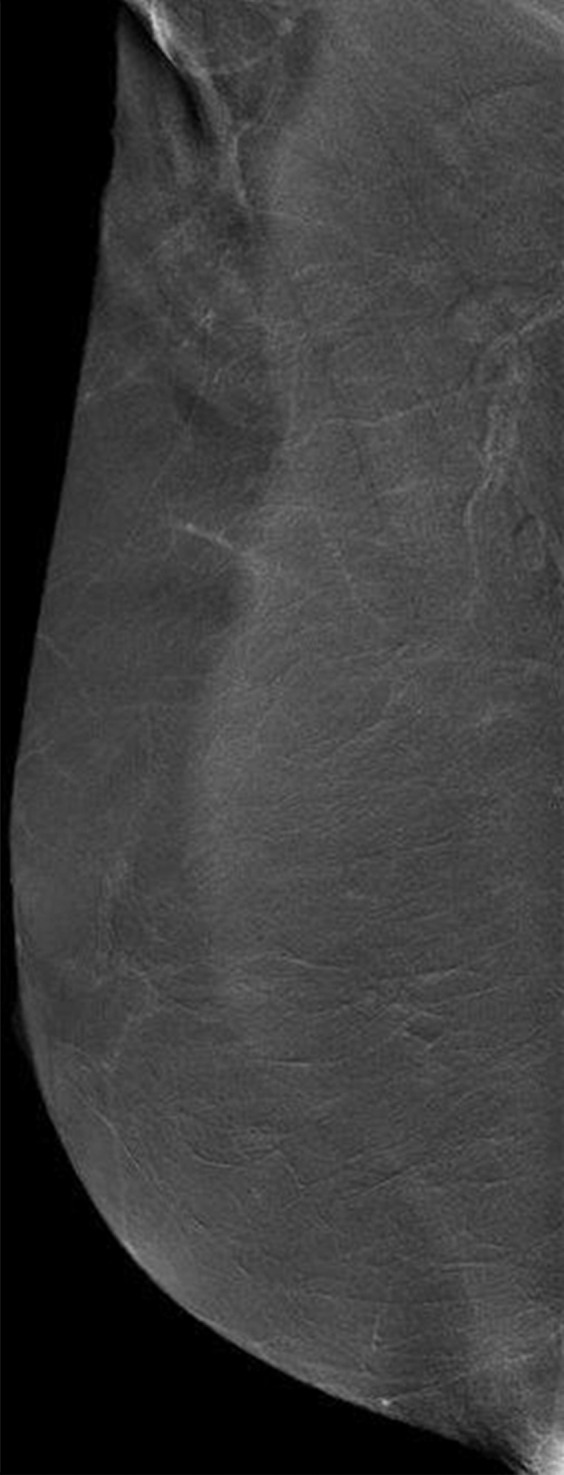
Mediolateral oblique CE spectral mammographic images demonstrate different breasts with (a) minimal, (b) mild, (c) moderate, and (d) marked BPE. All enhancement on these images is due to BPE.
Figure 2a:
Axial T1-weighted fat-suppressed CE subtraction MR images demonstrate different breasts with (a) minimal, (b) mild, (c) moderate, and (d) marked BPE.
Figure 1b:
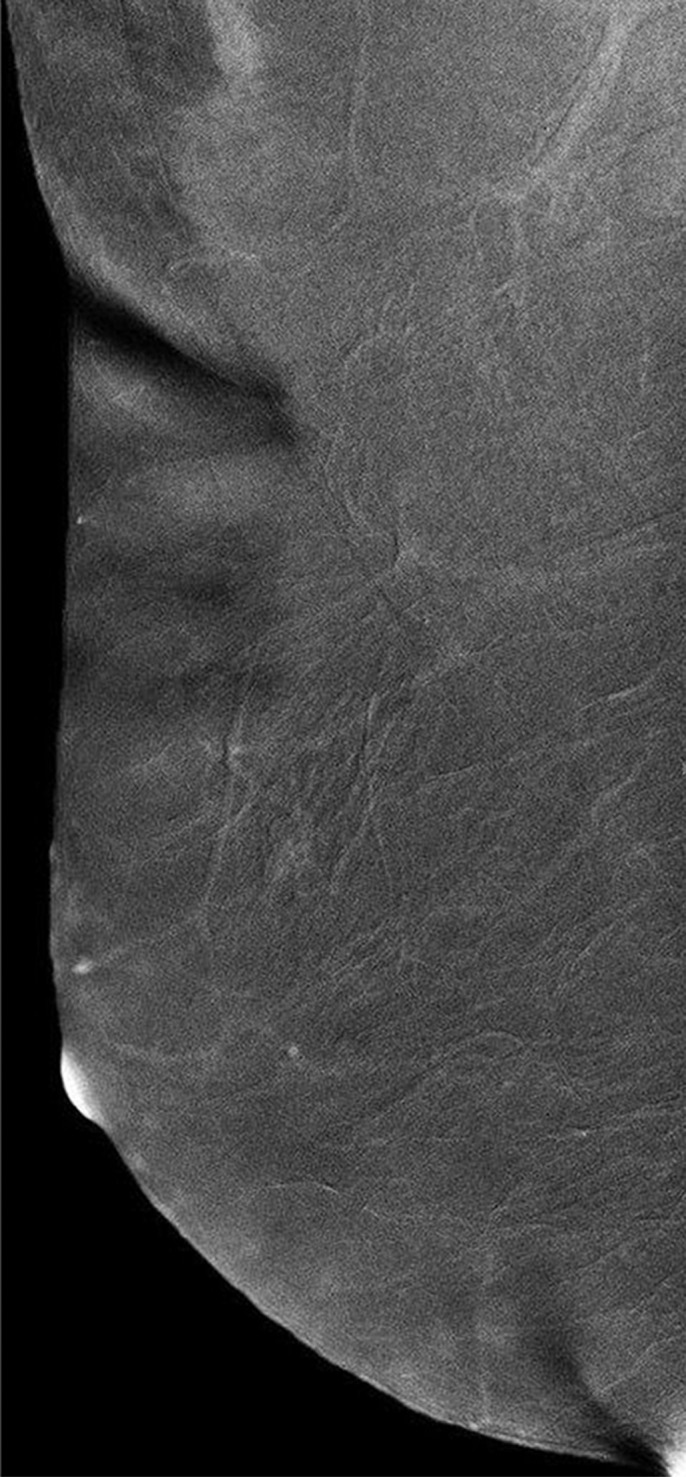
Mediolateral oblique CE spectral mammographic images demonstrate different breasts with (a) minimal, (b) mild, (c) moderate, and (d) marked BPE. All enhancement on these images is due to BPE.
Figure 1c:
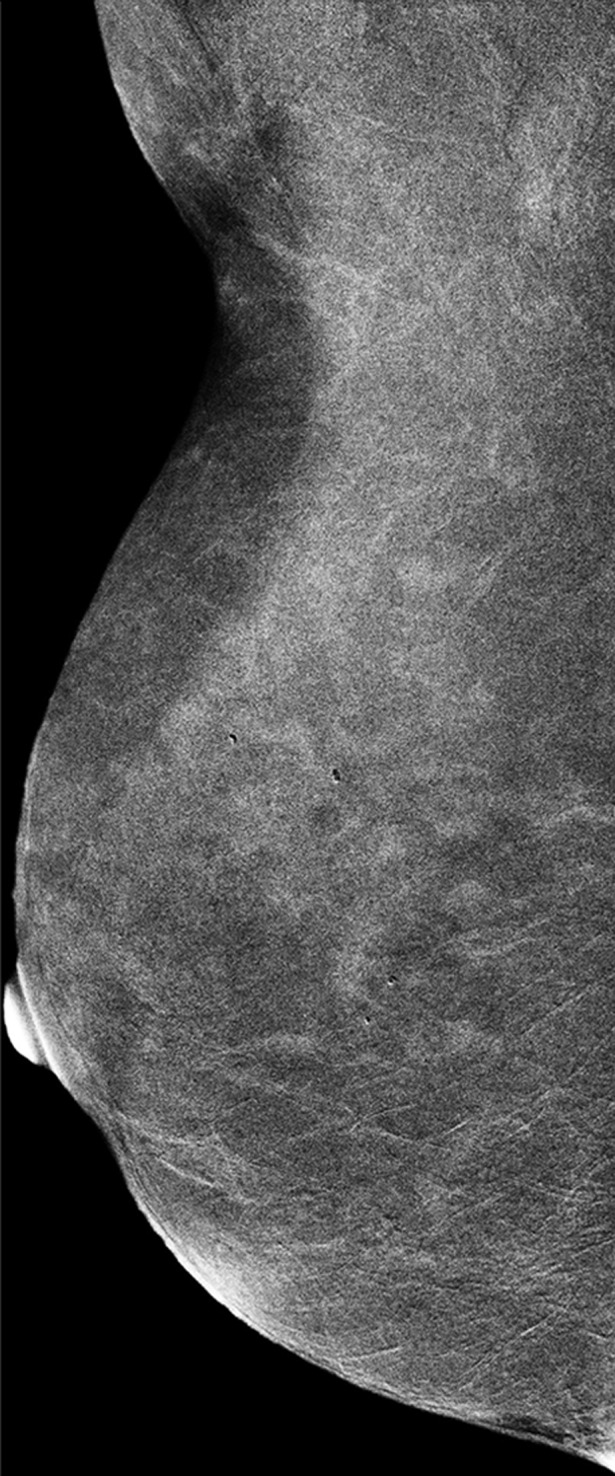
Mediolateral oblique CE spectral mammographic images demonstrate different breasts with (a) minimal, (b) mild, (c) moderate, and (d) marked BPE. All enhancement on these images is due to BPE.
Figure 1d:
Mediolateral oblique CE spectral mammographic images demonstrate different breasts with (a) minimal, (b) mild, (c) moderate, and (d) marked BPE. All enhancement on these images is due to BPE.
Figure 2b:
Axial T1-weighted fat-suppressed CE subtraction MR images demonstrate different breasts with (a) minimal, (b) mild, (c) moderate, and (d) marked BPE.
Figure 2c:
Axial T1-weighted fat-suppressed CE subtraction MR images demonstrate different breasts with (a) minimal, (b) mild, (c) moderate, and (d) marked BPE.
Figure 2d:
Axial T1-weighted fat-suppressed CE subtraction MR images demonstrate different breasts with (a) minimal, (b) mild, (c) moderate, and (d) marked BPE.
Statistical Analysis
A weighted κ coefficient with quadratic weights, along with its 95% confidence interval (CI), was calculated to assess pairwise agreement between CE spectral mammography and MR imaging and between each pairing of the three readers. Percentage agreement was also provided for each pairwise comparison. For assessment of overall agreement, the mean κ value was calculated from these pairs. To calculate CIs around the κ statistic, the data were resampled on the patient level by using bootstrapping (with n = 1000 replicates). Strength of κ agreement was defined as less than 0.00, poor; 0.00–0.20, slight; 0.21–0.40, fair; 0.41–0.60, moderate; 0.61–0.80, substantial; and 0.81–1.00, almost perfect (26). Additionally, sensitivity analysis was performed to examine the effect on κ agreement when excluding the 21 patients with CE spectral mammography and MR imaging performed in different phases of the menstrual cycle.
Univariate relationships between BPE and clinical factors were assessed by using generalized estimating equations adjusted for reader, with an independent working correlation matrix to assume a multinomial distribution with a cumulative logit link to account for multiple measurements per patient. Reader was controlled for in each univariate analysis as a fixed factor. Odds ratios (ORs) and corresponding 95% CIs were estimated from models adjusted for reader. Factors significant at univariate analysis at a level of P less than .05 were considered for multivariate analysis. Owing to the collinearity between fibroglandular tissue amount on MR images and breast density on CE spectral mammographic images, only fibroglandular tissue amount on MR images was considered. Significant factors were entered into a multivariate ordinal generalized estimating equation, adjusted for age and reader as a fixed factor. BPE on CE spectral mammographic images and BPE on MR images was analyzed separately. The proportion of each BPE category in each phase of the menstrual cycle was estimated, along with modified Clopper-Pearson CIs (27), to account for the multiple readers’ measurements.
P values less than .05 were considered to indicate a statistically significant difference. Statistical analyses were performed with SAS version 9.4 software (SAS Institute, Cary, NC) and the Cran R packages “psy” and “boot” (R Foundation, Vienna, Austria).
Results
Patient characteristics are given in Table 1. A total of 278 women were included, with a median time of 0 days (range, 0–29 days) between the two examinations. Median age was 51 years (range, 25–76 years). A total of 61.5% of patients (171 of 278) were postmenopausal, 50% (139 of 278) had heterogeneously dense breasts, 23.7% (66 of 278) had a new diagnosis of breast cancer, 30.2% (84 of 278) had a history of treated breast cancer, 28.0% (78 of 278) used hormonal breast cancer therapies, and 21.9% (61 of 278) had undergone breast radiation therapy.
Table 1.
Patient Characteristics
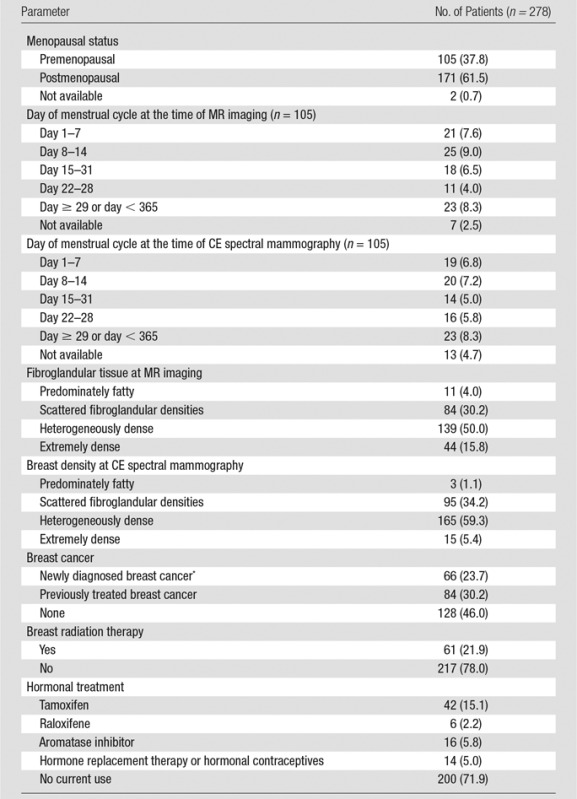
Note.—Numbers in parentheses are percentages. Median patient age was 51 years (range, 25.0–76.0 years). Median time interval between CE spectral mammography and MR imaging was 0 days (range, 0–29 days). One hundred ninety-five patients underwent CE spectral mammography and MR imaging on the same day.
*The number of patients with breast cancer refers to patients with a recent diagnosis of breast cancer, including ductal carcinoma in situ, who had not yet undergone therapy with hormonal treatment, radiation therapy, or surgery.
As seen in Table 2, overall agreement on BPE levels between CE spectral mammography and MR imaging and among the readers was substantial with a κ value of 0.66 (95% CI: 0.61, 0.70). Between CE spectral mammography and MR imaging, the agreement ranged from moderate for reader 3 (κ = 0.55; 95% CI: 0.47, 0.63) to substantial for reader 1 (κ = 0.66; 95% CI: 0.57, 0.75) and reader 2 (κ = 0.67; 95% CI: 0.60, 0.75). Within CE spectral mammography, the agreement between readers was substantial at a κ value of 0.68 (95% CI: 0.62, 0.73), with the pairwise agreements all being substantial (range, κ = 0.62–0.71). Within MR imaging, the agreement for the readers was also substantial at a κ value of 0.75 (95% CI: 0.70, 0.80), with pairwise agreements all being substantial (range, κ = 0.72–0.79).
Table 2.
Agreement among Readers and between Imaging Modalities for Background Parenchymal Enhancement Categorization
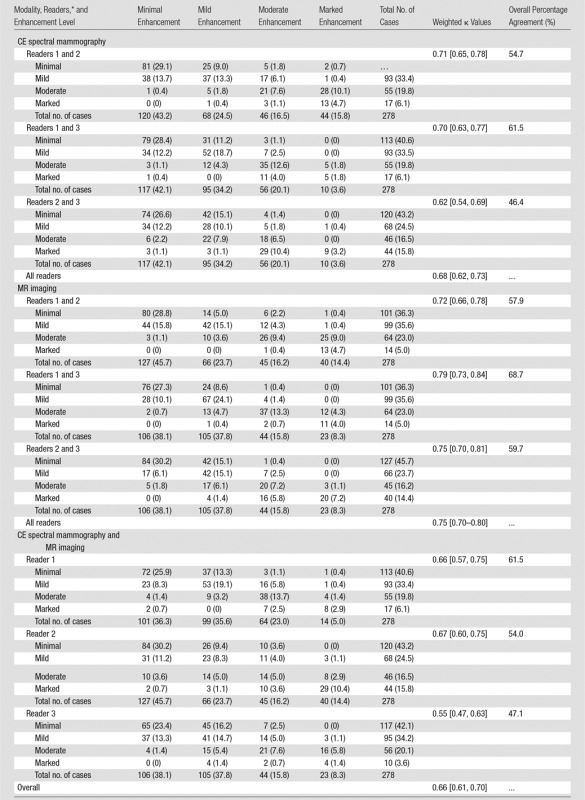
Note.—Data are numbers of patients, with percentages in parentheses, unless indicated otherwise. Data in brackets are 95% CIs.
*The numbers in the text refer to a cross-tabulation of the two readers’ values, with the row values containing those of the first listed reader and CE spectral mammography and the columnar values containing those of the second listed reader and MR imaging.
The proportion of cases in each BPE category was comparable among readers and between imaging modalities (Table 2). On CE spectral mammographic images, the BPE level was minimal in 42%–43%, mild in 25%–34%, moderate in 17%–20%, and marked in 4%–16%; on MR images, it was minimal in 38%–46%, mild in 24%–38%, moderate in 16%, and marked in 8%–14%. When BPE levels were discordant between the readers, they tended to differ mostly by only one category level, particularly between minimal and mild. Between CE spectral mammography and MR imaging, reader 1 recorded higher levels of BPE on MR images compared with CE spectral mammographic images. For readers 2 and 3, the discordance did not appear to have a substantial pattern.
We examined the effect on BPE agreement when excluding the 21 patients who underwent CE spectral mammography and MR imaging in different phases of the menstrual cycle, and the sensitivity analysis showed that the results were not substantially different. The agreement for the three readers was 0.69 (95% CI: 0.63, 0.74) on CE spectral mammographic images, 0.76 (95% CI: 0.71, 0.81) on MR images, and 0.67 (95% CI: 0.62, 0.71) overall, which was approximately 0.01 higher than with all patients included.
BPE as measured on CE spectral mammographic images was significantly associated with menopausal status, radiation therapy, hormonal treatment, breast density depicted at CE spectral mammography, and fibroglandular tissue amount depicted at MR imaging (P < .001 for each, Table 3). The odds of having higher BPE levels was lower for postmenopausal women (OR = 0.16; 95% CI: 0.11, 0.25), lower for those using hormonal treatment (OR = 0.48; 95% CI: 0.32, 0.70), lower for those who underwent radiation therapy (OR = 0.46; 95% CI: 0.30, 0.68), and higher for those with nonfatty breasts as assessed with CE spectral mammography (OR = 5.33 [95% CI: 0.87, 32.95] for BI-RADS category 2; OR = 17.97 [95% CI: 2.95, 109.62] for BI-RADS category 3; and OR = 48.55 [95% CI: 6.39, 368.67] for BI-RADS category 4) and MR imaging (OR = 1.10 [95% CI: 0.37, 2.26] for BI-RADS category 2; OR = 3.50 [95% CI: 1.21, 10.16] for BI-RADS category 3; and OR = 6.13 [95% CI: 1.92, 19.63] for BI-RADS category 4).
Table 3.
Univariate Relationship between Clinical Predictors and BPE
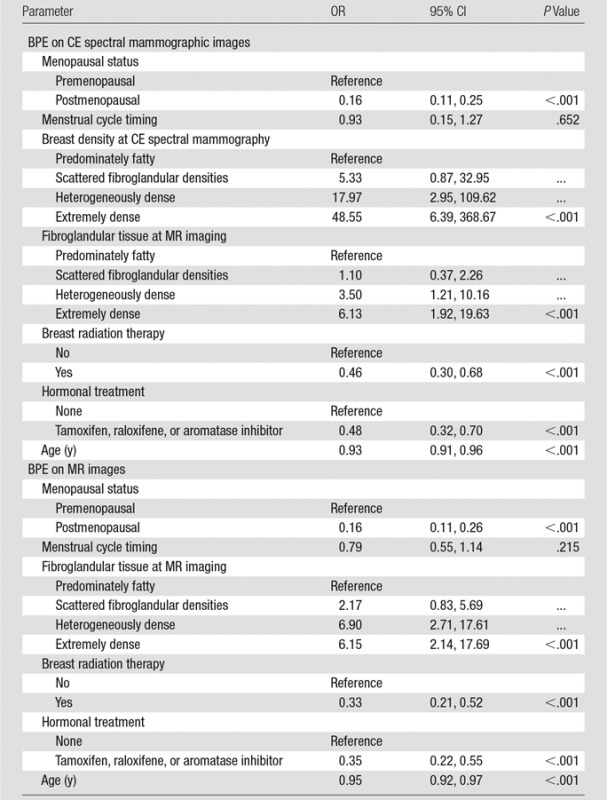
Note.—“Reference” refers to the category used as the reference group. Reader was controlled for in each analysis as a fixed factor.
As seen with CE spectral mammography, BPE on MR images was significantly associated with menopausal status (P < .001), hormonal treatment (P < .001), radiation therapy (P < .001), and fibroglandular tissue amount depicted at MR imaging (P < .001, Table 3). The odds of having higher BPE were lower for postmenopausal women (OR = 0.16; 95% CI: 0.11, 0.26), lower for those using hormonal treatment (OR = 0.35; 95% CI: 0.22, 0.55), lower for those who underwent radiation therapy (OR = 0.33; 95% CI: 0.21, 0.52), and higher for those with nonfatty breasts (OR = 2.17 [95% CI: 0.83, 5.69] for BI-RADS category 2; OR = 6.90 [95% CI: 2.71, 17.61] for BI-RADS category 3; and OR = 6.15 [95% CI: 2.14, 17.69] for BI-RADS category 4).
Hormonal treatment, menopausal status, fibroglandular tissue amount depicted at MR imaging, and radiation treatment were entered into a multivariate model with age and reader. Menopausal status (OR = 0.16; 95% CI: 0.09, 0.30; P < .001), fibroglandular tissue amount depicted at MR imaging (OR = 1.56 [95% CI: 0.53, 4.56] for BI-RADS category 2; OR = 3.80 [95% CI: 1.33, 10.80] for BI-RADS category 3; and OR = 2.43 [95% CI: 0.76, 7.76] for BI-RADS category 4; P < .001), radiation treatment (OR = 0.46 [95% CI: 0.27, 0.81]; P = .007), and hormonal treatment (OR = 0.56 [95% CI: 0.32, 0.98]; P = .042) remained significant predictors of BPE on MR images (Table 4).
Table 4.
Multivariate Relationship between Clinical Predictors and BPE
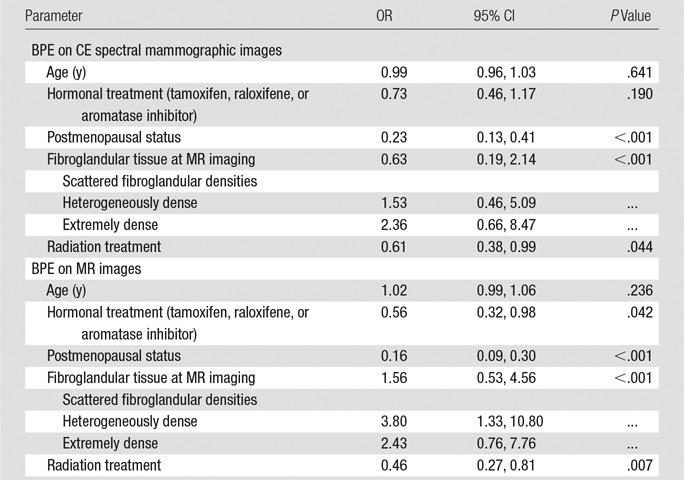
The results of univariate analysis suggest that BPE decreases as age increases, but this association was not significant in the multivariate analysis, likely owing to the relationship between menopausal status and age.
Most patients were postmenopausal, with only 92 and 98 premenopausal patients having available menstrual cycle timing for CE spectral mammography and MR imaging, respectively. We found no clear pattern in the proportion of premenopausal women with minimal, mild, moderate, or marked BPE across the different phases of the menstrual cycle. Notably, the CIs for the estimates of each cycle time overlapped in most cases.
Discussion
BPE on MR images has been described as a biomarker for increased breast cancer risk (15,16). Therefore, BPE assessment may be an important potential biomarker with other vascular-based imaging techniques. In this study of 278 women, agreement was substantial between findings of CE spectral mammography and MR imaging in the assessment of BPE. Additionally, interreader agreement for BPE categorization was found to be substantial on both CE spectral mammographic and MR images. Prior studies have demonstrated fair or moderate interreader agreement in categorizing BPE on MR images (6,15,28), which may be explained by the readers’ more limited experience with BPE at the time the studies were conducted.
BPE is thought to be related to the vascular supply and permeability of the breast vascularity. A number of studies have shown an influence of menopausal status on MR imaging–depicted BPE (7,15). The breast is a hormonally sensitive tissue; this suggests that postmenopausal women are exposed to lower estrogenic hormone activity that leads to decreased BPE. In our study, we also demonstrated that postmenopausal women have a lower risk of higher BPE levels on both CE spectral mammographic and MR images. Menstrual cycle timing has been shown to be related to BPE on MR images, with the lowest enhancement on days 7–14 of the cycle (1). However, there is variation in the timing among multiple studies (3,4), with King et al (9) finding no association with the phase of the cycle. Similarly, we did not find a clear pattern in variation of BPE across the menstrual cycle on either CE spectral mammographic or MR images, which further suggests that menstrual cycle timing may not need to be considered when scheduling examinations for the purpose of evaluating BPE. However, this finding would need to be confirmed in future studies. Moreover, studies have confirmed that BPE does not obscure cancer detection, increase recall rates, or result in false-positive biopsy findings (4,8,9).
In our sample, women using hormonal treatment for breast cancer were less likely to have higher BPE levels on MR and CE spectral mammographic images, in accordance with the existing literature on MR imaging (10–12). These medications have antiestrogenic effects in the breast, resulting in lower BPE. In 2014, Schrading et al found a more pronounced decrease in BPE with tamoxifen as compared with aromatase inhibitors; however, too few patients in our study were taking aromatase inhibitors to be able to examine a difference (12).
Few studies have addressed the effect of radiation therapy on BPE (13,14). In some, investigators suggest that radiation may disrupt the architecture of the breast parenchyma, leading to reduced vascularity and enhancement. Our data demonstrated that women who underwent radiation treatment had lower BPE levels on both CE spectral mammographic and MR images. Further study is required to determine the origin of this lower BPE.
Similar to BPE on MR images, breast density at mammography corresponds to the fibroglandular component of the breast, and increased levels have been shown be a strong risk factor for breast cancer development (29,30). While Arkani et al (31) found a significant correlation between mammographic density and BPE, other investigators did not find a relationship (32,33). The discrepancy in results may be due to lack of systematic methods of quantifying breast density and BPE in these studies. We observed that increased BPE on CE spectral mammographic images was associated with higher mammographically depicted breast density and that the relationship of BPE with breast density was similar by using low-energy CE spectral mammographic images and MR images. Both were significant predictors of BPE.
The primary limitation of this study, as with all studies on BPE, is the subjective nature of BPE assessment. Another limitation was the retrospective nature of this study. We had to rely on the electronic medical record for patient information, which was not always recorded consistently and could not be used for analysis. Additionally, because this was a cross-sectional study, changes over time could not be examined. The subgroup analyses, including menstrual cycle timing, were limited because of the small patient population in each subgroup. This study was not designed to look at the relationship between BPE on CE spectral mammographic images and breast cancer risk, as the sample size was limited.
In summary, there was substantial agreement between readers for BPE as detected on CE spectral mammographic and MR images. While increased BPE on MR images has been shown to be associated with increased odds of manifesting breast cancer, appropriately powered prospective studies will be needed to evaluate BPE on CE spectral mammographic images as a predictor of breast cancer risk.
Advances in Knowledge
■ Intrareader agreement on background parenchymal enhancement (BPE) levels was moderate to substantial between contrast material–enhanced (CE) spectral mammography and MR imaging (κ = 0.55–0.67).
■ Interreader agreement on BPE level assessment at CE spectral mammography was substantial, with a κ value of 0.68 (95% confidence interval [CI]: 0.62, 0.73).
■ Overall agreement among readers for BPE levels between CE spectral mammography and MR imaging was substantial (κ = 0.66; 95% CI: 0.61, 0.70).
Implication for Patient Care
■ While increased BPE on MR images has been shown to be associated with having increased odds of manifesting breast cancer, appropriately powered prospective studies will be needed to evaluate BPE at CE spectral mammography as a predictor of breast cancer risk.
Received February 22, 2016; revision requested March 25; revision received April 14; accepted May 2; final version accepted May 4.
Study funded in part through the National Institutes of Health National Cancer Institute Cancer Centers (P30 CA008748).
Disclosures of Conflicts of Interest: J.S. disclosed no relevant relationships. E.A.M. disclosed no relevant relationships. J.B.K. disclosed no relevant relationships. D.D. disclosed no relevant relationships. D.G. disclosed no relevant relationships. C.S.M. Activities related to the present article: disclosed no relevant relationships. Activities not related to the present article: author received payment from BioClinica. Other relationships: disclosed no relevant relationships. M.S.J. disclosed no relevant relationships.
Abbreviations:
- BI-RADS
- Breast Imaging Reporting and Data System
- BPE
- background parenchymal enhancement
- CE
- contrast material enhanced
- CI
- confidence interval
- OR
- odds ratio
References
- 1.Kuhl CK, Bieling HB, Gieseke J, et al. Healthy premenopausal breast parenchyma in dynamic contrast-enhanced MR imaging of the breast: normal contrast medium enhancement and cyclical-phase dependency. Radiology 1997;203(1):137–144. [DOI] [PubMed] [Google Scholar]
- 2.Morris EA. Diagnostic breast MR imaging: current status and future directions. Magn Reson Imaging Clin N Am 2010;18(1):57–74. [DOI] [PubMed] [Google Scholar]
- 3.Müller-Schimpfle M, Ohmenhaüser K, Stoll P, Dietz K, Claussen CD. Menstrual cycle and age: influence on parenchymal contrast medium enhancement in MR imaging of the breast. Radiology 1997;203(1):145–149. [DOI] [PubMed] [Google Scholar]
- 4.Hambly NM, Liberman L, Dershaw DD, Brennan S, Morris EA. Background parenchymal enhancement on baseline screening breast MRI: impact on biopsy rate and short-interval follow-up. AJR Am J Roentgenol 2011;196(1):218–224. [DOI] [PubMed] [Google Scholar]
- 5.Delille JP, Slanetz PJ, Yeh ED, Kopans DB, Garrido L. Physiologic changes in breast magnetic resonance imaging during the menstrual cycle: perfusion imaging, signal enhancement, and influence of the T1 relaxation time of breast tissue. Breast J 2005;11(4):236–241. [DOI] [PubMed] [Google Scholar]
- 6.Scaranelo AM, Carrillo MC, Fleming R, Jacks LM, Kulkarni SR, Crystal P. Pilot study of quantitative analysis of background enhancement on breast MR images: association with menstrual cycle and mammographic breast density. Radiology 2013;267(3):692–700. [DOI] [PubMed] [Google Scholar]
- 7.King V, Gu Y, Kaplan JB, Brooks JD, Pike MC, Morris EA. Impact of menopausal status on background parenchymal enhancement and fibroglandular tissue on breast MRI. Eur Radiol 2012;22(12):2641–2647. [DOI] [PubMed] [Google Scholar]
- 8.Bryce Y, Lee CH, Zheng J, Sutton EJ, Sung JS, Morris EM. Outcome of screening breast MRI in pre-menopausal women as a function of week of menstrual cycle [abstr]. In: Radiological Society of North America Scientific Assembly and Annual Meeting Program. Oak Brook, Ill: Radiological Society of North America, 2015; 203. [Google Scholar]
- 9.King V, Brooks JD, Bernstein JL, Reiner AS, Pike MC, Morris EA. Background parenchymal enhancement at breast MR imaging and breast cancer risk. Radiology 2011;260(1):50–60. [DOI] [PMC free article] [PubMed] [Google Scholar]
- 10.King V, Kaplan J, Pike MC, et al. Impact of tamoxifen on amount of fibroglandular tissue, background parenchymal enhancement, and cysts on breast magnetic resonance imaging. Breast J 2012;18(6):527–534. [DOI] [PubMed] [Google Scholar]
- 11.King V, Goldfarb SB, Brooks JD, et al. Effect of aromatase inhibitors on background parenchymal enhancement and amount of fibroglandular tissue at breast MR imaging. Radiology 2012;264(3):670–678. [DOI] [PubMed] [Google Scholar]
- 12.Schrading S, Schild H, Kühr M, Kuhl C. Effects of tamoxifen and aromatase inhibitors on breast tissue enhancement in dynamic contrast-enhanced breast MR imaging: a longitudinal intraindividual cohort study. Radiology 2014;271(1):45–55. [DOI] [PubMed] [Google Scholar]
- 13.Li J, Dershaw DD, Lee CH, Joo S, Morris EA. Breast MRI after conservation therapy: usual findings in routine follow-up examinations. AJR Am J Roentgenol 2010;195(3):799–807. [DOI] [PubMed] [Google Scholar]
- 14.Kim YJ, Kim SH, Choi BG, et al. Impact of radiotherapy on background parenchymal enhancement in breast magnetic resonance imaging. Asian Pac J Cancer Prev 2014;15(7):2939–2943. [DOI] [PubMed] [Google Scholar]
- 15.DeMartini WB, Liu F, Peacock S, Eby PR, Gutierrez RL, Lehman CD. Background parenchymal enhancement on breast MRI: impact on diagnostic performance. AJR Am J Roentgenol 2012;198(4):W373–W380. [DOI] [PubMed] [Google Scholar]
- 16.Dontchos BN, Rahbar H, Partridge SC, et al. Are qualitative assessments of background parenchymal enhancement, amount of fibroglandular tissue on MR images, and mammographic density associated with breast cancer risk? Radiology 2015;276(2):371–380. [DOI] [PMC free article] [PubMed] [Google Scholar]
- 17.Jong RA, Yaffe MJ, Skarpathiotakis M, et al. Contrast-enhanced digital mammography: initial clinical experience. Radiology 2003;228(3):842–850. [DOI] [PubMed] [Google Scholar]
- 18.Lewin JM, Isaacs PK, Vance V, Larke FJ. Dual-energy contrast-enhanced digital subtraction mammography: feasibility. Radiology 2003;229(1):261–268. [DOI] [PubMed] [Google Scholar]
- 19.Dromain C, Balleyguier C, Adler G, Garbay JR, Delaloge S. Contrast-enhanced digital mammography. Eur J Radiol 2009;69(1):34–42. [DOI] [PubMed] [Google Scholar]
- 20.Diekmann F, Freyer M, Diekmann S, et al. Evaluation of contrast-enhanced digital mammography. Eur J Radiol 2011;78(1):112–121. [DOI] [PubMed] [Google Scholar]
- 21.Jochelson M. Contrast-enhanced digital mammography. Radiol Clin North Am 2014;52(3):609–616. [DOI] [PubMed] [Google Scholar]
- 22.Diekmann F, Marx C, Jong R, Dromain C, Toledano AY, Bick U. Diagnostic accuracy of contrast-enhanced digital mammography as an adjunct to mammography. Eur Radiol 2007;17(12):3086–3092. [DOI] [PubMed] [Google Scholar]
- 23.Dromain C, Thibault F, Muller S, et al. Dual-energy contrast-enhanced digital mammography: initial clinical results. Eur Radiol 2011;21(3):565–574. [DOI] [PubMed] [Google Scholar]
- 24.Jochelson MS, Dershaw DD, Sung JS, et al. Bilateral contrast-enhanced dual-energy digital mammography: feasibility and comparison with conventional digital mammography and MR imaging in women with known breast carcinoma. Radiology 2013;266(3):743–751. [DOI] [PMC free article] [PubMed] [Google Scholar]
- 25.Francescone MA, Jochelson MS, Dershaw DD, et al. Low energy mammogram obtained in contrast-enhanced digital mammography (CEDM) is comparable to routine full-field digital mammography (FFDM). Eur J Radiol 2014;83(8):1350–1355. [DOI] [PubMed] [Google Scholar]
- 26.Landis JR, Koch GG. The measurement of observer agreement for categorical data. Biometrics 1977;33(1):159–174. [PubMed] [Google Scholar]
- 27.Graubard BI, Korn EL. Predictive margins with survey data. Biometrics 1999;55(2):652–659. [DOI] [PubMed] [Google Scholar]
- 28.Melsaether A, McDermott M, Gupta D, Pysarenko K, Shaylor SD, Moy L. Inter- and intrareader agreement for categorization of background parenchymal enhancement at baseline and after training. AJR Am J Roentgenol 2014;203(1):209–215. [DOI] [PubMed] [Google Scholar]
- 29.Saftlas AF, Hoover RN, Brinton LA, et al. Mammographic densities and risk of breast cancer. Cancer 1991;67(11):2833–2838. [DOI] [PubMed] [Google Scholar]
- 30.Boyd NF, Byng JW, Jong RA, et al. Quantitative classification of mammographic densities and breast cancer risk: results from the Canadian National Breast Screening Study. J Natl Cancer Inst 1995;87(9):670–675. [DOI] [PubMed] [Google Scholar]
- 31.Arkani S, Newstead GM, Chen V, et al. Parenchymal enhancement on breast MRI may be a marker for cancer risk: correlation of parenchymal enhancement with breast density. San Antonio Breast Cancer Research Conference; 2006. [Google Scholar]
- 32.Cubuk R, Tasali N, Narin B, Keskiner F, Celik L, Guney S. Correlation between breast density in mammography and background enhancement in MR mammography. Radiol Med (Torino) 2010;115(3):434–441. [DOI] [PubMed] [Google Scholar]
- 33.Hansen NL, Kuhl CK, Barabasch A, Strobel K, Schrading S. Does MRI breast “density” (degree of background enhancement) correlate with mammographic breast density? J Magn Reson Imaging 2014;40(2):483–489. [DOI] [PubMed] [Google Scholar]


