Abstract
The angular velocities of ATPase-dependent power strokes as a function of the rotational position for the A-type molecular motor A3B3DF, from the Methanosarcina mazei Gö1 A-ATP synthase, and the thermophilic motor α3β3γ, from Geobacillus stearothermophilus (formerly known as Bacillus PS3) F-ATP synthase, are resolved at 5 μs resolution for the first time. Unexpectedly, the angular velocity profile of the A-type was closely similar in the angular positions of accelerations and decelerations to the profiles of the evolutionarily distant F-type motors of thermophilic and mesophilic origins, and they differ only in the magnitude of their velocities. M. mazei A3B3DF power strokes occurred in 120° steps at saturating ATP concentrations like the F-type motors. However, because ATP-binding dwells did not interrupt the 120° steps at limiting ATP, ATP binding to A3B3DF must occur during the catalytic dwell. Elevated concentrations of ADP did not increase dwells occurring 40° after the catalytic dwell. In F-type motors, elevated ADP induces dwells 40° after the catalytic dwell and slows the overall velocity. The similarities in these power stroke profiles are consistent with a common rotational mechanism for A-type and F-type rotary motors, in which the angular velocity is limited by the rotary position at which ATP binding occurs and by the drag imposed on the axle as it rotates within the ring of stator subunits.
Keywords: ATP synthase, bioenergetics, F1FO-ATPase, molecular motor, single molecule biophysics, A-ATP synthase, F-ATP synthase, angular velocity, power stroke, single molecule rotation
Introduction
The primary source of ATP in archaea such as methanogens is the A1AO-ATP synthase, which shares several structural features with eukaryotic V1VO-ATPases and is evolutionarily distant from the F1FO-ATP synthases that fulfill this role in other bacteria and eukaryotes (1, 2). Metabolism in archaea is coupled to the generation of H+ and/or Na+ potentials across the membrane, both of which can provide the energy for ATP synthesis by the A1AO-ATP synthase. Whereas the F1FO-ATP synthases in prokaryotes and eukaryotes catalyze ATP synthesis at the expense of an electrochemical ion potential, the evolutionarily related V1VO-ATPases function as ATP-driven ion pumps and are unable to synthesize ATP under physiological conditions (3–5). Although the cellular function of archaeal ATP synthases is to synthesize ATP powered by a non-equilibrium electrochemical gradient, they also work as ATP-driven ion pumps to generate an ion gradient under fermentative conditions (6).
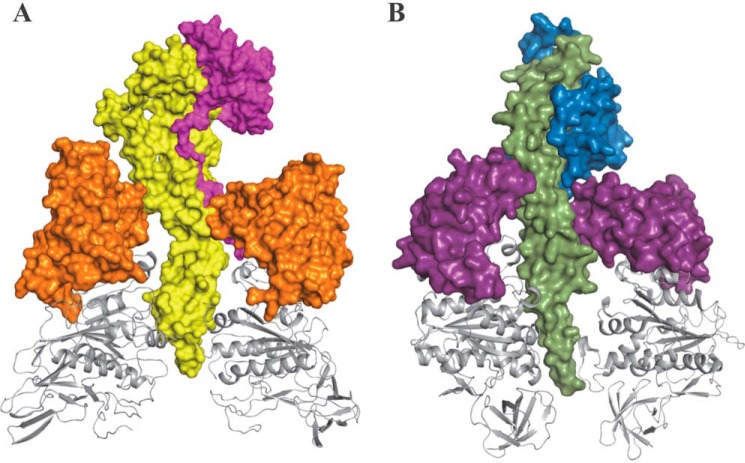
The A-ATP synthases are composed of two opposed rotary motors as follows: an integral membrane AO complex (acx) involved in ion translocation, and a peripheral A1 complex (A3B3CDF) that contains the catalytic sites for a total of nine different subunits (6). Both motors are connected by two peripheral stalks each composed of an EH heterodimer. These complexes share common features with bacterial F1FO-ATP synthases (F1, α3β3γδϵ; and FO, ab2c9–15) and V1VO-ATPases (V1, A3B3CDE3FG3H; and VO, acXc′Yc″Zde) (3–6). In each case, the motors are connected by a central stalk that serves as an axle, as well as by one (F-ATP synthases) or three (V-ATPases) peripheral stalks. The minimal subunit composition of the F-type rotor during ATPase-driven rotation is the γ-subunit (Fig. 1), which is composed of a coiled-coil domain and a globular domain known as the foot (7, 8). Recent structures reveal that the A-ATP synthase and V-ATPase subunits D and F assemble in a manner similar to the coiled-coil and foot domains, respectively, of the F-type γ-subunit (8–11). However, in the A-ATP synthase, the orientation of the four-stranded β-sheet of subunit F is tilted ∼45° relative to the coiled-coil of subunit D as compared with the orientation of the analogous β-sheet in the foot domain relative to the coiled-coil domain of subunit γ.
FIGURE 1.
Comparison of the related lever and foot domains of the MmA3B3DF and F-type α3β3γ complexes. A, composite structure of subunits A, B, D, and F in the MmA3B3DF complex of the A-ATP synthase. The catalytic domain (gray ribbon) and the lever domain (orange) of subunit A (PDB code 3I4L (37) in the A3B3 hexamer that surrounds the central stalk subunits was formed by subunit F (magenta, PDB code 2OV6 (34)) and subunit D (yellow, PDB code 3AON (38)). B, structural components of the α3β3γ complex of bovine mitochondrial F-ATP synthase (PDB code 1E79) (39) showing the catalytic domain (gray ribbon) and lever domain (purple) of β subunits that surround the coiled-coil (green) and foot (blue) domains of the γ-subunit. Subunits B and α are omitted for clarity.
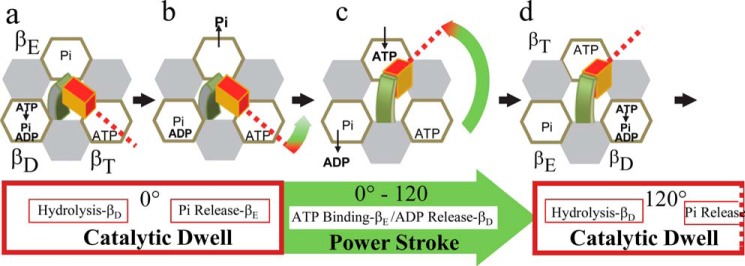
The drive shaft is surrounded by a ring of three heterodimers, known as the (αβ)3-ring in F1 and the (AB)3-ring in A1 and V1. Although each heterodimer comprises a catalytic site, the majority of residues that contribute to nucleotide binding reside on the β-subunit or A-subunit. Each β-subunit and A-subunit has a catalytic domain and a “lever” domain. During ATP synthesis and hydrolysis, the central stalk of an F-ATP synthase rotates clockwise and counterclockwise, respectively, relative to the surrounding (αβ)3-ring (12–14). Each of the three catalytic sites in the (αβ)3-ring work in succession such that, at saturating ATP concentrations, the drive shaft is driven in 120° power strokes that are separated by catalytic dwells when ATP is hydrolyzed (Fig. 2). In most available crystal structures, one catalytic site lacks bound nucleotide (βE), whereas ATP (βT), and ADP (βD) are bound to the other sites. The most prominent conformational change between the empty and nucleotide-occupied sites is that the lever domain is open in the former and closed (pushed against the drive shaft) in the latter when nucleotide is bound.
FIGURE 2.
Rotary mechanism of bacterial F ATPases at saturating ATP concentrations. The (α3β3)-ring (viewed form the membrane side) is designated as a ring of α-subunit (gray) and β-subunit (white) hexagons that surround the γ-subunit composed of the coiled-coil (green) and foot (red) domains. During the catalytic dwell ATP hydrolysis occurs at βD (a), followed by Pi release at βE (b) that initiates the power stroke (c). At saturating ATP concentrations, the power stroke is continuous for 120° (c) during which time ATP binding to βE and ADP release from βD occur. Upon formation of the next catalytic dwell (d), βT changed conformation to βD to induce ATP hydrolysis.
At concentrations that limit the rate of ATP hydrolysis, each 120° power stroke of prokaryotic F1 complexes is interrupted ∼80° prior to the catalytic dwell by an ATP-binding dwell that has a duration proportional to the time required for ATP to bind to the empty catalytic site (8, 15–18). However, in the human F1-ATPase, the ATP-binding dwell occurs 90° prior to the catalytic dwell, and a phosphate release dwell can be induced to occur 25° prior to the catalytic dwell (19). Although the central stalk of the bacterial V-ATPases of Thermus thermophilus and Enterococcus hirae also rotate in 120° steps separated by catalytic dwells, no additional ATP-binding dwell has been observed at limiting ATP concentrations (20, 21). This suggests that, in bacterial V-ATPase A3B3DF complexes, ATP-binding and product-release steps occur at the same rotary positions as the catalytic dwell (22).
The angular velocity of the Escherichia coli F1-ATPase power stroke has been determined as a function of rotational position from single molecule data collected at 200 kHz (equivalent to 200,000 frames/s) with high signal-to-noise using a gold nanorod as a visible probe (8). During the power stroke, the angular velocity of the drive shaft was observed to undergo a sequence of accelerations and decelerations. The slower angular velocity observed with the lower affinity substrate ITP relative to ATP provided direct evidence that energy to power rotation is at least partly derived from substrate binding. The angular velocity profile during the power stroke was found to correlate with targeted molecular dynamics simulations that used a simple functional form for potential energy coupling of the action of the β-subunit levers on the γ-subunit coiled-coil (23). This correlation provided additional support for the hypothesis that ATP binding-dependent closure of the lever domain applies force to rotate the γ-subunit.
We now report the first high resolution characterization of the ATPase-dependent power strokes of the A3B3DF complex of the Methanosarcina mazei Gö1 A-ATP synthase (MmA3B3DF) as well as those of the α3β3γ complex from the thermophilic F-ATP synthase of Geobacillus stearothermophilus, formerly known as Bacillus PS3 (Gsα3β3γ). The power strokes of the MmA3B3DF complex occurred in 120° steps at saturating MgATP concentrations, comparable with those of other prokaryotic V-ATPases and F-ATPases (21, 22, 24). The power stroke angular velocities of the MmA3B3DF and Gsα3β3γ complexes were both observed to vary during the power stroke as a function of rotational position with a series of accelerations and decelerations. These angular velocity profiles were similar to those reported previously for the mesophilic E. coli α3β3γ complex (Ecα3β3γ) (8), even though the ATP-binding dwell of A-type ATPases was not observed at 80° prior to the catalytic dwell as it occurs in F-type ATPases (15, 18). The similarities in these power stroke profiles are consistent with a common mechanism for rotation among the A-type and F-type rotary motors that is largely independent of the position of the ATP-binding dwell. In this mechanism, ATP binding to the catalytic site induces the closure of the lever domain, and the angular velocity at a given rotational position is limited by the mechanical advantage of the force of the lever acting against the rotor as a cam shaft and by the drag imposed on the axle as it rotates within the ring of stator subunits.
Results
ATPase Activity of the A3B3DF Complex from the Archaeal M. mazei Gö and Its Mutants
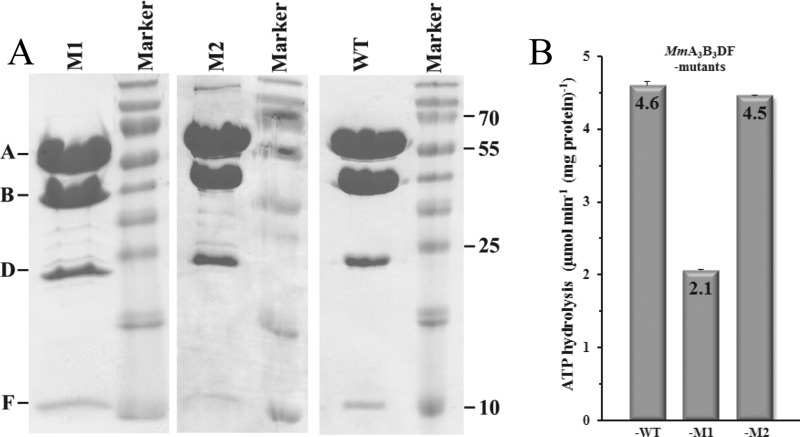
The A-ATP synthase complexes of wild type MmA3B3DF and its mutants MmA3B3DF-M1 and MmA3B3DF-M2 were purified as described recently (25). Fig. 3A shows an SDS-gel of the purified complexes with all subunits. The specific ATPase activities of MmA3B3DF complexes were determined in ensemble measurements using the continuous pyruvate kinase/lactic dehydrogenase-coupled assay. The activity of the wild type MmA3B3DF complex, which contained a His8 tag at the N terminus of subunit A, was 4.6 μmol of ATP min−1 (mg protein)−1 (Fig. 3B). The His8 tag served to purify the protein and to assemble the complex on a microscope slide in the single molecule rotation assay. The introduction of a cysteine in subunit D (A71C) for biotinylation and the attachment of a neutravidin-coated nanorod in the mutant MmA3B3DF-M2 did not significantly affect the ATPase activity. In contrast, removal of all cysteines in the complex except for A71C via amino acid substitutions C36V, C72V, C181A, and C380V in subunit A as well as C67S in subunit B (mutant MmA3B3DF-M1) resulted in a decrease in ATPase activity of 54%. Because these cysteines contribute significantly to the hydrolytic activity of the enzyme, and are not accessible for attachment of the neutravidin-coated gold nanorod, the His8-tagged A3B3DA71CF complex of the M. mazei Gö1 A-ATP synthase was used for single molecule rotation experiments. For simplicity, this complex will be subsequently referred to as the MmA3B3DF complex.
FIGURE 3.
Purification and ATPase activity of MmA3B3DF complexes. A, SDS-17% polyacrylamide gel (40) of the purified recombinant protein complexes with the respective molecular weight marker. B, specific ATPase activities of protein complexes as determined from the initial slope of the decrease in NADH absorbance in the coupled ATPase assay.
Single Molecule Rotation Measurements at a Low Data Acquisition Rate
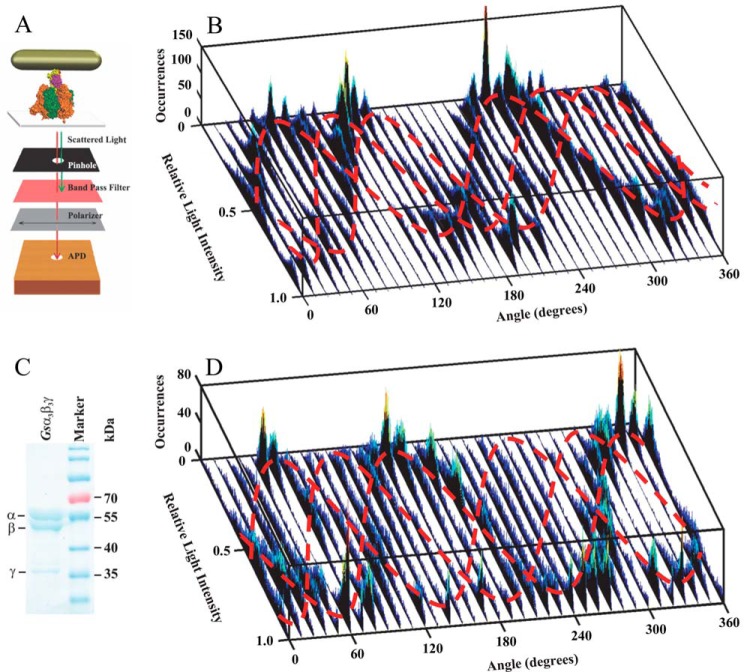
The ATPase-dependent rotation of the MmA3B3DF complex was measured in a single molecule rotation assay. Each complex was attached to an Ni-NTA4 functionalized coverslip via its His8 tags (Fig. 4A). In this orientation, a neutravidin-coated gold nanorod (40 × 76 nm) can dock to the biotinylated Cys-71 of subunit D. Polarized red light scattered from a nanorod attached to a single MmA3B3DF complex passed through a polarizing filter prior to collection by a single photon counter. Under these conditions, rotation of the nanorod was observed as sinusoidal changes in red light intensity (26, 27).
FIGURE 4.
Single molecule assay of rotating protein-gold nanorod complexes. A, schematic model of the microscope setup with a protein-gold nanorod complex. The MmA3B3DF complex (subunits A, B, D, and F in orange, green, yellow, and purple, respectively) is attached via its His8 tags in subunit A to a coverslip, although a neutravidin-coated nanorod is attached to the biotinylated cysteine (red) in subunit D. Gold-nanorods were illuminated by a dark-field condenser. Red scattered polarized light was recorded by an APD after passing through a polarizer and a bandpass filter to block shorter wavelengths of light. B, consecutive histograms of light intensity scattered from a nanorod attached to a rotating MmA3B3DF complex collected at 1 kHz as a function of the polarization angle during ATPase-powered rotation. C, SDS-9% polyacrylamide gel of purified recombinant Gsα3β3γ and molecular mass markers. D, consecutive histograms of light intensity scattered from a nanorod attached to a rotating Gsα3β3γ complex collected at 1 kHz as a function of the polarization angle during ATPase-powered rotation. The approximate courses of the three sinusoidal curves that resulted from the three catalytic dwells are indicated in gray.
In Fig. 4B, the variation of the intensity of red light scattered from a nanorod attached to a single molecule of the MmA3B3DF complex in the presence of saturating MgATP was observed as a function of the stepped rotation of the polarizer by 10° in 5-s intervals, at a data sampling rate of 1 kHz. This low data acquisition speed was shown to report the positions of the three catalytic dwells of the Ecα3β3γ complex (26, 27) because the power stroke transitions occur too fast (on a microsecond time scale) for the detector to capture the vast majority of intermediate rotational positions of the nanorod. Each dwell contributed a peak in the intensity distribution of the histogram at a given set angle of the polarizer. When viewed as a series of histograms of light intensities at each of 36 polarizer angles covering 360°, three offset sinusoidal curves in scattered light intensities were observed from a nanorod attached to the rotating drive shaft of a single MmA3B3DF complex (Fig. 4B). Because the dependence of light intensity as a function of nanorod orientation relative to the axis of the polarizer has been shown to be sinusoidal (28), the observation of three offset sinusoidal curves in the histograms when the axis of rotation was close to the orthonormal position relative to the microscope slide indicates the presence of three dwells per rotation. Thus, these data show that subunit D rotates on a microsecond time scale in 120° steps inside the MmA3B3DF complex separated by dwells that occur on a millisecond time scale.
Deviation of the axis of rotation from orthonormal has been shown to change the offset of the three sinusoidal curves (26) as observed here. It is noteworthy that not all peaks have the same height, and some histograms have fewer than three peaks. Differences in peak heights occur at polarizer angles where two sinusoidal curves intersect (26). Otherwise, the occurrences in each sinusoidal curve depend on the relative duration of each of the three catalytic dwells. The dominance of one sinusoidal curve may suggest that one catalytic dwell was longer than the others. However, this may also result if the nanorod occasionally hits the surface at that position.
Fig. 4D shows a series of histograms of light intensities acquired at 1 kHz at each of 36 polarizer angles covering 360° scattered from a nanorod attached to the γ-subunit drive shaft of the purified Gsα3β3γ complex (Fig. 4C). In the presence of a saturating concentration of MgATP (1 mm), three offset sinusoidal curves were observed with Gsα3β3γ that were closely similar to those observed with the MmA3B3DF complex. Using small beads as probes, the Gsα3β3γ complex has been shown to rotate counterclockwise in 120° steps separated by catalytic dwells in the presence of saturating MgATP concentrations (15, 16, 29). The results of Fig. 4D provided a positive control that indicated that the three offset sinusoidal curves observed in the series of histograms using nanorods during ATPase-dependent rotation catalyzed by the MmA3B3DF complex result from 120° rotational events separated by catalytic dwells in a manner similar to that of Gsα3β3γ.
Single Molecule Rotation Measurements at a High Data Acquisition Rate
Using the same single molecule rotation assay described above, the angular position of the MmA3B3DF complex as a function of time during a power stroke was resolved by sampling the changes in light intensity scattered from the rotating nanorod at 200 kHz. An example of raw data of scattered light intensity changes collected during a single power stroke as a function of time at saturating ATP concentrations is shown in Fig. 5A. Prior to data collection, the polarizing filter was aligned with the nanorod so that the light intensity was near a minimum during one of the catalytic dwells. Consequently, as the power stroke proceeded, the light intensity increased through the maximum, which occurred when the nanorod had rotated 90°, and continued to change in a sinusoidal manner. The end of the power stroke was evident by appearance of only small fluctuations of the intensity consistent with a catalytic dwell, which occurred at ∼400 μs in the case of the power stroke in Fig. 5. Based on the sinusoidal dependence of light scattered from the nanorod as the result of rotational orientation relative to the polarizer, these data provided direct evidence that MmA3B3DF rotates in 120° power strokes.
FIGURE 5.
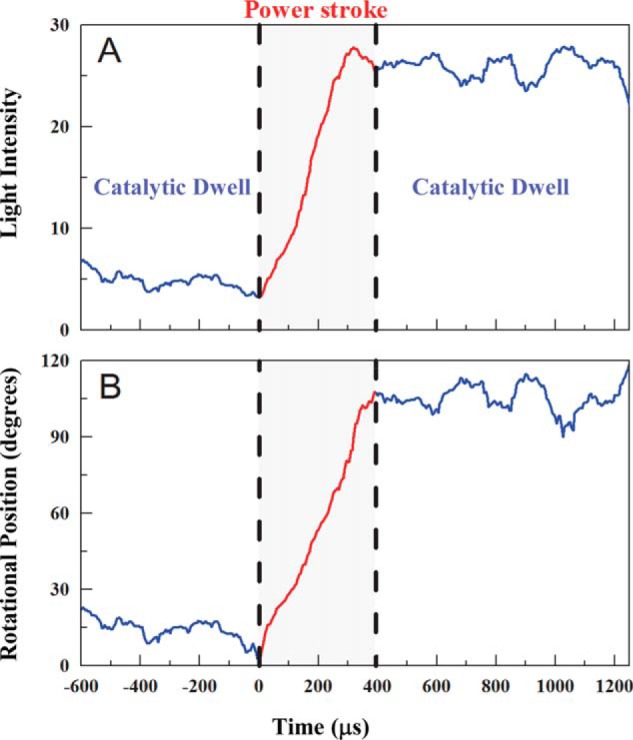
Power stroke analysis. A, light intensities as a function of time collected at 200 kHz during a single power stroke event scattered from a rotating nanorod attached to a single MmA3B3DF complex in the presence of 1 mm ATP. Starting from a catalytic dwell where the nanorod was aligned with the polarizer such that the scattered light intensity was at a minimum, the intensity increased through a maximum during the power stroke (red) until it reached the subsequent catalytic dwell. B, rotational position of the power stroke from A as a function of time calculated from the arcsine1/2 function.
Optimization of the Fitting Algorithm
Martin et al. (8) converted scattered light intensity values from a nanorod attached to E. coli F1-ATPase during a power stroke, similar to the intensity changes shown in Fig. 5A, to angular position using an arcsine function. Because of the intensity fluctuations that occur during the catalytic dwell, it can be difficult to determine the precise point at which any given catalytic dwell ends and the power stroke begins. Although the arcsine function provided a good average fit to the data throughout the duration of the power stroke, we hypothesized that the fit during the first 20° of rotation at near minimal light intensities could be improved using an arcsine1/2 function (Fig. 5B) as described under “Experimental Procedures.”
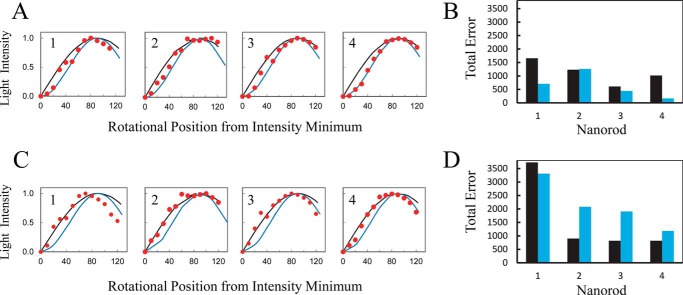
A comparison of the error inherent in the determination of the rotational position of a nanorod from scattered light intensity by the arcsine1/2 versus the arcsine function used previously (8, 28) is shown in Fig. 6. In these experiments a nanorod was attached to the γ-subunit of an Ecα3β3γ molecule that was not rotating, and the average scattered light intensity was determined from a series of histograms at polarizer angles every 10° for a total of 120°, starting from the minimum intensity. The rotational position of the nanorod was calculated from the intensity using the arcsine or the arcsine1/2 function assuming a perfect fit at the first data point, which was at the intensity minimum (Fig. 6A). The total error between the actual rotational positions of the nanorod and the value calculated using the arcsine and arcsine1/2 functions is compared in Fig. 6B. In three of the four nanorods examined, the error using the arcsine1/2 function was substantially smaller. In the data set from nanorod-2, the error using arcsine was slightly smaller than that obtained using arcsine1/2, indicating that the former function provided a better fit overall. The lower errors observed with arcsine1/2 resulted primarily from its ability to fit to the small changes in intensity that occurred during the first 20° and near the maximum (∼90°).
FIGURE 6.
Comparison of arcsine versus arcsine1/2 functions to calculate the rotational position of a gold nanorod from the scattered light intensity as a function of the orientation of the polarizer. A, average light intensity (red) scattered from each of four nanorods as a function of the rotational position of the polarizer for 120° from an intensity minimum, collected at 1 kHz in successive histograms as per Fig. 4. Each nanorod was attached to a molecule of Ecα3β3γ that was not rotating. The data were fitted using the arcsine (black) versus the arcsine1/2 (blue) functions assuming a perfect fit at the first data point, which was the intensity minimum. B, comparison of the total error of the fit of the data for each nanorod from A using arcsine (black) versus arcsine1/2 (blue) functions. C, fits of the experimental data (red) from A using arcsine (black) versus arcsine1/2 (blue) functions assuming a perfect fit at 3° after the first data point. D, comparison of the total error of the fit of the data for each nanorod from B using the arcsine (black) versus the arcsine1/2 (blue) functions.
The MatLab algorithm (8, 26) analyzes power strokes from consecutive data points that begin at scattered light intensities within 5% of the minimum and increase to within 5% of the maximum intensity. The power stroke is clearly distinguished from the catalytic dwell approximately +3° (∼1 data point) after the minimum. Consequently, the errors derived from arcsine versus arcsine1/2 fits were also compared using the same nanorods assuming a perfect fit of the experimental data 3° after the intensity minimum (Fig. 6, C and D). Under these conditions, smaller errors were observed with the arcsine function for the data from three of the four nanorods, although the error for the data set from nanorod-1 was 12% smaller with arcsine1/2. The smaller errors derived using arcsine were due to the better fit with this function during the first 90°, after which the arcsine1/2 function fit more closely to the data. The sum of errors for the data from the four nanorods when the data were analyzed from the minimum using arcsine1/2 was 2571. Because this value was smaller than the sum of the errors determined by the other three methods (Fig. 6, B and D), the arcsine1/2 function was used to calculate the average angular velocity as a function of rotational position during the power stroke.
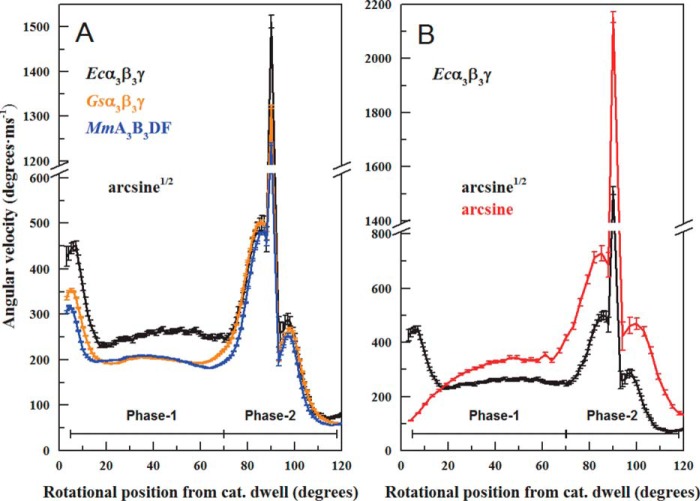
The differences between the two procedures for data derived from the Ecα3β3γ complex are compared in Fig. 7B. The angular velocity profiles derived from scattered light intensity using the arcsine function and arcsine1/2 share most of the same features. These include attaining a steady state velocity at ∼52° at the end of Phase 1, and the successive accelerations and decelerations at 85, ∼90, 94, and 97°. However, due to the increased precision during the first 15° of the power stroke, the arcsine1/2 function resolves a rapid acceleration that peaks at 7° after the catalytic dwell and then decreases to the steady state velocity. In addition, the angular velocities during Phase 2 derived from arcsine1/2 are also proportionally smaller than those derived by arcsine.
FIGURE 7.
Average angular velocity profiles of the 120° power stroke at 1 mm MgATP. A, average angular velocities of the ATPase-dependent power strokes of MmA3B3DF (blue), Gsα3β3γ (orange), and Ecα3β3γ (black). B, comparison of the angular velocity profile of Ecα3β3γ calculated from the arcsine (red) or the arcsine1/2 (black) functions. Data were collected, and the rotational position was determined as described in Fig. 2. Angular velocities were determined from the moving average of the slope of three consecutive rotational positions from individual power strokes that were averaged and binned for every 3°.
Comparison of Power Stroke Angular Velocity Profiles
The average angular velocity of power strokes between catalytic dwells in the MmA3B3DF complex as a function of rotational position is shown in Fig. 7A. The slopes of neighboring data points (Fig. 5B) were averaged and binned for every 3° of rotation and then plotted versus time for each power stroke. The average angular velocities of 2319 power strokes from 25 molecules of the MmA3B3DF complex varied as a function of the rotational position from the end of the catalytic dwell. At the beginning of the power stroke, subunits D and F rapidly accelerated to ∼300°·ms−1 at 7° and then decelerated to a steady state rate of ∼200°·ms−1 between 25 and 60°. This was followed by a second acceleration to a maximum of 500°·ms−1 at 88°. During a 3° period at an angular position of ∼90°, there was a steep acceleration to a maximum of 1200°·ms−1. After decelerating to 210°·ms−1 at 94°, the rate accelerated again to a maximum of 245°·ms−1 at 100°, before the power stroke decelerated as it approached the next catalytic dwell at 120°.
The average angular velocities of the thermophilic F-ATPase Gsα3β3γ complex were also determined from the power strokes analyzed by gold nanorod data collected at 200 kHz and were compared with similar data collected from Ecα3β3γ-ATPase (Fig. 7A). The angular velocities of these thermophilic and mesophilic F-type ATPases varied as a function of the rotational position from the end of the catalytic dwell in a manner that closely paralleled the changes in angular velocity during the power stroke of the MmA3B3DF. The differences in the power strokes among these motors were primarily in the angular velocities that each achieved during the acceleration and deceleration phases. During the first 60° of rotation from the catalytic dwell (Phase 1), the angular velocities of the A-type and GsF-type were comparable, but they were only about 73% that of the Ecα3β3γ. Although the rotation rates of the motors were comparable during Phase 2 acceleration, the angular velocities of the A-type and GsF-type during the final 30° were 85% those of Ecα3β3γ.
Effects of Nucleotides on the Power Stroke
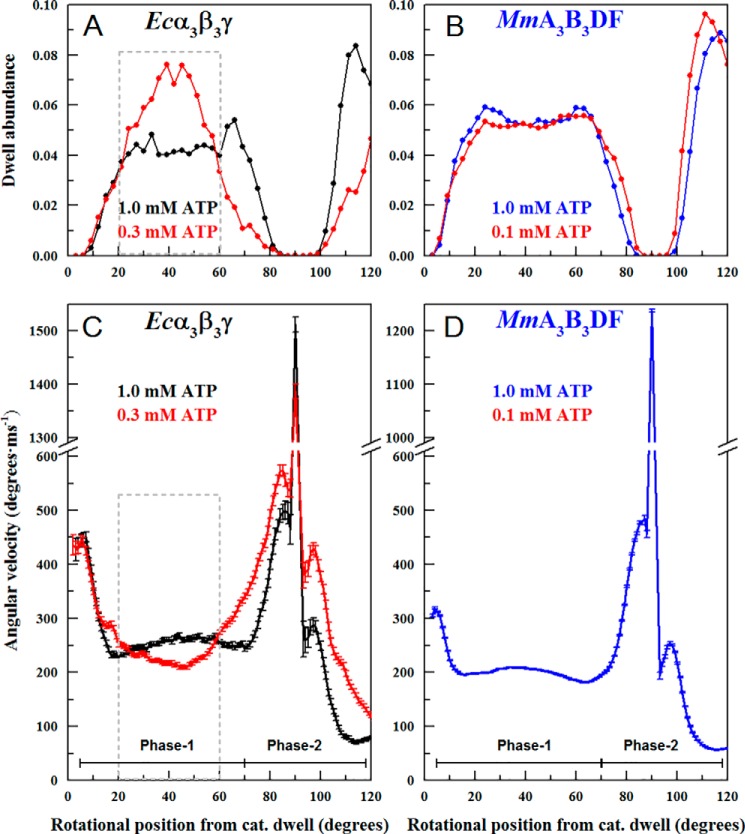
Fig. 8 compares the effects of ATP concentrations that limit the rate of ATP hydrolysis on the MmA3B3DF complex with those on Ecα3β3γ. At limiting ATP concentrations, Ecα3β3γ exhibited an increase in dwells during Phase 1 of the power stroke (20–60° after the catalytic dwell) from that observed at saturating ATP concentrations as reported previously (8). Consistent with ATP-binding dwells, the occurrence of these dwells was maximal after the γ-subunit had rotated ∼40° from the catalytic dwell (Fig. 8A). At this rotational position, the occurrence of dwells was 2-fold greater than that observed at saturating ATP concentrations.
FIGURE 8.
Effects of ATP concentrations that limit the rate of ATPase activity on the average angular velocity profiles. A, dwell abundance as a function of rotational position during the power stroke of Ecα3β3γ at 1 mm MgATP (black) versus 0.3 mm MgATP (red). B, dwell abundance as a function of rotational position during the power stroke of the MmA3B3 complex at 1 mm MgATP (blue) versus 0.1 mm MgATP (red). C, average angular velocity profile of the Ecα3β3γ power stroke at 1 mm MgATP (black) versus 0.3 mm MgATP (red). D, average angular velocity profile of the MmA3B3DF power stroke at 1 mm MgATP (blue) versus 0.1 mm MgATP (red).
Because the angular velocity as a function of rotational position is the average of a few thousand power strokes, the occurrence of a dwell at a given rotational position in a significant fraction of the power strokes will register as zero velocity, and thus decrease the average angular velocity at that position. When ATP was limiting, decreases in the average angular velocity were observed for Ecα3β3γ during Phase 1 with a maximum decrease of more than 20% at a rotational position of ∼40° (Fig. 8C). This is consistent with the increased occurrence of the ATP-binding dwells.
During ATPase-dependent rotation of the MmA3B3DF complex at 100 μm MgATP (Fig. 8B), no changes in the occurrence of dwells during Phase 1 were observed, even though the rate of ATPase activity at this ATP concentration was less than 30% of the maximal rate (25). The angular velocity of the MmA3B3DF complex during Phase 1 was also the same in the presence of ATP concentrations that limited the rate of ATP hydrolysis as that which saturated the ATPase rate (Fig. 8D). The angular velocity during Phase 2 of the angular velocity profile (from 75 to 120°) was about 15% slower when ATP was limiting to ATPase activity than at saturating ATP concentrations as reported previously (8). However, the occurrence of dwells during this part of the power stroke is rare because the angular velocities are at their highest. Based on these data, we conclude that ATP-binding dwells do not interrupt the power strokes of the MmA3B3DF complex. Consequently, ATP-binding dwells in this complex must occur at the same rotary position as the catalytic dwells.
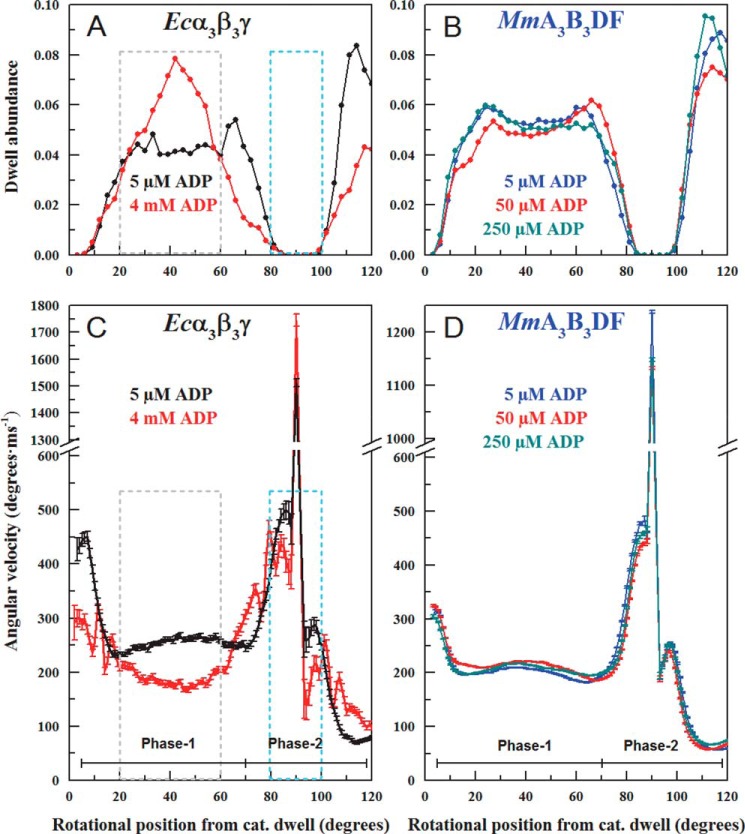
Elevated ADP concentrations (4 mm) were found to induce dwells during the power strokes of Ecα3β3γ during Phase 1 of the power stroke with a maximum increase of about 2-fold 40° after the catalytic dwell (Fig. 9A), as reported previously (8). The presence of additional dwells during this part of the power stroke was also evident as a decrease in the average angular velocity during Phase 1 with a maximum decrease of about 30% (Fig. 9C). The average angular velocity of the Ecα3β3γ power stroke was also lower during Phase 2 (from 80 to 100°) in the presence of additional ADP, which did not result from an increase in dwells as observed previously (8). In addition, the arcsine1/2 analysis, which increases angular resolution during the initial 20° of the power stroke, revealed that high ADP also suppressed the angular velocity in this region that was not due to dwells. In contrast, the MmA3B3DF complex did not exhibit an increase in ADP-binding dwells between 20 and 60° after the catalytic dwell (Fig. 9B) nor was the average angular velocity of the power stroke from this complex affected by the presence of as much as 250 μm ADP (Fig. 9D).
FIGURE 9.
Effects of elevated ADP concentrations on the average angular velocity profiles. A, dwell abundance as a function of rotational position during the power stroke of Ecα3β3γ at 1 mm MgATP in the absence (black) versus the presence of 4 mm MgADP (red). B, dwell abundance as a function of rotational position during the power stroke of the MmA3B3DF complex at 1 mm MgATP in the absence (blue) versus the presence of 50 μm (red) and 250 μm (orange) MgADP. C, average angular velocity of the power stroke as a function of rotational position of EcF1 at 1 mm ATP in the absence (black) versus the presence (red) of 4 mm MgADP. D, average angular velocity of the power stroke as a function of rotational position of the MmA3B3DF complex at 1 mm MgATP (blue) in the absence (blue) versus the presence of 50 μm (red) and 250 μm (orange) MgADP.
Discussion
The results presented here provide the first high resolution comparison of the power stroke angular velocities as a function of rotational position of the archaeal MmA3B3DF complex and the thermophilic Gsα3β3γ complex versus that of the mesophilic Ecα3β3γ complex. The angular velocity profiles of these rotary motors are closely similar and exhibit a series of accelerations and decelerations that occur at nearly the same rotary positions. The drag imposed by a 40 × 76 nm gold nanorod attached to Ecα3β3γ was determined not to be rate-limiting to ATPase-dependent rotation (14). Consequently, the angular velocities observed with this assay resulted from the intrinsic mechanism of the motors rather than from viscous drag on the optical probe.
Most details concerning the angular velocity during the power stroke are not revealed by measurements of the overall rotation rate because that rate is limited by the duration of the catalytic dwell. These motors can lapse into long pauses that can last as long as 30 s due to formation of an inactive state known as the ADP-Mg form (16). However, under conditions that minimize the occurrence of this inactive state, the average duration of the Ecα3β3γ catalytic dwell was determined to be ∼8 ms (26). This is consistent with a kcat for ATPase activity of 130 s−1 such that each ATP is consumed in 7.7 ms. The measured kcat of 4.5 s−1 for the ATPase activity of MmA3B3DF complex presented here (Fig. 3B) is then comparable with a catalytic dwell of ∼220 ms. Because both Ecα3β3γ and MmA3B3DF complexes rotate in three consecutive 120° power strokes equivalent with the consumption of one ATP (Fig. 4), the overall rotation rates of these motors are on the order of 43.3 rps (1/(3(0.0077 s)) and 1.5 rps (1/(3(0.220 s)), respectively. The catalytic dwell of the Gsα3β3γ has been determined to be ∼2 ms, which corresponds to a rotation rate of ∼166 rps at saturating ATP (30). In contrast, the duration of the power strokes of the motors presented here is on the order of 0.2–0.4 ms, and thus the power strokes are not limiting to the overall rate of rotation.
Possible factors that limit the angular velocity of the power stroke at a given rotary position include the binding affinity for MgATP, the mechanical efficiency of MgATP binding-induced closure of the catalytic site lever acting on the axle as a cam shaft, and the drag of the axle as it rotates within the hexagonal ring of catalytic subunits. The observed effects of limiting ATP, and of elevated ADP, on the average angular velocity of the Ecα3β3γ power stroke were not significantly changed when power stroke data were analyzed by arcsine1/2 presented here versus arcsine (8). However, the increased resolution of angular velocity achieved with arcsine1/2 analysis during the initial 20° of the power stroke revealed that high ADP also suppressed the angular velocity in this region.
Energy derived from the binding of substrate to the empty catalytic site of Ecα3β3γ is known to contribute substantially to the angular velocity of the rotor because MgITP, which has a lower binding affinity than MgATP, results in lower velocities than MgATP (8). The binding of MgATP to the empty catalytic site of F1-ATPases results in the closure of the lever domain to make contact with the drive shaft. Pu and Karplus (23) modeled variations in torque during an F1 power stroke as a function of rotational position using a simple functional form to calculate potential energy coupling of the action of the levers on the drive shaft during targeted molecular dynamics trajectories. The variations in torque derived from these targeted molecular dynamics simulations (23) were subsequently found (8) to fit well with the profile of accelerations and decelerations of the Ecα3β3γ power stroke at rotary positions 52, 88, 91, 94, and 97° in Fig. 7. This fit supports the hypothesis that rotation is powered by van der Waals repulsive forces from MgATP binding-dependent movement of the lever acting against the drive shaft as a cam during the final 85° of the power stroke (8).
The angular velocities reported here are similar during the final 50° of the power strokes of the MmA3B3DF complex from the A-ATP synthase, the Gsα3β3γ complex, and that of Ecα3β3γ (Fig. 7A). This suggests that rotation of the A-type is also powered by MgATP binding-dependent movement of the lever acting against the drive shaft as a cam in a manner similar to that of the F-type motors. However, although F-type motors bind MgATP 40° after the catalytic dwell (15, 18), the results presented here (Fig. 8) show that the MmA3B3DF complex does not exhibit an ATP-binding dwell at limiting MgATP concentrations. Bacterial V-ATPases of T. thermophilus and E. hirae also do not exhibit an additional ATP-binding dwell at limiting ATP concentrations (21, 24), suggesting that ATP binding occurs at the same rotary positions as the catalytic dwell in bacterial V-ATPase A3B3DF complexes (22). Using conditions that controlled the rotary position (31), Gsα3β3γ was found to bind MgATP over a range of rotary positions with increasing affinity as a function of the extent of CCW rotation from the catalytic dwell. Although the A-type motors bind MgATP at the catalytic dwell, the close similarities in the angular velocities as a function of rotary position reported here may be possible if the mechanical efficiency of lever closure has a similar dependence on rotary position to that of the F-type motors.
As shown in Fig. 6, the average angular velocity powered by 1 mm MgATP of Ecα3β3γ was 28% higher during the first 70° compared with that of thermophilic Gsα3β3γ and the archaeal MmA3B3DF. This suggests that the transfer of substrate binding in Ecα3β3γ into angular velocity is more efficient than in Gsα3β3γ or in MmA3B3DF. Differences in substrate binding affinity and in the drag imposed on the axel by the inner surface of the ring of catalytic subunits may explain these effects. The slower angular velocities reported here are consistent with the lower values of torque reported for Gsα3β3γ (32) than for Ecα3β3γ (17, 33).
Elevated ADP concentrations have been found to affect ATPase-dependent rotation of Ecα3β3γ in two ways (8). First, ADP can induce an ADP-binding dwell ∼40° after the catalytic dwell, which has also been observed in Gsα3β3γ (15). Second, high ADP concentrations decrease the angular velocity of the Ecα3β3γ power stroke in a manner not related to dwells (Fig. 9C). Martin et al. (8) concluded that ADP-binding dwells resulted from the competitive binding of ADP with ATP for the empty catalytic site (βE), although the decreases in angular velocity not related to dwells were the result of the decreased ability of product ADP to be released from the βD site. In response to elevated ADP, the MmA3B3DF complex did not exhibit ADP-binding dwells 40° after the catalytic dwell nor was the angular velocity changed significantly (Fig. 9D).
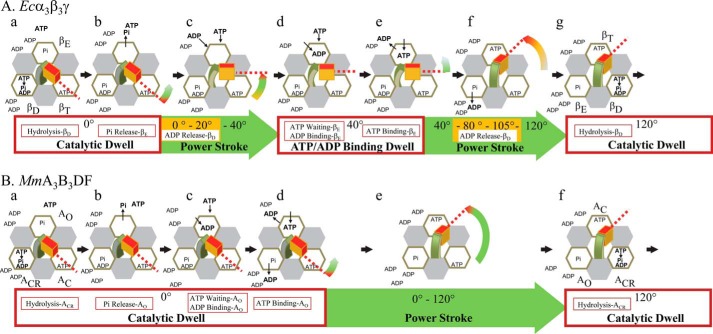
The mechanistic differences between MmA3B3DF and Ecα3β3γ at limiting ATP and/or at elevated ADP are summarized in Fig. 10. In both complexes ATP hydrolysis and phosphate release occur during the catalytic dwell. In bacterial F-type ATPases, these steps occur at the βD and βE catalytic sites, respectively, and the power stroke is initiated by the release of phosphate. When ATP is limiting, the power stroke of the bacterial F-type ATPases is halted after the axle has rotated 40° CCW from the catalytic dwell by an ATP-binding dwell during which time nucleotide does not occupy the βE site. An ADP-binding dwell can also occur 40° after the catalytic dwell if ADP out-competes ATP for binding to the βE site, which occurs more frequently when ADP is elevated. The power stroke resumes for 80° once ATP has displaced ADP from the βE site. However, in the presence of elevated ADP, the angular velocity of the power stroke is also suppressed, presumably because dissociation of ADP from the βD site is inhibited due to mass action. In contrast, events during the MmA3B3DF catalytic dwell include the binding of ATP or ADP to the empty catalytic site (AO), as well as ATP hydrolysis and release of ADP from the catalytic site ACR that is putatively equivalent to the βD site of the F-type ATPase (34). In Fig. 10A, experimental evidence supports a compulsory ordered mechanism for bacterial F-ATPases that includes the following: (a) ATP hydrolysis at βD; (b) Pi release at βE; (c) ATP binding at βE; and (d) ADP release from βD concurrent with or after ATP binding (29). These four events are illustrated in the same order in Fig. 10B to indicate that they all occur during the catalytic dwell and not to imply that the order of these events is the same in A-type ATPases as in bacterial F-ATPases.
FIGURE 10.
Mechanistic differences between MmA3B3DF and the Ecα3β3γ at limiting ATP and/or at elevated ADP concentrations. A, (α3β)3-ring of the Ecα3β3γ complex is designated as a ring of α-subunit (gray) and β-subunit (white) hexagons surrounding the γ-subunit composed of the coiled-coil (green), and the foot (red) domains. During the catalytic dwell ATP hydrolysis occurs at βD (panel a), followed by Pi release at βE (panel b) that initiates the power stroke. At limiting MgATP concentrations (panel c), an ATP-binding dwell interrupts the power stroke at 40° when ATP has not bound to βE. At elevated ADP concentrations (panel d), an ADP-binding dwell interrupts the power stroke at 40° when ADP outcompetes ATP for binding to βE. The power stroke resumes for 80° upon binding of ATP to βE (panel e). Elevated ADP concentrations limit the power stroke angular velocity (yellow) by delaying release of ADP from βD (panel f). Upon formation of the next catalytic dwell, βT changed conformation to βD to induce ATP hydrolysis (panel g) that will be continued by the next 120° power stroke (data not shown). B, (AB)3-ring of the MmA3B3DF complex is designated as a ring of A-subunit (white) and B-subunit (gray) hexagons surrounding the central stalk composed of the D-subunit (green) and F-subunit (red). During the catalytic dwell ATP hydrolysis (panel a), phosphate release (panel b), ADP release (panel c), and ATP binding (panel d) occur in an as yet unspecified order. The 120° power strokes (panel e) are not interrupted by ATP binding or ADP-binding dwells. Upon formation of the next catalytic dwell, AC changed conformation to ACR to induce ATP hydrolysis (panel f) that will be continued by the next 120° power stroke (data not shown). Sites βE, βD, and βT in Ecα3β3γ (A) correspond to sites AO, ACR, and AC in MmA3B3DF (B) (34).
Experimental Procedures
Materials
Pfu DNA polymerase was purchased from Thermo Scientific (Waltham, MA), and Ni-NTA chromatography resin was obtained from Qiagen (Hilden, Germany). Enzymatic digestion was performed using restriction enzymes from New England Biolabs. Chemicals from Bio-Rad were used for SDS-PAGE. All other chemicals of analytical grade were obtained from Biomol (Hamburg, Germany), Merck (Darmstadt, Germany), Sigma, or Serva (Heidelberg, Germany).
Genetic Engineering of the MmA3B3DF Complex
The MmA3B3DF-M1 protein included the amino acid substitutions C36V, C72V, C181A, and C380V in subunit A as well as the substitutions C67S and A71C in subunits B and D, respectively. The fragment containing genes ahaA, ahaB, ahaF, and ahaD of MmA3B3DF-M1 were synthesized and provided by DNA 2.0 in the vector pJ367 (in-house cloning vector). The fragment was further subcloned into pGEM-4Z (35). The pGEM-4Z vector was kindly provided by Prof. V. Müller (Johann-Wolfgang Goethe University, Frankfurt, Germany). The mutant protein MmA3B3DF-M2, subsequently designated MmA3B3DF, contained the single substitution A71C in subunit D, which was generated by replacing the gene encoding subunit D of MmA3B3DF-WT with the gene encoding subunit D mutation A71C of MmA3B3DF-M1 in pJ367. The replacement of subunit D was possible because of the presence of an endogenous NcoI site at the N terminus of subunit D, which was then used along with SacI. All constructs contained a His8 tag at the N terminus of subunit A, and the respective proteins were produced in E. coli DK8 cells. Protein complex production and purification of both mutant complexes were performed as described previously (25).
Purification of the Gsα3β3γ Complex
The Gsα3β3γ complex was purified according to Ho et al. (36). Briefly, Ni2+-NTA affinity chromatography was performed with a linear imidazole gradient of 20–600 mm. Fractions containing the Gsα3β3γ complex were pooled and applied onto an anion exchange column (Resource Q, 6 ml, GE Healthcare) with a buffer containing 50 mm Tris/HCl, pH 7.5, 50 mm NaCl. After increasing the NaCl concentration stepwise, the protein eluted at 250 mm NaCl. Protein-containing fractions were concentrated using a Centricon YM-100 (100-kDa molecular mass cutoff) spin concentrator (Millipore) and stored at −80 °C.
ATP Hydrolysis Assay
The rates of ATPase activity were measured in an NADH-coupled assay. Samples were added at 37 °C to 1 ml of a reaction mix, containing 25 mm Hepes/HCl, pH 7.5, 25 mm KCl, 5 mm MgCl2, 5 mm KCN, 2 mm phosphoenolpyruvate, 2 mm ATP, 0.4 mm NADH, 30 units of l-lactic acid dehydrogenase, and 30 units of pyruvate kinase. The absorbance at 340 nm was observed with spectrometer for 5 min. The activities were calculated from the initial linear slope.
Labeling of MmA3B3DF and Gsα3β3γ Complexes
Cysteine 71 in subunit D of MmA3B3DF-M2 and cysteine 109 in the γ subunit of Gsα3β3γ were biotinylated for the attachment of a neutravidin-coated gold nanorod. Biotinylation was accomplished by 1 min of incubation at 4 °C of 12.7 μm MmA3B3DF-M2 with a 1.5-fold molar excess of biotin-PEAC5-maleimide (Dojindo, Japan) in 25 mm Hepes/HCl, pH 7.5, 25 mm KCl, 5 mm MgCl2. In case of Gsα3β3γ, freshly prepared protein was incubated for 5 min at 4 °C with a 1.2-fold molar excess of biotin-PEAC5-maleimide in 250 mm NaCl and 50 mm Tris/HCl, pH 7.5. The reaction for both complexes was stopped by adding 2 mm acetylcysteine, and unbound biotin-maleimide was removed by dilution, followed by filtration in a centrifuge (Centricon YM 100). Samples were frozen in liquid N2 and stored at −80 °C prior to use.
Single Molecule Rotation Assays
Samples were pipetted into flow cells consisting of two coverslips, separated by double-adhesive tape. Prior to use, the bottom coverslip was cleaned for 30 min by sonication in 1% Hellmanex III, followed by rigorous washing with H2O. Gold nanorods (40 × 76 nm, Nanopartz) were prepared by mixing 9 μl of nanorods with 1 μl of NeutrAvidin (5 mg/ml in H2O, Molecular Probes) for 1 h before adding 1 μl of BSA (10% solution, Aurion, The Netherlands) for 1 min and 89 μl of buffer RB (50 mm Tris, pH 8.0, 10 mm KCl). Solutions were infused in a flow cell (30 μl, 5 min of incubation) in the following order, with washing steps of 60 μl of buffer RB in-between: 1) Ni2+-NTA-horseradish peroxidase conjugate (Qiagen, Germany) in deionized H2O; 2) 1 nm biotinylated protein in buffer RB; 3) gold nanorods in buffer RB; 4) nucleotide solution in buffer RB.
The gold nanorod attached to the protein served as a visible probe of rotation. Samples were illuminated by a mercury lamp through a dark-field condenser in a confocal microscope (Axiovert, Zeiss, Germany). The intensity of red light scattered from the nanorod was observed through a bandpass filter and a polarizer and detected by an avalanche photo diode (APD) as described previously (27). Data were collected for 10 and 30 s at 1 and 200 kHz, respectively, and were analyzed using custom software (Matlab, MathWorks) to obtain intensities and velocities at each angular position of the rotating protein-nanorod complex (8). From the light intensity fluctuations recorded by the APD, power strokes were identified by intensity changes from a minimum taken from the lowest 5th percentile of peaks to a maximum taken from the highest 5th percentile of peak, for which a linear least square fit gave an R value of 0.9. This aligned the power strokes and minimized the phase shift when averaging the data from many power strokes. This also set the same minimum and maximum intensity values, I(t), for any one molecule so the normalized value satisfied 0 ≤ I(t) ≤ 1, which was required to take note of the relation between the rotational position, θ(t), and the intensity, I(t). We let t0 be such that I(t0) = 0 is the first time at which the intensity is zero. We also let tmax be the first time at which I(t0) = Imax (i.e. I is increasing for t0 < t < tmax, with 0 < I(t) <1). Because the scattered light intensity varies in a sinusoidal manner dependent on the rotational position of the nanorod relative to the direction of polarization, the rotational position during the power stroke was determined from Equation 1,
| (Eq. 1) |
for t0 < t < tmax, which is valid for the first 90° of the 120° power stroke (−π/2 < θ < π/2). To obtain the rotational position from the scattered light intensity for the final 30° of the power stroke, we used Equation 2,
| (Eq. 2) |
for t > tmax, which is valid for π/2 < θ < π. The rotational position versus time for each power stroke calculated from Equations 1 and 2 was used to determine the average angular velocity and the occurrence of dwells as a function of rotational position. Determination of rotational position using the arcsine function followed the same procedure as described in Martin et al. (8).
Author Contributions
H. S., J. M., D. S., and G. B. performed the experiments. H. S. and J. M. analyzed the data. J. M. wrote the algorithm. G. G. and W. D. F. conceived the idea for the project. H. S., G. G., J. M., and W. D. F. wrote the paper. All authors reviewed the results and approved the final version of the manuscript.
Acknowledgment
We are grateful to Dr. S. S. M. Malathy (School of Biological Sciences, Nanyang Technological University, Singapore) for the artwork in Fig. 1.
This work was supported in part by National Institutes of Health Grant R01GM097510 (to W. D. F.), Ministry of Education (Singapore) Grant MOE2011-T2-2-156, ARC 18/12, and Ministry of Health (Singapore) Grant National Medical Research Council, CBRG12nov049 (to G. G.). The authors declare that they have no conflicts of interest with the contents of this article. The content is solely the responsibility of the authors and does not necessarily represent the official views of the National Institutes of Health.
- Ni2+-NTA
- Ni2+-nitrilotriacetic acid
- APD
- avalanche photo diode
- PDB
- Protein Data Bank.
References
- 1. Deppenmeier U., and Müller V. (2008) Life close to the thermodynamic limit: how methanogenic archaea conserve energy. Results Probl. Cell Differ. 45, 123–152 [DOI] [PubMed] [Google Scholar]
- 2. Spetzler D., Ishmukhametov R., Hornung T., Martin J., York J., Jin-Day L., and Frasch W. D. (2012) in Photosynthesis: Plastid Biology, Energy Conversion and Carbon Assimilation (Eaton-Rye J. J., Tripathy B. C., and Sharkey T. D., eds) pp. 561–590, Springer, Dordrecht, The Netherlands [Google Scholar]
- 3. Stewart A. G., Sobti M., Harvey R. P., and Stock D. (2013) Rotary ATPases: models, machine elements and technical specifications. Bioarchitecture 3, 2–12 [DOI] [PMC free article] [PubMed] [Google Scholar]
- 4. Cross R. L., and Müller V. (2004) The evolution of A-, F-, and V-type ATP synthases and ATPases: reversals in function and changes in the H+/ATP coupling ratio. FEBS Lett. 576, 1–4 [DOI] [PubMed] [Google Scholar]
- 5. Marshansky V., Rubinstein J. L., and Grüber G. (2014) Eukaryotic V-ATPase: novel structural findings and functional insights. Biochim. Biophys. Acta 1837, 857–879 [DOI] [PubMed] [Google Scholar]
- 6. Grüber G., Manimekalai M. S., Mayer F., and Müller V. (2014) ATP synthases from archaea: the beauty of a molecular motor. Biochim. Biophys. Acta 1837, 940–952 [DOI] [PubMed] [Google Scholar]
- 7. Menz R. I., Walker J. E., and Leslie A. G. (2001) Structure of bovine mitochondrial F1-ATPase with nucleotide bound to all three catalytic sites: implications for the mechanism of rotary catalysis. Cell 106, 331–341 [DOI] [PubMed] [Google Scholar]
- 8. Martin J. L., Ishmukhametov R., Hornung T., Ahmad Z., and Frasch W. D. (2014) Anatomy of F1-ATPase powered rotation. Proc. Natl. Acad. Sci. U.S.A. 111, 3715–3720 [DOI] [PMC free article] [PubMed] [Google Scholar]
- 9. Kishikawa J., Ibuki T., Nakamura S., Nakanishi A., Minamino T., Miyata T., Namba K., Konno H., Ueno H., Imada K., and Yokoyama K. (2013) Common evolutionary origin for the rotor domain of rotary ATPases and flagellar protein export apparatus. PLoS One 8, e64695. [DOI] [PMC free article] [PubMed] [Google Scholar]
- 10. Kishikawa J., Seino A., Nakanishi A., Tirtom N. E., Noji H., Yokoyama K., and Hayashi K. (2014) F-subunit reinforces torque generation in V-ATPase. Eur. Biophys. J. 43, 415–422 [DOI] [PubMed] [Google Scholar]
- 11. Balakrishna A. M., Basak S., Manimekalai M. S., and Grüber G. (2015) Crystal structure of subunits D and F in complex gives insight into energy transmission of the eukaryotic V-ATPase from Saccharomyces cerevisiae. J. Biol. Chem. 290, 3183–3196 [DOI] [PMC free article] [PubMed] [Google Scholar]
- 12. Noji H., Yasuda R., Yoshida M., and Kinosita K. Jr. (1997) Direct observation of the rotation of F1-ATPase. Nature 386, 299–302 [DOI] [PubMed] [Google Scholar]
- 13. Diez M., Zimmermann B., Börsch M., König M., Schweinberger E., Steigmiller S., Reuter R., Felekyan S., Kudryavtsev V., Seidel C. A., and Gräber P. (2004) Proton-powered subunit rotation in single membrane-bound F0F1-ATP synthase. Nat. Struct. Mol. Biol. 11, 135–141 [DOI] [PubMed] [Google Scholar]
- 14. Spetzler D., Ishmukhametov R., Hornung T., Day L. J., Martin J., and Frasch W. D. (2009) Single molecule measurements of F1-ATPase reveal an interdependence between the power stroke and the dwell duration. Biochemistry 48, 7979–7985 [DOI] [PMC free article] [PubMed] [Google Scholar]
- 15. Yasuda R., Noji H., Yoshida M., Kinosita K. Jr., and Itoh H. (2001) Resolution of distinct rotational substeps by submillisecond kinetic analysis of F1-ATPase. Nature 410, 898–904 [DOI] [PubMed] [Google Scholar]
- 16. Hirono-Hara Y., Noji H., Nishiura M., Muneyuki E., Hara K. Y., Yasuda R., Kinosita K. Jr., and Yoshida M. (2001) Pause and rotation of F1-ATPase during catalysis. Proc. Natl. Acad. Sci. U.S.A. 98, 13649–13654 [DOI] [PMC free article] [PubMed] [Google Scholar]
- 17. Junge W., Sielaff H., and Engelbrecht S. (2009) Torque generation and elastic power transmission in the rotary FOF1-ATPase. Nature 459, 364–370 [DOI] [PubMed] [Google Scholar]
- 18. Sielaff H., Rennekamp H., Engelbrecht S., and Junge W. (2008) Functional halt positions of rotary FOF1-ATPase correlated with crystal structures. Biophys. J. 95, 4979–4987 [DOI] [PMC free article] [PubMed] [Google Scholar]
- 19. Suzuki T., Tanaka K., Wakabayashi C., Saita E., and Yoshida M. (2014) Chemomechanical coupling of human mitochondrial F1-ATPase motor. Nat. Chem. Biol. 10, 930–936 [DOI] [PubMed] [Google Scholar]
- 20. Imamura H., Nakano M., Noji H., Muneyuki E., Ohkuma S., Yoshida M., and Yokoyama K. (2003) Evidence for rotation of V1-ATPase. Proc. Natl. Acad. Sci. U.S.A. 100, 2312–2315 [DOI] [PMC free article] [PubMed] [Google Scholar]
- 21. Minagawa Y., Ueno H., Hara M., Ishizuka-Katsura Y., Ohsawa N., Terada T., Shirouzu M., Yokoyama S., Yamato I., Muneyuki E., Noji H., Murata T., and Iino R. (2013) Basic properties of rotary dynamics of the molecular motor Enterococcus hirae V1-ATPase. J. Biol. Chem. 288, 32700–32707 [DOI] [PMC free article] [PubMed] [Google Scholar]
- 22. Iino R., Ueno H., Minagawa Y., Suzuki K., and Murata T. (2015) Rotational mechanism of Enterococcus hirae V1-ATPase by crystal-structure and single molecule analyses. Curr. Opin. Struct. Biol. 31, 49–56 [DOI] [PubMed] [Google Scholar]
- 23. Pu J., and Karplus M. (2008) How subunit coupling produces the γ-subunit rotary motion in F1-ATPase. Proc. Natl. Acad. Sci. U.S.A. 105, 1192–1197 [DOI] [PMC free article] [PubMed] [Google Scholar]
- 24. Furuike S., Nakano M., Adachi K., Noji H., Kinosita K. Jr., and Yokoyama K. (2011) Resolving stepping rotation in Thermus thermophilus H+-ATPase/synthase with an essentially drag-free probe. Nat. Commun. 2, 233. [DOI] [PMC free article] [PubMed] [Google Scholar]
- 25. Singh D., Sielaff H., Sundararaman L., Bhushan S., and Grüber G. (2016) The stimulating role of subunit F in ATPase activity inside the A1 complex of the Methanosarcina mazei Gö1 A1AO-ATP synthase. Biochim. Biophys. Acta 1857, 177–187 [DOI] [PubMed] [Google Scholar]
- 26. Spetzler D., York J., Daniel D., Fromme R., Lowry D., and Frasch W. (2006) Microsecond time scale rotation measurements of single F1-ATPase molecules. Biochemistry 45, 3117–3124 [DOI] [PMC free article] [PubMed] [Google Scholar]
- 27. Hornung T., Martin J., Spetzler D., Ishmukhametov R., and Frasch W. D. (2011) Microsecond resolution of single molecule rotation catalyzed by molecular motors. Methods Mol. Biol. 778, 273–289 [DOI] [PMC free article] [PubMed] [Google Scholar]
- 28. Ishmukhametov R., Hornung T., Spetzler D., and Frasch W. D. (2010) Direct observation of stepped proteolipid ring rotation in E. coli FoF1-ATP synthase. EMBO J. 29, 3911–3923 [DOI] [PMC free article] [PubMed] [Google Scholar]
- 29. Watanabe R., Iino R., and Noji H. (2010) Phosphate release in F1-ATPase catalytic cycle follows ADP release. Nat. Chem. Biol. 6, 814–820 [DOI] [PubMed] [Google Scholar]
- 30. Adachi K., Oiwa K., Nishizaka T., Furuike S., Noji H., Itoh H., Yoshida M., and Kinosita K. Jr. (2007) Coupling of rotation and catalysis in F1-ATPase revealed by single molecule imaging and manipulation. Cell 130, 309–321 [DOI] [PubMed] [Google Scholar]
- 31. Adachi K., Oiwa K., Yoshida M., Nishizaka T., and Kinosita K. Jr. (2012) Controlled rotation of the F1-ATPase reveals differential and continuous binding changes for ATP synthesis. Nat. Commun. 3, 1022. [DOI] [PMC free article] [PubMed] [Google Scholar]
- 32. Yasuda R., Noji H., Kinosita K. Jr., and Yoshida M. (1998) F1-ATPase is a highly efficient molecular motor that rotates with discrete 120 degree steps. Cell 93, 1117–1124 [DOI] [PubMed] [Google Scholar]
- 33. Hornung T., Ishmukhametov R., Spetzler D., Martin J., and Frasch W. D. (2008) Determination of torque generation from the power stroke of Escherichia coli F1-ATPase. Biochim. Biophys. Acta 1777, 579–582 [DOI] [PMC free article] [PubMed] [Google Scholar]
- 34. Gayen S., Vivekanandan S., Biuković G., Grüber G., and Yoon H. S. (2007) NMR solution structure of subunit F of the methanogenic A1AO adenosine triphosphate synthase and its interaction with the nucleotide-binding subunit B. Biochemistry 46, 11684–11694 [DOI] [PubMed] [Google Scholar]
- 35. Lemker T., Grüber G., Schmid R., and Müller V. (2003) Defined subcomplexes of the A1 ATPase from the archaeon Methanosarcina mazei Gö1: biochemical properties and redox regulation. FEBS Lett. 544, 206–209 [DOI] [PubMed] [Google Scholar]
- 36. Ho J., Sielaff H., Nadeem A., Svanborg C., and Grüber G. (2015) The molecular motor F-ATP synthase is targeted by the tumoricidal protein HAMLET. J. Mol. Biol. 427, 1866–1874 [DOI] [PubMed] [Google Scholar]
- 37. Kumar A., Manimekalai M. S., Balakrishna A. M., Jeyakanthan J., and Grüber G. (2010) Nucleotide binding states of subunit A of the A-ATP synthase and the implication of P-loop switch in evolution. J. Mol. Biol. 396, 301–320 [DOI] [PubMed] [Google Scholar]
- 38. Arai S., Saijo S., Suzuki K., Mizutani K., Kakinuma Y., Ishizuka-Katsura Y., Ohsawa N., Terada T., Shirouzu M., Yokoyama S., Iwata S., Yamato I., and Murata T. (2013) Rotation mechanism of Enterococcus hirae V1-ATPase based on asymmetric crystal structures. Nature 493, 703–707 [DOI] [PubMed] [Google Scholar]
- 39. Gibbons C., Montgomery M. G., Leslie A. G., and Walker J. E. (2000) The structure of the central stalk in bovine F1-ATPase at 2.4 A resolution. Nat. Struct. Biol. 7, 1055–1061 [DOI] [PubMed] [Google Scholar]
- 40. Laemmli U. K. (1970) Cleavage of structural proteins during the assembly of the head of bacteriophage T4. Nature 227, 680–685 [DOI] [PubMed] [Google Scholar]


