Sickle cell anemia (SCA) is caused by a mutation in the β-globin gene that results in hemoglobin polymerization and affects approximately 1 in 500 African Americans and 25 million people worldwide.1 Chronic kidney disease (CKD) is observed in up to 58% of adults,2 and is associated with a 3-fold increased risk for early mortality in SCA.3 Multiple genetic modifiers of clinical complications in SCA have been reported, and combining these genetic factors into a risk profile may strengthen the predictive value as compared to the individual factors alone.
Homozygosity or compound heterozygosity for APOL1 G1/G2 (G1=S342G/I384M substitutions, G2=N388/Y389 deletions) is observed in 10–15% of African Americans, and is the strongest genetic association for CKD in African Americans in general.4 APOL1 G1/G2 is also associated with proteinuria and albuminuria in SCA patients.5,6 Alpha-thalassemia (α-thalassemia) is present in about one-third of SCA patients and is associated with reduced hemolysis7 and protection from albuminuria.8 A polymorphism in BCL11A (rs1427407, minor allele frequency 0.25) leads to higher fetal hemoglobin (HbF) levels,9 reduced hemolysis,10 and amelioration of SCA-related complications,11 although its relationship with sickle cell nephropathy is unknown.
We examined the relationship of APOL1 G1/G2, α-thalassemia, and BCL11A rs1427407 with kidney disease in SCA patients treated at the University of Illinois at Chicago (UIC), IL. USA. We hypothesized that a genetic risk profile integrating APOL1, α-thalassemia, and BCL11A may improve our ability to stratify the risk for sickle cell nephropathy. The study was approved by the institutional review board and all subjects provided written informed consent. Between August 2010 and March 2016, 262 adult UIC SCA patients (Hb SS or Hb Sβ°-thalassemia) provided blood samples and were genotyped for APOL1, BCL11A rs1427407, and α-thalassemia variants. We used the average of three consecutive measurements of urine albumin-to-creatinine ratios (ACR), available in 205 patients, and the estimated glomerular filtration rate (eGFR), calculated using the Chronic Kidney Disease Epidemiology Collaboration (CKD-EPI) formula, for the analyses.12 Baseline clinical data was obtained from the electronic medical charts. Hemoglobinuria was defined by urine dipstick analysis positive for blood with <2 red blood cells per high power field on two consecutive urinalyses. Albuminuria was defined as urine ACR≥30mg/g creatinine. Hyperfiltration was defined as eGFR≥130mL/min/1.73m2 in females and eGFR≥140mL/min/1.73m2 in males, similar to previous reports.13 Longitudinal data was collected from the time of sample collection for determining CKD progression (defined as a 50% reduction in eGFR or requirement for renal replacement therapy). Patients who already had end-stage renal disease, or with less than three months of follow up, were excluded from the longitudinal analysis.
Taqman genotyping assays (Applied Biosystems, Foster City, CA, USA) were used for genotyping the APOL1 G1 and G2 and BCL11A rs1427407 polymorphisms, using 10ng of gDNA according to the manufacturer’s instruction in a Bio-Rad CFX384 Real time system with C1000 Thermal cycler. The genotyping calls were analyzed using Bio-Rad CFX Manager 3.1. Multiplex PCR reactions on 100–200 ng of gDNA were used to detect α-thalassemia using methods previously described.14 To avoid primer dimers, only primers for the HBA2 gene, α-3.7K deletion and α-4.2K deletion were used in the PCR reaction.
Comparisons of baseline clinical variables were performed using the Kruskal-Wallis and chi-square test, accordingly, and a P<0.004 was statistically significant after the Bonferroni correction. The relationship between urine ACR and eGFR by age according to genetic category was performed using linear regression. Logistic regression was used for albuminuria and eGFR<60mL/min/1.73m2 using progressive models as previously described.4 Model 1 adjusted for age and sex; Model 2 added diabetes, systolic blood pressure, hydroxyurea therapy, angiotensin converting enzyme (ACE) inhibitor or angiotensin-receptor blocker (ARB) use, and body mass index to Model 1; Model 3 added eGFR<60mL/min/1.73m2 or albuminuria to Model 2. Interaction analysis was performed using ANOVA. The associations between the genetic variants and risk profile with CKD progression were examined using the log-rank method to compare Kaplan-Meier survival curves and Cox proportional hazards ratio, applying the same multivariate models as described above. We evaluated the association of CKD markers in four genetic models, and a P value of <0.0125 was statistically significant after the Bonferroni correction for these analyses.
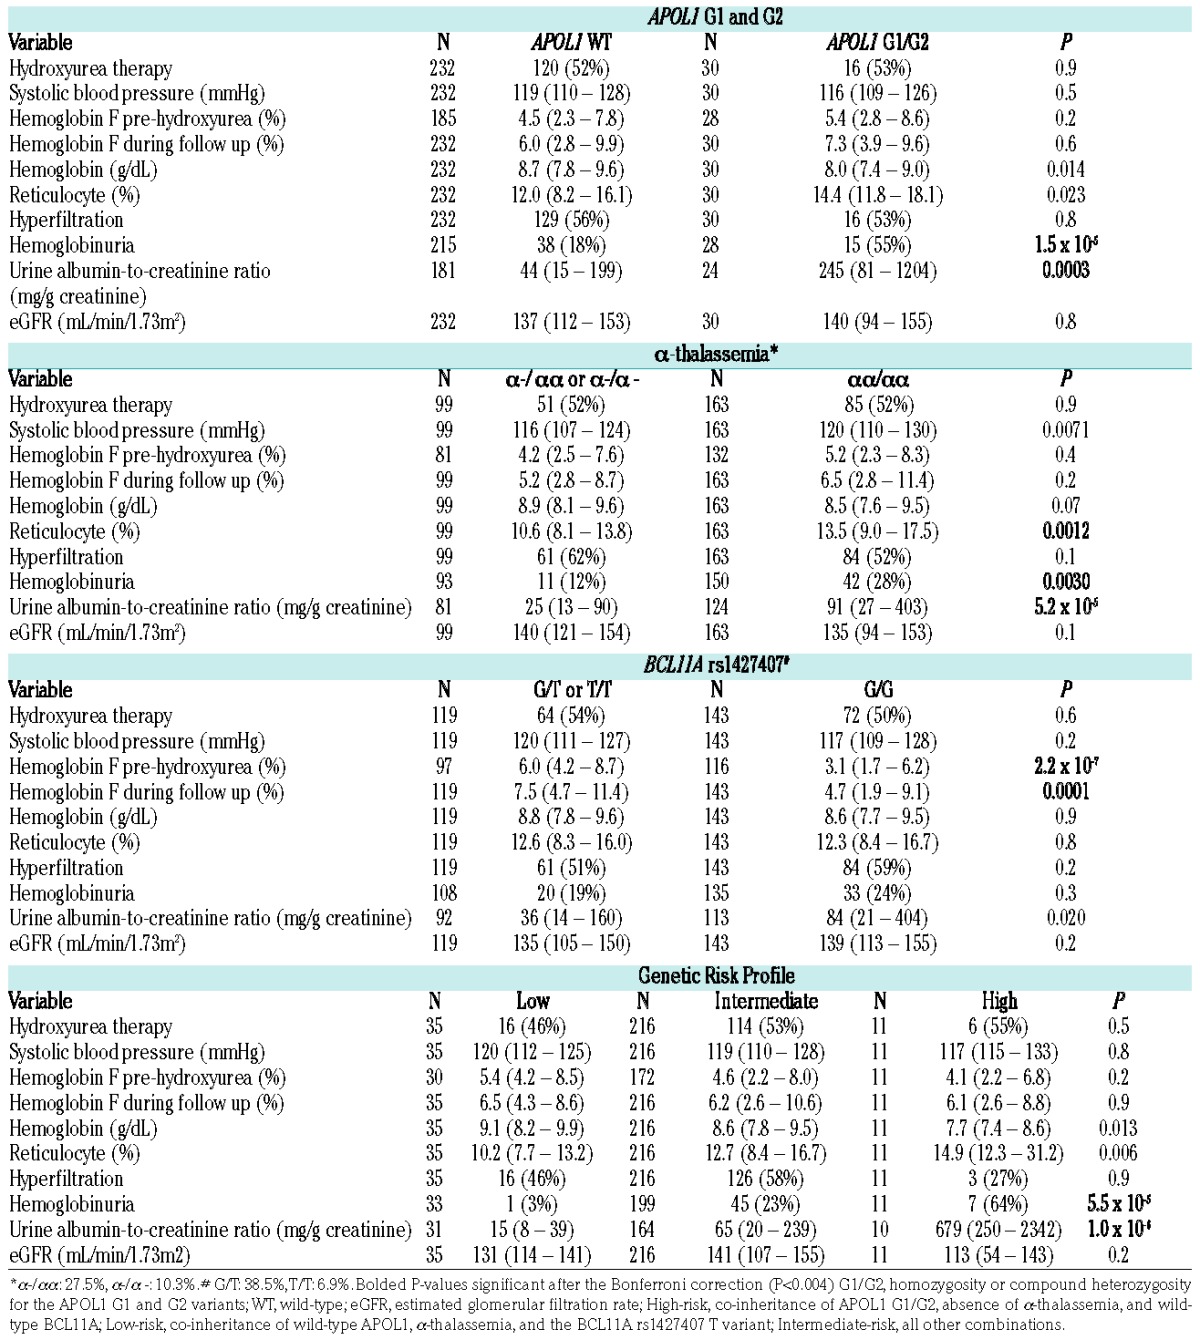
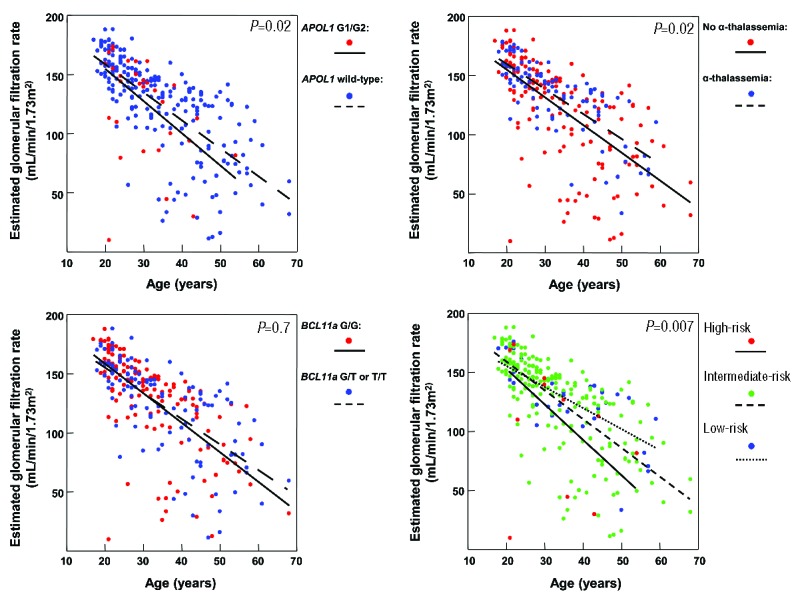
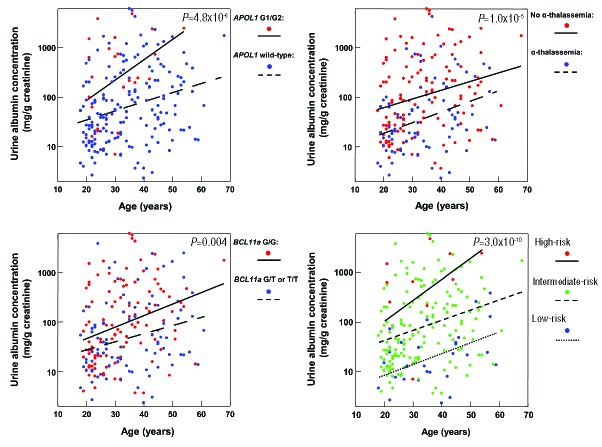
Baseline clinical data according to APOL1, α-thalassemia, and BCL11A variant status are provided in Table 1. Age is a significant risk factor for CKD in SCA,2 and we therefore analyzed the relationship between the genetic variants with ACR and eGFR by age. Inheritance of APOL1 G1/G2, absence of α-thalassemia, and BCL11A wild-type were individually associated with higher urine ACR (Figure 1). Lower eGFR values were observed with inheritance of APOL1 G1/G2 and absence of α-thalassemia, but did not reach statistical significance after the Bonferroni correction (P<0.0125)(Figure 2).
Table 1.
Clinical and laboratory variables according to the APOL1, α-thalassemia, and BCL11A variants, and a genetic risk profile integrating these variants. Results are provided as median values (interquartile range) or number (%).

Figure 1.
Linear regression relationship of urine ACR (albumin-to-creatinine ratio) with age by genotype. Individuals with APOL1 G1/G2 (β=1.5, 95% CI: 0.8 to 2.2), absence of α-thalassemia (β=1.0, 95% CI: 0.6 to 1.5), and wild-type BCL11A rs1427407 (β=0.7, 95% CI: 0.2 to 1.2) had higher urine ACR than individuals with wild-type APOL1, α-thalassemia, and the BCL11A rs1427407 T variant, respectively. A genetic profile integrating these three variants identified individuals with progressively higher urine ACR (β=1.5, 95% CI: 1.0 to 2.0). Linear regression lines by genetic variant or genetic risk profile are provided in the figures.
Figure 2.

Linear regression relationship of eGFR (estimated glomerular filtration rate) with age by genotype. Individuals with APOL1 G1/G2 (β=−12.6, 95% CI: −23.6 to −1.7), absence of α-thalassemia (β=−8.8, 95% CI: −15.9 to −1.7), and wild-type BCL11A rs1427407 (β=−2.2, 95% CI: −9.2 to 4.8) had lower eGFR than individuals with wild-type APOL1, α-thalassemia, and BCL11A rs1427407 T variant, respectively, although none of the associations were statistically significant after the Bonferroni correction. The genetic profile identified individuals with progressively lower eGFR (β=−11.7, 95% CI: −20.1 to −3.3). Linear regression lines by genetic variant or genetic risk profile are provided in the figures.
We then evaluated the association between the genetic variants with albuminuria and eGFR<60mL/min/1.73m2 using multivariate models that adjusted for sociodemographic and clinical factors. The prevalence of albuminuria trended higher with inheritance of APOL1 G1/G2 (APOL1 G1/G2: 76% vs. not APOL1 G1/G2: 59%) and was significantly higher with absence of α-thalassemia (no α-thalassemia: 70% vs. α-thalassemia: 41%) in all three models, and with wild-type BCL11A (wild-type: 68% vs. T allele: 53%) in Model 1 (Table 2A). The prevalence of an eGFR<60mL/min/1.73m2 was not significantly different based on APOL1 G1/G2 (APOL1 G1/G2: 10% vs. not APOL1 G1/G2: 9%) or BCL11A status (wild-type: 10% vs. T allele: 8%), and was higher with absence of α-thalassemia (no α-thalassemia: 13% vs. α-thalassemia: 3%), but did not reach statistical significance after the Bonferroni correction (P<0.0125)(Table 2B).
Table 2A.
Multivariate models for associations between the individual genetic variants or the genetic risk profile with albuminuria (defined as urine ACR (albumin-to-creatinine ratio) ≥30mg/g).

Table 2B.
Multivariate models for associations between the individual genetic variants or the genetic risk profile with eGFR (estimated glomerular filtration rate) <60 mL/min/1.73m2.

Further analysis revealed interactions between APOL1 G1/G2 and BCL11A rs1427407 T and between α-thalassemia and BCL11A rs1427407 T on urine ACR (P≤0.2), and between APOL1 G1/G2 and α-thalassemia on eGFR (P=0.008), providing statistical support for the proposed genetic risk profile integrating these three variants. High-risk was defined as SCA patients with APOL1 G1/G2 who did not have α-thalassemia (αα/αα) and had wild-type BCL11A (G/G). Low-risk was defined as SCA patients who were negative for APOL1 G1/G2 and who had α-thalassemia (either α-/αα or α-/α-) and the BCL11A rs1427407 T allele (either G/T or T/T). All other combinations were defined as intermediate-risk. Applying this genetic profile, 4.2% (11/262) were categorized as high-risk, 82.4% (216/262) as intermediate-risk, and 13.4% (35/262) as low-risk. This profile was associated with progressively higher prevalence rates of hemoglobinuria and higher urine ACR (Table 1). This genetic profile had stronger associations with urine ACR (Figure 1) and eGFR (Figure 2) by age than the individual components. Furthermore, this genetic profile improved the ability to identify SCA patients at progressively higher risk for albuminuria (high-risk: 82%, intermediate-risk: 65%, low-risk: 36%) and eGFR<60mL/min/1.73m2 (high-risk: 25%, intermediate-risk: 9%, low-risk: 3%) on multivariate analysis (Table 2A and 2B).
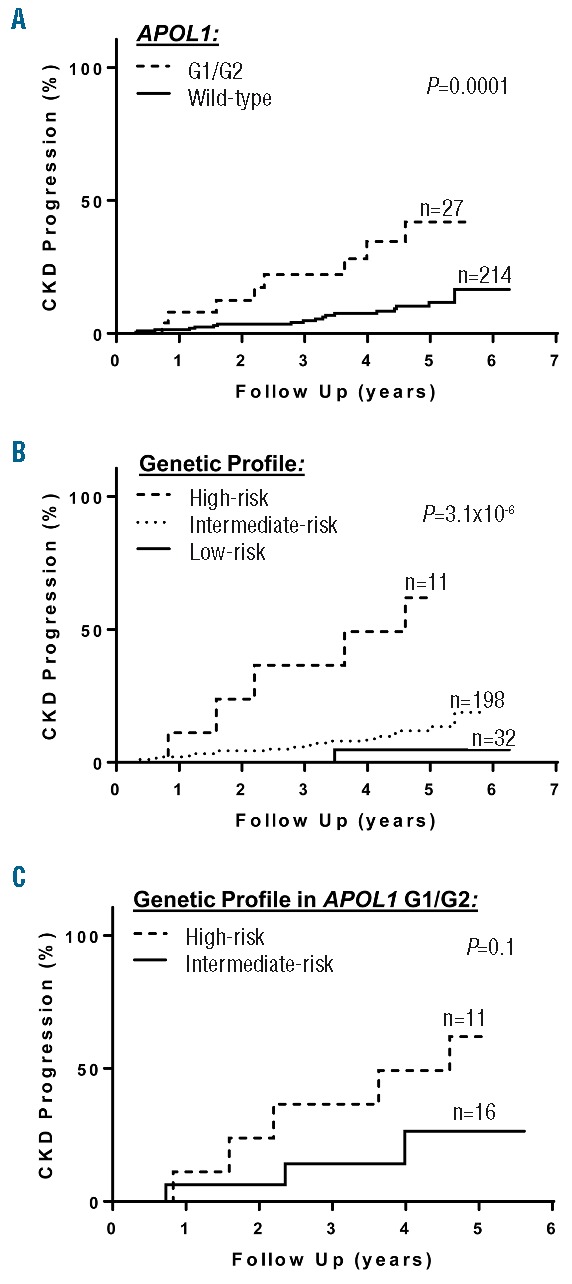
At a median follow up of 4.0 years (interquartile range, 1.9–5.0 years), 10% (24 of 241 patients evaluable) had CKD progression. Of those that progressed, 18 (75%) were due to a 50% decline in eGFR while 6 (25%) were due to the requirement for renal replacement therapy. Rates of CKD progression were higher in SCA patients who inherited APOL1 G1/G2 than those that did not (Figure 3), while no differences in rates of CKD progression were observed based on α-thalassemia or the BCL11A rs1427407 T variant (Table 2C). The application of the genetic profile revealed progressively higher rates of CKD progression. Among the subset of SCA patients with APOL1 G1/G2, a trend for the genetic profile to identify SCA patients with higher risk for CKD progression was also observed (high-risk 16.84 per 100 person-years, intermediate-risk: 5.33 per 100 person-years). One patient, categorized as having hyperfiltration with a baseline eGFR of 145ml/min/1.73m2, developed ESRD, while no other patients with hyperfiltration had CKD progression during the follow up period.
Figure 3.

CKD (chronic kidney disease) progression. CKD progression, defined as a reduction of estimated glomerular filtration rate by 50% or requiring renal replacement therapy, occurred at higher rates based on (A) APOL1 G1/G2, (B) a genetic profile incorporating APOL1, α-thalassemia, and the BCL11A rs1427407 variant, and (C) the genetic profile in the subset of sickle cell anemia individuals with APOL1 G1/G2. Log-rank P-values are provided in the figures. G1/G2, homozygosity or compound heterozygosity for the G1 and G2 risk variants; high-risk, co-inheritance of APOL1 G1/G2, absence of α-thalassemia, and wild-type BCL11A; low-risk, co-inheritance of wild-type APOL1, α-thalassemia, and the BCL11A rs1427407 T variant; intermediate-risk, all other combinations.
Table 2C.
Multivariate models for associations between the individual genetic variants or the genetic risk profile with CKD (chronic kidney disease) progression.

In addition to confirming that APOL1 G1/G2 and α-thalassemia are associated with urine ACR in SCA,5,6,8 we analyzed herein the association of a common BCL11A variant with markers of kidney function, and we evaluated the association of a genetic profile that combines these three genetic variants with sickle cell nephropathy. This genetic profile identified SCA patients at high-risk and low-risk for albuminuria or eGFR<60mL/min/1.73m2 on cross-sectional analysis. Furthermore, we found that APOL1 G1/G2 and the genetic profile incorporating APOL1 G1/G2 were associated with CKD progression on longitudinal follow up. Our study is limited by the small sample size and the fact that it was observational in nature, with the monitoring and treatment of kidney function at the discretion of the patient’s primary provider. Future studies with larger cohorts are needed to confirm our findings, and to identify additional genetic modifiers for the risk of sickle cell nephropathy.
In summary, APOL1 G1/G2, α-thalassemia, and BCL11A rs1427407 can form a genetic profile with an enhanced ability to stratify patients according to the risk of sickle cell nephropathy. α-thalassemia reduces hemolysis in SCA by decreasing the intra-erythrocyte concentration of HbS and reducing HbS polymerization.7 The BCL11A rs1427407 T variant leads to the decreased function of BCL11A at the HbF promoter, and therefore increases HbF leading to decreased HbS polymerization.9 APOL1 G1/G2 variants associate with CKD in African Americans by unknown mechanisms, but we have reported an association with hemolysis in SCA as reflected by hemoglobinuria. Thus, this genetic profile appears to highlight a hemolytic risk pathway for sickle cell nephropathy.
Supplementary Material
Footnotes
Funding: the project described was supported by the National Institutes of Health through grants K23HL125984 (S.L.S), R01HL078536 (R.E.M.), R01HL111656 and R01HL127342 (R.F.M.), and K24-DK092290 (J.P.L). The content is solely the responsibility of the authors and does not necessarily represent the official views of the NIH.
Information on authorship, contributions, and financial & other disclosures was provided by the authors and is available with the online version of this article at www.haematologica.org.
References
- 1.Modell B, Darlison M. Global epidemiology of haemoglobin disorders and derived service indicators. Bull World Health Organ. 2008;86(6):480–487. [DOI] [PMC free article] [PubMed] [Google Scholar]
- 2.Saraf SL, Zhang X, Kanias T, et al. Haemoglobinuria is associated with chronic kidney disease and its progression in patients with sickle cell anaemia. Br J Haematol. 2014;164(5):729–739. [DOI] [PMC free article] [PubMed] [Google Scholar]
- 3.Darbari DS, Wang Z, Kwak M, et al. Severe painful vaso-occlusive crises and mortality in a contemporary adult sickle cell anemia cohort study. PLoS One. 2013;8(11):e79923. [DOI] [PMC free article] [PubMed] [Google Scholar]
- 4.Parsa A, Kao WH, Xie D, et al. APOL1 risk variants, race, and progression of chronic kidney disease. N Engl J Med. 2013;369(23):2183–2196. [DOI] [PMC free article] [PubMed] [Google Scholar]
- 5.Ashley-Koch AE, Okocha EC, Garrett ME, et al. MYH9 and APOL1 are both associated with sickle cell disease nephropathy. Br J Haematol. 2011;155(3):386–394. [DOI] [PMC free article] [PubMed] [Google Scholar]
- 6.Saraf SL, Zhang X, Shah B, et al. Genetic variants and cell-free hemoglobin processing in sickle cell nephropathy. Haematologica. 2015;100(10):1275–1284. [DOI] [PMC free article] [PubMed] [Google Scholar]
- 7.Higgs DR, Aldridge BE, Lamb J, et al. The interaction of alpha-thalassemia and homozygous sickle-cell disease. N Engl J Med. 1982;306(24):1441–1446. [DOI] [PubMed] [Google Scholar]
- 8.Guasch A, Zayas CF, Eckman JR, Muralidharan K, Zhang W, Elsas LJ. Evidence that microdeletions in the alpha globin gene protect against the development of sickle cell glomerulopathy in humans. J Am Soc Nephrol. 1999;10(5):1014–1019. [DOI] [PubMed] [Google Scholar]
- 9.Bauer DE, Kamran SC, Lessard S, et al. An erythroid enhancer of BCL11A subject to genetic variation determines fetal hemoglobin level. Science. 2013;342(6155):253–257. [DOI] [PMC free article] [PubMed] [Google Scholar]
- 10.Sheehan VA, Luo Z, Flanagan JM, et al. Genetic modifiers of sickle cell anemia in the BABY HUG cohort: influence on laboratory and clinical phenotypes. Am J Hematol. 2013;88(7):571–576. [DOI] [PubMed] [Google Scholar]
- 11.Lettre G, Sankaran VG, Bezerra MA, et al. DNA polymorphisms at the BCL11A, HBS1L-MYB, and beta-globin loci associate with fetal hemoglobin levels and pain crises in sickle cell disease. Proc Natl Acad Sci U S A. 2008;105(33):11869–11874. [DOI] [PMC free article] [PubMed] [Google Scholar]
- 12.Levey AS, Stevens LA, Schmid CH, et al. A new equation to estimate glomerular filtration rate. Ann Intern Med. 2009;150(9):604–612. [DOI] [PMC free article] [PubMed] [Google Scholar]
- 13.Haymann JP, Stankovic K, Levy P, et al. Glomerular hyperfiltration in adult sickle cell anemia: a frequent hemolysis associated feature. Clin J Am Soc Nephrol. 2010;5(5):756–761. [DOI] [PMC free article] [PubMed] [Google Scholar]
- 14.Kidd JL, Azimi M, Lubin B, Vichinsky E, Hoppe C. Application of an expanded multiplex genotyping assay for the simultaneous detection of Hemoglobin Constant Spring and common deletional alpha-thalassemia mutations. Int J Lab Hematol. 2010;32(4):373–380. [DOI] [PubMed] [Google Scholar]
Associated Data
This section collects any data citations, data availability statements, or supplementary materials included in this article.


