

Abstract
The glycine-binding site of the N-methyl-D-aspartate receptor (NMDAR) subunit GluN1 is a potential pharmacological target for neurodegenerative disorders. A novel combinatorial ensemble docking scheme using ligand and protein conformation ensembles and customized support vector machine (SVM)-based models to select the docked pose and to predict the docking score was generated for predicting the NMDAR GluN1-ligand binding affinity. The predicted root mean square deviation (RMSD) values in pose by SVM-Pose models were found to be in good agreement with the observed values (n = 30, r2 = 0.928–0.988,  = 0.894–0.954, RMSE = 0.002–0.412, s = 0.001–0.214), and the predicted pKi values by SVM-Score were found to be in good agreement with the observed values for the training samples (n = 24, r2 = 0.967,
  = 0.899, RMSE = 0.295, s = 0.170) and test samples (n = 13, q2 = 0.894, RMSE = 0.437, s = 0.202). When subjected to various statistical validations, the developed SVM-Pose and SVM-Score models consistently met the most stringent criteria. A mock test asserted the predictivity of this novel docking scheme. Collectively, this accurate novel combinatorial ensemble docking scheme can be used to predict the NMDAR GluN1-ligand binding affinity for facilitating drug discovery.
N-methyl-D-aspartate receptors (NMDARs), which are family members of ionotropic glutamate receptors (iGluRs), are expressed in the central nervous system (CNS) and play critical roles in a variety of physiological processes, such as neuronal development, synaptic plasticity, learning, memory, and motor function1,2. Moreover, it has been reported that NMDARs are profoundly implicated in various neurodegenerative disorders, such as Parkinson’s disease (PD), Alzheimer’s disease (AD), Schizophrenia, pain, and depression, and have been proposed as putative therapeutic targets in treating neurodegenerative illness3.
NMDARs are heteromeric assemblies of GluN1, GluN2, and GluN3 subunits, which were previously named as NR1, NR2, and NR3, respectively4. Four GluN2 isoforms (GluN2A-D) and two GluN3 isoforms (GluN3A and GluN3B) have also been identified. NMDARs form tetrameric complexes in vivo that consist of two GluN1 subunits and two GluN2 subunits or two GluN1 subunits and two GluN3 subunits5. Different subunits and, consequently, different subunit compositions have distinct biophysical, pharmacological, and signaling properties6.
In addition to therapeutic agents that can interact with NMDARs at the glycine and glutamate binding sites, channel blockers and positive allosteric modulators (PAMs) or negative allosteric modulators (NAMs)7,8 can also modulate NMDAR activity. The complexity in subunit combinations leads to diverse physiological functions as well as their roles in neurological diseases9. For instance, the binding affinity of NMDA antagonist ifenprodil at GluN1/GluN2A is about 400-fold lower than at GluN1/GluN2B10. Of various subunits and their combinations, glycine can bind to GluN1 and GluN3 subunits11,12 with pharmacological and structural differences in both binding sites13,14. More importantly, it has been suggested that the glycine binding site of GluN1 is a potential pharmacological target for treating PD, schizophrenia, traumatic brain injury, and anxiety15,16,17,18.
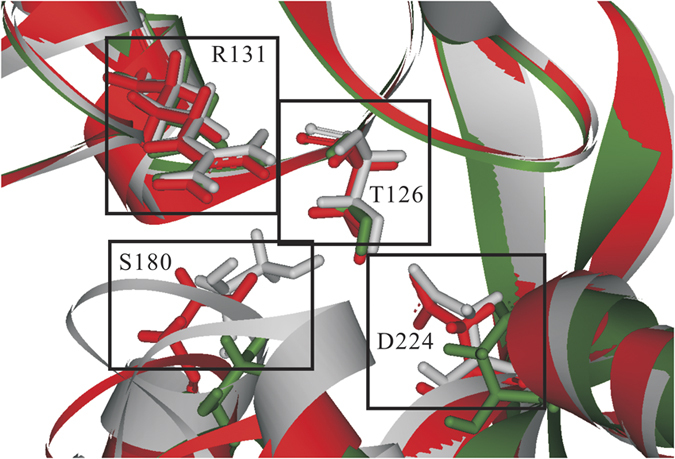
Numerous docking studies have been previously performed based on a single (crystal or homology) protein structure19,20,21,22,23,24,25,26. Nevertheless, NMDARs are highly flexible per se as illustrated by published crystal structures, namely GluN1 in co-complexes with glycine (PDB code: 1PB7), 5,7-dichlorokynurenic acid (DCKA) (PDB code: 1PBQ), and cycloleucine (PDB code: 1Y1M)27,28. When superimposed, these proteins show substantial structural discrepancies as displayed by Fig. 1, in which protein structures excerpted from co-complex structures were aligned, especially residues Thr126, Arg131, Ser180, and Asp224 that constitute the putative binding pocket and contribute to the plastic nature of GluN1. This is completely consistent with dynamic stimulations29,30. In addition to substantial conformation change, the promiscuous nature of the GluN1 glycine binding site can also be manifested by its substantial variations in the size of binding pocket bound with structurally distinct ligands. For example, the binding pocket volume of the glycine-bound GluN1 (PDB code: 1PB7) is about 93.26 Å3 as calculated by the CASTp package (available at http://sts-fw.bioengr.uic.edu/castp/calculation.php) using a 1.4 Å probe, whereas that of DCKA-bound GluN1 (PDB code: 1PBQ) is about 198.56 Å3, yielding a 112% increase in volume. More complexity can be added because GluN1 can undergo conformational change upon binding with a ligand31,32.
Figure 1. The superposition of proteins in various co-complex structures (PDB code: 1PB7, chain B of 1PBQ, chain A of 1Y1M), which are color-coded as gray, green, and red, respectively.
As such, the plastic nature of GluN1 cannot be fully addressed by a single GluN1 structure to accurately model the protein-ligand interaction except molecular dynamics that, in turn, will be less practically useful due to its low computational throughput33. Conversely, ensemble docking, which is carried out by placing a ligand into several target structures and selecting the best fit pose by score or root mean square deviation (RMSD) values if applicable34, seems to be a plausible alternative since it has been demonstrated that ensemble docking performs better than docking with a single protein structure35.
Most docking calculations are carried out using a single ligand conformation, despite that ligands can be flexibly docked. However, it has been demonstrated that the ligand initial conformation plays a significant role in docking accuracy, suggesting that it is necessary to search for a number of stable ligand conformations prior to docking36. In other words, the ligand ensemble docking approach should be adopted by which an ensemble of ligand conformations is generated and then each conformer is docked to the binding pocket37.
The combination of ligand and protein conformations results into a combinatorial ensemble docking that can yield a great number of poses, leading to a serious challenge to select the best fit pose. Since, normally, (ensemble) docking relies on a single scoring function to select or to rank the best pose that shows the lowest RMSD from the bound ligand structure, viz. the native binding pose, among all produced docked poses. Nonetheless, even an accurate scoring function cannot satisfactorily select or rank the best pose38. It can be attributed to the fact that RMSDs in pose do not always well correlate with scores given by a scoring function39,40,41,42.
As such, substantial efforts have been devoted to the development of novel schemes to select the best docked pose. For instance, it has been proposed to select the best pose by the consensus scoring scheme (vide infra) instead of a single scoring function43. In fact, it has been demonstrated by numerous studies that consensus scoring schemes could perform better than single scoring functions44,45. Of various versions of consensus scoring46, the most prevalent ones are rank-by-number, rank-by-rank, and rank-by-vote47 by which the docked poses are re-ranked by averaging (or summing) the scores with a panel of scoring functions, by the averaged rankings based on various scoring functions, and by the final scores based on ranking votes gathered from various scoring functions, respectively40,48,49.
Nevertheless, there are a number of critical issues associated with consensus scoring, namely different numerical spans and units given by various scoring functions, different genres of scoring functions (vide infra), and linear combinations of consensus scoring functions47. Those problems seemingly can be resolved by machine learning (ML) schemes, which can establish a nonlinear relationship between input and output variables. In fact, it has been demonstrated that a scoring function developed by an artificial neural network (ANN) performed better than the conventional linear consensus scoring functions50. Of various ML schemes51, support vector machine (SVM), which was invented by Vapnik et al. in 199552 and has been extensively applied to a broad range of studies53,54,55, performs better than any other ML techniques, such as ANN, genetic algorithm (GA), and random forest (RF) as demonstrated by empirical studies56,57, suggesting that an SVM-based model can actually perform better than any other ML-based schemes in selecting/ranking docked poses.
The selected docked poses are subjected to further evaluations by a scoring function, which is a mathematical model to produce scores that represent the ligand-protein binding affinities and detailed description of scoring function can be explained elsewhere58. Scoring functions can be basically categorized into knowledge-based, empirical, and force field-based types59. Force field-based scoring functions are parameterized based on the potential energy functions and parameters deduced from quantum mechanical calculations and experimental data. The binding free energy in the empirical scoring function is calculated by summing all contributions from various empirical energy terms with different weights to linearly fit the binding affinities of a set of protein-ligand complexes. Knowledge-based scoring functions are based on atomic interaction free energy parameters derived from the observed frequencies of interacting atom-atom contacts in protein-ligand complexes via a procedure based on statistical mechanics.
It is normally assumed that scores produced by scoring functions are linearly correlated with the experimentally determined binding affinities of the protein–ligand complexes of known 3D structures. However, such assumption is not always true59. Consensus scoring proposed by Charifson et al. was purported to remedy such problems by linearly combining scoring functions to predict the ligand-protein binding affinity60. In fact, it has been demonstrated that consensus scoring functions indeed perform better than single scoring functions61,62. Conversely, it is exceptionally difficult, if not completely impossible, to observe a linear relationship between binding affinities and scores yielded by scoring functions or consensus scoring functions, even though assorted variations, including combinations of different classes of scoring functions, have been proposed. This is mainly due to the nonlinear additive nature of the non-covalent interactions used to construct a scoring function63 as demonstrated by the fact that the correlation coefficients between scores and binding affinities are often no more than 0.542.
As such, nonlinear approaches such as ML-based scheme seem to be better alternatives as compared with their linear counterparts64. For example, ANN, RF, and SVM have been adopted by Betzi et al.50, Li et al.65, and Zilian and Sotriffer66 to develop GFscore, ID-Score, and SFCscoreRF, respectively; which unequivocally performed better than single and consensus scoring functions. In addition, it has been demonstrated that a customized SVM scoring function for a specific target can even execute better63,67,68.
Accordingly, it is plausibly to expect that a docking study, in which the docked poses and docking scores are selected and calculated by customized SVM models for a specific target, should perform extremely well. In addition, it is generally believed that the more training samples, the better a predictive model. As such, better customized SVM-Pose and SVM-Score models can be yielded once there are more ligand-protein co-complex structures with the corresponding binding affinities that, in turn, will require ensemble docking69. The objective of this study was to accurately model the ligand binding to the NMDAR subunit GluN1 by this novel SVM-Pose/SVM-Score combinatorial ensemble docking scheme to facilitate drug discovery to find novel therapeutics for the potential treatment of neurological disorder.
Materials and Methods
Protein preparation
Of published NMDA GluN1 structures27,28,70,71,72,73,74, seven protein structures with PDB codes 1PB7, 1PB8, 1PB9, 1PBQ, 1Y1M, 1Y1Z, and 1Y20 (co-complexes with, respectively, glycine, D-serine, D-cycloserine, DCKA, cyclo-leucine, 1-aminocyclobutane-1-carboxylic acid (ACBC), and 1-aminocyclopropane-1-carboxylic acid (ACPC)) were adopted because of their consistency with the assay system to determine Ki values that is of critical importance to scoring function development (vide infra).
Initially, water molecules were removed and hydrogen atoms were added using the Macromolecule preparation protocol in Discovery Studio (Accelrys, San Diego, CA). Each protein structure was subjected to energy relaxation to remove the clashes among atoms75 using the steepest descent (SD) method with the selection of AMBER force field76 until the gradient was smaller than 0.3 with respect to the previous optimization step. The binding pocket residues of every protein structure were initially searched by LigPlot77 and the volume of binding pocket was then computed by CASTp using the key residuals, namely Phe92, Pro124, Leu125, Thr126, Arg131, Ser179, Ser180, Val181, Trp223, Asp224, and Phe250.
Ligand preparation
To construct a non-redundant ligand conformation ensemble, each ligand was subjected to conformational search to generate the low-energy conformations using mixed Monte Carlo multiple minimum (MCMM)78/low mode79 implemented in the MacroModel package (Schrödinger, Portland, OR). The energy minimization was carried out by the truncated-Newton conjugated gradient method (TNCG) with the selection of MMFFs force field80. The most stable 10 unique structures were selected for initial docking conformers.
Ensemble docking
Docking calculations were carried out using the GOLD package (Cambridge Crystallographic Data Centre, Cambridge, UK) because of its excellent performance in the case of NMDA GluN181. GOLD is a stochastic system based on GA to flexibly dock ligand into the binding pocket of target protein. The docked results are evaluated by a fitness function, which is comprised of van der Waals, hydrogen bond, and internal interactions. In each docking calculation, Gold performs a number of independent docking runs and generates numerous poses. Three poses were selected in each run by their fitness values. The ensemble docking was carried out by docking each ligand conformer into the selected crystal structures by Gold and each ligand was docked 10 times to possibly eliminate any random bias.
SVM-Pose
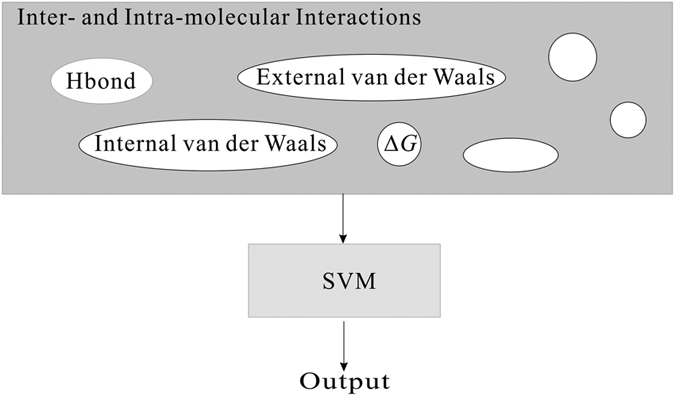
Figure 2 schematically represents the architecture of SVM-Pose. Each SVM-Pose model was derived from each crystal structure based on 30 docked poses, and seven customized SVM-Pose models were built. The inter- and intra-molecular interactions associated with the docked poses, which were evaluated by the scoring functions GoldScore82, ChemScore83, LigScore1, LigScore284, Piecewise Linear Potential 1 (PLP1), PLP285, Jain86, Potential of Mean Force (PMF)87, and PMF488, were treated as the independent variables, viz. the SVM input, and the corresponding RMSD values between docked and native binding poses were treated as the dependent variables, viz. the SVM output.
Figure 2. Schematic presentation of SVM-Pose architecture.
The model development and verification were carried out using the modules svm-train and svm-predict implemented in the SVM package LIBSVM (software available at http://www.csie.ntu.edu.tw/~cjlin/libsvm). The runtime parameters, namely regression modes ε-SVR and ν-SVR, the associated ε and ν, cost C, and the width of the radial basis function (RBF) kernel γ, were systemically scanned in a parallel fashion using an in-house Perl script.
SVM-Score
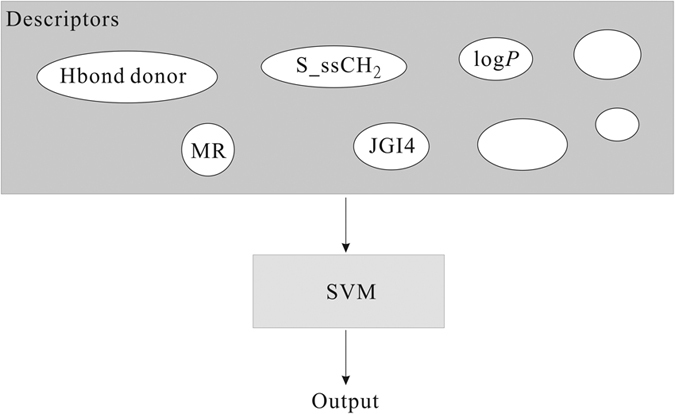
The selected poses were further employed to develop SVM-Score, whose architecture is displayed in Fig. 3. There were only 7 bound ligands in the co-complex crystal structures available and their chemical structures are not dissimilar, which, in turn, will severely restrict the applicability of a developed model. Such limitations can be eased once more samples with more dissimilar structures are added to the collection and a better predictive model can be developed89. To further expand the training sample collection, a comprehensive literature search was carried out to retrieve the compounds, whose Ki values were also assayed by the same conditions for the bound ligands in the crystal structures. An additional 30 molecules were adopted after carefully scrutinizing the collected ligands to maintain structural clarity since compounds with different chirality can exert different binding affinities90.
Figure 3. Schematic presentation of SVM-Score architecture.
The 30 unbound compounds were subjected to ensemble docking through the use of the same procedure previously described. Of all generated poses (7 protein structures × 10 ligand conformers × 3 produced poses from each docking calculation), only the one with the lowest predicted RMSD in pose was selected. The top-most docked poses for the 30 unbound and 7 bound molecules were divided into two groups, namely the training set and test set, to build the predictive model and to verify the developed model using the Kennard-Stone (KS) algorithm91 implemented in MATLAB (The Mathworks, Natick, MA) with a ca. 2:1 ratio. The Ki values of training samples spanned 7 orders of magnitude.
It has been shown that the adoption of more descriptors can significantly improve the performance of scoring functions in addition to protein-ligand empirical interactions65,66. Thus, Discovery Studio (Accelrys, San Diego, CA) and E-Dragon (available at the Website http://www.vcclab.org/lab/edragon/) were employed to generate more than 3000 more molecular descriptors. Descriptors were preprocessed by eliminating those missing for at least one compound or showing little or no discrimination against all training samples, followed by discarding those with intercorrelation values of r2 ≥ 0.64 to reduce the probability of spurious correlations92. In addition, descriptors were subjected to normalization by centering at the mean value and dividing by the standard deviation93.
The descriptor selection was initially carried out by genetic function algorithm (GFA) using the QSAR module of Discovery Studio because of its effectiveness and efficiency94. A further selection was executed by the recursive feature elimination (RFE)95 method to remove relatively unimportant descriptors. The selected descriptors, along with the intra- and inter-molecular interactions implemented in the scoring functions, were treated as the input of SVM-Score and the associated pKi values served as output. The SVM calculations were carried out as previously mentioned.
Predictive evaluation
The derived models were evaluated by the parameters, namely correlation coefficients r2 and q2 in the training set and external set, respectively. The correlation coefficient of 10-fold cross validation  in the training set, the correlation coefficients
  ,
,  , and
, and  and concordance correlation coefficient (CCC) in the external set, various modified versions of r2, the residual Δi, the root mean square error (RMSE), and the mean absolute error (MAE) (Table S1) for quantitative evaluation.
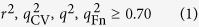
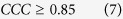
An in silico model can be considered as quantitatively predictive if it can meet the most stringent criteria proposed by Golbraikh et al.96, Ojha et al.97, Roy et al.98, and Chirico and Gramatica99,
 |
 |
 |
 |
 |
 |
 |
where r in equations (3),(4),(5),(6) represent the parameters r and q in the training set and external set, respectively.
Furthermore, the confusion matrix (Table S2) was constructed to calculate the Cooper statistics100, namely sensitivity, specificity, accuracy, and Matthews correlation coefficient, and Kubat’s G-mean101 (Table S3) to qualitatively assess a predictive model.
Results
Ensemble Docking
The docking calculations carried out by Gold are in excellent agreement with crystal structures as manifested by their small average RMSD values (Fig. 4), which displays the box plot of the RMSD minimum, maximum, mean, and standard deviation. For instance, the docking calculations based on the 5,7-DCKA bound crystal structure (PDB: chain B of 1PBQ) yielded RMSD values between 0.2 Å to 0.6 Å and an average RMSD of 0.43 Å for the 30 docked poses after 10 docking runs. Collectively, the average RMSD value of the 7 co-complex structures is 0.35 Å, which is much smaller than the threshold 2 Å as suggested102,103, indicating that Gold is suitable for this investigation since the bound ligand structures are highly reproducible by Gold.
Figure 4. Box plot showing the RMSD values in pose using different native protein structures.
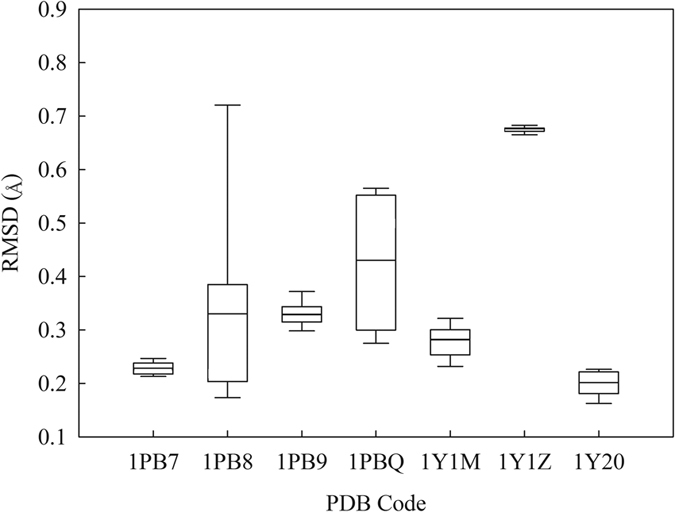
Boxes represent the mean ± standard deviation, lines depict the median values, and whiskers denote the minimum and maximum values.
SVM-Pose
Seven SVM-Pose models, denoted by SVM-Pose1PB7, SVM-Pose1PB8, SVM-Pose1PB9, SVM-Pose1PBQ, SVM-Pose1Y1M, SVM-Pose1Y1Z, and SVM-Pose1Y20, were developed for the co-complex protein structures (PDB codes: 1PB7, 1PB8, 1PB9, 1PBQ, 1Y1M, 1Y1Z, 1Y20). Tables S4 and S5 list the optimal runtime conditions as well as the selected intra- and inter-molecular interactions excerpted from various scoring functions, respectively. Table S6 lists the predicted RMSD values in pose by 7 SVM-Pose models. Table 1 summarizes their associated statistical evaluations and validation requirements.
Table 1. Statistic evaluations and validation of SVM-Pose.
| SVM-Pose |
|||||||
|---|---|---|---|---|---|---|---|
| 1PB7 | 1PB8 | 1PB9 | 1PBQ | 1Y1M | 1Y1Z | 1Y20 | |
| r2 | 0.98 | 0.99 | 0.97 | 0.94 | 0.98 | 0.98 | 0.93 |
| ΔMax | 0.00 | 0.09 | 0.42 | 0.14 | 0.49 | 0.49 | 0.57 |
| MAE | 0.00 | 0.02 | 0.19 | 0.02 | 0.17 | 0.37 | 0.14 |
| s | 0.00 | 0.02 | 0.12 | 0.03 | 0.16 | 0.18 | 0.21 |
| RMSE | 0.00 | 0.02 | 0.22 | 0.03 | 0.23 | 0.41 | 0.25 |
 |
0.89 | 0.95 | 0.93 | 0.91 | 0.91 | 0.91 | 0.90 |
 |
0.98 | 0.99 | 0.97 | 0.93 | 0.97 | 0.97 | 0.92 |
| k | 1.00 | 0.99 | 1.00 | 0.98 | 0.99 | 1.00 | 0.99 |
 |
0.97 | 0.99 | 0.97 | 0.92 | 0.97 | 0.97 | 0.91 |
 |
0.96 | 0.97 | 0.94 | 0.90 | 0.94 | 0.96 | 0.86 |
 |
0.94 | 0.97 | 0.91 | 0.83 | 0.93 | 0.93 | 0.79 |
 |
0.95 | 0.97 | 0.92 | 0.86 | 0.83 | 0.94 | 0.83 |
 |
0.02 | 0.00 | 0.03 | 0.07 | 0.01 | 0.03 | 0.07 |
| Eq. (1) | x | x | x | x | x | x | x |
| Eq. (2) | x | x | x | x | x | x | x |
| Eq. (3) | x | x | x | x | x | x | x |
| Eq. (4) | x | x | x | x | x | x | x |
| Eq. (5) | x | x | x | x | x | x | x |
| Eq. (6) | x | x | x | x | x | x | x |
Statistic evaluations of SVM-Score models, namely correlation coefficient (r2), 10-fold cross-validation correlation coefficient ( ), maximal absolute residual (ΔMax), mean absolute error (MAE), standard deviation (s), and RMSE as well as validation.
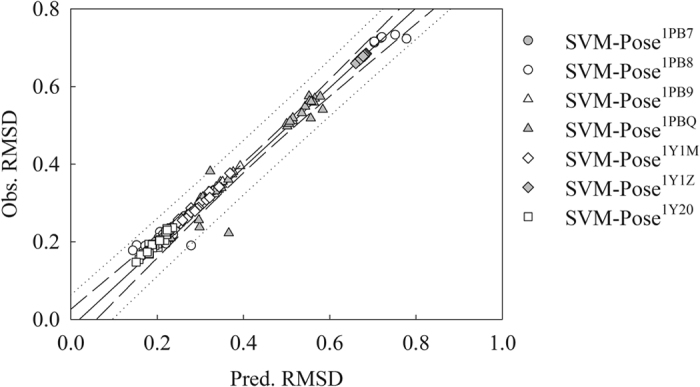
The predicted RMSD values by the seven SVM-Pose models are in excellent agreement with observed values when applied to the protein structures that the predictive models were developed. Figure 5 displays the scatter plot of observed vs. predicted RMSD values by SVM-Pose models. For instance, they produced r2 values of more than 0.90 and s values of less than 0.25 (Table 1). In addition, they yielded almost negligible differences between r2 and  (no more than 0.10), suggesting that they were not statistically over-trained per se104.
Figure 5. Observed RMSD versus the RMSD predicted by 7 SVM-Pose models, namely SVM-Pose1PB7 (gray circle), SVM-Pose1PB8 (open circle), SVM-Pose1PB9 (open triangle), SVM-Pose1PBQ (gray triangle), SVM-Pose1Y1M (open diamond), SVM-Pose1Y1Z (gray diamond), SVM-Pose1Y20 (open square) and the ideal regression line.
The predictivity of generated SVM-Pose models were further assessed by the validation requirements proposed by Golbraikh et al.96, Ojha et al.97, Roy et al.98, and Chirico and Gramatica99. It can be found from Table 1, which summarizes the validation results, that the SVM-Pose models not only produced significant statistical values but also fulfilled all validation requirements. For instance, SVM-Pose1PBQ produced an  value of 0.86 and a
  value of 0.07. Thus, it can be concluded that these theoretical models are highly accurate and predictive.
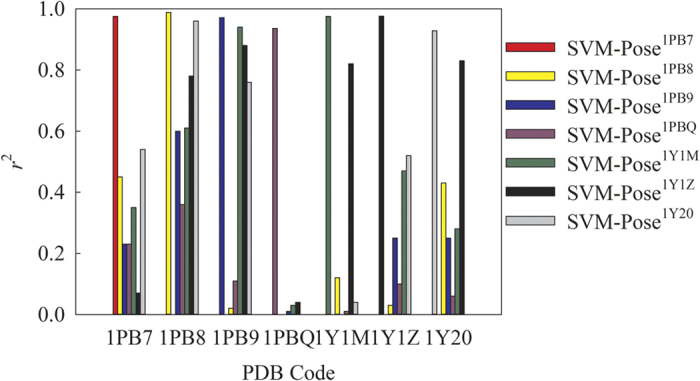
Nevertheless, the seven SVM-Pose models unequivocally showed deteriorated performances once applied to the other protein structures from which the SVM-Pose models were not derived, viz. non-native structures. Figure 6 displays the r2 values between predicted vs. observed RMSD values in pose by the 7 SVM-Pose models when applied to the 7 co-complex structures. For instance, SVM-Pose1PB8 developed from the co-complex structure with the PDB code 1PB8 gave rise to the highest r2 value when applied to its native protein structure with an r2 value of 0.99. Conversely, it gave rise to the r2 values of no more than 0.50 once it was applied to the other protein structures. The substantial performance discrepancies by the seven SVM-Pose models suggest that no single SVM-Pose model can consistently perform well for all of 7 protein structures. It is necessary to develop a customized model to predict RMSDs in pose for each individual protein conformation. Consequently, it is plausible to expect that poor pose selections can be yielded in the ensemble docking if the pose selection only relies on a single model.
Figure 6. The correlation coefficient (r2) between predicted and observed RMSD in pose by 7 SVM-Pose models in 7 co-complex structures.
SVM-Score
Of 7 bound ligands and 30 unbound ligands included in the SVM-Score development, 24 and 13 molecules were randomly assigned to the training set and test set, respectively. Figure S1 shows the projection of all molecules enrolled in this investigation in chemical space, spanned by the first three principal components (PCs), explaining 93.9% of the variance in the original data. As displayed, both data sets exhibited high levels of similarity in the chemical space, whereas the bound ligands are positioned themselves far away from the unbound ligands, suggesting the high levels of dissimilarity between bound and unbound ligands that, in turn, can substantially augment the applicability domain (AD) of the derived scoring function. In addition, the high levels of biological and chemical similarity between both data sets can also be illustrated by Fig. S2, which displays the histograms of pKi, molecular weight (MW), surface area, and molecular volume (Vm) in density form for all molecules in the training set and test set, suggesting the unbiased partition of data samples105.
Table S7 lists the predicted pKi values by SVM-Score and Table S4 shows the optimal runtime parameters. It can be observed that the predictions by SVM-Score are in good agreement with observed values for the molecules in the training set and test set as illustrated by Fig. 7, which displays the scatter plot of observed vs. predicted pKi values in both data sets. Table 2 summarizes the statistical evaluations of SVM-Score. It can be found that SVM-Score produced insignificant prediction errors, suggesting that SVM-Score is an acute predictive model. For instance, the s values were only 0.170 and 0.202 in the training set and test set, respectively. Furthermore, SVM-Score gave rise to the high r2, q2, and  values of 0.967, 0.894, and 0.899, respectively, suggesting that SVM-Score is highly predictive. The negligible differences between r2 and q2 (0.073) and between r2 and
  (0.068) unequivocally affirm that SVM was a well-trained model since it will produce at least one substantial difference in cases of overtraining. When subjected to the validation criteria proposed by Golbraikh et al.96, Ojha et al.97, Roy et al.98, and Chirico and Gramatica99 (equations (1),(2),(3),(4),(5),(6),(7)) to gauge the predictivity of a theoretical model, SVM-Score completely fulfilled all statistical validation requirements, indicating its high level of predictivity.
Figure 7. Observed pKi vs. the pKi predicted by SVM-Score for the molecules in the training set (solid circle) and test set (open triangle).
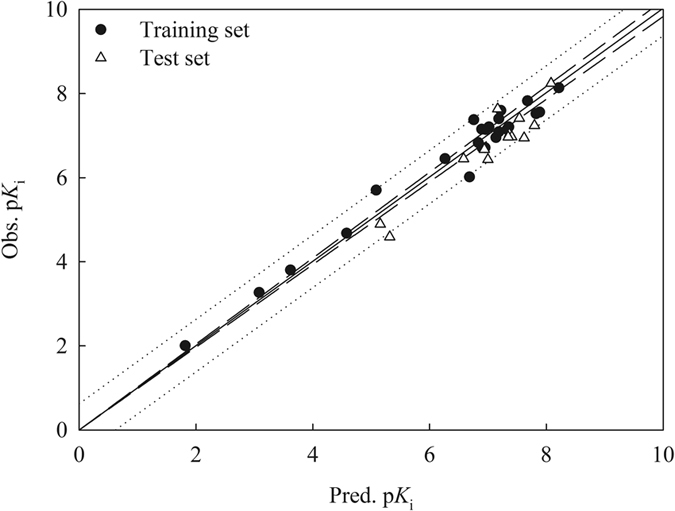
Table 2. Statistic evaluations and validation of SVM-Score.
| Training Set | Test Set | |
|---|---|---|
| n | 24 | 13 |
| r2, q2 | 0.967 | 0.894 |
 |
0.899 | N/A† |
| ΔMax | 0.667 | 0.729 |
| MAE | 0.244 | 0.391 |
| s | 0.170 | 0.202 |
| RMSE | 0.295 | 0.437 |
| Eq. (1) | x | x |
| Eq. (2) | x | N/A† |
| Eq. (3) | x | N/A |
| Eq. (4) | x | x |
| Eq. (5) | x | x |
| Eq. (6) | x | x |
| Eq. (7) | N/A | x |
†Not applicable.
Statistic evaluations of SVM-Score, namely correlation coefficients (r2 and q2), 10-fold cross-validation correlation coefficient ( ), maximal absolute residual (ΔMax), mean absolute error (MAE), standard deviation (s), and RMSE as well as validation in the training set and test set.
Table 3 lists all of interactions and descriptors selected to develop SVM-Score. In addition to the inter- and intra-molecular interactions excerpted from ChemScore, a number of descriptors were purported to augment the protein-ligand interactions. For instance, it has been found by Furukawa and Gouaux that hydrogen bond interactions play an important role in NMDA-ligand interactions27. The descriptor number of hydrogen-bond donor (HBD) was selected because of an r value of 0.782 between HBD and Chemscore.Hbond (Table S8). More importantly, scoring functions with the selection of HBD performed better than those with the selection of Chemscore.Hbond (data not shown).
Table 3. Selected descriptors for SVM-Score.
| Descriptor | Description |
|---|---|
| S(vdw_ext) | External protein-ligand vdw contribution to GoldScore value |
| S(vdw_int) | Internal ligand vdw contribution to GoldScore value |
| HBD | Number of hydrogen-bond donor groups. |
| Atype_N_75 | N in R–N–R or R–N–X |
| CIC1 | Complementary information content index (neighborhood symmetry of 1-order) |
| CC | Count of the number of chiral centers (R or S) present in a molecule |
| JGI4 | Mean topological charge index of order 4 |
| CIC1 | Complementary information content index (neighborhood symmetry of 1-order) |
| S_ssCH2 | Sum descriptor for carbon with two single bonds. |
| Atype_N_75 | N in R–N–R or R–N–X |
| HATS6u | Leverage-weighted autocorrelation of lag 6/unweighted |
Descriptors selected as the input of SVM-Score and their descriptions.
Conversely, it seems unusual that the number of hydrogen-bond acceptor (HBA) was not selected since HBD and HBA play a significant role in NMDA-ligand interaction106. It can be observed that the pKi values increased with increasing HBA as illustrated by Fig. S3. The absence of HBA can be attributed to the selected descriptor Atype_N_75, which describes specific types of nitrogen atom. It correlated with HBA well with an r value of 0.881 for the bound ligands. Conversely, this dependency was not observed for the unbound ligands (Table S8). As such, it is plausible to replace HBA by Atype_N_75 since the developed scoring functions with the selection of Atype_N_75 executed better than those with the selection of HBA (data not shown).
In addition, it has been found by Di Fabio et al. that the descriptor MRomp, which describes the total molar refractivity of substituents at ortho, meta, and para positions, was closely related to the NMDA-ligand binding affinity at the glycine binding site107. The adopted descriptor CIC1 was strongly correlated with MR with an r value of 0.800 (Table S8), suggesting that it is plausible to replace MR by CIC1 to describe such protein-ligand interaction.
It is of interest to observe that the dependence of the descriptor CC, which counts the number of chiral centers within a molecule, can be varied by chemotypes. More specifically, the bound ligands barely showed any relationship between CC and pKi as manifested by its almost negligible r value (0.056), whereas the CC values of the unbound ligands were inversely correlated with pKi (−0.622) (Table S8), suggesting that both types of ligands interact with proteins differently.
A number of Dragon descriptors were selected in this study. It is normally not straightforward to interpret Dragon descriptors. Nevertheless, it can be empirically observed that the descriptor JGI4, which is a topological charge index to measure the charge transfers between atom pairs108, was highly correlated to the pKi values for the molecules with the acetylenic aromatic moiety with an r value of 0.794. This was merely 0.264 for the others (Table S8), suggesting that the molecular charge distribution plays a profound role in the NMDA-acetylenic aromatic interactions109. Additionally, descriptors S_ssCH2 and HATS6u were highly associated with pKi with r values of −0.786 and −0.797, respectively, for the unbound ligands. They were −0.071 and −0.294, respectively, for the others (Table S8), suggesting that it is of necessity to adopt both descriptors to augment the protein-ligand interactions for the unbound ligands.
The selection of Atype_N_75, CC, JGI4, S_ssCH2, and HATS6u to render the interactions between protein and specific types of ligands manifests that nonlinear ML-based models can perform better than their linear counterparts and customized models, in turn, can execute better than their general counterparts. As such, it is plausible to expect that a customized SVM model should deliver outstanding performance in predicting binding affinity.
Mock test
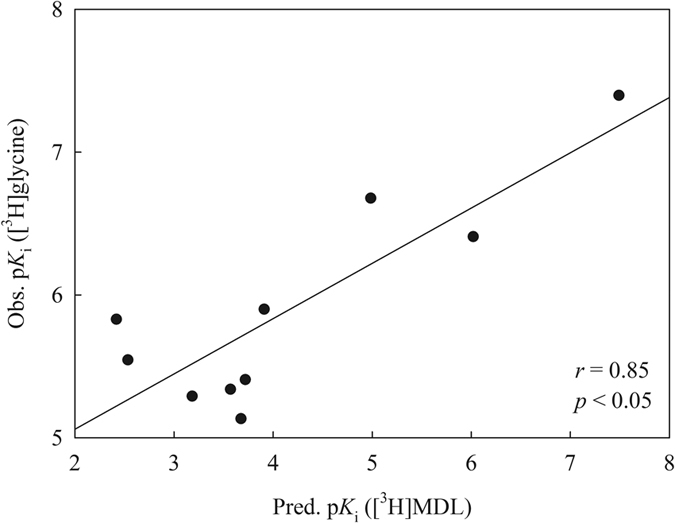
The developed SVM-Pose/SVM-Score combinatorial ensemble docking scheme was further subjected to test by the 10 quinoxalinones and quinazolinones assayed by McQuaid et al.110 to mimic real-world challenges. Nevertheless, these molecules were measured by the radioligand [3H]glycine, whereas all of molecules enrolled in this study were assayed using the radioligand [3H]MDL 105,519. The discrepancy in both systems actually does not pose an unsurmounted barrier since it has been reported by Baron et al. that the pKi values obtained from both systems were highly correlated with an r of 0.90111. Thus, it is plausible to examine the SVM-Pose/SVM-Score combinatorial ensemble docking scheme with the molecules assayed by McQuaid et al. without significant errors.
Table S9 lists the tested results with the 10 molecules and Fig. 8 illustrates the obtained scatter plot. It can be observed that both systems were highly correlated with each other with an r of 0.85. The negligible difference between both parameters (0.90 vs. 0.85) suggests that the predictions by the SVM-Pose/SVM-Score combinatorial ensemble docking scheme can almost reproduce the experimental observations. Thus, this mock test unambiguously affirmed the predictivity of SVM-Pose/SVM-Score combinatorial ensemble docking.
Figure 8. The observed pKi values ([3H]glycine) vs. the predicted pKi values ([3H]MDL) by SVM-Pose/SVM-Score ensemble docking.
Discussion
It is well-established that pose and scoring play a pivotal role in docking59. Most docking studies rely only on a single scoring function to select top docked poses40. The knowledge-based scoring functions PMF and PMF04, the empirical scoring functions PLP, PLP2, LigScore1, and LigScore2, and the force-field scoring function GoldScore produced the r2 values of no more than 0.45 between calculated scores and RMSD values when applied to the 7 co-complex structures. Figure 9 displays the r2 values between RMSD values and scores evaluated by average SVM-Pose and various scoring functions, depicting the poor relationship between both parameters. This can lead to serious problems for pose selection since the scoring functions cannot always give the high scores to the poses with low RMSD values and such inconsistencies, in fact, are not uncommon47,112.
Figure 9. The correlation coefficient (r2) between predicted and observed RMSD by average SVM-Pose and various scoring functions.
Conversely, the average SVM-Pose produced an r2 of 0.90 despite the SVM-Pose models were derived based on the intra- and inter-molecular interactions excerpted from the scoring functions (Table S5). This suggests that the nonlinear relationships between intra-molecular interactions and docked poses as well as between inter-molecular interactions and docked poses. In fact, this is completely consistent with observations made by Feher and Williams113. The superior performance of SMV-Pose models can be plausibly attributed to their outstanding capacity in non-linear regression when compared with the linear counterparts.
It can be argued that the major issue of pose selection is to accurately choose the docked pose with the lowest RMSD, viz. the top-most pose41. In other words, qualitative selection is more important than quantitative predictions of RMSD values. As such, it is of interest to evaluate the qualitative performances of SVM-Pose models and the scoring functions in the top-most pose selections using the Cooper statistics and Kubat’s G-mean (Table S3). Figure 10 presents the results. It can be observed that average SVM-Pose unequivocally performed better than the scoring functions in selecting the top-most poses. Of various scoring functions, PMF yielded the highest sensitivity, specificity, accuracy, and G-mean of ca. 60%, which are much smaller than those produced by average SVM-Pose (ca. 80%). Significant performance discrepancies between SVM-Pose models and the scoring functions occurred because there were only small variations in RMSD among docked poses (Fig. 4). As such, only customized ML-based SVM-Pose models can be sensitive enough to discriminate the top-most pose from the others when compared with their linear counterparts.
Figure 10. Sensitivity, specificity, accuracy, MCC, and G-mean evaluated by average SVM-Pose, SVM-Score, various scoring functions, and various consensus scoring schemes.
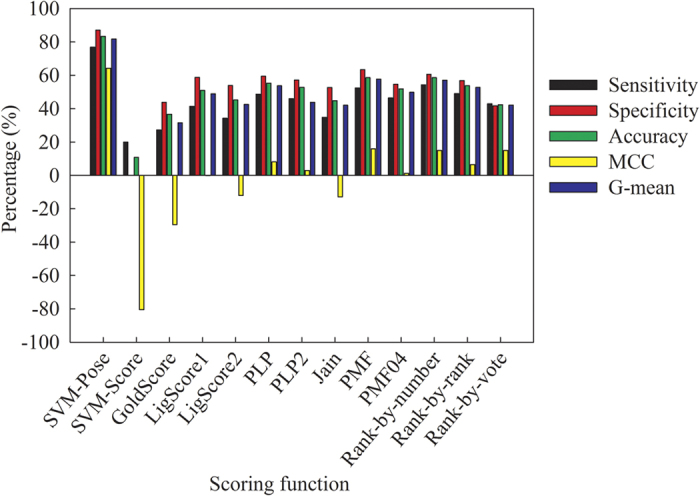
It has been demonstrated that consensus scoring schemes performed better than single scoring functions in selecting the top-most poses44,45. Accordingly, it is of interest to compare the performance of average SVM-Pose with various consensus scoring schemes, namely rank-by-number, rank-by-rank, and rank-by-vote. Figure 10 displays the comparison results. It can be observed that the rank-by-number scheme yielded the highest sensitivity, specificity, accuracy, and G-mean of ca. 60%, suggesting that it performed better than the other two consensuses scoring schemes. Such observations are completely consistent with that made by Wang and Wang43. Nevertheless, little performance differences between the best scoring function and the best consensus scoring scheme, viz. PMF and rank-by-number, can be observed. This indicates that consensus scoring schemes do not always perform better than scoring functions in selecting the top-most poses. The average SVM-Pose still outperformed the 3 consensuses scoring schemes. Thus, it can be asserted that the SVM-based customized models are the best predictors to qualitatively and quantitatively accurately select the top-most poses especially in the case of ensemble docking for which multiple protein conformations are considered.
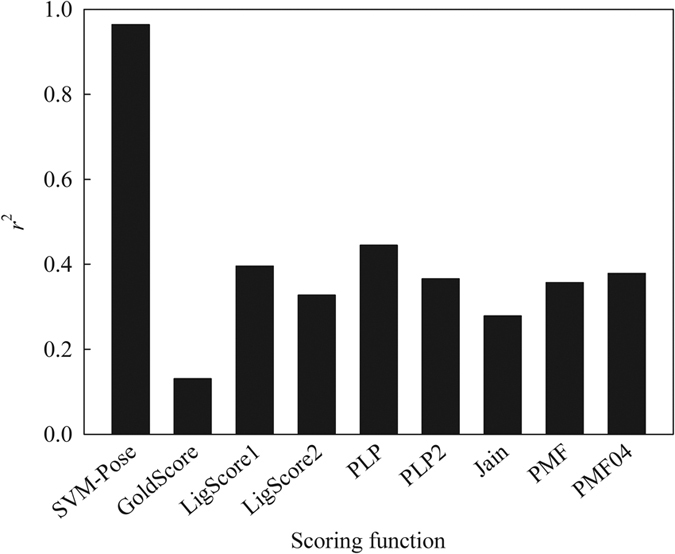
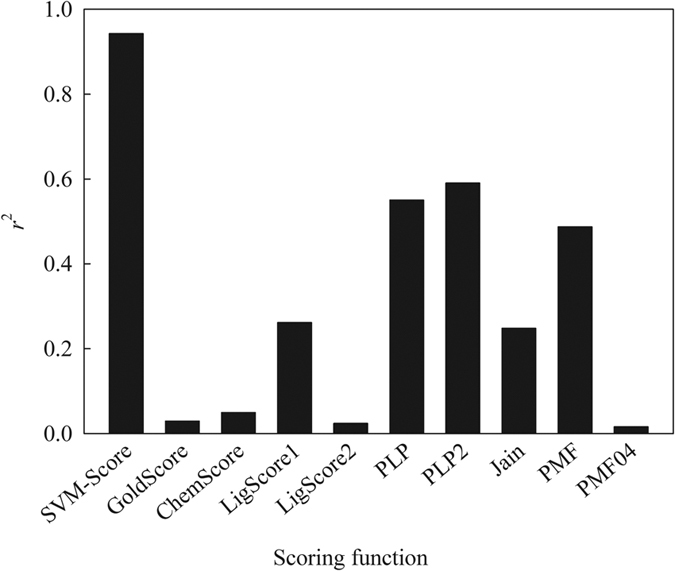
Of the scoring functions selected in this study, PLP1, PLP2, and PMF yielded the highest r2 values of ca. 0.60 between predicted scores and experimental pKi values when considering all of samples used in this study, viz. training and test samples, as shown in Fig. 11. SVM-Score produced an even higher r2 of 0.97, suggesting that it outperformed the other scoring functions in correlating predicted scores and experimental pKi values. Such substantial performance discrepancies indicate that SVM-Score is a nonlinear ML-based model per se as compared with the other linear scoring functions60. It has been demonstrated that the nonlinear SVM-based scheme can be more appropriate to render the relationship between independent variables, viz. descriptors in this study, and dependent variables, viz. pKi values89. Furthermore, the descriptors adopted by SVM-Score appropriately augment the protein-ligand interactions, which are not otherwise selected by scoring functions.
Figure 11. The correlation coefficient (r2) between predicted scores and pKi values by SVM-Score and various scoring functions.
When applied to selecting top-most poses, SVM-Score did not perform better than any other scoring functions qualitatively (Fig. 10) despite it outperformed the scoring functions in predicting binding affinities. For instance, SVM-Score yielded an MCC value of ca. −80%. Such performance discrepancies suggest that it is inappropriate to adopt a scoring function to select poses. As such, pose selections and binding affinity predictions should be carried out independently114,115.
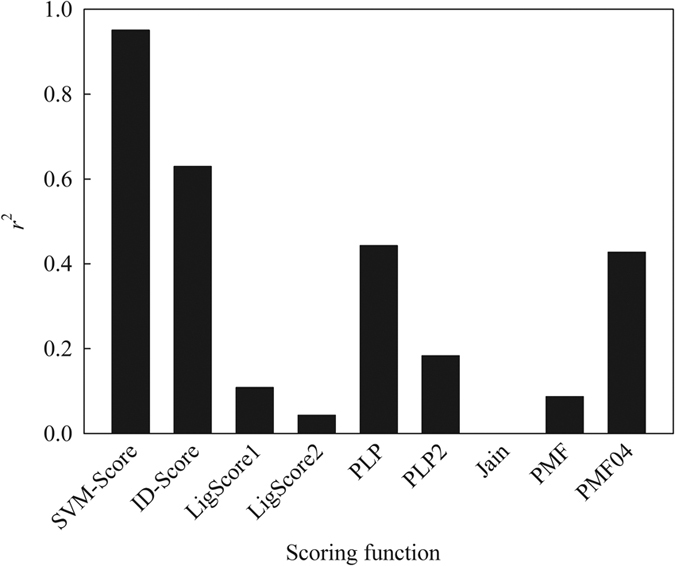
Recently, Li et al. developed an empirical SVM-based ID-Score using various protein-ligand interactions65. Of all co-complex structures adopted by Li et al. for model development, 6 NMDAR crystal structures were also selected. As such, the binding affinities predicted by ID-Score were excerpted from their published data and subjected to further comparisons with SVM-Score and various scoring functions. Figure 12 shows the correlation coefficients between calculated scores and observed pKi values. It can be observed that ID-Score yielded an r2 of 0.63, suggesting that the SVM-based ID-Score performed better than the linear scoring functions. SVM-Score, conversely, gave rise to an r2 of 0.95. The substantial difference in r2 (0.95 vs. 0.63) obviously indicates the superiority of SVM-Score. Thus, it can be concluded that the SVM-based scoring functions perform better than the linear scoring functions and a customized scoring function executes better than the general scoring functions. This is completely consistent with the fact that customized ML-based scoring functions perform better than general linear scoring functions42. Furthermore, SVM performs better than other ML-based schemes, namely ANN, GFA, and RF56,116.
Figure 12. The correlation coefficient (r2) between predicted scores and pKi values by SVM-Score, ID-Score, and various scoring functions based 6 common bound ligands.
Conclusion
The GluN1 ligand-binding domain of N-methyl-D-aspartate receptor is a potential pharmacological target for various types of neurodegenerative illness. A novel combinatorial ensemble docking scheme was derived to predict the NMDA GluN1-ligand binding affinity using the customized SVM-based models to select the poses and to predict the binding affinities. The developed SVM-Pose models quantitatively predicted RMSD values well and qualitatively selected the top-most poses. The built SVM-Score accurately predicted the protein-ligand binding affinities and outperformed any scoring functions and consensus scoring functions. When mock tested by a group of novel molecules to mimic real world challenges, this novel docking scheme executed well. Thus, this novel customized combinatorial ensemble docking scheme is an accurate, predictive, and rapid tool for predicting the NMDAR GluN1-ligand binding affinity to facilitate and expedite the drug discovery and development of novel therapeutics to treat certain neurodegenerative illnesses.
Additional Information
How to cite this article: Leong, M. K. et al. Prediction of N-Methyl-D-Aspartate Receptor GluN1-Ligand Binding Affinity by a Novel SVM-Pose/SVM-Score Combinatorial Ensemble Docking Scheme. Sci. Rep. 7, 40053; doi: 10.1038/srep40053 (2017).
Publisher's note: Springer Nature remains neutral with regard to jurisdictional claims in published maps and institutional affiliations.
Supplementary Material
Acknowledgments
This work was supported by the Ministry of Science and Technology, Taiwan. Parts of calculations were performed at the National Center for High-Performance Computing, Taiwan.
Footnotes
Author Contributions M.K.L., R.G.S., Y.L.D., and C.F.W. conceived and designed the study. M.K.L., R.G.S., and Y.L.D. performed the experiments. M.K.L., R.G.S., Y.L.D., and C.F.W. wrote the manuscript. All authors have reviewed the manuscript.
References
- Cull-Candy S., Brickley S. & Farrant M. NMDA receptor subunits: diversity, development and disease. Curr. Opin. Neurobiol. 11, 327–335, doi: 10.1016/S0959-4388(00)00215-4 (2001). [DOI] [PubMed] [Google Scholar]
- Mosley C. A. et al. Synthesis, structural activity-relationships, and biological evaluation of novel amide-based allosteric binding site antagonists in NR1A/NR2B N-methyl-d-aspartate receptors. Bioorg. Med. Chem. 17, 6463–6480, doi: 10.1016/j.bmc.2009.05.085 (2009). [DOI] [PMC free article] [PubMed] [Google Scholar]
- Santangelo R. M. et al. Novel NMDA receptor modulators: an update. Expert Opin. Ther. Patents 22, 1337–1352, doi: 10.1517/13543776.2012.728587 (2012). [DOI] [PMC free article] [PubMed] [Google Scholar]
- Collingridge G. L., Olsen R. W., Peters J. & Spedding M. A nomenclature for ligand-gated ion channels. Neuropharmacology 56, 2–5, doi: 10.1016/j.neuropharm.2008.06.063 (2009). [DOI] [PMC free article] [PubMed] [Google Scholar]
- Pachernegg S., Strutz-Seebohm N. & Hollmann M. GluN3 subunit-containing NMDA receptors: not just one-trick ponies. Trends Neurosci. 35, 240–249, doi: 10.1016/j.tins.2011.11.010 (2012). [DOI] [PubMed] [Google Scholar]
- Paoletti P., Bellone C. & Zhou Q. NMDA receptor subunit diversity: impact on receptor properties, synaptic plasticity and disease. Nat. Rev. Neurosci. 14, 383–400, doi: 10.1038/nrn3504 (2013). [DOI] [PubMed] [Google Scholar]
- Yi F. et al. Structural Basis for Negative Allosteric Modulation of GluN2A-Containing NMDA Receptors. Neuron 91, 1316–1329, doi: 10.1016/j.neuron.2016.08.014 (2016). [DOI] [PMC free article] [PubMed] [Google Scholar]
- Hackos David H. et al. Positive Allosteric Modulators of GluN2A-Containing NMDARs with Distinct Modes of Action and Impacts on Circuit Function. Neuron 89, 983–999, doi: 10.1016/j.neuron.2016.01.016 (2016). [DOI] [PubMed] [Google Scholar]
- Strong K. L., Jing Y., Prosser A. R., Traynelis S. F. & Liotta D. C. NMDA receptor modulators: an updated patent review (2013–2014). Expert Opin. Ther. Patents 24, 1349–1366, doi: 10.1517/13543776.2014.972938 (2014). [DOI] [PMC free article] [PubMed] [Google Scholar]
- Williams K. Ifenprodil discriminates subtypes of the N-methyl-D-aspartate receptor: selectivity and mechanisms at recombinant heteromeric receptors. Mol. Pharmacol. 44, 851–859 (1993). [PubMed] [Google Scholar]
- Cummings K. A. & Popescu G. K. Protons Potentiate GluN1/GluN3A Currents by Attenuating Their Desensitisation. Sci. Rep. 6, 23344, doi: 10.1038/srep23344 (2016). [DOI] [PMC free article] [PubMed] [Google Scholar]
- Mesic I. et al. The N-terminal domain of the GluN3A subunit determines the efficacy of glycine-activated NMDA receptors. Neuropharmacology 105, 133–141, doi: 10.1016/j.neuropharm.2016.01.014 (2016). [DOI] [PubMed] [Google Scholar]
- Kvist T., Greenwood J. R., Hansen K. B., Traynelis S. F. & Bräuner-Osborne H. Structure-based discovery of antagonists for GluN3-containing N-methyl-d-aspartate receptors. Neuropharmacology 75, 324–336, doi: 10.1016/j.neuropharm.2013.08.003 (2013). [DOI] [PMC free article] [PubMed] [Google Scholar]
- Kvist T. et al. Crystal Structure and Pharmacological Characterization of a Novel N-Methyl-d-aspartate (NMDA) Receptor Antagonist at the GluN1 Glycine Binding Site. J. Biol. Chem. 288, 33124–33135, doi: 10.1074/jbc.M113.480210 (2013). [DOI] [PMC free article] [PubMed] [Google Scholar]
- Hashimoto K. Targeting of NMDA receptors in new treatments for schizophrenia. Expert Opin. Ther. Targets 18, 1049–1063, doi: 10.1517/14728222.2014.934225 (2014). [DOI] [PubMed] [Google Scholar]
- Gonzalez J. et al. NMDARs in neurological diseases: a potential therapeutic target. Int. J. Neurosci. 126, 315–327, doi: doi: 10.3109/00207454.2014.940941 (2014). [DOI] [PubMed] [Google Scholar]
- Konieczny J., Ossowska K., Schulze G., Coper H. & Wolfarth S. L-701,324, a selective antagonist at the glycine site of the NMDA receptor, counteracts haloperidol-induced muscle rigidity in rats. Psychopharmacology 143, 235–243, doi: 10.1007/s002130050942 (1999). [DOI] [PubMed] [Google Scholar]
- Cai S. X. Glycine/NMDA Receptor Antagonists as Potential CNS Therapeutic Agents: ACEA-1021 and Related Compounds. Curr. Top. Med. Chem. 6, 651–662, doi: 10.2174/156802606776894465 (2006). [DOI] [PubMed] [Google Scholar]
- Varano F. et al. 1-Substituted pyrazolo[1,5-c]quinazolines as novel Gly/NMDA receptor antagonists: Synthesis, biological evaluation, and molecular modeling study. Bioorg. Med. Chem. 13, 5536–5549, doi: 10.1016/j.bmc.2005.07.010 (2005). [DOI] [PubMed] [Google Scholar]
- Moretti L., Pentikäinen O. T., Settimo L. & Johnson M. S. Model structures of the N-methyl-D-aspartate receptor subunit NR1 explain the molecular recognition of agonist and antagonist ligands. J. Struct. Biol. 145, 205–215, doi: 10.1016/j.jsb.2003.10.016 (2004). [DOI] [PubMed] [Google Scholar]
- Jain S. V., Bhadoriya K. S., Bari S. B., Sahu N. K. & Ghate M. Discovery of potent anticonvulsant ligands as dual NMDA and AMPA receptors antagonists by molecular modelling studies. Med. Chem. Res. 21, 3465–3484, doi: 10.1007/s00044-011-9889-5 (2012). [DOI] [Google Scholar]
- Tikhonova I. G., Baskin I. I., Palyulin V. A. & Zefirov N. S. CoMFA and Homology-Based Models of the Glycine Binding Site of N-Methyl-d-aspartate Receptor. J. Med. Chem. 46, 1609–1616, doi: 10.1021/jm0210156 (2003). [DOI] [PubMed] [Google Scholar]
- Tikhonova I. G., Baskin I. I., Palyulin V. A. & Zefirov N. S. Virtual screening of organic molecule databases. Design of focused libraries of potential ligands of NMDA and AMPA receptors. Russ. Chem. Bull. 53, 1335–1344, doi: 10.1023/B:RUCB.0000042297.38213.6e (2004). [DOI] [Google Scholar]
- Sharma M. & Gupta V. B. Dual Allosteric Effect in Glycine/NMDA Receptor Antagonism: A Molecular Docking Simulation Approach. International Journal of Drug Design and Discovery 3, 718–730 (2012). [Google Scholar]
- Bacilieri M. et al. Tandem 3D-QSARs Approach as a Valuable Tool To Predict Binding Affinity Data: Design of New Gly/NMDA Receptor Antagonists as a Key Study. J. Chem. Inf. Model. 47, 1913–1922, doi: 10.1021/ci7001846 (2007). [DOI] [PubMed] [Google Scholar]
- Awobuluyi M. et al. Subunit-Specific Roles of Glycine-Binding Domains in Activation of NR1/NR3 N-Methyl-D-aspartate Receptors. Mol. Pharmacol. 71, 112–122, doi: 10.1124/mol.106.030700 (2007). [DOI] [PubMed] [Google Scholar]
- Furukawa H. & Gouaux E. Mechanisms of activation, inhibition and specificity: crystal structures of the NMDA receptor NR1 ligand-binding core. EMBO J. 22, 2873–2885, doi: 10.1093/emboj/cdg303 (2003). [DOI] [PMC free article] [PubMed] [Google Scholar]
- Inanobe A., Furukawa H. & Gouaux E. Mechanism of Partial Agonist Action at the NR1 Subunit of NMDA Receptors. Neuron 47, 71–84, doi: 10.1016/j.neuron.2005.05.022 (2005). [DOI] [PubMed] [Google Scholar]
- Hall B. A., Kaye S. L., Pang A., Perera R. & Biggin P. C. Characterization of Protein Conformational States by Normal-Mode Frequencies. J. Am. Chem. Soc. 129, 11394–11401, doi: 10.1021/ja071797y (2007). [DOI] [PubMed] [Google Scholar]
- Liu L. T., Xu Y. & Tang P. Mechanistic Insights into Xenon Inhibition of NMDA Receptors from MD Simulations. J. Phys. Chem. B 114, 9010–9016, doi: 10.1021/jp101687j (2010). [DOI] [PMC free article] [PubMed] [Google Scholar]
- Dore K., Aow J. & Malinow R. Agonist binding to the NMDA receptor drives movement of its cytoplasmic domain without ion flow. Proc. Natl. Acad. Sci. 112, 14705–14710, doi: 10.1073/pnas.1520023112 (2015). [DOI] [PMC free article] [PubMed] [Google Scholar]
- Yao Y., Belcher J., Berger Anthony J., Mayer Mark L. & Lau Albert Y. Conformational Analysis of NMDA Receptor GluN1, GluN2, and GluN3 Ligand-Binding Domains Reveals Subtype-Specific Characteristics. Structure 21, 1788–1799, doi: 10.1016/j.str.2013.07.011 (2013). [DOI] [PMC free article] [PubMed] [Google Scholar]
- Clark A. J. et al. Prediction of Protein–Ligand Binding Poses via a Combination of Induced Fit Docking and Metadynamics Simulations. J. Chem. Theory Comput. 12, 2990–2998, doi: 10.1021/acs.jctc.6b00201 (2016). [DOI] [PubMed] [Google Scholar]
- Korb O., McCabe P. & Cole J. The Ensemble Performance Index: An Improved Measure for Assessing Ensemble Pose Prediction Performance. J. Chem. Inf. Model. 51, 2915–2919, doi: 10.1021/ci2002796 (2011). [DOI] [PubMed] [Google Scholar]
- Yuriev E. & Ramsland P. A. Latest developments in molecular docking: 2010–2011 in review. J. Mol. Recognit. 26, 215–239, doi: 10.1002/jmr.2266 (2013). [DOI] [PubMed] [Google Scholar]
- Oda A. et al. Effects of initial settings on computational protein–ligand docking accuracies for several docking programs. Mol. Simul. 41, 1027–1034, doi: 10.1080/08927022.2014.917300 (2014). [DOI] [Google Scholar]
- Lorber D. M. & Shoichet B. K. Flexible ligand docking using conformational ensembles. Protein Sci. 7, 938–950, doi: 10.1002/pro.5560070411 (1998). [DOI] [PMC free article] [PubMed] [Google Scholar]
- Ashtawy H. & Mahapatra N. In Bioinformatics Research and Applications Vol. 7875 Lecture Notes in Computer Science (eds Zhipeng Cai, Oliver Eulenstein, Daniel Janies, & Daniel Schwartz) Ch. 29, 298–310 (Springer Berlin Heidelberg, 2013). [Google Scholar]
- Warren G. L. et al. A Critical Assessment of Docking Programs and Scoring Functions. J. Med. Chem. 49, 5912–5931, doi: 10.1021/jm050362n (2006). [DOI] [PubMed] [Google Scholar]
- Bissantz C., Folkers G. & Rognan D. Protein-Based Virtual Screening of Chemical Databases. 1. Evaluation of Different Docking/Scoring Combinations. J. Med. Chem. 43, 4759–4767 (2000). [DOI] [PubMed] [Google Scholar]
- Teramoto R. & Fukunishi H. Supervised Consensus Scoring for Docking and Virtual Screening. J. Chem. Inf. Model. 47, 526–534, doi: 10.1021/ci6004993 (2007). [DOI] [PubMed] [Google Scholar]
- Hecht D. & Fogel G. B. Computational Intelligence Methods for Docking Scores. Curr. Comput.-Aided Drug Des. 5, 56–68, doi: 10.2174/157340909787580863 (2009). [DOI] [Google Scholar]
- Wang R. & Wang S. How Does Consensus Scoring Work for Virtual Library Screening? An Idealized Computer Experiment. J. Chem. Inf. Comput. Sci. 41, 1422–1426, doi: 10.1021/ci010025x (2001). [DOI] [PubMed] [Google Scholar]
- Klon A. E., Glick M. & Davies J. W. Combination of a Naive Bayes Classifier with Consensus Scoring Improves Enrichment of High-Throughput Docking Results. J. Med. Chem. 47, 4356–4359, doi: 10.1021/jm049970d (2004). [DOI] [PubMed] [Google Scholar]
- Zhong S., Zhang Y. & Xiu Z. Rescoring ligand docking poses. Curr. Opin. Drug Discov. Dev. 13, 326–334 (2010). [PubMed] [Google Scholar]
- Oda A., Tsuchida K., Takakura T., Yamaotsu N. & Hirono S. Comparison of consensus scoring strategies for evaluating computational models of protein-ligand complexes. J. Chem. Inf. Model. 46, 380–391, doi: 10.1021/ci050283k (2005). [DOI] [PubMed] [Google Scholar]
- Liu S., Fu R., Zhou L.-H. & Chen S.-P. Application of Consensus Scoring and Principal Component Analysis for Virtual Screening against β-Secretase (BACE-1). PLoS ONE 7, e38086, doi: 10.1371/journal.pone.0038086 (2012). [DOI] [PMC free article] [PubMed] [Google Scholar]
- Fukunishi Y. Structural ensemble in computational drug screening. Expert Opin. Drug Metab. Toxicol. 6, 835–849, doi: 10.1517/17425255.2010.486399 (2010). [DOI] [PubMed] [Google Scholar]
- Kirchmair J., Markt P., Distinto S., Wolber G. & Langer T. Evaluation of the performance of 3D virtual screening protocols: RMSD comparisons, enrichment assessments, and decoy selection—What can we learn from earlier mistakes? J. Comput.-Aided Mol. Des. 22, 213–228, doi: 10.1007/s10822-007-9163-6 (2008). [DOI] [PubMed] [Google Scholar]
- Betzi S., Suhre K., Chétrit B., Guerlesquin F. & Morelli X. GFscore: A General Nonlinear Consensus Scoring Function for High-Throughput Docking. J. Chem. Inf. Model. 46, 1704–1712, doi: 10.1021/ci0600758 (2006). [DOI] [PubMed] [Google Scholar]
- Bordner A. J. & Gorin A. A. Protein docking using surface matching and supervised machine learning. Proteins 68, 488–502, doi: 10.1002/prot.21406 (2007). [DOI] [PubMed] [Google Scholar]
- Cortes C. & Vapnik V. Support-Vector Networks. Mach. Learn. 20, 273–297, doi: 10.1023/a:1022627411411 (1995). [DOI] [Google Scholar]
- Goldman B. B. & Walters W. P. In Annual Reports in Computational Chemistry Vol. Volume 2 (ed Spellmeyer David C.) 127–140 (Elsevier, 2006). [Google Scholar]
- Ivanciuc O. In Reviews in Computational Chemistry 291–400 (John Wiley & Sons, Inc., 2007). [Google Scholar]
- Noble W. S. What is a support vector machine? Nat. Biotech. 24, 1565–1567, doi: 10.1038/nbt1206-1565 (2006). [DOI] [PubMed] [Google Scholar]
- Leong M. K., Lin S.-W., Chen H.-B. & Tsai F.-Y. Predicting Mutagenicity of Aromatic Amines by Various Machine Learning Approaches. Toxicol. Sci. 116, 498–513, doi: 10.1093/toxsci/kfq159 (2010). [DOI] [PubMed] [Google Scholar]
- Baba H., Takahara J.-i. & Mamitsuka H. In Silico Predictions of Human Skin Permeability using Nonlinear Quantitative Structure–Property Relationship Models. Pharm. Res. 32, 2360–2371, doi: 10.1007/s11095-015-1629-y (2015). [DOI] [PubMed] [Google Scholar]
- Feher M. Consensus scoring for protein-ligand interactions. Drug Discov. Today 11, 421, doi: 10.1016/j.drudis.2006.03.009 (2006). [DOI] [PubMed] [Google Scholar]
- Kitchen D. B., Decornez H., Furr J. R. & Bajorath J. Docking and scoring in virtual screening for drug discovery: methods and applications. Nat. Rev. Drug Discov. 3, 935–949, doi: 10.1038/nrd1549 (2004). [DOI] [PubMed] [Google Scholar]
- Charifson P. S., Corkery J. J., Murcko M. A. & Walters W. P. Consensus Scoring: A Method for Obtaining Improved Hit Rates from Docking Databases of Three-Dimensional Structures into Proteins. J. Med. Chem. 42, 5100–5109, doi: 10.1021/jm990352k (1999). [DOI] [PubMed] [Google Scholar]
- Bar-Haim S., Aharon A., Ben-Moshe T., Marantz Y. & Senderowitz H. SeleX-CS: A New Consensus Scoring Algorithm for Hit Discovery and Lead Optimization. J. Chem. Inf. Model. 49, 623–633, doi: 10.1021/ci800335j (2009). [DOI] [PubMed] [Google Scholar]
- Clark R. D., Strizhev A., Leonard J. M., Blake J. F. & Matthew J. B. Consensus scoring for ligand/protein interactions. J. Mol. Graph. Model. 20, 281–295, doi: 10.1016/S1093-3263(01)00125-5 (2002). [DOI] [PubMed] [Google Scholar]
- Kinnings S. L. et al. A Machine Learning-Based Method To Improve Docking Scoring Functions and Its Application to Drug Repurposing. J. Chem. Inf. Model. 51, 408–419, doi: 10.1021/ci100369f (2011). [DOI] [PMC free article] [PubMed] [Google Scholar]
- Wang W., He W., Zhou X. & Chen X. Optimization of molecular docking scores with support vector rank regression. Proteins 81, 1386–1398, doi: 10.1002/prot.24282 (2013). [DOI] [PubMed] [Google Scholar]
- Li G.-B., Yang L.-L., Wang W.-J., Li L.-L. & Yang S.-Y. ID-Score: A New Empirical Scoring Function Based on a Comprehensive Set of Descriptors Related to Protein–Ligand Interactions. J. Chem. Inf. Model. 53, 592–600, doi: 10.1021/ci300493w (2013). [DOI] [PubMed] [Google Scholar]
- Zilian D. & Sotriffer C. A. SFCscoreRF: A Random Forest-Based Scoring Function for Improved Affinity Prediction of Protein–Ligand Complexes. J. Chem. Inf. Model. 53 1923–1933, doi: 10.1021/ci400120b (2013). [DOI] [PubMed] [Google Scholar]
- Li L. et al. Target-Specific Support Vector Machine Scoring in Structure-Based Virtual Screening: Computational Validation, In Vitro Testing in Kinases, and Effects on Lung Cancer Cell Proliferation. J. Chem. Inf. Model. 51, 755–759, doi: 10.1021/ci100490w (2011). [DOI] [PMC free article] [PubMed] [Google Scholar]
- Arakawa M., Hasegawa K. & Funatsu K. Tailored scoring function of Trypsin-benzamidine complex using COMBINE descriptors and support vector regression. Chemometrics Intell. Lab. Syst. 92, 145–151, doi: 10.1016/j.chemolab.2008.02.004 (2008). [DOI] [Google Scholar]
- Knegtel R. M. A., Kuntza I. D. & Oshiro C. M. Molecular docking to ensembles of protein structures. J. Mol. Biol. 266, 424–440, doi: 10.1006/jmbi.1996.0776 (1997). [DOI] [PubMed] [Google Scholar]
- Karakas E. & Furukawa H. Crystal structure of a heterotetrameric NMDA receptor ion channel. Science 344, 992–997, doi: 10.1126/science.1251915 (2014). [DOI] [PMC free article] [PubMed] [Google Scholar]
- Lee C.-H. et al. NMDA receptor structures reveal subunit arrangement and pore architecture. Nature 511, 191–197, doi: 10.1038/nature13548 (2014). [DOI] [PMC free article] [PubMed] [Google Scholar]
- Vance K. M., Simorowski N., Traynelis S. F. & Furukawa H. Ligand-specific deactivation time course of GluN1/GluN2D NMDA receptors. Nat. Commun. 2, 294, doi: 10.1038/ncomms1295 (2011). [DOI] [PMC free article] [PubMed] [Google Scholar]
- Karakas E., Simorowski N. & Furukawa H. Subunit arrangement and phenylethanolamine binding in GluN1/GluN2B NMDA receptors. Nature 475, 249–253, doi: 10.1038/nature10180 (2011). [DOI] [PMC free article] [PubMed] [Google Scholar]
- Jespersen A., Tajima N., Fernandez-Cuervo G., Garnier-Amblard, Ethel C. & Furukawa H. Structural Insights into Competitive Antagonism in NMDA Receptors. Neuron 81, 366–378, doi: 10.1016/j.neuron.2013.11.033 (2014). [DOI] [PMC free article] [PubMed] [Google Scholar]
- Sastry G. M., Adzhigirey M., Day T., Annabhimoju R. & Sherman W. Protein and ligand preparation: parameters, protocols, and influence on virtual screening enrichments. J. Comput.-Aided Mol. Des 27, 221–234, doi: 10.1007/s10822-013-9644-8 (2013). [DOI] [PubMed] [Google Scholar]
- Wang J., Wolf R. M., Caldwell J. W., Kollman P. A. & Case D. A. Development and testing of a general amber force field. J. Comput. Chem. 25, 1157–1174, doi: 10.1002/jcc.20035 (2004). [DOI] [PubMed] [Google Scholar]
- Wallace A. C., Laskowski R. A. & Thornton J. M. LIGPLOT: a program to generate schematic diagrams of protein-ligand interactions. Protein Eng. 8, 127–134, doi: 10.1093/protein/8.2.127 (1995). [DOI] [PubMed] [Google Scholar]
- Chang G., Guida W. C. & Still W. C. An internal-coordinate Monte Carlo method for searching conformational space. J. Am. Chem. Soc. 111, 4379–4386, doi: 10.1021/ja00194a035 (1989). [DOI] [Google Scholar]
- Kolossváry I. & Guida W. C. Low Mode Search. An Efficient, Automated Computational Method for Conformational Analysis: Application to Cyclic and Acyclic Alkanes and Cyclic Peptides. J. Am. Chem. Soc. 118, 5011–5019, doi: 10.1021/ja952478m (1996). [DOI] [Google Scholar]
- Halgren T. A. Merck molecular force field. I. Basis, form, scope, parameterization, and performance of MMFF94. J. Comput. Chem. 17, 490–519, doi: (1996). [DOI] [Google Scholar]
- Colotta V. et al. 3-Hydroxy-1H-quinazoline-2,4-dione derivatives as new antagonists at ionotropic glutamate receptors: Molecular modeling and pharmacological studies. Eur. J. Med. Chem. 54, 470–482, doi: 10.1016/j.ejmech.2012.05.036 (2012). [DOI] [PubMed] [Google Scholar]
- Verdonk M. L. et al. Virtual Screening Using Protein−Ligand Docking: Avoiding Artificial Enrichment. J. Chem. Inf. Comput. Sci. 44, 793–806, doi: 10.1021/ci034289q (2004). [DOI] [PubMed] [Google Scholar]
- Eldridge M. D., Murray C. W., Auton T. R., Paolini G. V. & Mee R. P. Empirical scoring functions: I. The development of a fast empirical scoring function to estimate the binding affinity of ligands in receptor complexes. J. Comput.-Aided Mol. Des. 11, 425–445, doi: 10.1023/a:1007996124545 (1997). [DOI] [PubMed] [Google Scholar]
- Krammer A., Kirchhoff P. D., Jiang X., Venkatachalam C. M. & Waldman M. LigScore: a novel scoring function for predicting binding affinities. J. Mol. Graph. 23, 395–407, doi: 10.1016/j.jmgm.2004.11.007 (2005). [DOI] [PubMed] [Google Scholar]
- Gehlhaar D. K. et al. Molecular recognition of the inhibitor AG-1343 by HIV-1 protease: conformationally flexible docking by evolutionary programming. Chem. Biol. 2, 317–324, doi: 10.1016/1074-5521(95)90050-0 (1995). [DOI] [PubMed] [Google Scholar]
- Jain A. N. Scoring noncovalent protein-ligand interactions: A continuous differentiable function tuned to compute binding affinities. J. Comput.-Aided Mol. Des. 10, 427–440, doi: 10.1007/BF00124474 (1996). [DOI] [PubMed] [Google Scholar]
- Muegge I. & Martin Y. C. A General and Fast Scoring Function for Protein−Ligand Interactions: A Simplified Potential Approach. J. Med. Chem. 42, 791–804, doi: 10.1021/jm980536j (1999). [DOI] [PubMed] [Google Scholar]
- Muegge I. PMF Scoring Revisited. J. Med. Chem. 49, 5895–5902, doi: 10.1021/jm050038s (2005). [DOI] [PubMed] [Google Scholar]
- Cherkasov A. et al. QSAR Modeling: Where Have You Been? Where Are You Going To? J. Med. Chem. 57, 4977–5010, doi: 10.1021/jm4004285 (2014). [DOI] [PMC free article] [PubMed] [Google Scholar]
- Lu H. Stereoselectivity in drug metabolism. Expert Opin. Drug Metab. Toxicol. 3, 149–158, doi: 10.1517/17425255.3.2.149 (2007). [DOI] [PubMed] [Google Scholar]
- Kennard R. W. & Stone L. A. Computer Aided Design of Experiments. Technometrics 11, 137–148, doi: 10.1080/00401706.1969.10490666 (1969). [DOI] [Google Scholar]
- Ding Y.-L., Lyu Y.-C. & Leong M. K. In Silico Prediction of Mutagenicity of Nitroaromatic Compounds Using the Novel Hierarchical Support Vector Regression Approach (2015).
- Kettaneh N., Berglund A. & Wold S. PCA and PLS with very large data sets. Comput. Stat. Data Anal. 48, 69–85, doi: 10.1016/j.csda.2003.11.027 (2005). [DOI] [Google Scholar]
- Rogers D. & Hopfinger A. J. Application of Genetic Function Approximation to Quantitative Structure-Activity Relationships and Quantitative Structure-Property Relationships. J. Chem. Inf. Comput. Sci. 34, 854–866, doi: 10.1021/ci00020a020 (1994). [DOI] [Google Scholar]
- Guyon I., Weston J., Barnhill S. & Vapnik V. Gene Selection for Cancer Classification using Support Vector Machines. Mach. Learn. 46, 389–422, doi: 10.1023/a:1012487302797 (2002). [DOI] [Google Scholar]
- Golbraikh A. et al. Rational selection of training and test sets for the development of validated QSAR models. J. Comput.-Aided Mol. Des. 17, 241–253, doi: 10.1023/A:1025386326946 (2003). [DOI] [PubMed] [Google Scholar]
- Ojha P. K., Mitra I., Das R. N. & Roy K. Further exploring rm2 metrics for validation of QSPR models. Chemometrics Intell. Lab. Syst. 107, 194–205, doi: 10.1016/j.chemolab.2011.03.011 (2011). [DOI] [Google Scholar]
- Roy K. et al. Comparative Studies on Some Metrics for External Validation of QSPR Models. J. Chem. Inf. Model. 52, 396–408, doi: 10.1021/ci200520g (2012). [DOI] [PubMed] [Google Scholar]
- Chirico N. & Gramatica P. Real External Predictivity of QSAR Models. Part 2. New Intercomparable Thresholds for Different Validation Criteria and the Need for Scatter Plot Inspection. J. Chem. Inf. Model. 52, 2044–2058, doi: 10.1021/ci300084j (2012). [DOI] [PubMed] [Google Scholar]
- Cooper J. A., Saracci R. & Cole P. Describing the validity of carcinogen screening tests. Br. J. Cancer 39, 87–89, doi: 10.1038/bjc.1979.10 (1979). [DOI] [PMC free article] [PubMed] [Google Scholar]
- Kubat Q. M. & Matwin S. In Proceddings of the Fourteenth International Conference on Machine Learning (ICML) Vol. 30 179–186 (1997).
- Kontoyianni M., McClellan L. M. & Sokol G. S. Evaluation of Docking Performance: Comparative Data on Docking Algorithms. J. Med. Chem. 47, 558–565, doi: 10.1021/jm0302997 (2003). [DOI] [PubMed] [Google Scholar]
- Damm-Ganamet K. L., Smith R. D., Dunbar J. B., Stuckey J. A. & Carlson H. A. CSAR Benchmark Exercise 2011–2012: Evaluation of Results from Docking and Relative Ranking of Blinded Congeneric Series. J. Chem. Inf. Model. 53, 1853–1870, doi: 10.1021/ci400025f (2013). [DOI] [PMC free article] [PubMed] [Google Scholar]
- Tetko I. V., Livingstone D. J. & Luik A. I. Neural network studies. 1. Comparison of overfitting and overtraining. J. Chem. Inf. Comput. Sci. 35, 826–833, doi: 10.1021/ci00027a006 (1995). [DOI] [Google Scholar]
- Scott D. W. Averaged shifted histogram. Wiley Interdisciplinary Reviews: Computational Statistics 2, 160–164, doi: 10.1002/wics.54 (2010). [DOI] [Google Scholar]
- Li Y. et al. Comparative Assessment of Scoring Functions on an Updated Benchmark: 1. Compilation of the Test Set. J. Chem. Inf. Model. 54, 1700–1716, doi: 10.1021/ci500080q (2014). [DOI] [PubMed] [Google Scholar]
- Di Fabio R. et al. Substituted Indole-2-carboxylates as in Vivo Potent Antagonists Acting as the Strychnine-Insensitive Glycine Binding Site. J. Med. Chem. 40, 841–850, doi: 10.1021/jm960644a (1997). [DOI] [PubMed] [Google Scholar]
- Papa E., Kovarich S. & Gramatica P. QSAR Modeling and Prediction of the Endocrine-Disrupting Potencies of Brominated Flame Retardants. Chem. Res. Toxicol. 23, 946–954, doi: 10.1021/tx1000392 (2010). [DOI] [PubMed] [Google Scholar]
- Kier L. B. & Hall L. H. Molecular Structure Descriptors: The Electrotopological State. (Academic Press, 1999). [Google Scholar]
- McQuaid L. A. et al. Synthesis and excitatory amino acid pharmacology of a series of heterocyclic-fused quinoxalinones and quinazolinones. J. Med. Chem. 35, 3319–3324, doi: 10.1021/jm00096a002 (1992). [DOI] [PubMed] [Google Scholar]
- Baron B. M. et al. [3H]MDL 105,519, a high-affinity radioligand for the N-methyl-D-aspartate receptor-associated glycine recognition site. J. Pharmacol. Exp. Ther. 279, 62–68 (1996). [PubMed] [Google Scholar]
- Wang R., Lu Y. & Wang S. Comparative Evaluation of 11 Scoring Functions for Molecular Docking. J. Med. Chem. 46, 2287–2303 (2003). [DOI] [PubMed] [Google Scholar]
- Feher M. & Williams C. I. Numerical Errors and Chaotic Behavior in Docking Simulations. J. Chem. Inf. Model. 52, 724–738, doi: 10.1021/ci200598m (2012). [DOI] [PubMed] [Google Scholar]
- Politi R., Convertino M., Popov K., Dokholyan N. V. & Tropsha A. Docking and Scoring with Target-Specific Pose Classifier Succeeds in Native-Like Pose Identification But Not Binding Affinity Prediction in the CSAR 2014 Benchmark Exercise. J. Chem. Inf. Model. 56, 1032–1041, doi: 10.1021/acs.jcim.5b00751 (2016). [DOI] [PubMed] [Google Scholar]
- Ashtawy H. M. & Mahapatra N. R. Machine-learning scoring functions for identifying native poses of ligands docked to known and novel proteins. BMC Bioinformatics 16, 1–17, doi: 10.1186/1471-2105-16-s6-s3 (2015). [DOI] [PMC free article] [PubMed] [Google Scholar]
- Raevsky O. A., Polianczyk D. E., Grigorev V. Y., Raevskaja O. E. & Dearden J. C. In silico Prediction of Aqueous Solubility: a Comparative Study of Local and Global Predictive Models. Mol. Inf. 34, 417–430, doi: 10.1002/minf.201400144 (2015). [DOI] [PubMed] [Google Scholar]
Associated Data
This section collects any data citations, data availability statements, or supplementary materials included in this article.