Abstract
The objective of this study was to establish the impact of caloric restriction on high fat diet-induced alterations on regulators of skeletal muscle growth. We hypothesized that caloric restriction would reverse the negative effects of high fat diet-induced obesity on REDD1 and mTOR-related signaling. Following an initial 8 week period of HF diet-induced obesity, caloric restriction (CR ~30 %) was employed while mice continued to consume either a low (LF) or high fat (HF) diet for 8 weeks. Western analysis of skeletal muscle showed that CR reduced (p < 0.05) the obesity-related effects on the lipogenic protein, SREBP1. Likewise, CR reduced (p < 0.05) the obesity-related effects on the hyperactivation of mTORC1 and ERK1/2 signaling to levels comparable to the LF mice. CR also reduced (p < 0.05) obesity-induced expression of negative regulators of growth, REDD1 and cleaved caspase 3. These findings have implications for on the reversibility of dysregulated growth signaling in obese skeletal muscle, using short-term caloric restriction.
Keywords: mTORC1, SREBP1, Apoptosis
Introduction
Recent statistics from the Centers for Disease Control and Prevention estimate that in the United States, 16.9 % of children ages 2–19 years and 34.9 % of adults are obese [1]. In addition to the host of comorbidities that frequently accompany obesity (i.e. hypertension, insulin resistance, cardiovascular disease), skeletal muscle growth signaling is often defective [2, 3]. Hyperactivity of the mechanistic target of rapamycin (mTOR) pathway can contribute to impaired growth signaling and insulin resistance in obese humans [3] and animals [2]. Consistent with this rationale, we previously reported that short-term treatment with the AMPK agonist and mTOR repressor, AICAR, normalized mTOR and downstream regulatory processes that control growth (e.g. mRNA translation initiation) to lean levels [4]. These and other [5] findings support the contention that normalizing mTOR during or following obesity, through the benefits of exercise, diet, or medication, restores growth signaling, insulin sensitivity, and even limit muscle mass loss.
The mTOR signaling, specifically mTOR complex 1 (mTORC1) [6, 7], pathway regulates anabolic processes, including cell proliferation, protein synthesis, and lipo-genesis. mTORC1 is a large protein complex comprised of mTOR protein and multiple subunits, specifically the rapamycin sensitive accessory protein, Raptor [8]. Active mTORC1 phosphorylates downstream target proteins p70 S6 kinase (S6K1) and subsequently ribosomal protein S6 (rpS6), promoting translation initiation through eIF3 and the 40S ribosomal subunit [9]. mTORC1 is directly activated by GTP-bound Ras-homologue enriched in brain (Rheb) protein when the tuberous sclerosis complex (TSC) is directly inactivated by Akt and/or ERK1/2 [10, 11]. Conversely, the protein regulated in development and DNA damage responses 1 [REDD1; aka DNA-damage-inducible transcript 4 (DDIT4), Dexamethasone-induced gene 2 (Dig2), and RTP801] represses mTOR. REDD1 is upregulated by various stressors, such as glucocorticoids [12], DNA damage [13], endoplasmic reticulum (ER) stress [14], and hypoxia [15, 16], among others. REDD1’s mechanism of action has been reported to work through TSC2 by sequestering the modulatory protein, 14-3-3 [17], or by recruiting serine-threonine protein phosphatase 2A (PP2A) to dephosphorylate T308 on Akt [18].
Recent reports from our laboratory [3, 19, 20] and others [21, 22] have shown a metabolic and nutrient role for REDD1. As mentioned above, skeletal muscle from obese animals and humans exhibit hyperactive mTOR signaling in a fasted state that coincides with elevated REDD1 expression. In this scenario, skeletal muscle from obese mice [20] and humans [3] exhibit a blunted Akt and mTOR signaling response to growth stimuli. The physiological reason for the simultaneous increase in REDD1 in skeletal muscle during obesity is unknown, though it may be due to hyperactive mTOR signaling. Thus, when mTOR is highly activated (i.e. in an obese state), REDD1 protein is stabilized and protected from proteasomal degradation [23]. Upon inhibition of mTOR, REDD1 protein stability is reduced, leading to its degradation [23, 24], collectively suggesting reciprocal regulation of REDD1–mTOR that is dependent upon the energy status or nutrient state of the cell.
Short and long term caloric restriction promotes body mass loss [25, 26], improved insulin action [27, 28], and longevity [26]. Yet, there have been equivocal findings that caloric restriction alters the glucocorticoid cortisol [29, 30], yet no studies have examined caloric restriction effects on the glucocorticoid responsive protein, REDD1. This becomes important in the understanding of how mTOR is regulated during caloric restriction. Given that glucocorticoids or obesity/high fat diet consumption are potent stimulators of REDD1 expression, the objective of this study was to establish the impact of caloric restriction on high fat diet-induced alterations on regulators of skeletal muscle growth. We hypothesized that caloric restriction would reverse the negative effects of high fat diet-induce obesity on regulators of growth signaling, and normalize their expression to that of the lean controls.
Experimental Methods
Materials
A Coomassie protein assay was performed using Coomassie Plus Reagent (Thermo Scientific; Rockford, IL, USA). Western blotting was performed using a Bio-Rad mini-PROTEAN Tetra Cell system. Polyvinylidine difluoride (PVDF) membrane was purchased from Bio-Rad Laboratories (Hercules, CA, USA). Primary antibody for SREBP-1c (NB600-582) from NOVUS biologicals (Littleton, CO, USA), antibodies for phospho-p70 S6 Kinase Thr389 (9234), phospho-S6 Ribosomal Protein Ser240/244 (5364), phospho-MEK1/2 Ser217/221 (9154), phospho-ERK1/2 Thr202/Tyr204 (4370), cleaved caspase 3 (9664), LC3A/B (4108), and GAPDH (2118), were purchased from Cell Signaling Technology (Beverly, MA, USA), and REDD1 (10638-1-AP) was purchased from Proteintech. Enhanced chemiluminescence (ECL) reagent was purchased from Bio-Rad Laboratories (Clarity western ECL). Chemiluminescence imaging was performed on a Bio-Rad ChemiDoc MP Imager.
Animals
The Institutional Animal Care and Use Committee at the University at Buffalo approved the protocols and procedures. Six-week-old, male C57Bl/6 mice (Jackson Laboratories) were housed at 22 °C in 50 % humidity with 12-h day/night cycles. This study design and characteristics of the mice were reported previously [31]. For the first 8 weeks of the study, the mice were split into four groups, one group receiving a low fat (LF) diet (5 % fat; Research Diets) and the other three groups receiving a high fat diet (60 % fat; Research Diets). Following this initial lead-in period, the LF fed mice were maintained on their diet for an additional 8 weeks, and the HF fed mice were either maintained on the same high fat (HF) diet, a low fat, caloric restricted diet (LF+CR), or a high fat, caloric restricted (HF+CR) diet for an additional 8 weeks. The caloric intake of the calorie restricted groups was ~70 % of that of the low fat, control group, an amount that has previously shown to be effective at protecting against high fat diet induced obesity in mice [32]. Per the previously published findings from this study [31], the HF fed groups all weighed significantly more than the LF fed group. Caloric restriction limited weight gain in both the LF and the HF fed groups versus the HF maintained group, with the LF+CR body weight similar to the LF fed group. Following the treatment period and a 12-h versus fast, blood and the plantar flexor complex (containing the medial and lateral gastrocnemius, soleus, and plantaris muscles) were collected under 3 % isoflurane. The tissue was frozen in liquid nitrogen for subsequent analysis, then the mice were euthanized while under 3 % isoflurane anesthesia.
Blood Fatty Acids
Nonesterified free fatty acids were analyzed with an enzymatic kit in accordance with the manufacturer’s instructions (Wako Chemical; Richmond, VA, USA).
Tissue Processing and Western Analysis
Per our previously published methods [20], the plantar flexor complex samples were homogenized in ten volumes of CHAPS-containing buffer [40 mM HEPES (pH 7.5), 120 mM NaCl, 1 mM EDTA, 10 mM pyrophosphate, 10 mM-glycerophosphate, 40 mM NaF, 1.5 mM sodium vanadate, 0.3 % CHAPS, 0.1 mM PMSF, 1 mM benzamidine, 1 mM DTT, and protease inhibitors (#04693116001, Roche, Indianapolis, IN, USA)], where the total and cytosolic fractions were isolated and protein concentrations were determined. Equal protein (30 μg of protein) was resolved using sodium dodecyl sulfate polyacrylamide gel electrophoresis (SDS-PAGE), and then transferred onto PVDF membrane (Bio-Rad Protean). After blocking in 5 % milk in tris-buffered saline (TBS) plus 0.1 % Tween-20 (TBS-T) for 1 h at room temperature, membranes were incubated with the respective primary antibody overnight 4 °C in TBS-T. Membranes were incubated with a horse-radish peroxidase (HRP)-containing secondary antibody corresponding to the primary antibody host for 1 h in a 5 % milk/TBS-T solution at room temperature. Then the protein immunoblot images were visualized following addition of ECL reagent and captured (Bio-Rad ChemiDoc MP Imager). Density measurements for the images were quantified using Bio-Rad ImageLab software, and were normalized to the appropriate control. Each sample was then normalized to the LF group, for the respective blot, and then expressed as a mean percentage of the LF group between blots.
Statistical Analysis
Statistics analyses were performed using IBM SPSS version 22.0 software. A one-way analysis of variance with a least significant difference post hoc test or Pearson correlation was used to determine significance between groups. The significance level was set a priori at p < 0.05. The results are expressed as the mean ± standard error.
Results
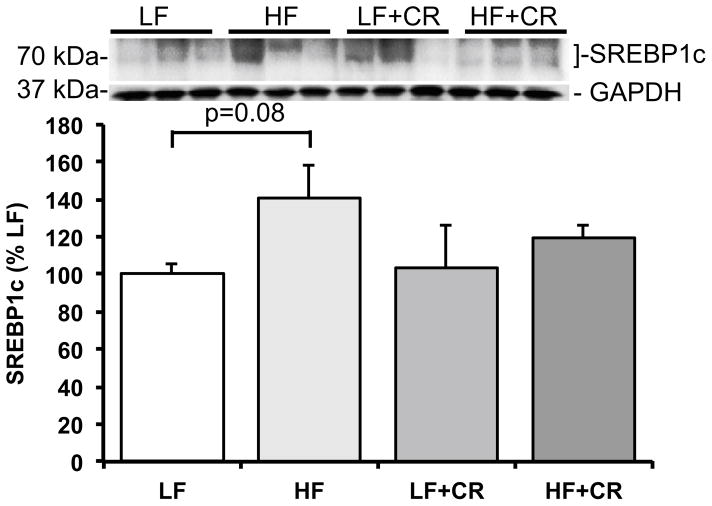
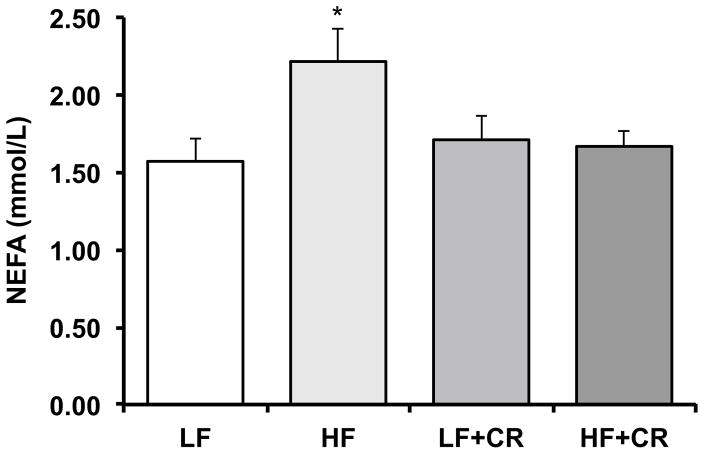
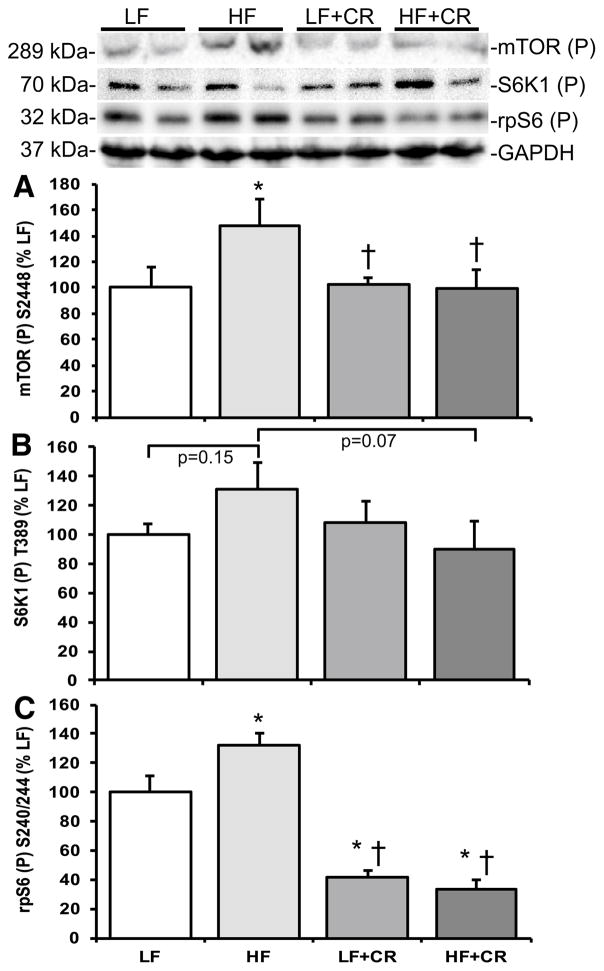
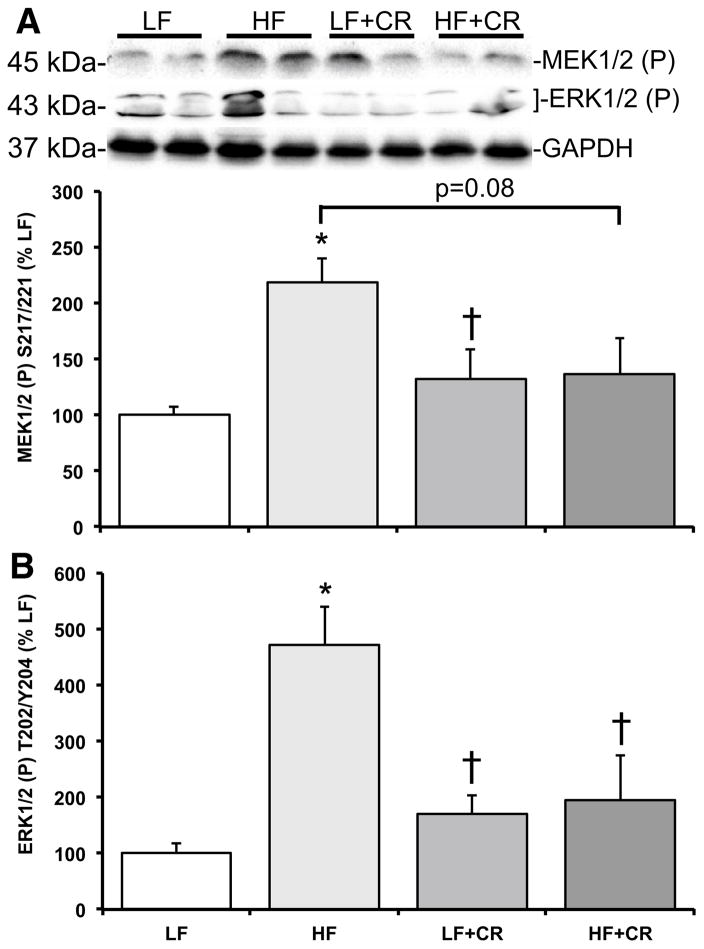
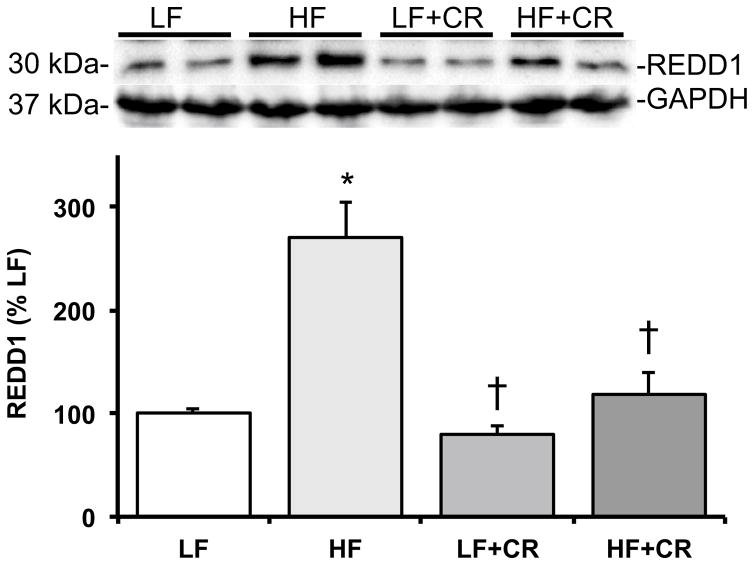
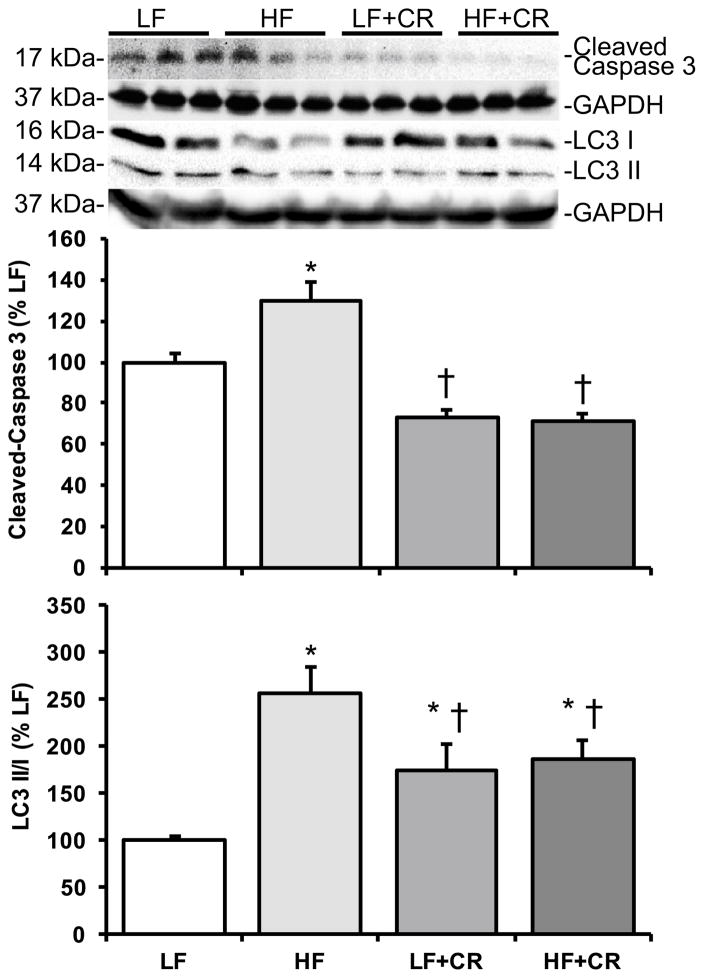
As previously reported by Cui et al. [31] and consistent with our previous reports in obese mice [4, 20], the skeletal muscle mass per body weight from the HF fed mice was lower than the LF fed mice, and there was a partial (HF + CR) or near complete (LF + CR) reduction in the high fat diet-induced body weight gain with caloric restriction versus the LF control mice. Thus, regulators of skeletal muscle metabolism and mass were assessed. Protein expression of the lipogenic regulator, SREBP1c, was comparable between the LF and the CR groups (Fig. 1) versus a higher trend in the HF group (p = 0.08 versus LF). Consistent with this, blood non-esterified fatty acids were significantly higher (Fig. 2; p < 0.05) in the HF fed group versus all other groups, which was consistent with other markers of lipid metabolism reported by Cui et al. [31]. A regulatory pathway of SREBP1c and subsequently lipogenesis is the mTOR pathway [6, 7]. Accordingly, mTOR phosphorylation was significantly higher (p < 0.05) in the HF group when compared to the LF controls (Fig. 3a), and was significantly lower (p < 0.05) after caloric restriction. S6K1 phosphorylation in the HF group trended higher when compared to the LF group (Fig. 3b; p = 0.15), and trended lower (Fig. 3b; p = 0.07) in the HF + CR mouse muscle. Similar to mTOR, phosphorylation of the downstream substrate of S6K1, ribosomal protein S6 (rpS6) was significantly higher (p < 0.05) in the HF group (Fig. 3c) when compared to the LF group, and dramatically lower (p < 0.05) in the CR groups regardless of the dietary fat when compared to both the LF and HF group (Fig. 3c). Activation of a pathway that also regulates mTOR, the MEK1/2-ERK1/2 pathway, was significantly higher (Fig. 4a, b; p < 0.05) in the HF group when compared to the LF group. Caloric restriction was effective in reducing (Fig. 4a, b) the phosphorylation of MEK1/2 (p = 0.08 versus HF) and ERK1/2 (p < 0.05 versus HF), regardless of the dietary fat. Similar to our previous findings [20], HF diet-induced obesity promoted a significant elevation (Fig. 5; p < 0.05) in skeletal muscle REDD1 expression. Caloric restriction (regardless of dietary fat) normalized (Fig. 5; p < 0.05) REDD1 expression to levels comparable to the LF fed group. Interestingly, significant positive correlations between REDD1-MEK1/2 (r = 0.482; p < 0.05) and REDD1-ERK1/2 (r = 0.762; p < 0.001) were observed. Extending upon these findings of negative regulators of muscle growth, caloric restriction (regardless of dietary fat) significantly reduced (p < 0.05) HF diet-induced skeletal muscle expression of the apoptotic protein, cleaved caspase 3 (Fig. 6a) to levels comparable to the LF group. The LC3-II/I ratio, an indicator of autophagy, was significantly increased (Fig. 6a; p < 0.05) after HF diet-induced obesity, and was significantly reduced (p < 0.05) following caloric restriction.
Fig. 1.
Skeletal muscle SREBP1c expression in low fat and high fat fed, calorically restricted mice. Equal protein from low (LF) and high fat (HF) fed, calorically restricted (CR) mouse muscle homogenates were analyzed by Western blot analysis for SREBP1c and GAPDH, then normalized to GAPDH. Representative Western blots are shown. Means marked with an asterisk are significantly different p < 0.05 versus LF (n = 6/group)
Fig. 2.
Serum nonesterified fatty acids (NEFA) in low fat and high fat fed, calorically restricted mice. Means marked with an asterisk are significantly different p < 0.05 versus LF (n = 6/group)
Fig. 3.
Skeletal muscle mTORC1 signaling activation in low fat and high fat fed, calorically restricted mice. Equal protein from low (LF) and high fat (HF) fed, calorically restricted (CR) mouse muscle homogenates were analyzed by Western blot analysis for a mTOR S2448 phosphorylation, b S6K1 T389 phosphorylation, c rpS6 S240/244 phosphorylation, and GAPDH, then normalized to GAPDH. Representative Western blots are shown. Means marked with an asterisk are significantly different p < 0.05 versus LF (n = 6/group)
Fig. 4.
Skeletal muscle MEK–ERK signaling activation in low fat and high fat fed, calorically restricted mice. Equal protein from low (LF) and high fat (HF) fed, calorically restricted (CR) mouse muscle homogenates were analyzed by Western blot analysis for a MEK1/2 S217/221 phosphorylation, b ERK1/2 T202/Y204 phosphorylation, and GAPDH, then normalized to GAPDH. Representative Western blots are shown. Means marked with an asterisk are significantly different p < 0.05 versus LF and dagger are significantly p < 0.05 versus HF (n = 6/group)
Fig. 5.
Skeletal muscle REDD1 expression in low fat and high fat fed, calorically restricted mice. Equal protein from low (LF) and high fat (HF) fed, calorically restricted (CR) mouse muscle homogenates were analyzed by Western blot analysis for REDD1 and GAPDH, then normalized to GAPDH. Representative Western blots are shown. Means marked with an asterisk are significantly different p < 0.05 versus LF and dagger are significantly p < 0.05 versus HF (n = 6/group)
Fig. 6.
Skeletal muscle expression of cleaved caspase 3 and LC3 in low fat and high fat fed, calorically restricted mice. Equal protein from low (LF) and high fat (HF) fed, calorically restricted (CR) mouse muscle homogenates were analyzed by Western blot analysis for a cleaved caspase 3, b LC3-II/I ratio, and GAPDH, then normalized to GAPDH. Representative Western blots are shown. Means marked with an asterisk are significantly different p < 0.05 versus LF and dagger are significantly p < 0.05 versus HF (n = 6/group)
Discussion
The goal of the study was to determine the impact of caloric restriction on high fat diet-induced alterations on regulators of skeletal muscle growth. Accordingly, following an initial 8-week period of HF diet-induced obesity, CR (~30 %) was employed while mice continued to consume either a LF or HF diet for 8 weeks. CR mitigated the obesity-related effects on two negative regulators of skeletal muscle growth, REDD1 and cleaved caspase 3. CR also attenuated obesity-related elevation in skeletal muscle mTORC1 and ERK1/2 pathway activation. Consistent with our previous findings showing that skeletal muscle REDD1 is responsive to overnutrition, such as high fat diet-induced obesity, the change in REDD1 following a nutrient stimulus that limits caloric intake is proportional in response.
Models of obesity show high circulating concentration of glucose, insulin, branched chain amino acids, glucocorticoids, and cytokines among others, which bathe skeletal muscle in catabolic and anabolic stimuli [33–35]. The current data coupled with our previous findings show that elevated REDD1 expression in fasted muscle from high-fat fed, obese mice is associated with reduced TSC2 complex formation [4], and can promote Rheb GTP loading and mTORC1 signaling (low raptor-mTOR association, elevated S6K1 and rpS6 phosphorylation). Thus, hyperactive mTORC1 can coincide with elevated REDD1 expression, as reported by us [20] and others [23].
Branched chain amino acids (BCAA) are a well-established mTOR agonist in muscle [36, 37], and elevated concentrations of BCAA appear to contribute to insulin resistance in obese tissues [38, 39]. Though not measured in the current study, high circulating concentrations of amino acids in the obese [38, 39] may constitutively activate the Rag pathway (and mTOR), partially explaining the inability of REDD1 to inhibit mTORC1, since REDD1 and growth factors signal to mTORC1 through TSC [40, 41]. Conversely, the elevation of glucocorticoids, a REDD1-agonist, can contribute to the irregular and blunted mTORC1 responses in the obese under both fasted and fed conditions [22, 33–35]. In addition to upregulating REDD1 protein expression while consuming a HF diet, glucocorticoid-induced REDD1 expression can promote apoptosis [42] and autophagy [43], which is consistent with the observed increase in cleaved caspase 3 and the LC3-II/I ratio, markers of apoptosis and autophagy, respectively. An increase in protein catabolism has been shown to restore the available free amino acid pool [44, 45], promoting mTOR activation and cell survival. Alterations in plasma glucocorticoids during obesity or caloric restriction would help explain the concomitant increase of both REDD1 and mTOR during obesity, and their reduction after caloric restriction.
The inhibitory role of REDD1 on mTOR activity in skeletal muscle was first reported in dexamethasone treated rodents [12], as well as in models of skeletal muscle atrophy [22, 46–48]. Recent data from our laboratory and others report that REDD1 expression is elevated in skeletal muscle, cardiac, and liver from obese and/or high fat fed mouse models. Moreover, skeletal muscle REDD1 expression is downregulated or upregulated during a short-term fasting-to-fed state transition or short-term fasting, respectively [22]. REDD1 expression appears to be closely linked to the nutrient and the hormonal state of the cell, and these current and previous findings suggest differential regulation of REDD1 during acute (i.e. feeding or fasting) and chronic states (i.e. obesity or caloric restriction). This study supports these findings, and extends upon our previous work to show that chronic nutrient alterations (i.e. high diet or caloric restriction) can regulate REDD1 expression.
Another mechanism that may control REDD1 expression is the very protein that it inhibits, mTOR. When mTOR is highly active, 26S proteasome-dependent degradation of REDD1 is inhibited. Under conditions that inhibit mTOR, REDD1 protein stability is reduced via the HUWE1 ubiquitin ligase, which leads to degradation [23]. By upregulating REDD1 expression, mTOR may act in a manner to self-regulate, which could be advantageous during obesity. TXNIP (also known as VDUP1 or TBP2) is induced by various types of cellular stress, including oxidative stress, UV irradiation, heat shock and apoptotic signaling [49, 50], is also a binding partner of REDD1 that promotes its stabilization and mTOR inhibition.
The half-life of the REDD1 protein is estimated to be 5–90 min [51], depending upon the cell type, then undergoes degradation through a CUL4-DDB1-regulated ubiquitin ligation [24, 52]. The mechanism controlling REDD1 degradation remains to be completely elucidated, though recent findings suggest that MEK–ERK signaling may play a role in REDD1 expression. Constitutively active MEK prevents REDD1 degradation even in the presence of cyclohexamide or CUL4 overexpression. Consistent with our findings in human skeletal muscle from type 2 diabetic, obese individuals [3], the current data show that skeletal muscle from obese mice exhibit hyperactivation of MEK–ERK in a fasted state through an undefined mechanism or regulator. Similar to the reports of other laboratories [53], we report that caloric restriction reduces basal MEK–ERK activation state. Sustained, long-term activation of ERK in either the cytosol or the nucleus can promote apoptosis [54]. Consistent with previous findings in obese animal models [55], these data show that caloric restriction can reverse high fat diet-induced increases in skeletal muscle elevated cleaved caspase 3, indicating that apoptosis was reduced. When obese mice are treated with the MEK inhibitor, U0126, blood glucose and insulin action are improved [56]. Likewise, when ERK1 is ablated in ob/ob mice, glucose metabolism and insulin sensitivity were improved and inflammatory cytokines were reduced [57]. Thus, elevated basal ERK1/2 activation and subsequent maintenance of REDD1 expression during obesity may be an attempt to limit inappropriate mTOR activation under conditions that promote apoptosis.
In conclusion, these data show that caloric restriction can reverse the negative effects of a high fat diet-induced obesity on regulators of skeletal muscle growth. Specifically, caloric restriction of high fat fed obese mice reduced the basal hyperactivation of mTORC1 and ERK1/2 signaling, as well as reduced REDD1 expression, that was associated with changes in markers for apoptosis and autophagy. Thus, caloric restriction may be used as a non-pharmacologic approach to mitigating aberrant growth signaling in obese skeletal muscle.
Acknowledgments
The authors would like to thank Mingxia Cui for excellent support throughout the project.
Abbreviations
- CR
Caloric restriction
- ERK
Extracellular signal-regulated kinase
- HF
High fat
- LF
Low fat
- MEK
MAPK/ERK kinase
- mTOR
Mammalian target of rapamycin
- mTORC1
mTOR complex 1
- REDD1
Regulated in development and DNA damage responses 1
- rpS6
Ribosomal protein S6, S6K1 p70 ribosomal protein S6 kinase-1
- SREBP1c
Sterol regulatory element-binding protein 1c
Footnotes
Compliance with Ethical Standards
Conflict of interest
The authors have no conflicts of interest to declare.
References
- 1.Ogden CL, Carroll MD, Kit BK, Flegal KM. Prevalence of obesity in the United States, 2009–2010. NCHS data brief. 2012:1–8. [PubMed] [Google Scholar]
- 2.Um SH, Frigerio F, Watanabe M, Picard F, Joaquin M, Sticker M, Fumagalli S, Allegrini PR, Kozma SC, Auwerx J, Thomas G. Absence of S6K1 protects against age- and diet-induced obesity while enhancing insulin sensitivity. Nature. 2004;431:200–205. doi: 10.1038/nature02866. [DOI] [PubMed] [Google Scholar]
- 3.Williamson DL, Dungan CM, Mahmoud AM, Mey JT, Black-burn BK, Haus JM. Aberrant REDD1-mTORC1 responses to insulin in skeletal muscle from type 2 diabetics. Am J Physiol Regul Integr Comp Physiol. 2015;309:R855–R863. doi: 10.1152/ajpregu.00285.2015. [DOI] [PMC free article] [PubMed] [Google Scholar]
- 4.Drake JC, Alway SE, Hollander JM, Williamson DL. AICAR treatment for 14 days normalizes obesity-induced dys-regulation of TORC1 signaling and translational capacity in fasted skeletal muscle. Am J Physiol Regul Integr Comp Physiol. 2010;299:R1546–R1554. doi: 10.1152/ajpregu.00337.2010. [DOI] [PMC free article] [PubMed] [Google Scholar]
- 5.Pieri BL, Souza DR, Luciano TF, Marques SO, Pauli JR, Silva AS, Ropelle ER, Pinho RA, Lira FS, De Souza CT. Effects of physical exercise on the P38MAPK/REDD1/14-3-3 pathways in the myocardium of diet-induced obesity rats. Horm Metab Res. 2014;46:621–627. doi: 10.1055/s-0034-1371824. [DOI] [PubMed] [Google Scholar]
- 6.Laplante M, Sabatini DM. mTOR signaling in growth control and disease. Cell. 2012;149:274–293. doi: 10.1016/j.cell.2012.03.017. [DOI] [PMC free article] [PubMed] [Google Scholar]
- 7.Ricoult SJH, Manning BD. The multifaceted role of mTORC1 in the control of lipid metabolism. EMBO Rep. 2012;14:242–251. doi: 10.1038/embor.2013.5. [DOI] [PMC free article] [PubMed] [Google Scholar]
- 8.Kim DH, Sabatini DM. Raptor and mTOR: subunits of a nutrient-sensitive complex. Curr Top Microbiol Immunol. 2004;279:259–270. doi: 10.1007/978-3-642-18930-2_15. [DOI] [PubMed] [Google Scholar]
- 9.Holz MK, Ballif BA, Gygi SP, Blenis J. mTOR and S6K1 mediate assembly of the translation preinitiation complex through dynamic protein interchange and ordered phosphorylation events. Cell. 2005;123:569–580. doi: 10.1016/j.cell.2005.10.024. [DOI] [PubMed] [Google Scholar]
- 10.Inoki K, Li Y, Zhu T, Wu J, Guan K-L. TSC2 is phosphorylated and inhibited by Akt and suppresses mTOR signalling. Nat Cell Biol. 2002;4:648–657. doi: 10.1038/ncb839. [DOI] [PubMed] [Google Scholar]
- 11.Ma L, Chen Z, Erdjument-Bromage H, Tempst P, Pandolfi PP. Phosphorylation and functional inactivation of TSC2 by Erk implications for tuberous sclerosis and cancer pathogenesis. Cell. 2005;121:179–193. doi: 10.1016/j.cell.2005.02.031. [DOI] [PubMed] [Google Scholar]
- 12.Wang H, Kubica N, Ellisen LW, Jefferson LS, Kimball SR. Dexamethasone represses signaling through the mammalian target of rapamycin in muscle cells by enhancing expression of REDD1. J Biol Chem. 2006;281:39128–39134. doi: 10.1074/jbc.M610023200. [DOI] [PubMed] [Google Scholar]
- 13.Lin L, Qian Y, Shi X, Chen Y. Induction of a cell stress response gene RTP801 by DNA damaging agent methyl methanesulfonate through CCAAT/enhancer binding protein. Biochemistry. 2005;44:3909–3914. doi: 10.1021/bi047574r. [DOI] [PubMed] [Google Scholar]
- 14.Wang Z, Malone MH, Thomenius MJ, Zhong F, Xu F, Distelhorst CW. Dexamethasone-induced gene 2 (dig2) is a novel pro-survival stress gene induced rapidly by diverse apoptotic signals. J Biol Chem. 2003;278:27053–27058. doi: 10.1074/jbc.M303723200. [DOI] [PubMed] [Google Scholar]
- 15.Brugarolas J, Lei K, Hurley RL, Manning BD, Reiling JH, Hafen E, Witters LA, Ellisen LW, Kaelin WG., Jr Regulation of mTOR function in response to hypoxia by REDD1 and the TSC1/TSC2 tumor suppressor complex. Genes Dev. 2004;18:2893–2904. doi: 10.1101/gad.1256804. [DOI] [PMC free article] [PubMed] [Google Scholar]
- 16.Shoshani T, Faerman A, Mett I, Zelin E, Tenne T, Gorodin S, Moshel Y, Elbaz S, Budanov A, Chajut A, Kalinski H, Kamer I, Rozen A, Mor O, Keshet E, Leshkowitz D, Einat P, Skaliter R, Feinstein E. Identification of a novel hypoxia-inducible factor 1-responsive gene, RTP801, involved in apoptosis. Mol Cell Biol. 2002;22:2283–2293. doi: 10.1128/MCB.22.7.2283-2293.2002. [DOI] [PMC free article] [PubMed] [Google Scholar]
- 17.DeYoung MP, Horak P, Sofer A, Sgroi D, Ellisen LW. Hypoxia regulates TSC1/2-mTOR signaling and tumor suppression through REDD1-mediated 14-3-3 shuttling. Genes Dev. 2008;22:239–251. doi: 10.1101/gad.1617608. [DOI] [PMC free article] [PubMed] [Google Scholar]
- 18.Dennis MD, Coleman CS, Berg A, Jefferson LS, Kimball SR. REDD1 enhances protein phosphatase 2A-mediated dephosphorylation of Akt to repress mTORC1 signaling. Sci Signal. 2014;7:ra68. doi: 10.1126/scisignal.2005103. [DOI] [PMC free article] [PubMed] [Google Scholar]
- 19.Dungan CM, Wright DC, Williamson DL. Lack of REDD1 reduces whole body glucose and insulin tolerance, and impairs skeletal muscle insulin signaling. Biochem Biophys Res Commun. 2014;453:778–783. doi: 10.1016/j.bbrc.2014.10.032. [DOI] [PubMed] [Google Scholar]
- 20.Williamson DL, Li Z, Tuder RM, Feinstein E, Kimball SR, Dungan CM. Altered nutrient response of mTORC1 as a result of changes in REDD1 expression: effect of obesity vs. REDD1 deficiency. J Appl Physiol. 2014;117:246–256. doi: 10.1152/japplphysiol.01350.2013. [DOI] [PMC free article] [PubMed] [Google Scholar]
- 21.Gordon BS, Williamson DL, Lang CH, Jefferson LS, Kimball SR. Nutrient-induced stimulation of protein synthesis in mouse skeletal muscle is limited by the mTORC1 repressor REDD1. J Nutr. 2015;145:708–713. doi: 10.3945/jn.114.207621. [DOI] [PMC free article] [PubMed] [Google Scholar]
- 22.McGhee NK, Jefferson LS, Kimball SR. Elevated corticosterone associated with food deprivation upregulates expression in rat skeletal muscle of the mTORC1 repressor, REDD1. J Nutr. 2009;139:828–834. doi: 10.3945/jn.108.099846. [DOI] [PMC free article] [PubMed] [Google Scholar]
- 23.Tan CY, Hagen T. mTORC1 dependent regulation of REDD1 protein stability. PLoS One. 2013;8:e63970. doi: 10.1371/journal.pone.0063970. [DOI] [PMC free article] [PubMed] [Google Scholar]
- 24.Regazzetti C, Bost F, Le Marchand-Brustel Y, Tanti JF, Giorgetti-Peraldi S. Insulin induces REDD1 expression through hypoxia-inducible factor 1 activation in adipocytes. J Biol Chem. 2010;285:5157–5164. doi: 10.1074/jbc.M109.047688. [DOI] [PMC free article] [PubMed] [Google Scholar]
- 25.Liu HW, Srinivasan M, Mahmood S, Smiraglia DJ, Patel MS. Adult-onset obesity induced by early life overnutrition could be reversed by moderate caloric restriction. Am J Physiol Endocrinol Metab. 2013;305:E785–E794. doi: 10.1152/ajpendo.00280.2013. [DOI] [PMC free article] [PubMed] [Google Scholar]
- 26.Weindruch R, Walford RL, Fligiel S, Guthrie D. The retardation of aging in mice by dietary restriction: longevity, cancer, immunity and lifetime energy intake. J Nutr. 1986;116:641–654. doi: 10.1093/jn/116.4.641. [DOI] [PubMed] [Google Scholar]
- 27.Dean DJ, Cartee GD. Calorie restriction increases insulin-stimulated tyrosine phosphorylation of insulin receptor and insulin receptor substrate-1 in rat skeletal muscle. Acta Physiol Scand. 2000;169:133–139. doi: 10.1046/j.1365-201x.2000.00723.x. [DOI] [PubMed] [Google Scholar]
- 28.Dean DJ, Gazdag AC, Wetter TJ, Cartee GD. Comparison of the effects of 20 days and 15 months of calorie restriction on male Fischer 344 rats. Aging (Milano) 1998;10:303–307. doi: 10.1007/BF03339792. [DOI] [PubMed] [Google Scholar]
- 29.Abedelmalek S, Chtourou H, Souissi N, Tabka Z. Caloric restriction effect on proinflammatory cytokines, growth hormone, and steroid hormone concentrations during exercise in Judokas. Oxid Med Cell Longev. 2015;2015:890–898. doi: 10.1155/2015/809492. [DOI] [PMC free article] [PubMed] [Google Scholar]
- 30.Tam CS, Frost EA, Xie W, Rood J, Ravussin E, Redman LM, Pennington CT. No effect of caloric restriction on salivary cortisol levels in overweight men and women. Metabolism. 2014;63:194–198. doi: 10.1016/j.metabol.2013.10.007. [DOI] [PMC free article] [PubMed] [Google Scholar]
- 31.Cui M, Yu H, Wang J, Gao J, Li J. Chronic caloric restriction and exercise improve metabolic conditions of dietary-induced obese mice in autophagy correlated manner without involving AMPK. J Diabetes Res. 2013;2013:852–860. doi: 10.1155/2013/852754. [DOI] [PMC free article] [PubMed] [Google Scholar]
- 32.Tauriainen E, Storvik M, Finckenberg P, Merasto S, Martonen E, Pilvi TK, Korpela R, Mervaala EM. Skeletal muscle gene expression profile is modified by dietary protein source and calcium during energy restriction. J Nutr Nutr. 2011;4:49–62. doi: 10.1159/000327132. [DOI] [PubMed] [Google Scholar]
- 33.Anagnostis P, Athyros VG, Tziomalos K, Karagiannis A, Mikhailidis DP. Clinical review: the pathogenetic role of cortisol in the metabolic syndrome—a hypothesis. J Clin Endocrinol Metab. 2009;94:2692–2701. doi: 10.1210/jc.2009-0370. [DOI] [PubMed] [Google Scholar]
- 34.Misra M, Bredella MA, Tsai P, Mendes N, Miller KK, Klibanski A. Lower growth hormone and higher cortisol are associated with greater visceral adiposity, intramyocellular lipids, and insulin resistance in overweight girls. Am J Physiol Endocrinol Metab. 2008;295:E385–E392. doi: 10.1152/ajpendo.00052.2008. [DOI] [PMC free article] [PubMed] [Google Scholar]
- 35.Yuen KC, Chong LE, Riddle MC. Influence of glucocorticoids and growth hormone on insulin sensitivity in humans. Diabet Med J Br Diabet Assoc. 2013;30:651–663. doi: 10.1111/dme.12184. [DOI] [PubMed] [Google Scholar]
- 36.Anthony JC, Yoshizawa F, Anthony TG, Vary TC, Jefferson LS, Kimball SR. Leucine stimulates translation initiation in skeletal muscle of post-absorptive rats via a rapamycin sensitive pathway. Nutrition. 2000;130:2413–2419. doi: 10.1093/jn/130.10.2413. [DOI] [PubMed] [Google Scholar]
- 37.Kimball SR, Shantz LM, Horetsky RL, Jefferson LS. Leucine regulates translation of specific mRNAs in L6 myoblasts through mTOR-mediated changes in availability of eIF4E and phosphorylation of ribosomal S6. J Biol Chem. 1999;274:11647–11652. doi: 10.1074/jbc.274.17.11647. [DOI] [PubMed] [Google Scholar]
- 38.Batch BC, Shah SH, Newgard CB, Turer CB, Haynes C, Bain JR, Muehlbauer M, Patel MJ, Stevens RD, Appel LJ, Newby LK, Svetkey LP. Branched chain amino acids are novel bio-markers for discrimination of metabolic wellness. Metabolism. 2013;62:961–969. doi: 10.1016/j.metabol.2013.01.007. [DOI] [PMC free article] [PubMed] [Google Scholar]
- 39.Newgard CB, An J, Bain JR, Muehlbauer MJ, Stevens RD, Lien LF, Haqq AM, Shah SH, Arlotto M, Slentz CA, Rochon J, Gallup D, Ilkayeva O, Wenner BR, Yancy WS, Jr, Eisenson H, Musante G, Surwit RS, Millington DS, Butler MD, Svetkey LP. A branched-chain amino acid-related metabolic signature that differentiates obese and lean humans and contributes to insulin resistance. Cell Metab. 2009;9:311–326. doi: 10.1016/j.cmet.2009.02.002. [DOI] [PMC free article] [PubMed] [Google Scholar]
- 40.Dennis MD, Baum JI, Kimball SR, Jefferson LS. Mechanisms involved in the coordinate regulation of mTORC1 by insulin and amino acids. J Biol Chem. 2011;286:8287–8296. doi: 10.1074/jbc.M110.209171. [DOI] [PMC free article] [PubMed] [Google Scholar]
- 41.Sancak Y, Peterson TR, Shaul YD, Lindquist RA, Thoreen CC, Bar-Peled L, Sabatini DM. The Rag GTPases bind raptor and mediate amino acid signaling to mTORC1. Science. 2008;320:1496–1501. doi: 10.1126/science.1157535. [DOI] [PMC free article] [PubMed] [Google Scholar]
- 42.Wyllie AH. Glucocorticoid-induced thymocyte apoptosis is associated with endogenous endonuclease activation. Nature. 1980;284:555–556. doi: 10.1038/284555a0. [DOI] [PubMed] [Google Scholar]
- 43.Xia X, Kar R, Gluhak-Heinrich J, Yao W, Lane NE, Bonewald LF, Biswas SK, Lo WK, Jiang JX. Glucocorticoid-induced autophagy in osteocytes. J Bone Miner Res. 2010;25:2479–2488. doi: 10.1002/jbmr.160. [DOI] [PMC free article] [PubMed] [Google Scholar]
- 44.Onodera J, Ohsumi Y. Autophagy is required for maintenance of amino acid levels and protein synthesis under nitrogen starvation. J Biol Chem. 2005;280:31582–31586. doi: 10.1074/jbc.M506736200. [DOI] [PubMed] [Google Scholar]
- 45.Yang Z, Huang J, Geng J, Nair U, Klionsky DJ. Atg22 recycles amino acids to link the degradative and recycling functions of autophagy. Mol Biol Cell. 2006;17:5094–5104. doi: 10.1091/mbc.E06-06-0479. [DOI] [PMC free article] [PubMed] [Google Scholar]
- 46.Kelleher AR, Kimball SR, Dennis MD, Schilder RJ, Jefferson LS. The mTORC1 signaling repressors REDD1/2 are rapidly induced and activation of p70S6K1 by leucine is defective in skeletal muscle of an immobilized rat hind limb. Am J Physiol Endocrinol Metab. 2013;304:E229–E236. doi: 10.1152/ajpendo.00409.2012. [DOI] [PMC free article] [PubMed] [Google Scholar]
- 47.Murakami T, Hasegawa K, Yoshinaga M. Rapid induction of REDD1 expression by endurance exercise in rat skeletal muscle. Biochem Biophys Res Commun. 2011;405:615–619. doi: 10.1016/j.bbrc.2011.01.078. [DOI] [PubMed] [Google Scholar]
- 48.Lang CH, Frost RA, Vary TC. Acute alcohol intoxication increases REDD1 in skeletal muscle. Alcohol Clin Exp Res. 2008;32:796–805. doi: 10.1111/j.1530-0277.2008.00637.x. [DOI] [PubMed] [Google Scholar]
- 49.Qiao S, Dennis M, Song X, Vadysirisack DD, Salunke D, Nash Z, Yang Z, Liesa M, Yoshioka J, Matsuzawa S, Shirihai OS, Lee RT, Reed JC, Ellisen LW. A REDD1/TXNIP pro-oxidant complex regulates ATG4B activity to control stress-induced autophagy and sustain exercise capacity. Nat Commun. 2015;6:7014. doi: 10.1038/ncomms8014. [DOI] [PMC free article] [PubMed] [Google Scholar]
- 50.Chung JW, Jeon JH, Yoon SR, Choi I. Vitamin D3 upregulated protein 1 (VDUP1) is a regulator for redox signaling and stress-mediated diseases. J Dermatol. 2006;33:662–669. doi: 10.1111/j.1346-8138.2006.00156.x. [DOI] [PubMed] [Google Scholar]
- 51.Kimball SR, Do AN, Kutzler L, Cavener DR, Jefferson LS. Rapid turnover of the mTOR complex 1 (mTORC1) repressor REDD1 and activation of mTORC1 signaling following inhibition of protein synthesis. J Biol Chem. 2008;283:3465–3475. doi: 10.1074/jbc.M706643200. [DOI] [PMC free article] [PubMed] [Google Scholar]
- 52.Regazzetti C, Dumas K, Le Marchand-Brustel Y, Peraldi P, Tanti JF, Giorgetti-Peraldi S. Regulated in development and DNA damage responses -1 (REDD1) protein contributes to insulin signaling pathway in adipocytes. PLoS One. 2012;7:e52154. doi: 10.1371/journal.pone.0052154. [DOI] [PMC free article] [PubMed] [Google Scholar]
- 53.Zheng Y, Zhang W, Pendleton E, Leng S, Wu J, Chen R, Sun XJ. Improved insulin sensitivity by calorie restriction is associated with reduction of ERK and p70S6K activities in the liver of obese Zucker rats. J Endocrinol. 2009;203:337–347. doi: 10.1677/JOE-09-0181. [DOI] [PMC free article] [PubMed] [Google Scholar]
- 54.Lu Z, Xu S. ERK1/2 MAP kinases in cell survival and apoptosis. IUBMB Life. 2006;58:621–631. doi: 10.1080/15216540600957438. [DOI] [PubMed] [Google Scholar]
- 55.Yuzefovych LV, Musiyenko SI, Wilson GL, Rachek LI. Mitochondrial DNA damage and dysfunction, and oxidative stress are associated with endoplasmic reticulum stress, protein degradation and apoptosis in high fat diet-induced insulin resistance mice. PLoS One. 2013;8:e54059. doi: 10.1371/journal.pone.0054059. [DOI] [PMC free article] [PubMed] [Google Scholar]
- 56.Meng ZX, Wang L, Xiao Y, Lin JD. The Baf60c/Deptor pathway links skeletal muscle inflammation to glucose homeo-stasis in obesity. Diabetes. 2014;63:1533–1545. doi: 10.2337/db13-1061. [DOI] [PMC free article] [PubMed] [Google Scholar]
- 57.Jager J, Corcelle V, Gremeaux T, Laurent K, Waget A, Pages G, Binetruy B, Le Marchand-Brustel Y, Burcelin R, Bost F, Tanti JF. Deficiency in the extracellular signal-regulated kinase 1 (ERK1) protects leptin-deficient mice from insulin resistance without affecting obesity. Diabetologia. 2011;54:180–189. doi: 10.1007/s00125-010-1944-0. [DOI] [PubMed] [Google Scholar]


