Abstract
Zn homeostasis in animals is a consequence of avid uptake and retention, except during conditions of limited dietary availability, and/or factors such as parasites, which compete for this micronutrient or compromise retention by the host. Membrane proteins that facilitate Zn transport constitute the SLC30A (ZnT) and SLC39A (Zip) gene families. Because dietary recommendations are based on the balance between intestinal absorption and endogenous losses, we have studied Zn transporter expression of the murine intestinal-pancreatic axis to identify transporters that are likely to be involved in homeostatic control of Zn metabolism. Marked tissue specificity of expression was observed in Zn-depleted vs. Zn-adequate mice. As shown by quantitative PCR, Western blot analysis, and immunohistochemistry, intestinal Zip4 was markedly up-regulated in response to Zn-depletion conditions. The increased abundance of Zip4 is concentrated at the apical membrane of enterocytes. There are 16 ZnT and Zip transporters expressed in pancreas. Only two, ZnT1 and ZnT2 (both cellular Zn exporters), show a progressive down-regulation under Zn-depleted conditions. In Zn-adequate mice, ZnT1 is diffusely distributed in acinar cell cytoplasm and colocalizes with α-amylase but is not detected in pancreatic islets. In acinar cells during Zn depletion, ZnT1 is localized to the plasma membrane. Intestinal Zip4 up-regulation by Zn-depletion conditions is dampened in metallothionein knockout mice, suggesting that intracellular Zn pools influence these responses. The results show that Zn transporter expression in the intestinal-pancreatic axis is a component of the homeostatic regulation of this micronutrient.
Our understanding of how Zn is metabolized in animals and humans is advancing rapidly by examination of membrane proteins that facilitate Zn transport. Zn transporters fall into two gene families, SLC30A and SLC39A (1). These families are commonly referred to as ZnT and Zip transporters, respectively.
Zn metabolism has been defined partially in studies with humans and animals by using radioactive and stable isotopes (reviewed in ref. 2). Kinetic analyses and metabolic modeling have established the major pathways by which this micronutrient is processed and how organ systems produce an effective homeostatic control over absorption and excretion. The current Dietary Reference Intake (Institute of Medicine of the National Academies, Washington, DC) recommendations for Zn intake by humans are based on a balance between intestinal absorption and endogenous losses by using these metabolic assessments (3).
Dietary Zn restriction leads to an up-regulation of the mediated component of the Zn-absorptive pathway in rodents, presumably by means of changes programmed in intestinal cells (4). Loss of endogenous Zn from intestinal and pancreatic secretions are concomitantly reduced during Zn restriction (reviewed in refs. 5 and 6). Urinary losses of Zn are low, indicative of high reabsorptive capacity, and they are refractory to change over a wide Zn-intake range (6). Furthermore, metabolic studies have identified organ systems that influence Zn metabolism and its response to physiologic stimuli, including hormones, cytokines, and growth factors (reviewed in ref. 5). Induction of metallothionein (MT) gene expression, which is usually concurrent with enhanced cellular Zn acquisition, has been integrated into all of these aspects of cellular Zn trafficking.
Zn transporters are essential components of systems that influence Zn trafficking in times of dietary depletion or excess, such as during acute and chronic physiologic stress (e.g., infection and inflammation) and during pregnancy and lactation. Therefore, experiments with mice were designed to show the differential expression of ZnT and Zip transporter genes associated with dietary Zn restriction and excess. The data presented here identify the transporters critical for regulation of Zn homeostasis in intestinal absorptive cells, as well as pancreatic acinar cells.
Materials and Methods
Mice and Treatments. Young adult male CD-1 strain mice (Charles River Breeding Laboratories) were housed and fed as described in detail in refs. 7 and 8. Mice were fed one of three dietary Zn levels [Zn- (<1 mg/kg), Zn normal (ZnN; 30 mg/kg), or Zn+ (150 mg/kg)], which represent depleted, adequate, or excessive intakes of Zn, respectively. Mice were fed individually for up to 21 days. Blood was collected by cardiac puncture under halothane anesthesia for measurement of the serum Zn concentration (7), and preparation of peripheral blood mononuclear cells (PBMCs) was performed by using NycoPrep 1.077 (Life Technologies, Grand Island, NY) gradient centrifugation. MT knockout mice and appropriate 129/SvCP strain controls (The Jackson Laboratory) were used as described (9) for some experiments. Protocols were approved by the University of Florida Institutional Animal Care and Use Committee.
Real-Time PCR for Transporter Expression. Tissues (intestine, 7 cm; starting 0.3 cm caudal to the pyloric sphincter and pancreas) were excised rapidly after exsanguination and homogenized immediately in TriPure reagent (Roche Diagnostics), and total RNA was isolated. RNA from PBMCs was also obtained by using TriPure reagent. Before quantitative PCR (Q-PCR), all samples were treated with DNase (Ambion, Austin, TX). Sequences for transporter genes were obtained from GenBank, and primers and probe sets were designed by using primer express software (version 2.0, Applied Biosystems). These primers and probes are given in Table 1, which is published as supporting information on the PNAS web site. For Q-PCR, we used TaqMan chemistry for fluorescence detection and one-step reverse-transcriptase reactions (Applied Biosystems) and a fluorimetric sequence detector (Bio-Rad). The 18S rRNA primer-probe set was obtained from Applied Biosystems, and the set for murine MT-1 was developed previously (7). Relative quantitation used five log10 standard curves with 18S rRNA as the normalizer, as described in refs. 8 and 10.
Antibody Production. The peptides GTRPQVHSGXE (11), HAQKDSGSHP, and AEETPELLNPETRRL (12) were used to produce antibodies in rabbits to ZnT1, ZnT2, and Zip4, respectively. Peptides were analyzed by MS to assess purity. A C-terminal cysteine was added to each peptide to facilitate conjugation to keyhole limpet hemocyanin (KLH) to create the antigens and for conjugation to Sulfo-link (Pierce) matrix to immobilize each peptide for affinity chromatography. These methods are described in refs. 11 and 13. Goat anti-α-amylase IgG was obtained from Santa Cruz Biotechnology.
Western Blot Analysis of Membrane Proteins. Intestinal samples (as described above) were homogenized immediately in cold buffer (20 mM Hepes, pH 7.4/1 mM EDTA/300 mM mannitol) containing a protease inhibitor mixture (Sigma) by using a Potter-Elvehjem homogenizer. A membrane protein preparation (pellet) was prepared by centrifugation (100,000 × g) after nuclei and debris were first removed by centrifugation at 1,000 × g. The proteins were resolved by PAGE using 10% gels, transferred to poly(vinylidene difluoride) membrane (Millipore), incubated with the appropriate affinity-purified IgG, and visualized by chemiluminescence detection with a PhosphorImager (Molecular Dynamics). Details of these procedures have been presented (11, 13).
Immunohistology. Tissue sections (proximal jejunum and pancreas) were fixed with 10% formalin in PBS, embedded in paraffin, cut as 5-μM sections, and mounted. Incubation with primary antibodies (10 μg/ml) was followed by addition of anti-rabbit IgG-Alexa 594 conjugate or anti-goat IgG-FITC conjugate (Molecular Probes). As negative controls, the respective peptides that were used as the antigens were incubated with the primary antibody before exposure to the tissue section. Counterstaining of nuclei was performed with 4′,6-diamidino-2-phenylindole. We used an Axiovert microscope (Zeiss) and charge-coupled device (CCD) camera (Diagnostic Instruments, Sterling Heights, MI) for microscopy and image analysis.
Pancreatic Cell Isolation. Acinar cells and islets were obtained from pancreas after collagenase digestion as described in ref. 14, except with discontinuous gradients of Percoll (Amersham Biosciences).
Statistical Analysis. Data are expressed as means ± SEM and were analyzed by one-way ANOVA, followed by the Student-Newman-Keuls multiple-comparison test. The significance level was set at P < 0.05.
Results
Our results show that Zip and ZnT transporters exhibit remarkable tissue specificity in mice. Furthermore, differential expression of both negative and positive responsiveness to dietary Zn is evident.
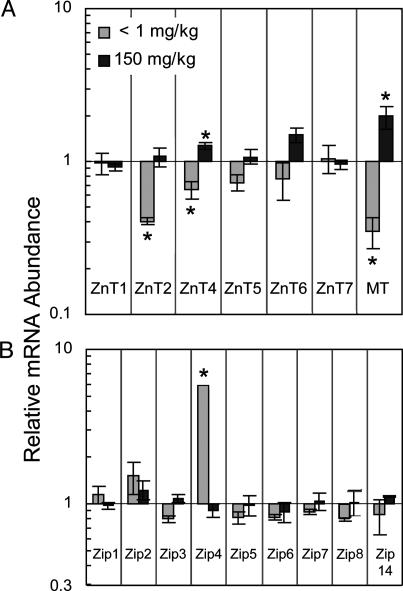
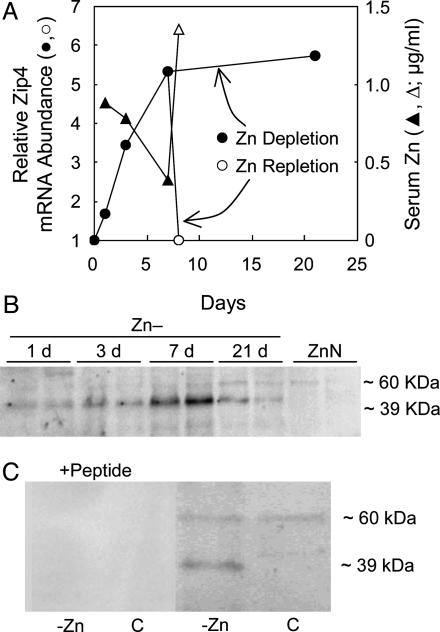
Transporter transcript abundance in small intestine is shown in Fig. 1. The mice were fed the Zn-, ZnN, or Zn+ diets for 21 days. ZnT2, ZnT4, ZnT5, and ZnT6 mRNA levels were related directly to dietary Zn level in a similar fashion, but they were of lesser magnitude than MT mRNA (Fig. 1 A). ZnT2 and ZnT4 were the only members of the ZnT gene family whose abundance was changed significantly by Zn- conditions. ZnT8 was not detected in small intestine. The most notable change in transcript abundance produced by the Zn depletion was the significant 6-fold up-regulation of Zip4 mRNA (Fig. 1B). Zip4 produces transcripts of two sizes, both of which were detected with the primer-probe set used in these experiments. The progression of Zip4 mRNA up-regulation during 21 days of Zn depletion is shown in Fig. 2A. Sensitivity of the signaling system is such that increased Zip4 mRNA is observed after the Zn- diet is fed for only 1 day. It is of note that providing the adequate amount of Zn (repletion) in the diet (ZnN) for 1 day after the 7-day depletion returned Zip4 mRNA to the basal level. In contrast, the serum Zn concentration (a measure of Zn status) decreased during the Zn depletion but returned to basal level with 1-day repletion. Western blot analyses of intestinal membrane proteins showed that, by day 7 of depletion, Zip4 protein (lower band of ≈39 kDa) was increased markedly, but it decreased in abundance by day 21 (Fig. 2B). It is of interest that, although the 39-kDa band increased markedly, the band of ≈60 kDa appeared to be constitutively expressed. These results show that the Zip4 gene is capable of rapidly responding to the dietary Zn supply. The only significant change produced by Zn supplementation on Zn transporter expression was the up-regulation of ZnT4 in mRNA in small intestine (Fig. 1 A).
Fig. 1.
Q-PCR analysis of ZnT and Zip transcript abundance in mouse small intestine. Each relative abundance was calculated by using 18S rRNA as the normalizer. Values given as means ± SEM (n = 3). Transcript levels in response to low (Zn-, <1 mg/kg) or high (Zn+, 150 mg/kg) Zn diet relative to adequate (ZnN, 30 mg/kg) Zn diet after the mice were fed for 21 days. (A) ZnT transcript levels. MT mRNA is shown as an example of a Zn-responsive gene. (B) Zip transcript levels. *, P < 0.05, compared with ZnN group.
Fig. 2.
Intestinal Zip4 expression as a function of Zn depletion. Mice were fed the Zn- diet for up to 21 days. After 7 days, one group of Zn- mice was repleted with Zn by feeding the ZnN (Zn-adequate) diet for 1 day. (A) Relative abundance of Zip4 mRNA is shown compared with levels in ZnN mice at each time point. It was calculated by using 18S rRNA as the normalizer. Values are given as means ± SEM (n = 3). Serum Zn concentrations in response to Zn- depletion and ZnN repletion are shown. (B) Western blot analysis of total intestinal membrane proteins showing change in Zip4 protein abundance. Estimated molecular masses are also shown. Increase in the 39-kDa Zip4 band occurs in Zn- mice with a 60-kDa band, which is constitutively expressed. (C) Both signals were blocked by preincubating antibody with the Zip4 peptide.
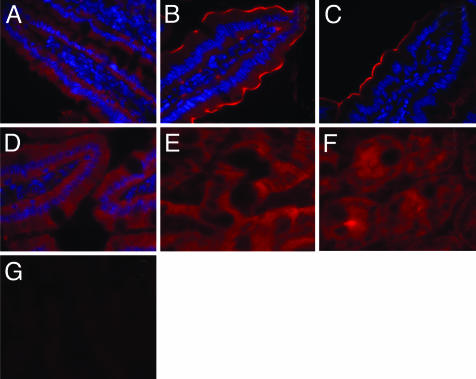
Immunohistochemistry with affinity-purified antibody showed that Zip4 was expressed in enterocytes but not in goblet cells or cells within the lamina propria (Fig. 3 A and B). Localization appeared to change during Zn depletion. In agreement with the Western blot analyses, Zip4 was most abundant after 7 days of Zn- conditions (Fig. 3B) but with levels that were still above those of the Zn-adequate mice at 21 days of depletion (Fig. 3 A vs. C). Sections from Zn- mice showed marked Zip4 fluorescence concentrated near the microvilli, at the apical membrane of enterocytes along the entire villus (Fig. 3B). This localization was not observed in other conditions of Zn status. Repletion with the ZnN diet for only 1 day reduced Zip4 to nearly the basal level (Fig. 3 A vs. D). It is of interest to note the fairly uniform Zip4 fluorescence in crypt cells in ZnN mice (Fig. 3F) compared with crypts of Zn- mice after 7 days (Fig. 3E). Incubation of the affinity-purified anti-Zip4 IgG with Zip4 peptide before labeling abolished the fluorescence, thus establishing specificity of the IgG (Fig. 3G).
Fig. 3.
Immunofluorescence microscopy showing changes in Zip4 protein in murine small intestine during Zn depletion, repletion, and supplementation. Sections from specific regions were incubated individually with Zip4 antibody, followed by IgG-Alexa 594 conjugate. Nuclei are counterstained with 4′,6-diamidino-2-phenylindole. Tissue sections were from mice fed as follows: Villus, ZnN (A); Villus, Zn-, 7 days (B); Villus, Zn-, 21 days (C); Villus, ZnN, repleted for 1 day (D); Crypts, ZnN (E); Crypts, Zn-, 7 days (F); and Villus, Zn-, 7 days (after antibody was preincubated with Zip4 peptide) (G).
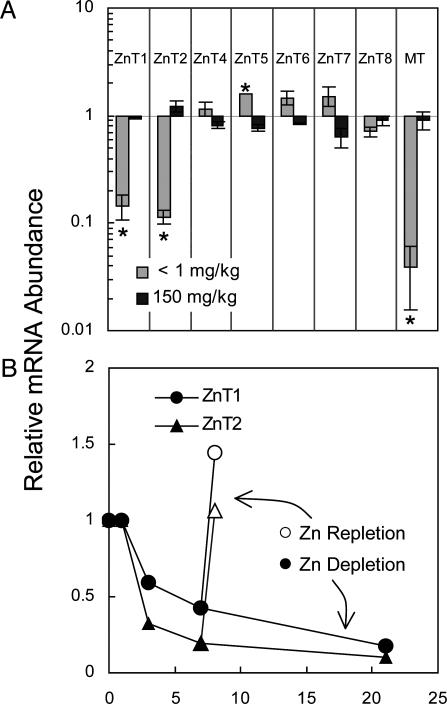
Pancreatic secretions account for a major loss of endogenous Zn. That special relationship required an examination of Zn transporter expression in this exocrine and endocrine organ. Although transcripts for Zip1 through Zip8 and ZIP14 were detected in pancreas (mostly at low abundance), none were influenced significantly by either the Zn- or Zn+ diets after 21 days (data not shown). However, abundance of both pancreatic ZnT1 and ZnT2 mRNAs were reduced significantly (≈10-fold) during Zn depletion (Fig. 4A). For the purpose of comparative Zn responsiveness, the very marked change (≈35-fold) in pancreatic MT mRNA is also shown. ZnT5 mRNA levels were slightly but significantly up-regulated by Zn deficiency (Fig. 4A). Down-regulation of pancreatic ZnT1 and ZnT2 transcripts was detectable when the Zn- diet was provided for only 3 days (Fig. 4B). There was a progressive decline throughout the 21 days where Zn- conditions were tested. Repletion for 1 day returned ZnT1 and ZnT2 mRNA levels to those observed under ZnN conditions. This response of pancreatic ZnT1 and ZnT2 is as rapid as that of intestinal Zip4.
Fig. 4.
Q-PCR analysis of ZnT transcript abundance in mouse pancreas. Each relative abundance was calculated by using 18S rRNA as the normalizer. Values are given as means ± SEM (n = 3). (A) ZnT transcript levels in response to low (Zn-, 1 mg/kg) or high (Zn+, 150 mg/kg) Zn diets relative to the Zn-adequate (ZnN, 30 mg/kg) diet after the mice were fed for 21 days. *, P < 0.05, compared with ZnN group. Pancreatic MT mRNA is shown as an example of a Zn-responsive gene. (B) ZnT1 and ZnT2 transcript levels decrease as a function of Zn depletion over 21 days. After 7 days, one group of mice was repleted with Zn by feeding the ZnN (Zn-adequate) diet for 1 day.
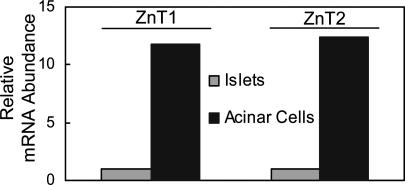
The hypothesis that the pancreas is a key regulator of Zn homeostasis through secretion of endogenous Zn points to involvement of the acinar cells and their exocrine function rather than the hormone-producing islets. The very high abundance of these transcripts in isolated acinar cells and very low abundance in isolated islets are evidence that acinar cells are the major ZnT1- and ZnT2-expressing cells of the pancreas (Fig. 5).
Fig. 5.
ZnT1 and ZnT2 expression in isolated mouse pancreatic acinar cells and islets. Mice were fed the ZnN diet. Q-PCR analysis shows abundance of ZnT1 and ZnT2 mRNAs in acinar cells relative to islets. 18S rRNA was the normalizer.
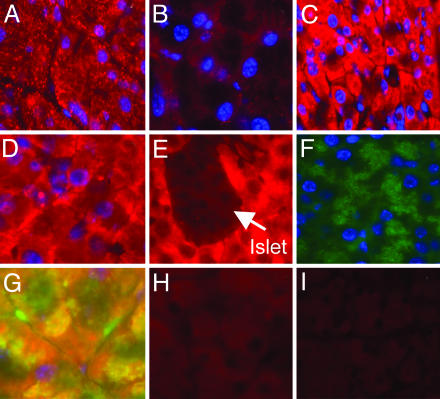
ZnT2 exhibits a distinct vesicular localization in acinar cells in Zn-adequate mice (Fig. 6A) that is nearly absent in Zn-deficient mice (Fig. 6B). In acinar cells of mice fed adequate Zn, immunodetectible ZnT1 is found distributed throughout the cytoplasm (Fig. 6C). Islets are devoid of any ZnT1 fluorescence (Fig. 6E). In contrast, in Zn-depleted mice, ZnT1 fluorescence is less intense and is concentrated at the plasma membrane (Fig. 6D). In the acinar cells of the Zn-adequate mice, α-amylase appears to be distributed in specific areas of the cytoplasm, presumably secretory granules (Fig. 6F). Colocalization of α-amylase and ZnT1 is observed, as shown in Fig. 6G (yellow).
Fig. 6.
Immunofluorescence microscopy showing changes in pancreatic ZnT1 and ZnT2 in response to Zn depletion. Mice were fed the ZnN or Zn- diet for 7 days. Sections were incubated individually with ZnT1 or ZnT2 antibody, followed by IgG-Alexa conjugate (red). Secondary antibody for α-amylase was FITC-IgG conjugate (green). Nuclei are counterstained with 4′,6-diamidino-2-phenylindole (blue). Fluorescences generated by ZnT1 or ZnT2 are shown in tissue sections from mice fed as follows: ZnT2, ZnN (A); ZnT2, Zn- (B); ZnT1, ZnN (C); ZnT1, Zn- (D); ZnT1 in acinar cells surrounding islet (arrow) in ZnN (E); α-Amylase in acinar cells (F); Both α-amylase and ZnT antibodies and respective secondary conjugates with the fluorescence emission images merged (G); and ZnT1 and ZnT2 peptides were preincubated with respective antibodies before addition to sections from ZnN mice (H and I).
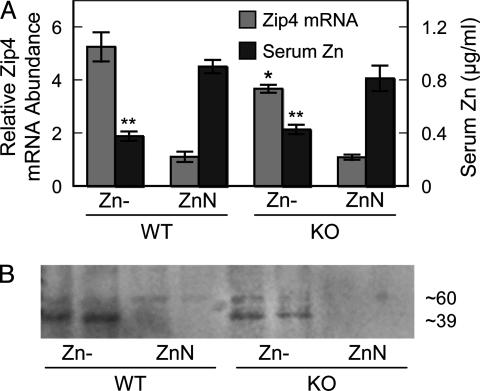
MT is a Zn-trafficking protein that is highly expressed in intestine and pancreas. Therefore, MT may influence the response of transporters in these organs to Zn depletion because MT expression is reduced markedly under the dietary conditions used here (Figs. 1 A and 4A). With MT null mice, the response of intestinal Zip4 up-regulation to the Zn- diet was significantly less at the transcript level (Fig. 7A). A concomitant decrease in Zip4 protein was also observed (Fig. 7B). The genotypic difference did not influence the depression in serum Zn concentration produced by the Zn- conditions.
Fig. 7.
Intestinal Zip4 up-regulation by Zn depletion is less in MT knockout mice than wild type. (A) Zip4 mRNA expression and serum Zn concentrations in mice fed the low (Zn-) relative to the adequate (ZnN) ZnN diet when both were fed for 7 days. Values are given as means ± SEM (n = 3). *, P < 0.05, for Zip4 mRNA compared with WT genotype mice. **, P < 0.05, for serum Zn compared with ZnN mice. (B) Western blot analysis of total intestinal membrane proteins showing decrease in Zip4 protein abundance in MT knockout mice.
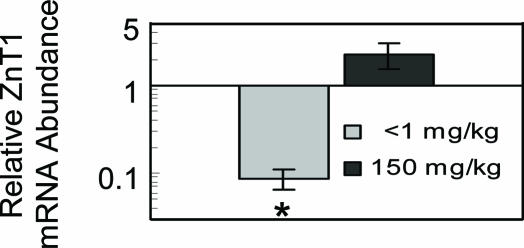
Both intestinal and pancreatic transporters exhibit tissue-specific expression that is responsive to Zn. It may be helpful to identify the transporters expressed in cells from a blood sample (i.e., PBMCs) that correlate with transporter changes in intestine and pancreas. Consequently, we examined ZnT1, ZnT2, and Zip4 expression in PBMCs from mice that were fed the three diets. ZnT1 and ZIP4 mRNAs were detected in these cells; however, only ZnT1 was significantly responsive to Zn (Fig. 8). It exhibited a pattern of responsiveness that is similar to that of MT. However, based on our Q-PCR analyses, ZnT1 mRNA produces robust amplification, whereas MT-1 mRNA has a much lower expression level. The responses of PBMC and pancreatic acinar cell ZnT1 are quite comparable (Figs. 4A and 8).
Fig. 8.
Q-PCR analysis of ZnT1 transcript abundance in mouse PBMCs. The cells were isolated from mice that were fed the low (Zn-), adequate (ZnN), or high (Zn+) Zn diet for 7 days. ZnT1 mRNA levels are expressed relative to the ZnN group by using 18S rRNA as the normalizer. Values are given as means ± SEM (n = 3). *, P < 0.05, compared with ZnN group.
Discussion
Numerous approaches have been directed toward defining the characteristics and mechanisms associated with Zn absorption by the small intestine. These approaches have been reviewed in detail (15, 16). Luminal Zn uptake by enterocytes displays saturable kinetics of transport across the apical membrane surface. Transport at the basolateral surface appears as first order, which is understandable considering a very small intracellular pool of free Zn. When the dietary Zn supply diminishes, the ability of the intestine to absorb Zn from the diet increases. This process appears to be programmed by information presented to absorptive cells because intestines of rats removed from the animal retain the ability to absorb Zn based on previous dietary Zn intake (4). The inducible nature of the Zn-trafficking protein MT has been suggested as a component of this regulatory system (9, 15, 16). Some evidence suggests that this protein functions in intestinal Zn retention (17). Furthermore, evidence has been presented showing that intestinal Zn transport also occurs in the serosal-to-luminal direction (4). Losses of endogenous Zn may occur via this route.
Evidence that Zn acquisition from the diet is regulated by one or more genes has rested with the rare genetic disorder acrodermatitis enteropathica (AE). AE patients exhibit a Zn mal-absorption syndrome (reviewed in ref. 18). The gene that is responsible for AE appears essential for Zn absorption from complex diets. In agreement with the demonstration that Zn malabsorption occurs in AE, Zn uptake by isolated intestinal cells from AE patients is abnormally low, and supplemental Zn causes remission of AE symptoms. The gene that is responsible for AE was identified as Zip4, a member of the SLC39A gene family of Zn transporters (12, 19).
AE patients become symptomatic only when removed from human milk (i.e., at weaning), which is a source of highly available Zn. This occurrence suggests that Zip4 is a transporter that is important when the dietary Zn supply is low. As shown in the present experiments, Zip4 is the only intestinal transporter gene of the surveyed 16 gene transcripts that up-regulates when mice are fed a Zn-deficient diet. It is of note, however, that the up-regulation of Zip4 in Zn-depleted mice is not sufficient to produce a return of plasma Zn concentrations to the normal level. In mice fed an adequate amount of Zn, expression of Zip4 is very low. This finding is consistent with the low level of intestinal Zn absorption (≈30%) observed when rodents are fed with a Zn-adequate diet (3, 5). Of particular interest is the fact that, at 21 days of Zn depletion, Zip4 protein expression is reduced compared with after only 7 days. This reduction could be due, in part, to a general shutdown of intestinal protein synthesis in mice after 21 days of depletion because their villus tips were considerably atrophied. Recently, Zip4 was found to up-regulate with dietary Zn depletion in pregnant mice (20). Furthermore, cells transfected with Zip4 exhibited enhanced Zn uptake where saturable kinetics were observed (20). Our results suggest that, under usual dietary conditions, multiple transporters are expressed and the relative abundance of these transporter proteins and their transporter affinities determine the overall magnitude of Zn absorption.
During progression of Zip4 induction initiated by Zn depletion, this protein becomes intensely localized to the apical plasma membrane. In Zn-adequate mice, the weak Zip4 signal is distributed diffusely throughout enterocytes. Such a difference suggests that, when dietary Zn levels are low, the increased Zip4 produced is shunted to the brush border. This localization is in contrast to ZnT1, which is localized primarily to the basolateral membrane of enterocytes. The latter finding agrees with our previous findings (11) for ZnT1, which has been convincingly shown to have an export function (21, 22). It is also of note that Zip4 protein is expressed in the intestinal crypts, but its localization and abundance appear to change only in enterocytes. This observation widens speculation about the mechanism of the induction of Zip4 mRNA in Zn depletion and its rapid down-regulation upon Zn repletion. The sensing mechanism is likely to be operative within enterocytes. Thus, the stimulus for up-regulation may not program immature enterocytes before migration from the crypts. Activation characteristics for Zip4 argue against a metal-responsive transcription factor 1 (MTF1)-mediated mode of gene control, which exhibits a positive mode of Zn responsiveness (23). Moreover, intestinal Zip4 appears to up-regulate (increasing apical Zn transport) to counter a Zn depletion, and it occurs with a concurrent decrease in expression of MT. Hence, the marked decrease in Zip4 in MT null mice is puzzling. This observation may suggest that MT serves as a store of labile Zn2+, which produces a feedback signal for Zip4 up-regulation in Zn depletion, but without that pool in the null mice, the signal to up-regulate Zip4 may not occur. Furthermore, we cannot rule out activation by an endogenous stimulatory factor that is analogous to hepcidin (a liver-produced peptide that controls intestinal iron absorption by interaction with ferroportin, which is the iron export transporter located at the basolateral membrane of enterocytes) (24). However, the apical orientation of Zip4 argues against an endogenous factor that interacts directly with this transporter. Other potential factors that could signal Zip4 up-regulation would be a regulatory hormone, a repressor that responds to loss of Zn occupancy during Zn depletion, or release of agents that signal apoptosis. The latter possibility envisions Zip4 up-regulation as a cellular-survival mechanism against apoptosis by acquisition of needed Zn. Such a possibility is the analogous up-regulation of Zip2 expression in THP1 mononuclear cells during Zn depletion with the intracellular chelator N, N, N′, N′-tetrakis(2-pyridylmethyl)ethylenediamine (TPEN) (10, 25). Under these conditions, Zip2 is up-regulated during the very early stages of apoptosis. Induction of a high-efficiency transporter system to replenish cellular Zn needs was suggested as a rationale to explain up-regulation of transporter expression during TPEN-induced Zn depletion of mononuclear cells (25).
Availability of radioactive Zn for biological studies commenced >60 years ago and soon led to identification of the pancreas as a site of high Zn turnover (26, 27) and, subsequently, the belief that endogenous Zn was excreted by means of pancreatic exocrine secretions (28). In addition, pancreatic acinar cells appeared to have very high 65Zn turnover rates compared with islet tissue (29). Pharmacokinetic modeling has identified the pancreas, along with the intestine, liver, kidney, and spleen, as organs displaying the highest rates of Zn flux (30). Furthermore, 4 decades ago, Cotzias et al. (31) clearly established that Zn metabolism was homeostatically regulated and that the responsible mechanisms controlled intestinal absorption and excretion. Subsequently, the Zn content of pancreatic secretions was shown to decrease drastically in Zn depletion (32, 33). This decrease was concurrent with decreased acinar tissue granularity but with no apparent change in pancreatic metalloenzymes. Some evidence suggests Zn is incorporated into pancreatic proteins before secretion (34). More recent evidence suggests that MT is released by pancreatic acinar cells and serves as a vehicle for Zn secretion (35). In that regard, the simultaneous reduction in pancreatic ZnT1, ZnT2, and MT expression that we observed in Zn-deficient mice may indicate some linkage of the functions of these proteins.
Few studies have focused on ZnT2 and its proposed role in facilitating Zn transport into a vesicular compartment (36). We found ZnT2 is up-regulated in small intestine by high dietary Zn intakes and during very late-stage gestation and early lactation in maternal and fetal tissues (13). The latter physiologic states represent periods of high Zn mobility. Similarly, the lateral lobes of the prostate have a very high Zn content, which correlates with high ZnT2 expression (37). The association of ZnT2 with high cellular Zn concentrations and its vesicular localization suggest that this transporter in the pancreas may function through an exocytotic pathway before incorporation of Zn into secreted pancreatic proteins to control endogenous losses.
The present experiments identify the intestinal-pancreatic axis as an important homeostatic control site for Zn metabolism in mice. The experiments reported here provide an early inquiry into understanding mammalian Zn metabolism at the level of transporter expression. The emerging pattern is that, at this level of granularity, tissue specificity and two modes of Zn responsiveness for both Zn transporter gene families are important components. Studies with human subjects have confirmed the properties of Zn homeostasis in response to dietary Zn intake levels and the role of intestinal absorption and endogenous secretions (2, 6, 38). It is likely that the pathways controlling Zn homeostasis in mice will have similarities to those that are operative in humans.
Supplementary Material
Acknowledgments
We thank Dr. Raymond K. Blanchard, Dr. Calvert L. Green, Dr. Mitchell D. Knutson, and Pat Lewis for helpful suggestions. This work was supported by National Institutes of Health Grant DK 31127, the Boston Family Endowment Funds of the University of Florida Foundation, and the Florida Agricultural Experiment Station, and it was approved for publication as Journal Series R-10436.
Abbreviations: MT, metallothionein; Q-PCR, quantitative PCR; PBMC, peripheral blood mononuclear cell; ZnN, Zn normal; AE, acrodermatitis enteropathica.
References
- 1.Liuzzi, J. P. & Cousins, R. J. (2004) Annu. Rev. Nutr. 24, 151-172. [DOI] [PubMed] [Google Scholar]
- 2.Wastney, M. E., House, W. A., Barnes, R. M. & Subramanian, K. N. (2000) J. Nutr. 130, 1355S-1359S. [DOI] [PubMed] [Google Scholar]
- 3.Panel on Micronutrients, Subcommittees on Upper Reference Levels of Nutrients and of Interpretation and Use of Dietary Reference Intakes, and the Standing Committee on the Scientific Evaluation of Dietary Reference Intakes (2002) in Dietary Reference Intakes for Vitamin A, Vitamin K, Arsenic, Boron, Chromium, Copper, Iodine, Iron, Manganese, Molybdenum, Nickel, Silicon, Vanadium, and Zinc, eds. Food and Nutrition Board (Natl. Acad. Press, Washington, DC), pp. 442-501.
- 4.Hoadley, J. E., Leinart, A. S. & Cousins, R. J. (1987) Am. J. Physiol. 252, G825-G831. [DOI] [PubMed] [Google Scholar]
- 5.Cousins, R. J. (1996) in Present Knowledge in Nutrition, eds. Filer, L. J. & Ziegler, E. E. (ILSI, Washington, DC), 7th Ed., pp. 293-306.
- 6.King, J. C., Shames, D. M. & Woodhouse, L. R. (2000) J. Nutr. 130, 1360S-1366S. [DOI] [PubMed] [Google Scholar]
- 7.Moore, J. B., Blanchard, R. K., McCormack, W. T. & Cousins, R. J. (2001) J. Nutr. 131, 3189-3196. [DOI] [PubMed] [Google Scholar]
- 8.Moore, J. B., Blanchard, R. K. & Cousins, R. J. (2003) Proc. Natl. Acad. Sci. USA 100, 3883-3888. [DOI] [PMC free article] [PubMed] [Google Scholar]
- 9.Davis, S. R., McMahon, R. J. & Cousins, R. J. (1998) J. Nutr. 128, 825-831. [DOI] [PubMed] [Google Scholar]
- 10.Cousins, R. J., Blanchard, R. K., Popp, M. P., Liu, L., Cao, J., Moore, J. B. & Green, C. L. (2003) Proc. Natl. Acad. Sci. USA 100, 6952-6957. [DOI] [PMC free article] [PubMed] [Google Scholar]
- 11.McMahon, R. J. & Cousins, R. J. (1998) Proc. Natl. Acad. Sci. USA 95, 4841-4846. [DOI] [PMC free article] [PubMed] [Google Scholar]
- 12.Wang, K., Zhou, B., Kuo, Y. M., Zemansky, J. & Gitschier, J. (2002) Am. J. Hum. Genet. 71, 66-73. [DOI] [PMC free article] [PubMed] [Google Scholar]
- 13.Liuzzi, J. P., Bobo, J. A., Cui, L., McMahon, R. J. & Cousins, R. J. (2003) J. Nutr. 133, 342-351. [DOI] [PubMed] [Google Scholar]
- 14.Gotoh, M., Maki, T., Kiyoizumi, T., Satomi, S. & Monaco. A. P. (1985) Transplantation 40, 437-438. [DOI] [PubMed] [Google Scholar]
- 15.Lönnerdal, B. (1989) in Zinc in Human Biology, ed. Mills, C. F. (Springer, New York), pp. 33-55.
- 16.Cousins, R. J. (1989) in Mineral Absorption in the Monogastric GI Tract: Chemical, Nutritional and Physiological Aspects, eds. Laszlo, J. A. & Dintzis, F. R. (Plenum, New York), pp. 3-12.
- 17.Coyle, P., Philcox, J. C. & Rofe, A. M. (1999) J. Nutr. 129, 372-379. [DOI] [PubMed] [Google Scholar]
- 18.Aggett, P. J. (1989) in Zinc in Human Biology, ed. Mills, C. F. (Springer, New York), pp. 259-279.
- 19.Kury, S., Dreno, B., Bezieau, S., Giraudet, S., Kharfi, M., Kamoun, R. & Moisan, J. P. (2002) Nat. Genet. 31, 239-240. [DOI] [PubMed] [Google Scholar]
- 20.Dufner-Beattie, J., Wang, F., Kuo, Y. M., Gitschier, J., Eide, D. & Andrews, G. K. (2003) J. Biol. Chem. 278, 33474-33481. [DOI] [PubMed] [Google Scholar]
- 21.Palmiter, R. D., Findley, S. D. (1995) EMBO J. 14, 639-649. [DOI] [PMC free article] [PubMed] [Google Scholar]
- 22.Palmiter, R. D. (2004) Proc. Natl. Acad. Sci. USA 101, 4918-4923. [DOI] [PMC free article] [PubMed] [Google Scholar]
- 23.Wang, Y., Wimmer, U., Lichtlen, P., Inderbitzin, D., Stieger, B., Meier, P. J., Hunziker, L., Stallmach, T., Forrer, R., Rulicke, T., et al. (2004) FASEB J. 18, 1071-1079. [DOI] [PubMed] [Google Scholar]
- 24.Nicolas, G., Bennoun, M., Porteu, A., Mativet, S., Beaumont, C., Grandchamp, B., Sirito, M., Sawadogo, M., Kahn, A. & Vaulont, S. (2002) Proc. Natl. Acad. Sci. USA 99, 4596-4601. [DOI] [PMC free article] [PubMed] [Google Scholar]
- 25.Cao, J., Bobo, J. A., Liuzzi, J. P. & Cousins, R. J. (2001) J. Leukocite Biol. 70, 559-566. [PubMed] [Google Scholar]
- 26.Sheline, G. E., Chaikoff, I. L., Jones, H. B. & Montgomery, M. L. (1943) J. Biol. Chem. 149, 139-151. [Google Scholar]
- 27.Montgomery, M. L., Sheline, G. E. & Chaikoff, I. L. (1943) J. Exp. Med. 78, 151-159. [DOI] [PMC free article] [PubMed] [Google Scholar]
- 28.Birnstingl, M., Richards, V. & Stone, B. (1956) Am. J. Physiol. 186, 377-379. [DOI] [PubMed] [Google Scholar]
- 29.McIsaac, R.J. (1955) Endocrinology 57, 571-579. [DOI] [PubMed] [Google Scholar]
- 30.Jain, R. K., Gerlowski, L. E., Weissbrod, J. M., Wang, J. & Pierson, R. N., Jr., (1981) Ann. Biomed. Eng. 9, 347-361. [Google Scholar]
- 31.Cotzias, G. C., Borg, D. C. & Selleck, B. (1962) Am. J. Physiol. 202, 359-363. [Google Scholar]
- 32.Sullivan, J. F., Burch, R. E., Quigley, J. H. & Magee, D. F. (1974) Am. J. Physiol. 227, 105-108. [DOI] [PubMed] [Google Scholar]
- 33.Sullivan, J. F., Williams, R. V., Wisecarver, J., Etzel, K., Jetton, M. M. & Magee, D. F. (1981) Proc. Soc. Exp. Biol. Med. 166, 39-43. [DOI] [PubMed] [Google Scholar]
- 34.Pekas, J. C. (1971) Am. J. Physiol. 220, 799-803. [DOI] [PubMed] [Google Scholar]
- 35.De Lisle, R. C., Sarras, M. P., Jr., Hidalgo, J. & Andrews, G. K. (1996) Am. J. Physiol. 271, C1103-C1110. [DOI] [PubMed] [Google Scholar]
- 36.Palmiter, R. D., Cole, T. B. & Findley, S. D. (1996) EMBO J. 15, 1784-1791. [PMC free article] [PubMed] [Google Scholar]
- 37.Iguchi, K., Usui, S., Inoue, T., Sugimura, Y., Tatematsu, M. & Hirano, K. (2002) J. Androl. 23, 819-824. [PubMed] [Google Scholar]
- 38.Jackson, M. J. (1989) in Zinc in Human Biology, ed. Mills, C. F. (Springer, New York), pp. 1-14.
Associated Data
This section collects any data citations, data availability statements, or supplementary materials included in this article.


