Abstract
The three most important metrics in optical coherence tomography (OCT) are resolution, speed, and sensitivity. Because there is a complex interplay between these metrics, no previous work has obtained the best performance in all three metrics simultaneously. We demonstrate that a high-power supercontinuum (SC) source, in combination with parallel SD-OCT, achieves an unparalleled combination of resolution, speed, and sensitivity. This system captures cross-sectional images spanning 4×0.5 mm2 at 1,024,000 lines/s with 2×14 μm resolution (axial×transverse) at a sensitivity of 113 dB. Imaging using the proposed system is demonstrated on highly differentiated human bronchial epithelial (hBE) cells to capture and spatially localize ciliary dynamics.
Optical coherence tomography (OCT) has become one of the most effective imaging modalities for performing noninvasive, real-time biological imaging. The three most important metrics for OCT are resolution, speed, and sensitivity. However, all three cannot be limitlessly improved because they are subject to tradeoffs. High speed is necessary for capturing rapid dynamics of biological processes and transient responses to external perturbations. The highest speed system reported to date is a swept-source OCT (SS-OCT) system with a linerate of 40 MHz [1]. But, to our knowledge, no SS-OCT system has been reported that combines MHz A-line rates with the bandwidth necessary for ultrahigh resolution (< 3 axial μm). Spectral domain OCT (SD-OCT) systems use broad-bandwidth sources to achieve axial resolutions as low as 1 μm [2]. The highest speed SD-OCT system has a linerate of 1 million A-lines/sec, but offers only a modest sensitivity of 72 dB [3].
Importantly, all high speed OCT systems are subject to a tradeoff between sensitivity and speed because of limited exposure time in order to scan rapidly. Ultimately, the illumination power determines the sensitivity of an OCT system for a given framerate. At the same time, power is limited by the maximum intensity that can safely illuminate the sample. In conventional, flying-spot OCT, a focused light beam is scanned, and the maximum power that can safely be used is determined by the focal spot size. In contrast, in parallel OCT, a line focus is applied to the sample, and all A-lines are simultaneously recorded. Distributing the illumination across a line allows for higher total power while maintaining a lower peak intensity than that of flying-spot OCT. The higher power enables higher sensitivity at a given frame rate. However, parallel OCT systems have not yet demonstrated this improved sensitivity due to lack of appropriate high-power, high-bandwidth sources.
After its invention in 1999 [4], parallel OCT has seen notable improvements in speed, sensitivity and resolution. To the authors’ knowledge, the fastest speed in a parallel SD-OCT system was achieved by Grajciar et al. at 512,000 A-scans/sec with a sensitivity of 74 dB and an axial resolution of 18 μm [5]. The highest axial resolution of a parallel SD-OCT system is 1.22 μm with a sensitivity of 89 dB [6]. Zhang et al. [7] reported the highest sensitivity with a parallel OCT configuration (94 dB), with an axial resolution of 3 μm and a speed of 265,000 A-lines/sec. Recent advances in commercially available SC sources to minimize relative-intensity noise (RIN) have allowed them to be operated in the shot-noise limit for OCT [8,9], while offering an order-of-magnitude increase in power as compared to traditional OCT light sources. With higher power we can achieve higher sensitivity. Such a SC source has been recently used for endoscopic OCT with a sensitivity of 107 dB [9], and for molecular contrast OCT imaging [10].
In this Letter, we show that the use of a SC light source in combination with a parallel SD-OCT configuration offers higher sensitivity and higher frame rate than any parallel SD-OCT system reported to date, while maintaining ultrahigh resolution. We demonstrate the utility of the system by capturing the rapidly beating cilia of human bronchial-epithelial (hBE) cells in vitro.
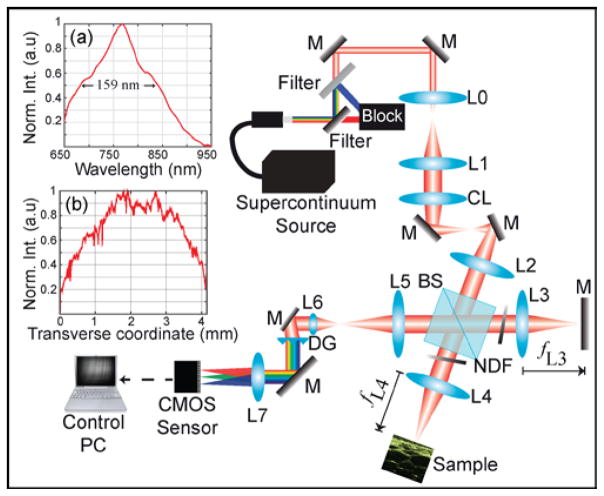
Fig. 1 shows the optical setup of the parallel SD-OCT system consisting of a 2D spectrometer, a free-space Michelson interferometer, and a cylindrical lens (CL). The optical paths for the two orthogonal planes of the parallel SD-OCT system after the CL, which is setup in an afocal configuration, are shown in Ref [11]. The SC source (SuperK Extreme EXR-15, NKT Photonics) has a repetition rate of 310 MHz and a wavelength range spanning 400–2400 nm. The combination of a lowpass and highpass filter is used to narrow the spectrum, achieving a center wavelength and bandwidth of 775 nm and 159 nm, respectively, at the sensor. The power from the filtered SC source is 1.1 W at the input of the interferometer. The collimated light is expanded from 0.7 mm to 6 mm by the use of a telescope composed of lenses L0 (fL0 = 35 mm) and L1 (fL1 = 300 mm). The beam then passes through the CL (fCL = 100 mm) before entering the 4f interferometer with achromatic lenses L2, L3, and L4 (fL2 = fL3 = fL4 = 100 mm). Because the system operates in an afocal mode, the beam after L4 is focused into a vertical line with a beam diameter of 6 mm in the vertical direction and a focused spot size of 17 μm in the horizontal direction at the sample position. The total power at the sample is 492 mW, with a power per A-line of 0.48 mW. Note that an NDF inserted into the reference arm is used to adjust the power such that the recorded interferogram is close to the saturation level of the sensor. At the same time, a matched NDF in the sample arm balances interferometer dispersion; it is normally set to no attenuation except when imaging a mirror to characterize resolution and SNR.
Fig. 1.
Illustration of the parallel SD-OCT system (Horizontal plane shown; see Ref. [11] for the vertical plane). M, mirror; NDF, neutral density filter; L, lens; BS, beam splitter. Panels (a) and (b) plot the spectrum and the transverse intensity distribution of the beam, respectively, both at the sensor plane with the sample arm blocked.
The back-scattered light from both arms are recombined at the exit of the interferometer and detected by the spectrometer. The beam is reduced to the size of the sensor by L5 (fL5 = 200 mm) and L6 (fL6 = 50 mm). The spectrometer is composed of a diffraction grating DG (600 lp/mm, Wasatch Photonics) set at its Littrow angle, an achromatic lens (fL7 = 100 mm) and a high-speed, 2D CMOS camera (FastCam SA3, Photron) placed at the back-focal plane of L7. The sample and camera planes are conjugated so that each row of the 2D CMOS array is associated with a different transverse position of the sample. The transverse field of view (FOV) imaged by our system is 4.15 mm. The camera (1024 × 1024 pixels, 17 μm × 17 μm each), converts the optical signals into 12-bit numerical values at a maximum frame rate of 1kHz with a continuous acquisition time of 1.36 s. This corresponds to an imaging speed of 1,024,000 A-scan/s used for all images in this study, which is, to our knowledge, higher than that of any previously reported parallel SD-OCT systems. We note that in this demonstration we are oversampling in the transverse direction, whereas flying-spot OCT systems can readily adjust the rate of transverse sampling. B-mode OCT images are reconstructed by subtracting the reference spectrum, digitally compensating for dispersion mismatches between the sample and reference arms using parameters pre-determined from an iterative method [12], and computing the Fourier transform along the spectral dimension of the recorded 2D interferogram.
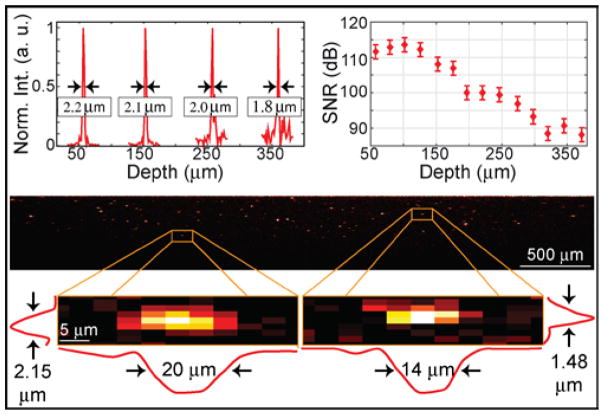
The SNR is measured versus depth by recording spectral interferograms of a silver mirror at different axial positions (top right panel of Fig. 2). SNR is determined from the B-mode image by the ratio between the maximum value within the center A-line and the standard deviation of the noise immediately surrounding the peak. The optical attenuation of a double pass through the NDF in the sample arm (73 dB) is then added back. Operating in the shot-noise limit as characterized by Ref [9], the maximum SNR is thus found to be 113 ± 2 dB at a depth of 100 μm, rolling off to 90 dB at a depth of 350 μm. This roll-off is consistent with a spectral resolution of 67 μm, is associated with the limited f-number of the imaging lens in our spectrometer [13], and could be improved with redesign. To estimate the theoretical SNR, we use the same expression as in flying-spot SD-OCT [14]; however we use the average power per A-line and then add back the 3 dB difference between the average power and the maximum power at the center A-line. In this way, the theoretical SNR is found to be 122 dB for an exposure time of 1 ms. Considering optical losses of 8 dB between the sample and detector planes, these theoretical and experimental sensitivities are in good agreement. To our knowledge, our experimental SNR of 113 dB is higher than that of the previously fastest parallel SD-OCT system (0.5 million lines/s, SNR of 78 dB) [5], and of the fastest flying-spot SD-OCT system (1 million lines/s, sensitivity of 71 dB) [3]. We also note that a parallel SS-OCT system was recently reported at 1 MHz line rate offering 90 dB [15].
Fig. 2.
Experimental evaluation of the parallel SD-OCT system. Top panels plot the measured axial response and SNR of a mirror at different depths. Bottom panel shows the reconstructed B-mode image of point-like scatterers. The insets show two point-like scatterers and their experimentally-determined lateral and axial resolutions.
As in flying-spot SD-OCT, the axial resolution (Δz) is determined by the spectral bandwidth and the center wavelength. Given the spectrum of our system, the theoretical axial resolution is 1.8 μm in air. Experimentally, Δz is measured as a function of depth from the full-width at half maximum (FWHM) of a silver mirror (top left panel of Fig. 2). We obtain Δz = 2.0 ± 0.2 μm, which is in agreement with the theoretical resolution. It is interesting to note that in parallel SD-OCT, the in-plane lateral resolution (Δx) is dictated by the limiting aperture within the collection optics (L4-L7 and DG), while the out-of-plane lateral resolution (Δy) is given by the illumination line width on the sample, (after verifying that the beam width reflected from the sample is not clipped by the collection optics). This corresponds to Δy equal to the line focus width of 17 μm, while Δx is expected to be ≤ 17 μm. To measure Δx, we image a transparent silicone sample containing a sparse distribution of point-like scatterers comprised of TiO2 powder (mean diameter <5 μm, Part No. 224227, Sigma Aldrich), as shown in Fig. 2. Twenty intense, point-like scatterers were selected at various depths, for which the FWHM of the transverse and axial profiles were determined. By averaging the results, we find Δx = 14 ± 3 μm, and Δz = 1.8 ± 0.4 μm, both of which are consistent with theory.
The advantages of the combination high-speed and high-sensitivity of SC-based parallel OCT is demonstrated by imaging an hBE culture to capture the rapid motion of cilia. Mucus provides a first line of defense against infection by trapping inhaled pathogens in our airways. Beating cilia propel mucus to the esophagus which expels pathogens from the airway. Airway diseases such as COPD are characterized by a breakdown of mucociliary clearance resulting in chronic lung infections. It is therefore beneficial to be able to assess ciliary activity at the respiratory epithelium. Previously, the beating of a single cilium tip has been tracked using a μOCT system with 1 μm axial resolution to make a direct measure of CBF [2]. Although our parallel SD-OCT is not capable of spatially resolving individual cilia, it is fast enough to detect the rapid speckle fluctuations of beating cilia, which were previously described in Ref. [16]. Importantly, the quantitative measures of ciliary activity in [2,16] were limited to individual A-lines in time (M-mode), while the use of parallel OCT in this study enables assessment of ciliary dynamics over the entire B-mode frame.
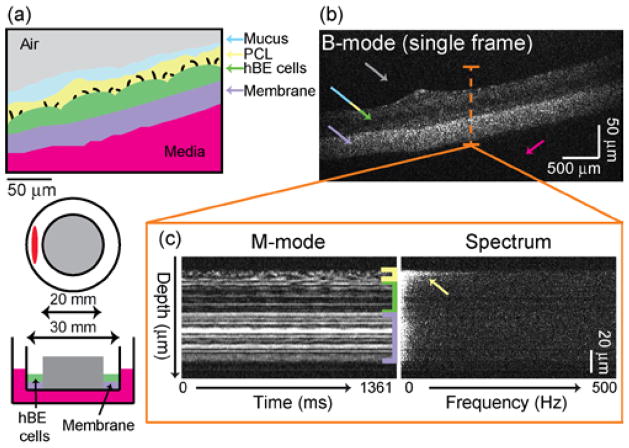
In this study, well-differentiated cultures of hBE cells demonstrating mucociliary transport are prepared as previously described [17,18]. Briefly, primary human airway epithelial cells are isolated from excess tissue by the University of North Carolina (UNC) Tissue Procurement and Cell Culture Core under protocols approved by the UNC Institutional Review Board. Then, cells are plated on collagen-coated membranes (MilliCell, Millipore, PICM03050, 0.4 μm, 30-mm diameter) and cultured at the air/liquid interface (ALI) using established protocols [17,18]. The cells form a pseudostratified mucociliary epithelium with abundant cilia at an ALI. Note that, in these studies, the culture insert is modified to create a circular track allowing mucus to be transported in a continuous circular path [19](Fig. 3(a)). Cultures are examined by conventional wide-field microscopy and those that have fully developed cilia and show continuous mucus transport are imaged.
Fig. 3.
Parallel SD-OCT of an in vitro ALI hBE culture. (a) Cartoon of an hBE culture cross-section (top) and diagram of imaging geometry (bottom). (b) B-mode OCT image of a single frame (see Visualization 1 for video at 0.4× real time). Arrows indicate features color-matched to those in panel (a). (c) M-mode image reconstructed from one A-line of the B-mode stack and its corresponding Fourier spectrum. The depth of the M-mode and spectrum image spans from 103 μm to 247 μm.
We first compare a static B-mode image (Fig. 3(b)) with the known structure of the hBE cell culture (Fig. 3(a)). From the static image, only the membrane, air, and media regions are clearly distinguishable; it is not possible to distinguish the hBE cells, the periciliary layer (PCL) or the mucus. However, regions of rapid ciliary activity become apparent in video generated from successive B-mode frames (see Visualization 1). To quantify the dynamic information, we analyzed the speckle fluctuation spectrum at each pixel. Example fluctuation spectra are displayed for a single column of data from an M-mode image (Fig. 3(c)). In this data, the PCL is attributed to a rapidly fluctuating layer with high frequency components (yellow arrow and bracket), the membrane is attributed to a highly scattering, stationary layer (purple bracket), and the hBE cells are in between (green bracket). These layers are also apparent in the full cross-sectional view in Visualization 1.
Respiratory epithelial cilia are known to beat in a time-harmonic way with a distinct ciliary beat frequency (CBF). However, the power spectrum of the resulting OCT signal amplitude is expected to contain frequency components much larger than CBF because 1) the ciliary motion is not generally sinusoidal, and 2) amplitude and phase modulation results in further nonlinearity in the OCT signal amplitude. It was previously shown that the median frequency (fm) of the speckle fluctuation spectrum, which is posited to be directly proportional to the CBF, is correlated with changes in ciliary activity under isoflurane treatment [16]. Here we measured fm from the fluctuation spectrum at each pixel in the B-mode image by omitting the DC term, and subtracting white noise (which was estimated as the average over the 300 – 500 Hz band). Because fm in regions of low scattering can be large, a method for automatically segmenting the fm map was developed to select only features with significant fluctuation amplitude. This method involves thresholding based upon the area under the curve of the fluctuation spectrum (after omitting DC and subtracting white noise). Since this value is, on average, two orders of magnitude lower in regions outside the cell culture than inside the culture, by setting a threshold on this value, the fm map is automatically segmented.
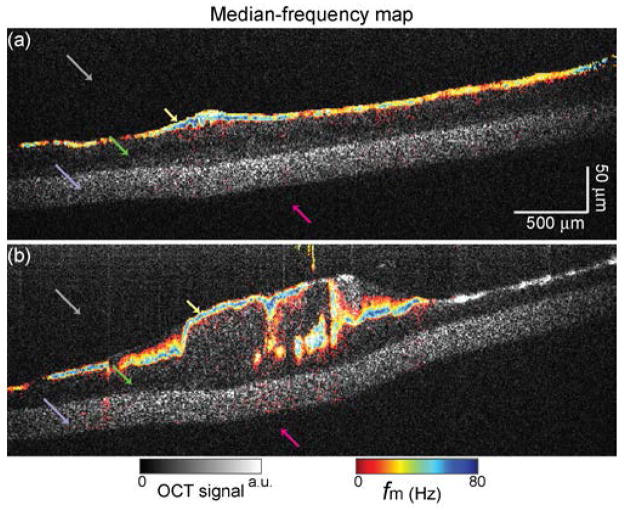
Fig. 4(a) shows the fm map overlaid in rainbow hue on the same B-mode image from Fig. 3(b) of the in vitro hBE cell culture. Importantly, from this fm map one can now distinguish between the PCL and the hBE cells, where fm is a semi-quantitative measure of ciliary activity. In fact, the PCL shows up distinctly as a thin layer on the upper border of the hBE cells. Note that this image does not show a mucus layer because the hBE culture has been washed to remove any thick, turbid mucus. Next, dynamic imaging of hBE cells with endogenous mucus is performed (see Visualization 2). Rather than a mono-layer of cells (as in Fig. 4(a)), the area of the culture imaged in Fig. 4(b) has a more complex structure. However, the fm analysis still produces images that selectively contrast ciliary activity and enables identification of the PCL, as indicated by the yellow arrow. For both cultures of Fig. 4, the ciliary activity is characterized by fm of ~ 50–80 Hz. This is larger than the actual CBF but is known to change proportionally with changes in CBF [16]
Fig. 4.
Dynamic OCT imaging using themedian-frequency map (fm) for two hBE cultures (a) without mucus and (b) with mucus (Visualization 2 for video of B-mode OCT images at 0.4× real time). Colored arrows indicate the different layers of the culture.
In summary, a broadband SC source has been implemented in a parallel SD-OCT system. The main advantages of this source are its wide spectral bandwidth providing ultrahigh-resolution images (axial resolution of 2 μm), and its high optical power which results in high-sensitivity images (maximum SNR of 113 dB). Importantly, the parallel SD-OCT geometry takes advantage of this increase of optical power by distributing it across a line focus. We have not observed any change in fm by potential photothermal heating after >2 min of continuous exposure, however, further investigation into heating in the line-focus geometry is needed before use in vivo. The combination of this SC source with a high-speed camera in a parallel OCT configuration now enables kHz frame rates (with effective MHz line rates) with a competitive imaging performance compared with commercial SD-OCT systems. This will enable new applications in studying dynamics of highly transient effects such as chemical reactions and biological motility.
Supplementary Material
Acknowledgments
Funding. DoD (BAA-AFOSR-2013-0001; Lohmann, PI); NIH (R21HL111968; Oldenburg, PI, P30 DK065988; Boucher, PI, and T32 EB007507; Markey, PI), Cystic Fibrosis Foundation (RDP BOUCHE 15R0 and KESIME 14XX0).
We thank Dr. Husain Imam from NKT Photonics and members of the Coherence Imaging Laboratory at UNC-CH, particularly, Dr. Rich Blackmon, Dr. Xiao Yu and Eric Boyers. The authors acknowledge the members of the UNC Tissue Procurement and Cell Culture core for providing the hBE cells.
Footnotes
OCIS codes: (110.4500) Optical coherence tomography; (320.6629) Supercontinuum generation; (170.3880) Medical and biological imaging; (070.0070) Fourier optical and signal processing;
Complete References
- 1.Huo T, Wang C, Zhang X, Chen T, Liao W, Zhang W, Ai S, Hsieh JC, Xue P. Ultrahigh-speed optical coherence tomography utilizing all-optical 40 MHz swept-source. J Biomed Opt. 2015;20:30503. doi: 10.1117/1.JBO.20.3.030503. [DOI] [PubMed] [Google Scholar]
- 2.Liu L, Chu KK, Houser GH, Diephuis BJ, Li Y, Wilsterman EJ, Shastry S, Dierksen G, Birket SE, Mazur M, Byan-Parker S, Grizzle WE, Sorscher EJ, Rowe SM, Tearney GJ. Method for Quantitative Study of Airway Functional Microanatomy Using Micro-Optical Coherence Tomography. PLoS One. 2013;8:1–8. doi: 10.1371/journal.pone.0054473. [DOI] [PMC free article] [PubMed] [Google Scholar]
- 3.Kocaoglu OP, Turner TL, Liu Z, Miller DT. Adaptive optics optical coherence tomography at 1 MHz. Biomed Opt Express. 2014;5:4186–200. doi: 10.1364/BOE.5.004186. [DOI] [PMC free article] [PubMed] [Google Scholar]
- 4.Zuluaga AF, Richards-Kortum R. Spatially resolved spectral interferometry for determination of subsurface structure. Opt Lett. 1999;24:519–521. doi: 10.1364/ol.24.000519. [DOI] [PubMed] [Google Scholar]
- 5.Grajciar B, Lehareinger Y, Fercher AF, Leitgeb RA. High sensitivity phase mapping with parallel Fourier domain optical coherence tomography at 512 000 A-scan/s. Opt Express. 2010;18:21841–21850. doi: 10.1364/OE.18.021841. [DOI] [PubMed] [Google Scholar]
- 6.Graf RN, Brown WJ, Wax A. Parallel frequency-domain optical coherence tomography scatter-mode imaging of the hamster cheek pouch using a thermal light source. Opt Lett. 2008;33:1285. doi: 10.1364/ol.33.001285. [DOI] [PMC free article] [PubMed] [Google Scholar]
- 7.Zhang Y, Rha J, Jonnal RS, Miller DT. Adaptive optics parallel spectral domain optical coherence tomography for imaging the living retina. Opt Express. 2005;13:4792. doi: 10.1364/opex.13.004792. [DOI] [PubMed] [Google Scholar]
- 8.Brown WJ, Kim S, Wax A. Noise characterization of supercontinuum sources for low-coherence interferometry applications. J Opt Soc Am A Opt Image Sci Vis. 2014;31:2703–10. doi: 10.1364/JOSAA.31.002703. [DOI] [PMC free article] [PubMed] [Google Scholar]
- 9.Yuan W, Mavadia-Shukla J, Xi J, Liang W, Yu X, Yu S, Li X. Optimal operational conditions for supercontinuum-based ultrahigh-resolution endoscopic OCT imaging. Opt Lett. 2016;41:250. doi: 10.1364/OL.41.000250. [DOI] [PMC free article] [PubMed] [Google Scholar]
- 10.Robles FE, Wilson C, Grant G, Wax A. Molecular imaging true-colour spectroscopic optical coherence tomography. Nat Photonics. 2011;5:744–747. doi: 10.1038/nphoton.2011.257. [DOI] [PMC free article] [PubMed] [Google Scholar]
- 11.Grajciar B, Pircher M, Fercher A, Leitgeb R. Parallel Fourier domain optical coherence tomography for in vivo measurement of the human eye. Opt Express. 2005;13:1131–1137. doi: 10.1364/opex.13.001131. [DOI] [PubMed] [Google Scholar]
- 12.Marks DL, Oldenburg AL, Reynolds JJ, Boppart SA. Autofocus Algorithm for Dispersion Correction in Optical Coherence Tomography. Appl Opt. 2003;42:3038. doi: 10.1364/ao.42.003038. [DOI] [PubMed] [Google Scholar]
- 13.Hu Z, Pan Y, Rollins AM. Analytical model of spectrometer-based two-beam spectral interferometry. Appl Opt. 2007;46:8499–8505. doi: 10.1364/ao.46.008499. [DOI] [PubMed] [Google Scholar]
- 14.de Boer JF, Cense B, Park BH, Pierce MC, Tearney GJ, Bouma BE. Improved signal-to-noise ratio in spectral-domain compared with time-domain optical coherence tomography. Opt Lett. 2003;28:2067–2069. doi: 10.1364/ol.28.002067. [DOI] [PubMed] [Google Scholar]
- 15.Fechtig DJ, Schmoll T, Grajciar B, Drexler W, Leitgeb RA. Line-field parallel swept source interferometric imaging at up to 1 MHz. Opt Lett. 2014;39:5333–5336. doi: 10.1364/OL.39.005333. [DOI] [PubMed] [Google Scholar]
- 16.Oldenburg AL, Chhetri RK, Hill DB, Button B. Monitoring airway mucus flow and ciliary activity with optical coherence tomography. Biomed Opt Express. 2012;3:1978–92. doi: 10.1364/BOE.3.001978. [DOI] [PMC free article] [PubMed] [Google Scholar]
- 17.Fulcher ML, Gabriel S, Burns Ka, Yankaskas JR, Randell SH. Well-differentiated human airway epithelial cell cultures. Methods Mol Med. 2005;107:183–206. doi: 10.1385/1-59259-861-7:183. [DOI] [PubMed] [Google Scholar]
- 18.Fulcher ML, Randell SH. Human nasal and tracheo-bronchial respiratory epithelial cell culture. Methods Mol Biol. 2013;945:109–121. doi: 10.1007/978-1-62703-125-7_8. [DOI] [PubMed] [Google Scholar]
- 19.Sears PR, Yin WN, Ostrowski LE. Continuous mucociliary transport by primary human airway epithelial cells in vitro. Am J Physiol Lung Cell Mol Physiol. 2015;309:L99–L108. doi: 10.1152/ajplung.00024.2015. [DOI] [PMC free article] [PubMed] [Google Scholar]
Associated Data
This section collects any data citations, data availability statements, or supplementary materials included in this article.


