

Abstract
Previously we synthesized JCI‐20679, a novel thiophene‐3‐carboxamide analog of annonaceous acetogenins which have shown potent antitumor activity, with no serious side effects, in mouse xenograft models. In this study, we investigated the antitumor mechanism of JCI‐20679. The growth inhibition profile (termed “fingerprint”) of this agent across a panel of 39 human cancer cell lines (termed “JFCR39”) was measured; this fingerprint was analyzed by the COMPARE algorithm utilizing the entire drug sensitivity database for the JFCR39 panel. The JCI‐20679‐specific fingerprint exhibited a high similarity to those of two antidiabetic biguanides and a natural rotenoid deguelin which were already known to be mitochondrial complex I inhibitors. In addition, the fingerprint exhibited by JCI‐20679 was not similar to that displayed by any typical anticancer drugs within the database, suggesting that it has a unique mode of action. In vitro experiments using bovine heart‐derived mitochondria showed direct inhibition of mitochondrial complex I by JCI‐20679 and associated derivatives. This inhibition of enzymatic activity positively correlated with tumor cell growth inhibition. Furthermore, a fluorescently labeled derivative of JCI‐20679 localized to the mitochondria of live cancer cells in vitro. These results suggest that JCI‐20679 can inhibit cancer cell growth by inhibiting mitochondrial complex I. Our results show that JCI‐20679 is a novel anticancer drug lead with a unique mode of action.
Keywords: Antitumor compound, COMPARE analysis, complex I, mitochondria, natural polyketide
Abbreviations
- Complex I
mitochondrial complex I
- GI50
50% growth inhibition
- IC50
50% inhibitory concentration
- JC‐1
5,5’,6,6’‐tetrachloro‐1,1’,3,3’‐tetraethylbenzimidazol‐carbocyanine iodide
- JFCR39
a panel of 39 human cancer cell lines
- OCR
oxygen consumption rate
- OxPhos
oxidative phosphorylation
- UPR
unfolded protein response
Introduction
Mitochondria play a principal role in oxidative metabolism in which nutrients are converted into energy (Tzagoloff and Myers 1986; Pedersen 1994; McLaughlin 2008). They are equipped with the electron transport chain, which is composed of five multimeric protein complexes (Complex I–V) (Mitchell 1961). Complex I, III, and IV transfer protons from the mitochondrial matrix to the intermembrane space (Mitchell 1961; Rich 2003). Complex V utilizes the proton gradient as a driving force to synthesize ATP (Pedersen 1994; Dimroth et al. 2000), an important energy source for cells that is used in biosynthetic reactions, as well as cell motility and division. This system is called oxidative phosphorylation (OxPhos) and acts as the predominant generator of cellular ATP under aerobic conditions (Mitchell 1961; Henze and Martin 2003). Complex I (also called NADH:ubiquinone oxidoreductase) is critical as it acts as a major entry point for electrons that cross the electron transport chain (Yano et al. 1994; Yagi et al. 2001).
Mitochondria in cancer cells differ from their normal counterparts (Modica‐Napolitano and Singh 2004; Kroemer and Pouyssegur 2008), and they exhibit a comprehensive metabolic alteration that renders them more sensitive to mitochondrial perturbation than normal cells (Kroemer and Pouyssegur 2008). Indeed, mitochondria have recently emerged as a potential target for the development of new anticancer drugs (Kroemer and Pouyssegur 2008; Fulda et al. 2010). The prototypic complex I inhibitors, rotenoids (e.g., rotenone and deguelin), have been reported to inhibit malignant cell proliferation in vitro and in vivo (Li et al. 2003; Murillo et al. 2009). In addition, the antidiabetic biguanide metformin was shown to inhibit mitochondrial complex I (Kalender et al. 2010), and reduce the risk of cancer in diabetic patients (Evans et al. 2006). However, no complex I inhibitors including metformin have been approved to date as antitumor drugs.
Annonaceous acetogenins are natural polyketides isolated from Annona plants growing in tropical and subtropical regions (Bermejo et al. 2005; McLaughlin 2008). Acetogenins, which are known generally as pesticides, have been demonstrated to inhibit mitochondrial complex I activity (Zafra‐Polo et al. 1996; Cochrane et al. 2008; Gupta et al. 2011). Recent studies on the total synthesis of acetogenins have provided a framework for large‐scale production of acetogenin analogs (Li et al. 2008; Kojima and Tanaka 2009). We previously synthesized a series of thiophene‐3‐carboxamide analogs of solamin, which is an annonaceous acetogenin with complex I inhibitory activity (Hattori et al. 2008), with a view toward the development of antitumor drug leads (Kojima et al. 2014). One of these agents, JCI‐20679, exhibited more potent antitumor activity than solamin with no severe side effects noted in the mouse xenograft models (Kojima et al. 2014).
In this study, we aimed to investigate the mode of action and the efficacy of JCI‐20679 as an anticancer drug candidate. We utilized our previously established panel of 39 cell lines (termed “JFCR39”) coupled with our own drug sensitivity database (Dan et al. 2002; Yamori 2003) and the COMPARE computer algorithm (Yamori et al. 1999). This approach enabled us to correlate the growth inhibitory patterns within the JFCR39 panel (termed “fingerprints”) mediated by a test compound with that exhibited by known anticancer drugs and inhibitors. Here, COMPARE analysis revealed that JCI‐20679 showed a very similar fingerprint to that mediated by biguanides and deguelin, which were known complex I inhibitors (El‐Mir et al. 2000; Murillo et al. 2009). JCI‐20679 was demonstrated to directly inhibit mitochondrial complex I in a cell‐free assay system, and to decrease cellular ATP content in vitro. Furthermore, complex I inhibitory activities of JCI‐20679 and the derivatives were significantly correlated with their cellular growth inhibitory activities. These results suggest that JCI‐20679 is a novel type of anticancer drug lead which targets mitochondrial complex I.
Materials and Methods
Chemicals
JCI‐20679 (N‐((R)‐11‐Hydroxy‐11‐{(2R,5R)‐5‐[(R)‐1‐hydroxytridecyl]tetrahydrofuran‐2‐yl}undecyl)thiophene‐3‐carboxamide) and the derivatives JCI‐20425 (N‐{(11R)‐11‐Hydroxy‐11‐[(2R,5R)‐5‐((1R)‐1‐hydroxytridec‐1‐yl)tetrahydrofuran‐2‐yl]undec‐1‐yl}‐1‐methyl‐1H‐pyrazole‐5‐carboxyamide), JCI‐13160 ((1R)‐1‐[(2R, 5R)‐5‐[(1R)‐1‐Hydroxy‐11‐[1‐[1‐methylpyrazole‐5‐yl]methylamino]undecyl]tetrahydrofuran‐2‐yl]tridecan‐1‐ol), JCI‐13163 (N‐(1‐Methylpyrazol‐5‐yl)‐(12R)‐12‐hydroxy‐12‐[(2R,5R)‐5‐((1R)‐1‐hydroxytridecyl)tetrahydrofuran‐2‐yl)dodecanamide], and JCI‐13291 (N‐[(R)‐11‐((2R,5R)‐5‐{(R)‐10‐[5‐(Dimethylamino)naphthalene‐1‐sulfonamido]‐1‐hydroxydecyl}tetrahydrofuran‐2‐yl)‐11‐hydroxyundecyl]thiophene‐3‐carboxamide) were synthesized and details of the synthesis methods and the chemical properties of the final products are described previously (Kojima et al., 2013, 2014, 2015). For in vitro studies, compounds were dissolved in dimethyl sulfoxide (Sigma, St. Louis, MO) at the concentration of 10 mmol/L or 100 mmol/L and stocked at −20°C. Buformin was purchased from Santa Cruz Biotechnology (Dallas, TX). Other chemicals that are not described above were purchased from Sigma.
Cell lines and reagents
A panel of 39 human cancer cell lines (termed JFCR39 and described previously (Yamori 2003; Yamori et al. 1999)) was used for the in vitro experiments. Cells were cultured in RPMI 1640 medium (Wako, Osaka, Japan) supplemented with 5% fetal bovine serum, and were incubated at 37°C in 5% CO2. The viable cells were counted by trypan blue exclusion using Countess II FL Automated Cell Counter (Invitrogen, Carlsbad, CA).
Cell growth analysis
The cell growth inhibition activity of compounds was assessed by measuring changes in total cellular protein in a culture of each of the JFCR39 cell lines after 48 h of drug treatment via use of a sulforhodamine B‐based assay (Skehan et al. 1990). The 50% growth inhibition (GI50) value was calculated as described previously (Yamori et al. 1999).
COMPARE analysis
Based on the set of GI50 values for each drug, the fingerprints are presented in graphical format in respect to relative sensitivity within the JFCR39 panel. To analyze the correlation between the fingerprints of drug A and drug B, we exploited the COMPARE computer algorithm as described previously (Paull et al. 1989). The Pearson correlation coefficient (r) between the GI50 mean graphs of the compounds X and Y was calculated using the following formula: r = (Σ(x i− x m) (y i− y m))/((Σ(x i− x m)2) (Σ(y i− y m)2))1/2, where x i and y i are Log GI50 of the two compounds, respectively, for each cell line, and x m and y m are the mean values of x i and y i, respectively (n = 39).
Complex I activity (NADH‐ubiquinone oxidoreductase activity) assay
The assay kit for OxPhos complex I activity was purchased from MitoSciences (Eugene, OR), and used in accordance with the manufacturer's protocol. In brief, 96 well plates which were coated with either antibovine mitochondrial complex I antibody or control antibody were incubated for 2 h at room temperature with 15 μg/well solubilized bovine heart mitochondria in 50 mmol/L Tris‐HCl pH 7.5, washed three times with 20 mmol/L Tris‐HCl pH 7.5, 50 mmol/L KCl and 0.015% (w/v) n‐dodecyl β‐D maltopyranoside, then incubated for 45 min at 4°C with 56 μg/mL phosphatidylcholine that had been dissolved in 20 mmol/L Tris‐HCl pH 7.5, 50 mmol/L KCl, and 0.015% (w/v) n‐dodecyl β‐D maltopyranoside.
Complex I activity was measured by adding an assay solution containing 25 mmol/L KH2PO4 pH 7.2, 5 mmol/L MgCl2, 1.2% (w/v) bovine serum albumin, 0.15 mmol/L Coenzyme Q1, and 0.26 mmol/L NADH. The oxidation of NADH was monitored by measuring the relative decrease in absorbance of the assay mixture at 340 nm in a Benchmark plus plate reader (Bio‐Rad, Hercules, CA) in kinetic mode at 30°C for 90 min. The maximum velocity of the decrease in absorbance was calculated. 100% activity (i.e., no inhibition) was determined as the mean of the triplicate maximum velocity in the absence of compound–negative control value in the absence of compound. 50% inhibitory concentration (IC50) values were generated by nonlinear regression analysis using Prism 5 software (GraphPad, La Jolla, CA).
Cellular oxygen consumption rate
Oxygen consumption rate (OCR) was measured using an XF24 extracellular flux analyzer (Seahorse Bioscience, North Billerica, MA) in accordance with the manufacturer's protocol. In brief, cells were seeded in 24 well assay plates in culture medium and were incubated at 37°C in 5% CO2 for 24 h. Then, the cells were changed to unbuffered RPMI 1640 (supplemented with 25 mmol/L glucose and 2 mmol/L L‐glutamine, without sodium bicarbonate and phenol red, Sigma) and incubated at 37°C in a non‐CO2 incubator for 1 h. After four baseline measurements, indicated concentrations of drugs were injected and eight measurements were taken. Baseline normalized OCR at 1 h after the drug injection was calculated by Wave software (Seahorse Bioscience). 100% OCR was determined as the mean of OCR in the absence of drug. Data represent the mean of 3–4 independent wells.
Cellular ATP measurement
Cellular ATP levels were measured by the ATPlite kit (PerkinElmer, Waltham, MA), which is based on the luciferase assay. Briefly, cells were prepared in the culture medium at 1–2 × 10⁵ cells/mL and plated 50 μL/well on 96 well plates. Cells were incubated overnight at 37°C in 5% CO2. After adding 50 μL of drug which was diluted by the culture medium, cells were incubated 6 h. Final dimethyl sulfoxide concentration in the medium was less than 1%. Then, 50 μL of lysis buffer and 50 μL of substrate solution were added and mixed well. The luminescence was measured by an EnVision 2103 Multilabel Reader (PerkinElmer). ATP contents were calculated as a percentage of ATP in solvent‐treated wells.
Establishment of ρ0 cells
ρ0 cells were established as previously described (Gamen et al. 1995). In brief, NCI‐H23 cells were cultured in ρ0 medium (RPMI1640 supplemented with 5% fetal bovine serum, 25 mmol/L glucose, 50 μg/mL uridine, 1 mmol/L sodium pyruvate, and 300 ng/mL ethidium bromide) for over 8 weeks. Established ρ0 cells were maintained in the ρ0 medium without ethidium bromide.
Real‐time RT‐PCR
Total RNA was extracted from cultured cells using the QIAshredder (Qiagen, Venlo, the Netherlands) and RNeasy Mini Kit (Qiagen). Purified RNA was reverse transcribed with random primers, using the High Capacity cDNA Reverse Transcription Kit (Life Technologies, Carlsbad, CA). Gene expression levels were determined using TaqMan® primers and associated probe sets (Life Technologies) and the ABI Prism 7000 Sequence Detection System (Life Technologies), according to the manufacturer's instructions. For internal control purposes, we assessed 18S ribosomal RNA levels.
Western blot analysis
Cells were lysed in a buffer containing 10 mmol/L Tris‐HCl at pH 7.4, 50 mmol/L NaCl, 50 mmol/L NaF, 30 mmol/L sodium pyrophosphate, 50 mmol/L Na3VO4, 5 mmol/L EDTA, aprotinin at 100 Kal U/mL, 1 mmol/L phenylmethylsulfonyl fluoride, 0.5% Nonidet P‐40, and 0.1% SDS. Proteins in cell lysates were separated by SDS‐polyacrylamide gel electrophoresis using Mini‐PROTEAN TGX™ gels (Bio‐Rad), followed by electroblotting onto a Trans‐Blot Turbo™ nitrocellulose membrane (Bio‐Rad) using a Trans‐Blot Turbo™ transfer system (Bio‐Rad). Mitochondrial ND6 and COX2 proteins were detected using mouse monoclonal antibodies against complex I subunit NDUFB8 (Invitrogen) and complex IV subunit II (Invitrogen), respectively. Alexa 680‐conjugated goat anti‐mouse IgG (Invitrogen) or IRDye 800CW‐conjugated goat anti‐rabbit IgG (LI‐COR, Lincoln, NE) was used as secondary antibodies. Immunoreactive bands were visualized using the Odyssey Infrared Imaging System (LI‐COR).
Fluorescence microscopy
Cells were cultured in porcine type I collagen‐coated 24‐well glass bottom plates (Asahi Technoglass, Tokyo, Japan) for 24 h. To observe mitochondrial membrane potential, cells were stained with 5 μg/mL of 5,5′,6,6′‐tetrachloro‐1,1′,3,3′‐tetraethylbenzimidazol‐carbocyanine iodide (JC‐1, Invitrogen) (Smiley et al. 1991) in the culture medium for 15 min at 37°C. To visualize intracellular localization of JCI‐13291, cells were first stained with 2 μmol/L JCI‐13291 in the medium for 5 h at 37°C. The cells were washed two times with fresh medium; thereafter, the cells were further incubated for 30 min in the presence of 100 nmol/L MitoTracker Red CMX‐Ros (Life Technologies), 1 μmol/L ER‐Tracker Red (Life Technologies), or 100 nmol/L Lyso‐Tracker Red (Life Technologies). After washing with fresh medium once, fluorescent images were obtained using a fluorescence microscope (IX81; Olympus, Tokyo, Japan) equipped with a 40× NA 0.95 UPlanSAPO objective lens (Olympus) and appropriate filter sets. MetaMorph software (Molecular devices, Sunnyvale, CA) was used to control image acquisition and manipulation.
Statistical analysis
Pearson correlation coefficients were calculated for the COMPARE analysis and statistical correlation. The number of samples is indicated in the description of each experiment.
Results
Identification of JCI‐20679 as a possible mitochondrial complex I inhibitor by COMPARE analysis
In a previous study, we synthesized an annonaceous acetogenin derivative JCI‐20679 (Kojima et al. 2014). The chemical structure of JCI‐20679 is based on solamin, a natural annonaceous acetogenin (Chang et al. 1993), with the heterocyclic moiety modified to a thiophene amide (Table S1). To predict the antitumor activity and the mode of action of JCI‐20679, we analyzed relative sensitivity to growth inhibition by this compound in a panel of 39 human cancer cell lines (termed “JFCR39”) (Yamori et al. 1999; Yamori 2003), determining a “fingerprint” of response (Fig. 1). The mean logarithmic GI50 value for JCI‐20679 within the JFCR39 panel was −5.56 (2.75 μmol/L), with these being lower than that found with solamin (−4.12, 75.9 μmol/L) (Fig. 1). This result indicates that JCI‐20679 has a greater ability to inhibit cell growth than the parent compound.
Figure 1.
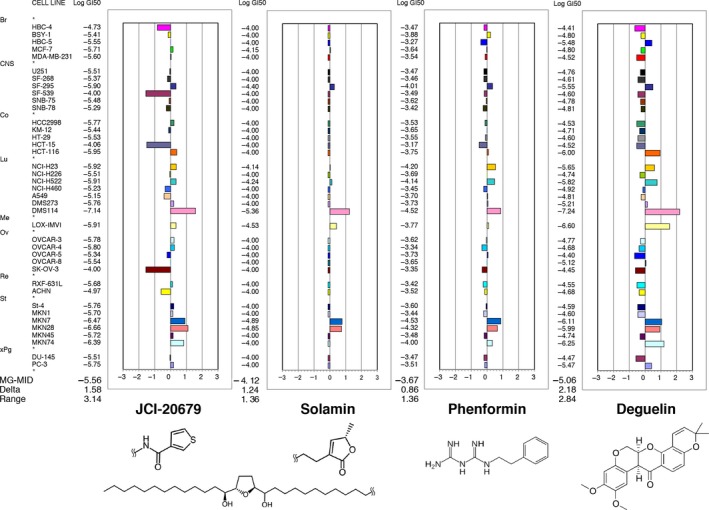
Growth inhibition profile against a panel of 39 human cancer cell lines. The mean graph was produced by computer processing of the 50% growth inhibition (GI 50) values as described under “Materials and Methods”. Logarithmic GI 50 values for each cell line are indicated. In the plot, columns to the right of zero indicate sensitivity of the cell line to the compound, and columns to the left indicate resistance to the compound. The x‐axis represents the logarithm of the difference between the mean GI 50 values for 39 cell lines and the GI 50 value for each cell line in the JFCR39 panel. The mean graph of JCI‐20679 is very similar to that of solamin (Pearson correlation coefficients; r = 0.616), phenformin (Pearson correlation coefficients; r = 0.704), and deguelin (Pearson correlation coefficients; r = 0.695). MG‐MID, the mean of log GI 50 values for 39 cell lines; Delta, the logarithm of the difference between the MG‐MID and the log GI 50 of the most sensitive cell line; Range, the logarithm of the difference between the log GI 50 of the most resistant cell line and the log GI 50 of the most sensitive cell line. One scale represents one logarithm difference. Quantification of the GI 50 value was represented as the mean of at least two different experiments. Br, breast; CNS, central nervous system; Co, colon; Lu, lung; Me, melanoma; Ov, ovarian; Re, renal; St, stomach; xPg, prostate. Chemical structure of the compounds are shown in below.
Analysis via the COMPARE algorithm (Paull et al. 1989) using fingerprints of known inhibitors showed that the antidiabetic biguanides, phenformin (r = 0.704) and buformin (r = 0.649), and the natural rotenoid, deguelin (r = 0.695), had shown remarkable correlations with the JCI‐20679‐specific fingerprint (Table 1). Since biguanides and deguelin have previously been reported to exhibit mitochondrial complex I (“complex I” for short) inhibitory activity (El‐Mir et al. 2000; Murillo et al. 2009), a similar mode of action was suggested for JCI‐20679 despite significant structural differences from this other compounds (Fig. 1). Further COMPARE analysis revealed that the fingerprint shown by JCI‐20679 was not similar to that exhibited by known anticancer drugs, such as topoisomerase inhibitors, platinum compounds and taxanes (Fig. S1 and Table S2), suggesting that it has a unique profile as an anticancer drug.
Table 1.
The top 10 compounds (out of 1466 compounds), which have high Pearson correlation coefficient r values (n = 39) with JCI‐20679 are shown in the table
| Rank | r | Chemical name | Known mode of action |
|---|---|---|---|
| 1 | 0.704 | Phenformin hydrochloride | Mitochondrial complex I inhibitor |
| 2 | 0.695 | (−)‐Deguelin | Mitochondrial complex I inhibitor |
| 3 | 0.649 | Buformin | Mitochondrial complex I inhibitor |
| 4 | 0.642 | Pyrvinium pamoate | AKT inhibitor |
| 5 | 0.620 | SIRT1 inhibitor III | SIRT1 inhibitor |
| 6 | 0.616 | Solamin | Mitochondrial complex I inhibitor |
| 7 | 0.605 | Gamma‐secretase inhibitor VI | Gamma‐secretase inhibitor |
| 8 | 0.593 | FGIN‐1‐27 | PBR (peripheral benzodiazepine receptor) agonist |
| 9 | 0.592 | SB505124 | ALK4 (activin receptor like kinase 4) inhibitor |
| 10 | 0.566 | Victoria blau B | Mitochondria‐related |
Direct inhibition of mitochondrial complex I by JCI‐20679
Next, we tested the complex I inhibitory activity of JCI‐20679 using a cell‐free system. The oxidation of a reduced‐form of NADH by bovine heart‐derived mitochondria complex I was examined in the presence of test compounds. JCI‐20679 inhibited complex I activity in a dose‐dependent manner (Fig. 2A), with similar results obtained for the parent compound solamin (Fig. 2B), phenformin (Fig. 2C), deguelin (Fig. 2D), and the prototypic complex I inhibitor rotenone (Fig. 2E). The calculated IC50 concentrations for JCI‐20679, solamin, phenformin, deguelin, and rotenone were 0.17, 5.5 μmol/L, >1000, 0.040, and 0.025 μmol/L, respectively (Fig. 2A–E). Therefore, in terms of complex I inhibition, JCI‐20679 displayed 30 times greater activity than solamin, and 6000 times greater than phenformin, but had seven times less activity than rotenone. None of the other mitochondrial complexes (complex II–V) were inhibited by JCI‐20679 (Fig. S2), suggesting that it is a specific complex I inhibitor.
Figure 2.
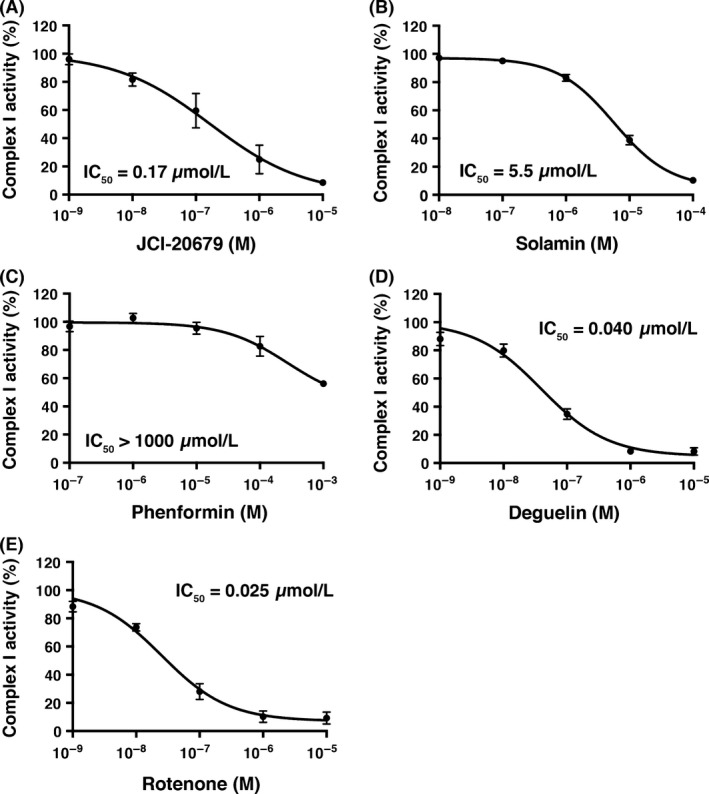
Dose–response curves with IC 50 values for JCI‐20679 (A), solamin (B), phenformin (C), deguelin (D), and rotenone (E) in respect to antibody‐captured bovine mitochondrial complex I activity. The results are expressed as percentage of complex I activity with no inhibitors. The calculated regression curve is indicated as a line. Data are mean ± SEM (n = 3).
Intracellular ATP depletion by JCI‐20679
We further analyzed mitochondrial inhibition by JCI‐20679 at the cellular level. Human lung cancer NCI‐H23 cells were treated with JCI‐20679 and the OCRs were measured by an extracellular flux analyzer. After 1 h of drug being added, both JCI‐20679 and the positive control rotenone inhibited the oxygen consumption of NCI‐H23 cells in a dose‐dependent manner (Fig. 3A and B), indicating that JCI‐20679 inhibited aerobic aspiration in vitro. As the mitochondrial electron transport chain is a dominant mechanism for generating ATP (Mitchell 1961; Henze and Martin 2003), we also evaluated the effect of JCI‐20679 treatment on the intracellular ATP level. NCI‐H23 cells were treated with JCI‐20679 at the indicated concentrations and the intracellular ATP levels were measured by a luciferase‐based assay. After 6 h of treatment, NCI‐H23 showed ATP depletion by JCI‐20679 in a dose‐dependent manner (Fig. 3C), while the viable cell number was hardly changed (Fig. 3D). A similar result was observed when using another human lung cancer cell line DMS114 (Data not shown). This result suggests that JCI‐20679 inhibits the mitochondria complex I of living cancer cells, resulting in depletion of intracellular ATP content.
Figure 3.
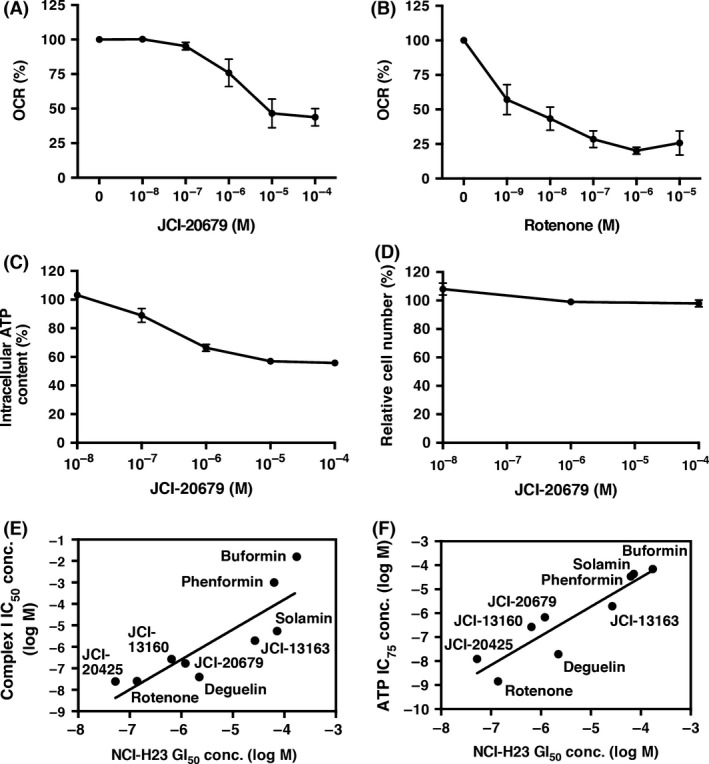
NCI‐H23 cells were treated with the indicated concentration of either JCI‐20679 (A) or rotenone (B) for 1 h and cellular oxygen consumption rate measured as described under “Materials and Methods”. The values are expressed as percentages of the nontreated control. Data are mean ± SEM (n = 3). NCI‐H23 cells were treated with the indicated concentration of JCI‐20679 for 6 h and cellular ATP content (C) and viable cell number (D) were measured as described under “Materials and Methods”. Each values are expressed as percentages of the nontreated control. Data are mean ± SEM (n = 3). (E) a scatter plot of concentrations of the annonaceous acetogenin derivatives (JCI‐20425, JCI‐20679, JCI‐13160 and JCI‐13163) and the related compounds (solamin, phenformin, buformin, deguelin, and rotenone) that inhibited 50% of mitochondrial complex I activity (IC 50) versus the logarithm of 50% growth inhibition (GI 50) of NCI‐H23 cells were shown. A high and statistically significant positive correlation (r = 0.857, Pearson correlation coefficient, and two‐tailed P = 0.0032) was observed between the two activities (n = 9). (F) a scatter plot of concentrations of the annonaceous acetogenin derivatives and the related compounds that inhibited 75% of intracellular ATP inhibition activity (IC 75) versus the logarithm of (GI 50) of NCI‐H23 cells were shown. A high and statistically significant positive correlation (r = 0.915, Pearson correlation coefficient, and two‐tailed P = 0.0005) was observed between the two activities (n = 9).
Correlation of complex I inhibition with cell growth inhibitory activity of annonaceous acetogenin derivatives
Next, we investigated whether the complex I inhibitory activities IC50 of JCI‐20679, three derivatives with similar fingerprint to JCI‐20679 (JCI‐20425, JCI‐13160, and JCI‐13163; chemical structures are shown in Table S1 and COMPARE correlation values for each compounds are shown in Table S3) and related five compounds (solamin, phenformin, buformin, deguelin, and rotenone; correlation values for each compounds are shown in Table S2) were related to their growth inhibitory activities (assessed as NCI‐H23 GI50). We observed a significant strong positive correlation (r = 0.857 and P = 0.0032) between these two activities (Fig. 3E). In addition, we also investigated whether the cellular ATP depletion activities (75% inhibitory concentration, IC75) of these compounds were related to their growth inhibitory activities (assessed as NCI‐H23 GI50). A statistically significantly high correlation (r = 0.915 and P = 0.0005) was observed between these two inhibitory activities (Fig. 3F). These results suggest that the acetogenin analogs inhibited cell proliferation by inhibiting the complex I and subsequent cellular ATP depletion.
Fluorescently labeled JCI‐20679 accumulates in the mitochondria
To visualize the intracellular localization of JCI‐20679, we next analyzed the intracellular localization of JCI‐13291, a previously synthesized hybrid acetogenin derivative, which has a fluorescent dansyl‐NH group at the end of the hydrocarbon chain of JCI‐20679 (Fig. 4A) (Kojima et al. 2015). COMPARE analysis showed that the fingerprint of JCI‐13291 moderately correlated with that of JCI‐20679 (r = 0.517) (Fig. S3A). JCI‐13291 also inhibited the aerobic aspiration of NCI‐H23 cells (Fig. S3B), and depleted intracellular ATP content (Fig. S3C). These results suggest that JCI‐13291 has a similar mode of action to JCI‐20679.
Figure 4.

Chemical structure (A) and visualization of intracellular localization (B–D) of JCI‐13291. NCI‐H23 cells were pretreated with 2 μmol/L JCI‐13291 for 5 h before the cells were stained with organelle markers. Subsequently, NCI‐H23 cells were stained with MitoTracker Red (B), ER‐Tracker Red (C) or LysoTracker Red (D) and observed under a fluorescence microscope. The signal derived from JCI‐13291 (left panels) and organelle dyes (middle panels), along with merged images (right panels) are shown. The white bar indicates 50 μm. Results are representative of those obtained in at least two independent experiments.
The overlapping patterns showed that JCI‐13291 accumulated in the mitochondria (Fig. 4B) but neither in the ER (Fig. 4C) nor the lysosome (Fig. 4D). A similar result was observed when DMS114 cells were used (Data not shown). In addition, JCI‐13291 did not accumulate in other organelles such as the Golgi body, early endosome and nucleus (Data not shown). These results suggest that JCI‐13291 specifically accumulated in the mitochondria.
Cells depleted of mitochondrial DNA (ρ0 cells) were resistant to JCI‐20679
To examine whether mitochondria are necessary for the growth inhibitory activity of JCI‐20679, we established mitochondrial DNA‐deficient cells (ρ0 cells). As mitochondrial DNA codes for essential genes that compose mitochondrial complexes, ρ0 cells do not express the functional electron transport chain (Chandel and Schumacker 1999). After over 8 weeks culture in ethidium bromide‐containing medium, complex I subunit ND6 and cytochrome c oxidase subunit II; COX2, which are both encoded by mitochondrial DNA, were lost in the ρ0 cells at both mRNA (Fig. 5A) and protein level (Fig. 5B). We then utilized the JC‐1 dye, which exhibits a fluorescence emission shift from green to red in accordance with membrane potential‐dependent accumulation in functional mitochondria (Smiley et al. 1991). The parental cells (ρ+ cells) showed red fluorescence, whereas at ρ0 cells did not (Fig. 5C), indicating complete disappearance of membrane potential from the latter cells. In addition, ρ0 cells were more resistant to JCI‐20679 than the ρ+ cells (Fig. 5D). These results suggest that JCI‐20679 inhibits cancer cell growth by targeting functional mitochondria.
Figure 5.
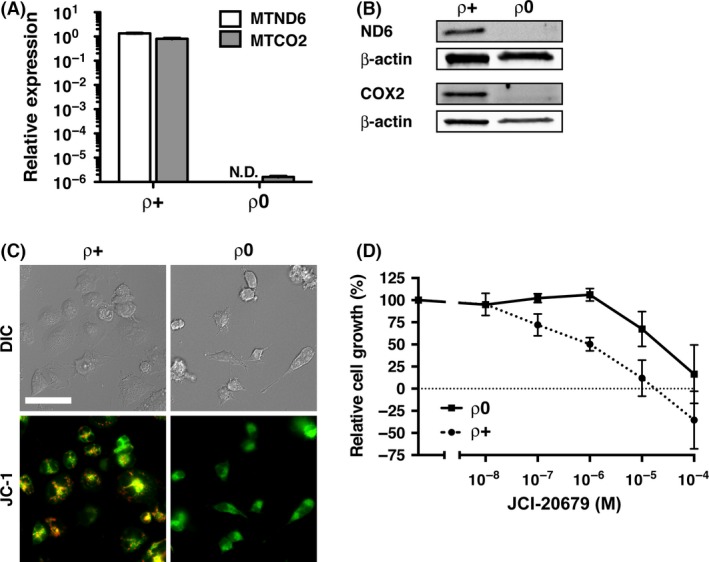
Characterization and JCI‐20679 sensitivity of ρ0 cells. (A) mitochondrial DNA‐encoded transcripts (MTND6 for ND6, MTCO2 for COX2) in the parental (ρ+) and mitochondrial DNA‐deficient ρ0) NCI‐H23 cells were examined by real‐time RT‐PCR analysis. Relative expressions of MTND6 or MTCO2 mRNA in the ρ+ and ρ0 cells are shown. Data were normalized by 18S rRNA expression. Baseline MTND6 or MTCO2 mRNA expression in parental NCI‐H23 cells were set as controls, respectively. Results shown are the means of three independent experiments; bars, ±SEM; N.D., Not detected. (B) Western blot analysis of mitochondrial DNA‐encoded proteins (ND6 and COX2) in ρ+ and ρ0 NCI‐H23 cells. The levels of β‐actin were used to control for loading. (C) visualization of mitochondrial membrane potential by fluorescence microscopy. ρ+ and ρ0 NCI‐H23 cells were stained with JC‐1. Red fluorescence indicates an area of high membrane potential on the functional mitochondria. DIC, differential interference contrast. White bar indicates 50 μm. (D) ρ+ and ρ0 NCI‐H23 cells were treated with indicated concentrations of JCI‐20679 for 48 h and the cellular growth was determined via a sulforhodamine B assay. Percentage of control values is indicated. Data are mean ± SEM (n = 3).
Discussion
We previously reported a novel synthetic method for thiophene‐3‐carboxamide analogs of annonaceous acetogenins. Among them, we identified JCI‐20679, which has potent anticancer activity with no serious side effect in vivo (Kojima et al. 2014). In this study, we identified JCI‐20679 as a mitochondrial complex I inhibitor by taking advantage of our drug sensitivity database and COMPARE algorithm (Table 1 and Fig. 1). JCI‐20679 directly inhibited mitochondrial complex I in a cell‐free system (Fig. 2A). The inhibition of complex I by JCI‐20679 was significantly correlated with its cell growth inhibitory activity (Fig. 3E). Fluorescently labeled JCI‐20679 accumulated in the human cancer cell mitochondria (Fig. 4B), and functional mitochondria were involved in cell growth inhibition by JCI‐20679 (Fig. 5D). Although high concentration of JCI‐20679 induced growth inhibition of ρ0 cells (Fig. 5D), indicating that the existence of mitochondria independent off‐target effect by JCI‐20679, our results suggest that cancer cell cytotoxicity of JCI‐20679 is mediated by the mitochondrial complex I inhibition.
COMPARE analysis is a powerful tool that can be used to identify small‐molecule enzyme inhibitors, for example, a telomerase inhibitor (FJ‐5002) (Naasani et al. 1999), a topoisomerase I and II inhibitor (MS‐247) (Yamori et al. 1999), a PI3K inhibitor (ZSTK474) (Yaguchi et al. 2006), and a Golgi inhibitor (AMF‐26) (Ohashi et al. 2012). In this study, we exploited COMPARE analysis to identify the mode of action of JCI‐20679. From these results, screening of chemicals guided by COMPARE analysis appears to be useful in evaluating novel drug candidates and identifying associated mechanisms of action targeting various biological entities and functions including the mitochondria.
Annonaceous acetogenins had been reported to show cytotoxicity (Bermejo et al. 2005; Cochrane et al. 2008; McLaughlin 2008) and mitochondrial complex I inhibitory activity (Degli Esposti et al. 1994). Natural acetogenins have a γ‐lactone moiety, which has been suggested to directly interact with the target site in complex I (Shimada et al. 1998). Aiming to increase tumor cell cytotoxicity, various hybrid acetogenins, which have the basic skeleton of an annonaceous acetogenin and a pesticide‐originated heterocyclic group, have been synthesized (Kojima et al. 2008). Based on a similar concept, JCI‐20679 was designed to modify the γ‐lactone moiety of solamin to a thiophene amide (Kojima et al. 2014). As a result, both cellular growth inhibitory activity and complex I inhibition activity of JCI‐20679 were stronger than the parent compound (Figs. 1 and 2). Furthermore, the mitochondrial complex I inhibitory activity of JCI‐20679, solamin and its derivatives were well correlated with those of antitumor activity (Fig. 3E). These results suggest that the complex I inhibitory activity is a major mechanism of anticancer activity of hybrid‐type acetogenins.
Recently, mitochondria have emerged as a potential target of cancer therapy (Modica‐Napolitano and Singh 2004; Kroemer and Pouyssegur 2008; McLaughlin 2008; Fulda et al. 2010). Due to constant and vigorous mitosis, cancer cells have a greater demand for ATP than normal cells. Additionally, during tumor development, cells within the tumor microenvironment undergo periods of oxidative deprivation (Brown and Giaccia 1998). Cancer cells are thought to be particularly vulnerable to perturbation of the electron transport chain by mitochondrial complex inhibitors under such conditions (Mathupala et al. 2006). In addition, previous studies have revealed that the unfolded protein response (UPR) is a survival response in cancer cells (Schroder and Kaufman 2005). Given that mitochondrial complex inhibitors, such as rotenone, antimycin A, and arctigenin, can suppress UPR (Haga et al. 2010; Kim et al. 2010), in vivo cancer selective cytotoxicity of JCI‐20679 (Kojima et al. 2014) may explained by the idea that cancer cells within hypoxic environments and with nutrient deprivation will be vulnerable to UPR inhibition by JCI‐20679.
Complex I inhibitors such as acetogenins or rotenoids have been reported to cause neurotoxic effects (Gao et al. 2003; Champy et al. 2004), and another possible side effect of JCI‐20679 is lactic acidosis, which is caused by the biguanides (Leverve et al. 2003; Dykens et al. 2008). Although serious side effect was not observed in short‐term dose of JCI‐20679 in mouse xenograft model (Kojima et al. 2014), indicating that JCI‐20679 is rather toxic to cancerous cell than normal tissues, further development of new annonaceous acetogenin derivatives must be conducted with paying careful attention to those side effects.
In conclusion, we have shown that the annonaceous acetogenin derivative JCI‐20679 exhibits anticancer activity via targeting mitochondrial complex I. These data suggest that JCI‐20679 is a novel drug lead for cancer treatment targeting cancer cell mitochondria.
Author Contributions
A. A., N. K., S. D., and T. Y. participated in research design. A. A., N. K., and M. O. conducted experiments. N. K. contributed new reagents or analytic tools. A. A., N. K., M. O., S. D., and T. Y. performed data analysis. A. A., N. K., S. D., and T. Y. wrote or contributed to the writing of the manuscript.
Disclosures
None declared.
Supporting information
Figure S1. Growth inhibition profile against a panel of 39 human cancer cell lines. The mean graph was produced by computer processing of the 50% growth inhibition (GI50) values as described under “Materials and Methods”. Logarithmic GI50 values for each cell line are indicated. In the plot, columns to the right of zero indicate sensitivity of the cell line to the compound, and columns to the left indicate resistance to the compound. The x‐axis represents the logarithm of the difference between the mean GI50 values for 39 cell lines and the GI50 value for each cell line in the JFCR39 panel. The mean graph of JCI‐20679 is not similar to that of SN‐38 (Pearson correlation coefficients; r = −0.008), cisplatin (Pearson correlation coefficients; r = −0.076), and paclitaxel (Pearson correlation coefficients; r = 0.137). MG‐MID, the mean of log GI50 values for 39 cell lines; Delta, the logarithm of the difference between the MG‐MID and the log GI50 of the most sensitive cell line; Range, the logarithm of the difference between the log GI50 of the most resistant cell line and the log GI50 of the most sensitive cell line. One scale represents one logarithm difference. Quantification of the GI50 value was represented as the mean of at least two different experiments. Br, breast; CNS, central nervous system; Co, colon; Lu, lung; Me, melanoma; Ov, ovarian; Re, renal; St, stomach; xPg, prostate.
Figure S2. Dose–response curves of JCI‐20679 (left panels) and known inhibitors (right panels) on mitochondrial complex II (A), complex II + III (B), complex IV (C), and complex V (D) are shown. The results are expressed as the percentage of untreated complex I activity (control). Data are mean ± SEM (n = 3).
Figure S3. (A) Growth inhibition profile against a panel of 39 human cancer cell lines. The mean graph was produced by computer processing of the 50% growth inhibition (GI50) values as described under “Materials and Methods”. Logarithmic GI50 values for each cell line are indicated. In the plot, columns to the right of zero indicate sensitivity of the cell line to the compound, and columns to the left indicate resistance to the compound. The x‐axis represents the logarithm of the difference between the mean GI50 values for 39 cell lines and the GI50 value for each cell line in the JFCR39 panel. The mean graph of JCI‐20679 is moderately similar to that of JCI‐13291 (Pearson correlation coefficients; r = 0.517). MG‐MID, the mean of log GI50 values for 39 cell lines; Delta, the logarithm of the difference between the MG‐MID and the log GI50 of the most sensitive cell line; Range, the logarithm of the difference between the log GI50 of the most resistant cell line and the log GI50 of the most sensitive cell line. One scale represents one logarithm difference. Quantification of the GI50 value was represented as the mean of at least two different experiments. Br, breast; CNS, central nervous system; Co, colon; Lu, lung; Me, melanoma; Ov, ovarian; Re, renal; St, stomach; xPg, prostate. (B) NCI‐H23 cells were treated with the indicated concentration of JCI‐13291 for 1 h and cellular oxygen consumption rate measured as described under “Materials and Methods”. The values are expressed as percentages of the nontreated control. Data are mean ± SEM (n = 3). (C) NCI‐H23 cells were treated with the indicated concentration of JCI‐13291 for 6 h and cellular ATP content was measured as described under “Materials and Methods”. ATP values are expressed as percentages of the nontreated control. Data are mean ± SEM (n = 3).
Table S1. Chemical structures of solamin and its derivatives are shown.
Table S2. The Pearson correlation coefficient r values (n = 39) between the fingerprints associated with JCI‐20679, that of related compounds and known anticancer drugs are shown in the table.
Table S3. The Pearson correlation coefficient r values (n = 39) between the fingerprints associated with JCI‐20679 and that of its derivatives which are described in Figure 3E and F are shown.
Data S1. Materials and Methods.
Acknowledgements
We thank Dr. Y. Ohashi, Ms. M. Okamura, Ms. N. Tamaki, Ms. Y. Nishimura, and Ms. K. Yamazaki for technical assistance and Dr. Wen‐zhi Guo for helpful discussions. The JFCR39 panel assays were supported by Screening Committee of Anticancer Drugs by Grant‐in‐Aid for Scientific Research on Innovative Areas, Scientific Support Programs for Cancer Research, from The Ministry of Education, Culture, Sports, Science and Technology, Japan.
Akatsuka A., Kojima N., Okamura M., Dan S., Yamori T.. A novel thiophene‐3‐carboxamide analog of annonaceous acetogenin exhibits antitumor activity via inhibition of mitochondrial complex I, Pharma Res Per, 4(4), 2016, e00246, doi: 10.1002/prp2.246
References
- Bermejo A, Figadere B, Zafra‐Polo MC, Barrachina I, Estornell E, Cortes D (2005). Acetogenins from Annonaceae: recent progress in isolation, synthesis and mechanisms of action. Nat Prod Rep 22: 269–303. [DOI] [PubMed] [Google Scholar]
- Brown JM, Giaccia AJ (1998). The unique physiology of solid tumors: opportunities (and problems) for cancer therapy. Cancer Res 58: 1408–1416. [PubMed] [Google Scholar]
- Champy P, Hoglinger GU, Feger J, Gleye C, Hocquemiller R, Laurens A, et al. (2004). Annonacin, a lipophilic inhibitor of mitochondrial complex I, induces nigral and striatal neurodegeneration in rats: possible relevance for atypical parkinsonism in Guadeloupe. J Neurochem 88: 63–69. [DOI] [PubMed] [Google Scholar]
- Chandel NS, Schumacker PT (1999). Cells depleted of mitochondrial DNA (rho0) yield insight into physiological mechanisms. FEBS Lett 454: 173–176. [DOI] [PubMed] [Google Scholar]
- Chang FR, Wu YC, Duh CY, Wang SK (1993). Studies on the acetogenins of Formosan annonaceous plants. II. Cytotoxic acetogenins from Annona reticulata. J Nat Prod 56: 1688–1694. [DOI] [PubMed] [Google Scholar]
- Cochrane CB, Nair PK, Melnick SJ, Resek AP, Ramachandran C (2008). Anticancer effects of Annona glabra plant extracts in human leukemia cell lines. Anticancer Res 28(2A): 965–971. [PubMed] [Google Scholar]
- Dan S, Tsunoda T, Kitahara O, Yanagawa R, Zembutsu H, Katagiri T, et al. (2002). An integrated database of chemosensitivity to 55 anticancer drugs and gene expression profiles of 39 human cancer cell lines. Cancer Res 62: 1139–1147. [PubMed] [Google Scholar]
- Degli Esposti M, Ghelli A, Ratta M, Cortes D, Estornell E (1994). Natural substances (acetogenins) from the family Annonaceae are powerful inhibitors of mitochondrial NADH dehydrogenase (Complex I). Biochem J 301(Pt 1): 161–167. [DOI] [PMC free article] [PubMed] [Google Scholar]
- Dimroth P, Kaim G, Matthey U (2000). Crucial role of the membrane potential for ATP synthesis by F(1)F(o) ATP synthases. J Exp Biol 203(Pt 1): 51–59. [DOI] [PubMed] [Google Scholar]
- Dykens JA, Jamieson J, Marroquin L, Nadanaciva S, Billis PA, Will Y (2008). Biguanide‐induced mitochondrial dysfunction yields increased lactate production and cytotoxicity of aerobically‐poised HepG2 cells and human hepatocytes in vitro. Toxicol Appl Pharmacol 233: 203–210. [DOI] [PubMed] [Google Scholar]
- El‐Mir MY, Nogueira V, Fontaine E, Averet N, Rigoulet M, Leverve X (2000). Dimethylbiguanide inhibits cell respiration via an indirect effect targeted on the respiratory chain complex I. J Biol Chem 275: 223–228. [DOI] [PubMed] [Google Scholar]
- Evans JM, Ogston SA, Emslie‐Smith A, Morris AD (2006). Risk of mortality and adverse cardiovascular outcomes in type 2 diabetes: a comparison of patients treated with sulfonylureas and metformin. Diabetologia 49: 930–936. [DOI] [PubMed] [Google Scholar]
- Fulda S, Galluzzi L, Kroemer G (2010). Targeting mitochondria for cancer therapy. Nat Rev Drug Discov 9: 447–464. [DOI] [PubMed] [Google Scholar]
- Gamen S, Anel A, Montoya J, Marzo I, Pineiro A, Naval J (1995). mtDNA‐depleted U937 cells are sensitive to TNF and Fas‐mediated cytotoxicity. FEBS Lett 376: 15–18. [DOI] [PubMed] [Google Scholar]
- Gao HM, Liu B, Hong JS (2003). Critical role for microglial NADPH oxidase in rotenone‐induced degeneration of dopaminergic neurons. J Neurosci 23: 6181–6187. [DOI] [PMC free article] [PubMed] [Google Scholar]
- Gupta A, Shah DR, Seth NR, Pandey S, Yadav JS (2011). Annonaceous acetogenins: the unrevealed area for cytotoxic and pesticidal activities. Syst Rev Pharm 2: 104. [Google Scholar]
- Haga N, Saito S, Tsukumo Y, Sakurai J, Furuno A, Tsuruo T, et al. (2010). Mitochondria regulate the unfolded protein response leading to cancer cell survival under glucose deprivation conditions. Cancer Sci 101: 1125–1132. [DOI] [PMC free article] [PubMed] [Google Scholar]
- Hattori Y, Furuhata S, Okajima M, Konno H, Abe M, Miyoshi H, et al. (2008). Synthesis of pyranicin and its inhibitory action with bovine heart mitochondrial complex I. Org Lett 10: 717–720. [DOI] [PubMed] [Google Scholar]
- Henze K, Martin W (2003). Evolutionary biology: essence of mitochondria. Nature 426: 127–128. [DOI] [PubMed] [Google Scholar]
- Kalender A, Selvaraj A, Kim SY, Gulati P, Brule S, Viollet B, et al. (2010). Metformin, independent of AMPK, inhibits mTORC1 in a rag GTPase‐dependent manner. Cell Metab 11: 390–401. [DOI] [PMC free article] [PubMed] [Google Scholar]
- Kim JY, Hwang JH, Cha MR, Yoon MY, Son ES, Tomida A, et al. (2010). Arctigenin blocks the unfolded protein response and shows therapeutic antitumor activity. J Cell Physiol 224: 33–40. [DOI] [PubMed] [Google Scholar]
- Kojima N, Tanaka T (2009). Medicinal chemistry of Annonaceous acetogenins: design, synthesis, and biological evaluation of novel analogues. Molecules 14: 3621–3661. [DOI] [PMC free article] [PubMed] [Google Scholar]
- Kojima N, Fushimi T, Maezaki N, Tanaka T, Yamori T (2008). Synthesis of hybrid acetogenins, alpha, beta‐unsaturated‐gamma‐lactone‐free nitrogen‐containing heterocyclic analogues, and their cytotoxicity against human cancer cell lines. Bioorg Med Chem Lett 18: 1637–1641. [DOI] [PubMed] [Google Scholar]
- Kojima N, Fushimi T, Tatsukawa T, Yoshimitsu T, Tanaka T, Yamori T, Dan S, Iwasaki H, Yamashita M (2013). Structure‐activity relationships of hybrid annonaceous acetogenins: powerful growth inhibitory effects of their connecting groups between heterocycle and hydrophobic carbon chain bearing THF ring on human cancer cell lines. European journal of medicinal chemistry 63: 833–839. [DOI] [PubMed] [Google Scholar]
- Kojima N, Fushimi T, Tatsukawa T, Tanaka T, Okamura M, Akatsuka A, et al. (2014). Thiophene‐3‐carboxamide analogue of annonaceous acetogenins as antitumor drug lead. Eur J Med Chem 86: 684–689. [DOI] [PubMed] [Google Scholar]
- Kojima N, Suga Y, Matsumoto T, Tanaka T, Akatsuka A, Yamori T, et al. (2015). Synthesis of dansyl‐labeled probe of thiophene analogue of annonaceous acetogenins for visualization of cell distribution and growth inhibitory activity toward human cancer cell lines. Bioorg Med Chem 23: 1276–1283. [DOI] [PubMed] [Google Scholar]
- Kroemer G, Pouyssegur J (2008). Tumor cell metabolism: cancer's Achilles’ heel. Cancer Cell 13: 472–482. [DOI] [PubMed] [Google Scholar]
- Leverve XM, Guigas B, Detaille D, Batandier C, Koceir EA, Chauvin C, et al. (2003). Mitochondrial metabolism and type‐2 diabetes: a specific target of metformin. Diabetes Metab 29(4 Pt 2): 6S88–6S94. [DOI] [PubMed] [Google Scholar]
- Li N, Ragheb K, Lawler G, Sturgis J, Rajwa B, Melendez JA, et al. (2003). Mitochondrial complex I inhibitor rotenone induces apoptosis through enhancing mitochondrial reactive oxygen species production. J Biol Chem 278: 8516–8525. [DOI] [PubMed] [Google Scholar]
- Li N, Shi Z, Tang Y, Chen J, Li X (2008). Recent progress on the total synthesis of acetogenins from Annonaceae. Beilstein J Org Chem 4: 48. [DOI] [PMC free article] [PubMed] [Google Scholar]
- Mathupala SP, Ko YH, Pedersen PL (2006). Hexokinase II: cancer's double‐edged sword acting as both facilitator and gatekeeper of malignancy when bound to mitochondria. Oncogene 25: 4777–4786. [DOI] [PMC free article] [PubMed] [Google Scholar]
- McLaughlin JL (2008). Paw paw and cancer: annonaceous acetogenins from discovery to commercial products. J Nat Prod 71: 1311–1321. [DOI] [PubMed] [Google Scholar]
- Mitchell P (1961). Coupling of phosphorylation to electron and hydrogen transfer by a chemi‐osmotic type of mechanism. Nature 191: 144–148. [DOI] [PubMed] [Google Scholar]
- Modica‐Napolitano JS, Singh KK (2004). Mitochondrial dysfunction in cancer. Mitochondrion 4: 755–762. [DOI] [PubMed] [Google Scholar]
- Murillo G, Peng X, Torres KE, Mehta RG (2009). Deguelin inhibits growth of breast cancer cells by modulating the expression of key members of the Wnt signaling pathway. Cancer Prev Res (Phila) 2: 942–950. [DOI] [PubMed] [Google Scholar]
- Naasani I, Seimiya H, Yamori T, Tsuruo T (1999). FJ5002: a potent telomerase inhibitor identified by exploiting the disease‐oriented screening program with COMPARE analysis. Cancer Res 59: 4004–4011. [PubMed] [Google Scholar]
- Ohashi Y, Iijima H, Yamaotsu N, Yamazaki K, Sato S, Okamura M, et al. (2012). AMF‐26, a novel inhibitor of the Golgi system, targeting ADP‐ribosylation factor 1 (Arf1) with potential for cancer therapy. J Biol Chem 287: 3885–3897. [DOI] [PMC free article] [PubMed] [Google Scholar]
- Paull KD, Shoemaker RH, Hodes L, Monks A, Scudiero DA, Rubinstein L, et al. (1989). Display and analysis of patterns of differential activity of drugs against human tumor cell lines: development of mean graph and COMPARE algorithm. J Natl Cancer Inst 81: 1088–1092. [DOI] [PubMed] [Google Scholar]
- Pedersen PL (1994). ATP synthase. The machine that makes ATP. Curr Biol 4: 1138–1141. [DOI] [PubMed] [Google Scholar]
- Rich PR (2003). The molecular machinery of Keilin's respiratory chain. Biochem Soc Trans 31(Pt 6): 1095–1105. [DOI] [PubMed] [Google Scholar]
- Schroder M, Kaufman RJ (2005). The mammalian unfolded protein response. Annu Rev Biochem 74: 739–789. [DOI] [PubMed] [Google Scholar]
- Shimada H, Grutzner JB, Kozlowski JF, McLaughlin JL (1998). Membrane conformations and their relation to cytotoxicity of asimicin and its analogues. Biochemistry 37: 854–866. [DOI] [PubMed] [Google Scholar]
- Skehan P, Storeng R, Scudiero D, Monks A, McMahon J, Vistica D, et al. (1990). New colorimetric cytotoxicity assay for anticancer‐drug screening. J Natl Cancer Inst 82: 1107–1112. [DOI] [PubMed] [Google Scholar]
- Smiley ST, Reers M, Mottola‐Hartshorn C, Lin M, Chen A, Smith TW, et al. (1991). Intracellular heterogeneity in mitochondrial membrane potentials revealed by a J‐aggregate‐forming lipophilic cation JC‐1. Proc Natl Acad Sci USA 88: 3671–3675. [DOI] [PMC free article] [PubMed] [Google Scholar]
- Tzagoloff A, Myers AM (1986). Genetics of mitochondrial biogenesis. Annu Rev Biochem 55: 249–285. [DOI] [PubMed] [Google Scholar]
- Yagi T, Seo BB, Di Bernardo S, Nakamaru‐Ogiso E, Kao MC, Matsuno‐Yagi A (2001). NADH dehydrogenases: from basic science to biomedicine. J Bioenerg Biomembr 33: 233–242. [DOI] [PubMed] [Google Scholar]
- Yaguchi S, Fukui Y, Koshimizu I, Yoshimi H, Matsuno T, Gouda H, et al. (2006). Antitumor activity of ZSTK474, a new phosphatidylinositol 3‐kinase inhibitor. J Natl Cancer Inst 98: 545–556. [DOI] [PubMed] [Google Scholar]
- Yamori T (2003). Panel of human cancer cell lines provides valuable database for drug discovery and bioinformatics. Cancer Chemother Pharmacol 52(Suppl 1): S74–S79. [DOI] [PubMed] [Google Scholar]
- Yamori T, Matsunaga A, Sato S, Yamazaki K, Komi A, Ishizu K, et al. (1999). Potent antitumor activity of MS‐247, a novel DNA minor groove binder, evaluated by an in vitro and in vivo human cancer cell line panel. Cancer Res 59: 4042–4049. [PubMed] [Google Scholar]
- Yano T, Sled VD, Ohnishi T, Yagi T (1994). Expression of the 25‐kilodalton iron‐sulfur subunit of the energy‐transducing NADH‐ubiquinone oxidoreductase of Paracoccus denitrificans. Biochemistry 33: 494–499. [DOI] [PubMed] [Google Scholar]
- Zafra‐Polo MC, Gonzalez MC, Estornell E, Sahpaz S, Cortes D (1996). Acetogenins from Annonaceae, inhibitors of mitochondrial complex I. Phytochemistry 42: 253–271. [DOI] [PubMed] [Google Scholar]
Associated Data
This section collects any data citations, data availability statements, or supplementary materials included in this article.
Supplementary Materials
Figure S1. Growth inhibition profile against a panel of 39 human cancer cell lines. The mean graph was produced by computer processing of the 50% growth inhibition (GI50) values as described under “Materials and Methods”. Logarithmic GI50 values for each cell line are indicated. In the plot, columns to the right of zero indicate sensitivity of the cell line to the compound, and columns to the left indicate resistance to the compound. The x‐axis represents the logarithm of the difference between the mean GI50 values for 39 cell lines and the GI50 value for each cell line in the JFCR39 panel. The mean graph of JCI‐20679 is not similar to that of SN‐38 (Pearson correlation coefficients; r = −0.008), cisplatin (Pearson correlation coefficients; r = −0.076), and paclitaxel (Pearson correlation coefficients; r = 0.137). MG‐MID, the mean of log GI50 values for 39 cell lines; Delta, the logarithm of the difference between the MG‐MID and the log GI50 of the most sensitive cell line; Range, the logarithm of the difference between the log GI50 of the most resistant cell line and the log GI50 of the most sensitive cell line. One scale represents one logarithm difference. Quantification of the GI50 value was represented as the mean of at least two different experiments. Br, breast; CNS, central nervous system; Co, colon; Lu, lung; Me, melanoma; Ov, ovarian; Re, renal; St, stomach; xPg, prostate.
Figure S2. Dose–response curves of JCI‐20679 (left panels) and known inhibitors (right panels) on mitochondrial complex II (A), complex II + III (B), complex IV (C), and complex V (D) are shown. The results are expressed as the percentage of untreated complex I activity (control). Data are mean ± SEM (n = 3).
Figure S3. (A) Growth inhibition profile against a panel of 39 human cancer cell lines. The mean graph was produced by computer processing of the 50% growth inhibition (GI50) values as described under “Materials and Methods”. Logarithmic GI50 values for each cell line are indicated. In the plot, columns to the right of zero indicate sensitivity of the cell line to the compound, and columns to the left indicate resistance to the compound. The x‐axis represents the logarithm of the difference between the mean GI50 values for 39 cell lines and the GI50 value for each cell line in the JFCR39 panel. The mean graph of JCI‐20679 is moderately similar to that of JCI‐13291 (Pearson correlation coefficients; r = 0.517). MG‐MID, the mean of log GI50 values for 39 cell lines; Delta, the logarithm of the difference between the MG‐MID and the log GI50 of the most sensitive cell line; Range, the logarithm of the difference between the log GI50 of the most resistant cell line and the log GI50 of the most sensitive cell line. One scale represents one logarithm difference. Quantification of the GI50 value was represented as the mean of at least two different experiments. Br, breast; CNS, central nervous system; Co, colon; Lu, lung; Me, melanoma; Ov, ovarian; Re, renal; St, stomach; xPg, prostate. (B) NCI‐H23 cells were treated with the indicated concentration of JCI‐13291 for 1 h and cellular oxygen consumption rate measured as described under “Materials and Methods”. The values are expressed as percentages of the nontreated control. Data are mean ± SEM (n = 3). (C) NCI‐H23 cells were treated with the indicated concentration of JCI‐13291 for 6 h and cellular ATP content was measured as described under “Materials and Methods”. ATP values are expressed as percentages of the nontreated control. Data are mean ± SEM (n = 3).
Table S1. Chemical structures of solamin and its derivatives are shown.
Table S2. The Pearson correlation coefficient r values (n = 39) between the fingerprints associated with JCI‐20679, that of related compounds and known anticancer drugs are shown in the table.
Table S3. The Pearson correlation coefficient r values (n = 39) between the fingerprints associated with JCI‐20679 and that of its derivatives which are described in Figure 3E and F are shown.
Data S1. Materials and Methods.