Abstract
The presence of high numbers of circulating clonal plasma cells (cPCs) in patients with smoldering multiple myeloma (SMM), detected by a slide-based immunofluorescence assay, has been associated with a shorter time to progression (TTP) to multiple myeloma (MM). The significance of quantifying cPCs via multiparameter flow cytometry, a much more readily available diagnostic modality, in patients with SMM has not been evaluated. This study evaluated 100 patients with a known or new diagnosis of SMM who were seen at the Mayo Clinic, Rochester from January 2008 until December 2013. Patients with ≥ 150 cPCs (N = 9) were considered to have high number of cPCs based on the 97% specificity and 78% PPV of progression to MM within 2 years of cPC assessment. The median TTP of patients with ≥ 150 cPCs was 9 months compared to not reached for patients with < 150 cPCs (P < 0.001). Thus, quantification of cPCs via multiparametric flow cytometry identifies patients with SMM at very high risk of progression to MM within 2 years and warrants confirmation in larger studies. In the future, this may allow reclassification of such patients as having MM requiring therapy prior to them enduring end-organ damage.
Keywords: circulating clonal plasma cells, smoldering multiple myeloma, flow cytometry, progression
INTRODUCTION
Multiple myeloma (MM) is always preceded by an asymptomatic phase, monoclonal gammopathy of undetermined significance (MGUS) or smoldering MM (SMM), depending on the extent of bone marrow involvement by the clonal PCs and monoclonal protein levels.(1, 2) SMM is currently defined by the International Myeloma Working Group (IMWG) as the presence of a serum M-protein of ≥ 3 g/dl and/or ≥ 10% bone marrow plasma cells (BMPCs) with no evidence of end-organ damage (hypercalcemia, renal insufficiency, anemia or bone lesions).(2) Current practice guidelines for patients with SMM recommend monitoring with no active treatment. However, if patients with SMM who have an 80% or higher risk of progression to MM within two years could be identified, then early treatment of such patients may improve quality of life and overall survival rather than a strategy of observation until the development of end-organ damage. Recently, the International Myeloma Working Group (IMWG) recognized the presence of either free light chain (FLC) ratio ≥100(3, 4), bone marrow plasma cells (BMPC) ≥60%(4, 5) or >1 focal lesion on skeletal MRI(6, 7) as myeloma defining events (MDEs) in otherwise SMM patients due to their high risk of progression to symptomatic MM within 2 years.(8, 9) The presence of circulating clonal plasma cells (cPCs) is associated with a worse prognosis in MM(10–12) and is also a risk factor for progression in MGUS and SMM.(13, 14) Specifically, our group had demonstrated that the presence of high numbers of cPCs in SMM patients predicted for early progression to MM within 2–3 years.(14) However, this study utilized a slide-based immunofluorescence assay to detect cPCs which is both complex and labor intensive process requiring fluorescence microscopy, thus limiting the clinical availability of this test. The advent of highly sensitive flow cytometry methods has improved the ease and sensitivity of cPCs detection in the clinical laboratory. Thus, we undertook this study of patients with SMM to examine the utility of detecting and quantifying cPCs via six-color multiparameter flow cytometry in predicting an imminent risk of progression to symptomatic MM within the following two years.
METHODS
We evaluated all patients with a known or new diagnosis of SMM who were seen at the Mayo Clinic, Rochester from January 2008 until December 2013 and who had their peripheral blood evaluated for cPCs by flow cytometry. Approval for this study was obtained from the Mayo Clinic IRB in accordance with the federal regulations and the principles of the Declaration of Helsinki. The diagnostic criteria of International Myeloma Working Group were applied to confirm the diagnosis of SMM: presence of a serum monoclonal Ig level ≥3 g/dl, and/or bone marrow infiltration with monotypic PCs equal or exceeding 10%, in the absence of end-organ damage attributable to the plasma cell disorder. Patients with a diagnosis of MGUS or even concurrent systemic AL-amyloidosis were excluded. Patients who were treated with any forms of chemotherapy for hematologic or solid malignancy within the previous 5 years and those with ongoing or recent (less than 5 years) therapy with high-dose steroids (≥15mg prednisone daily or equivalent) were also excluded. Relevant laboratory data, including M spike, serum free light chain (FLC) ratio, hemoglobin, total calcium, creatinine, β-2-microglobulin, Ig subtype quantification, 24 hour urinary protein electrophoresis and immunofixation, BMPC percentage, cytogenetics and fluorescent in situ hybridization (FISH) results were abstracted for analysis. Immunoparesis was defined as the quantitative values of one or more immunoglobulins less than the lower limit of normal for our laboratory’s respective reference range.
Six-color multiparametric flow cytometry was performed on peripheral blood mononuclear cells isolated by Ficoll gradient, and stained with antibodies to CD45, CD19, CD38, CD138 and cytoplasmic Kappa and Lambda immunoglobulin light chains. The data was collected using Becton Dickinson FacsCanto II instruments collecting 150,000 events; the flow cytometry data was analyzed using the BDFacs DIVA Software. The gating strategy employed first used the expression of CD38, CD138, and cytoplasmic immunoglobulin light chains to identify all plasma cells in the specimen. The cPCs were then discriminated from polyclonal/normal plasma cells based on differential CD19 and CD45 expression. The cPCs detected were reported as the number of clonal events/150,000 collected total events. For those samples where less than 150,000 events were gated or examined, the number of final clonal events was adjusted to 150,000 events. The lower limit of cPCs detection by this method is 20 cells/150,000 (0.013%). Supplemental Figure 1 depicts a typical flow cytometry pattern in a patient with kappa-restricted clonal cPCs.
Statistical analysis was performed using the SAS biostatistical software JMP 10.0.1 (SAS Institute Inc., Cary, NC). We identified a quantitative threshold for cPCs associated with the most optimal PPV of about 80% for progression of SMM to MM in the first two years after assessment of cPCs. The primary end point was time to progression (TTP) to MM. Two-sided Fisher exact tests were used to test for differences between categorical variables. Two-sided Wilcoxon rank-sum tests were used to compare continuous variables. TTP analysis was done using the Kaplan–Meier method. Differences between TTP curves were tested for statistical significance using the two-sided log-rank test unless otherwise specified.
RESULTS
Patient characteristics
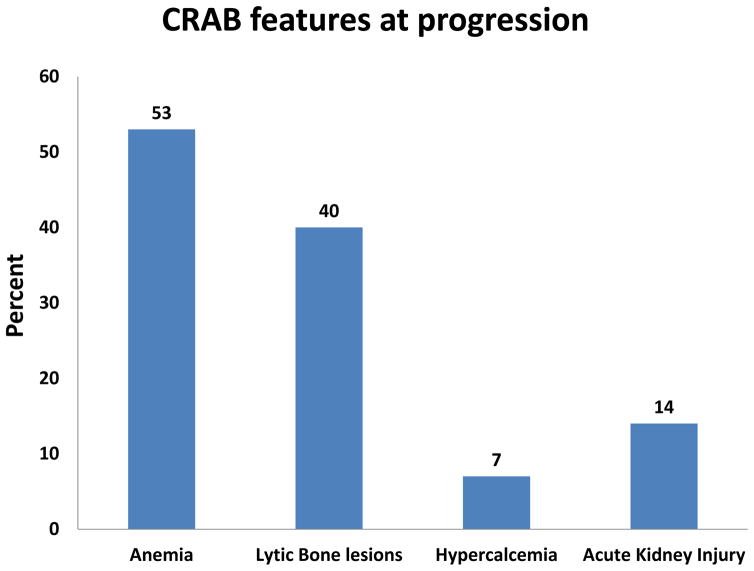
There were 100 patients with a known diagnosis of SMM who had their peripheral blood evaluated by multiparametric flow cytometry for clonal cPCs within six months of their diagnosis and prior to disease progression. The median follow up for this group was 37 months (95% CI: 32 – 41). There were 31 (31%) patients who had progressed to MM requiring treatment at the time of last follow up. There were 93 patients still alive at the time of study analysis. Those patients who had not progressed to MM had at least 24 months of follow up from the time of their assessment for cPCs. At the time of cPC evaluation, there were 51 patients in this cohort who had PET/CT evaluations and the remainder had whole-body skeletal bone radiographs in order to confirm the lack of lytic bone lesions associated with progression to MM. The median age of this cohort was 66 years (Range: 34 – 85) and 51% were male. Of patients who progressed to MM, the distribution of symptoms at the time of progression is known for 30 patients and is illustrated in Figure 1. Anemia (53%) was the most common symptomatic presentation associated with progression to MM warranting the initiation of systemic therapy. Only 13 (42%) of the 31 patients who progressed to MM had PET/CT evaluations at the time of progression. Only 56 patients had molecular cytogenetics results available for verification of which 6 had t(4;14) or deletion 17p abnormalities.
Figure 1.
Distribution (percentage %) of symptoms in SMM patients upon relapse.
SMM patients with cPCs
There were 24 patients (24%) who had detectable cPCs. The median number of cPCs was 78 per 150,000 events analyzed (Range: 20 – 3124). The characteristics of patients with and without cPCs are listed in Table 1. When compared to patients without cPCs, patients with cPCs had a higher likelihood of having immunoparesis. We determined the various levels of cPCs and their sensitivity, specificity and PPV for disease progression within 2 years (Table 2). There was an increasing specificity and PPV for higher quantitative thresholds of cPCs. Patients with ≥ 150 cPCs (N = 9) had a 97% specificity and 78% PPV of progression to MM within 2 years and hence the presence of ≥ 150 cPCs was chosen as a cutoff to define high levels of cPCs (due to its nearly 80% PPV). We also tested if higher levels of cPCs improved the PPV of progression to MM within 2 years and found that patients with ≥ 200 or more cPCs (N = 6) had a 100% specificity and 100% PPV of progression to MM within 2 years. The presence of ≥ 150 cPCs is equivalent to 0.1% of the 150,000 mononuclear cells or events evaluated.
TABLE 1.
Demographics and clinical characteristics of SMM patients based on the presence of cPCs.
| Variables | cPCs present (N = 24) | cPCs absent (N = 76) | P - value |
|---|---|---|---|
|
| |||
| Age (median, 95% CI) | 61 (43 – 82) | 66 (34 – 85) | 0.168 |
|
| |||
| Male (No, %) | 8 (33%) | 43 (57%) | 0.062 |
|
| |||
| Bone marrow PC% | 25 (10 – 50) | 15 (10 – 70) | 0.102 |
|
| |||
| Beta-2-microglobulin | 2.8 (1.4 – 5.99) | 2.69 (1.2 – 52.7) | 0.974 |
|
| |||
| Hemoglobin | 12.2 (9 – 14.9) | 12.5 (9.6 – 16.6) | 0.208 |
|
| |||
| Calcium | 9.7 (8.5 – 10.6) | 9.6 (8.3 – 11.2) | 0.118 |
|
| |||
| Creatinine | 0.8 (0.6 – 1.6) | 1 (0.6 – 3.2) | 0.079 |
|
| |||
| HR FISH cytogenetics | |||
| Hyperdiploidy | 5 | 23 | |
| t (4;14) | 3 | 1 | |
| Deletion 17p | 1 | 1 | |
| t (11;14) | 5 | 8 | |
| t (14;16) | 4 | 1 | |
| Normal | 0 | 8 | |
|
| |||
| Serum M-Spike | 2.05 (0 – 4.7) | 2.10 (0 – 4.7) | 0.989 |
|
| |||
| Urine M-Spike | 6 (29%) | 16 (23%) | 0.772 |
|
| |||
| Type of Immunoglobulin | 0.483 | ||
| IgA | 7 | 17 | |
| IgG | 12 | 50 | |
| Light chain only | 3 | 5 | |
| Biclonal | 1 | 1 | |
|
| |||
| Immunoparesis | 0.033 | ||
| None | 0 (0%) | 13 (19%) | |
| 1 immunoglobulin class | 4 (18%) | 20 (29%) | |
| ≥2 Immunoglobulins class | 18 (82%) | 37 (52%) | |
TABLE 2.
Specificity and sensitivity of different cutoffs used for cPCs
| No of cPCs | No of Patients | Sensitivity | Specificity | PPV |
|---|---|---|---|---|
| ≥20 | 24 | 67% | 87% | 58% |
| ≥50 | 17 | 43% | 90% | 53% |
| ≥100 | 11 | 38% | 96% | 73% |
| ≥150 | 9 | 33% | 97% | 78% |
| ≥200 | 6 | 29% | 100% | 100% |
Factors predicting risk of progression
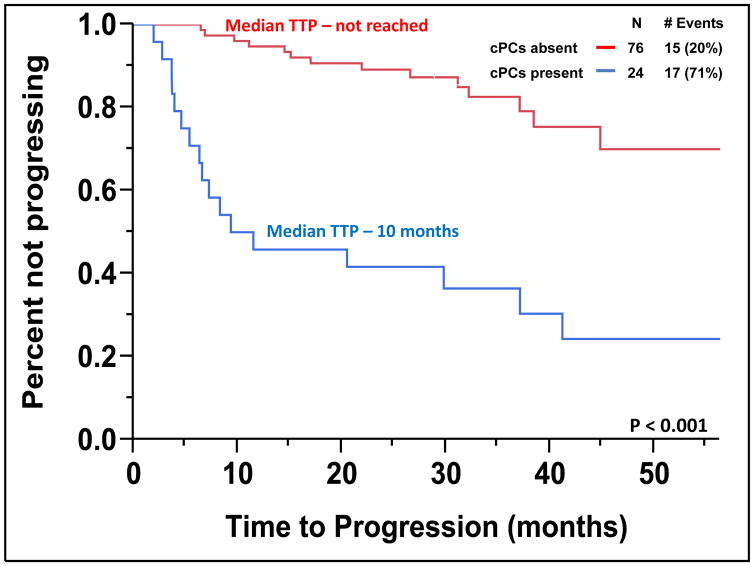
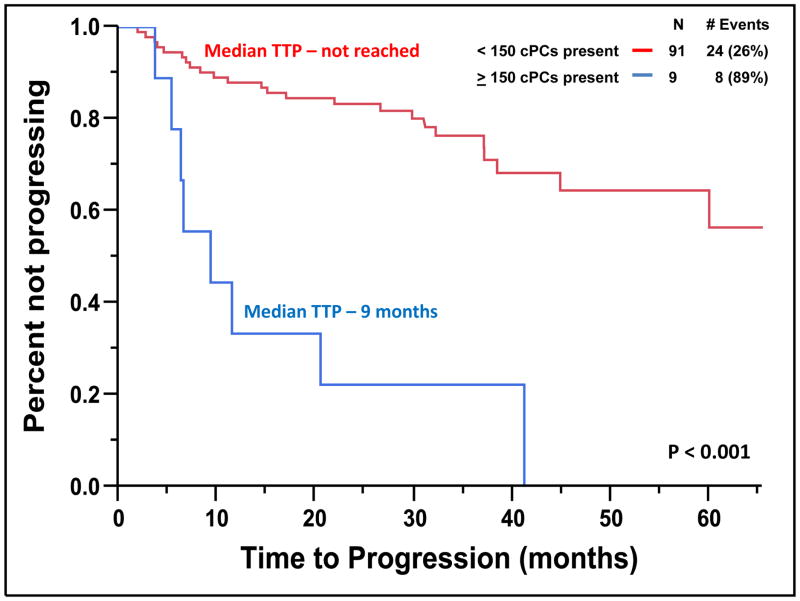
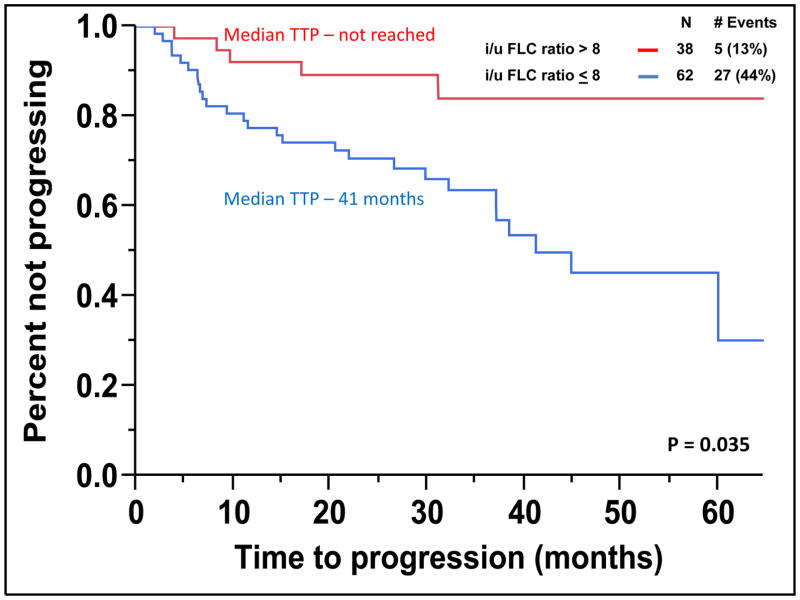
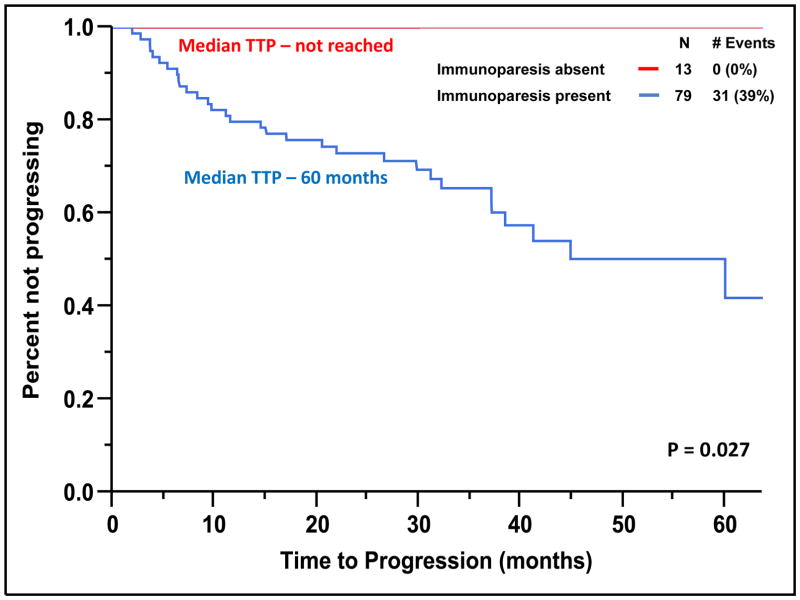
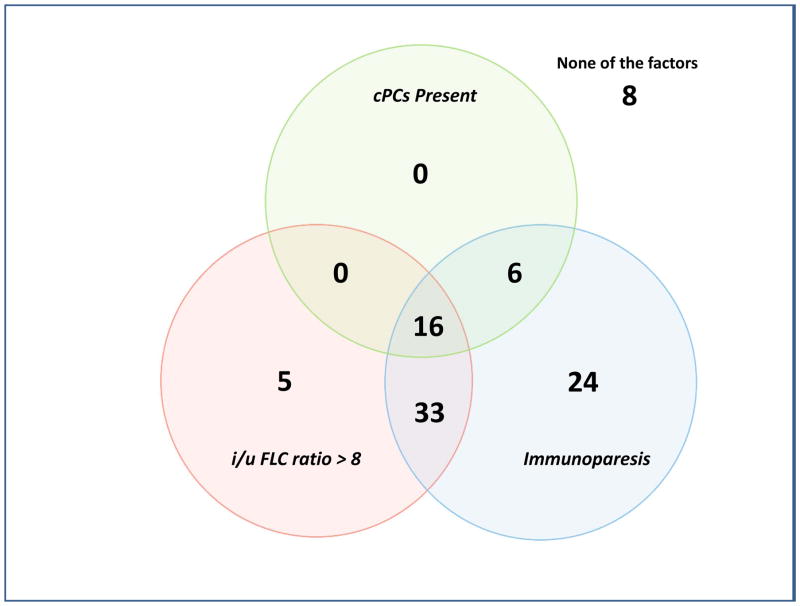
The median TTP of patients with SMM to MM with cPCs (N = 24) was 10 months compared to not reached for patients without cPCs (N = 76) (P < 0.001) (Figure 2). The progression to MM within 24 months was 58% for patients with cPCs compared to 9% for patients without cPCs (P < 0.001). When utilizing a cutoff of 150 cPCs, the median TTP of patients with ≥ 150 cPCs (N = 6) was 9 months compared to not reached for patients with less than 150 cPCs (N = 94) (P < 0.001) (Figure 3). There were 78% of patients with ≥ 150 or more cPCs who progressed to symptomatic myeloma within 24 months compared with 15% of patients with less than 150 cPCs (P < 0.001). The median TTP of patients with an involved/uninvolved (i/u) FLC ratio > 8 (N = 58) was 45 months compared to not reached for patients with an (i/u) FLC ratio ≤ 8 (N = 42) (P = 0.035) (Figure 4). Progression to MM within 24 months was 24% for patients with an (i/u) FLC ratio > 8 compared to 17% for patients with an (i/u) FLC ratio ≤ 8 (P = 0.459). The median TTP of patients with immunoparesis (N = 79) was 60 months compared to not reached for patients without immunoparesis (N = 13) (P = 0.027) (Figure 5). Progression to MM within 24 months was 25% for patients with immunoparesis compared to 0% for patients without immunoparesis (P = 0.008). The probability of any of the aforementioned overlapping risk factors for early progression of SMM to MM such as presence of cPCs, immunoparesis and (i/u) FLC ratio > 8 is demonstrated in Figure 6. In two separate multivariable models including both (i/u) FLC ratio > 8 and presence of immunoparesis with either a) the presence of cPCs or b) the presence of ≥ 150 cPCs, only the presence of cPCs (P < 0.001) and the presence of ≥ 150 cPCs (P = 0.008) were independent predictors of progression to MM within 2 years. When using the validated Mayo Clinic risk stratification model for SMM(15), 18 patients had ≥10% BMPC in addition to serum M-spike ≥ 3 g/dL (high-risk group) and the remainder had ≥10 BMPCs but a serum M-spike < 3 g/dL (intermediate-risk group). None of the patients had < 10% BMPCs or low-risk SMM. As per the aforementioned Mayo Clinic risk model, the high risk patients (N=18) in this cohort had a PPV of only 33% and specificity of 85% in predicting progression to MM within 2 years. The median TTP for the high-risk patients was 60 months compared to not reached for the intermediate-risk patients (P = 0.135) (Supplemental Figure 2).
Figure 2.
Kaplan-Meier plot comparing TTP between patients with SMM based on the presence
Figure 3.
Kaplan-Meier plot comparing TTP between patients with SMM based on the presence of 150 or more cPCs.
Figure 4.
Kaplan-Meier plot comparing TTP between patients with SMM based on the presence of an i/u FLC ratio > 8.
Figure 5.
Kaplan-Meier plot comparing TTP between patients with SMM based on the presence of immunoparesis.
Figure 6.
Venn diagram demonstrating the distribution of patients with any combination of risk factors for progression to MM.
Of the 56 patients with molecular cytogenetic results available, the median TTP of patients with either t(4;14) or deletion 17p mutations (N = 6) was 11 months compared to 38 months for the remainder (P = 0.086). Of these six patients with either t(4;14) or deletion 17p mutations, 5 or 83% had progressed to MM at last follow up and 4 did so within 24 months.
Myeloma defining events apart from CRAB features
There were 20 patients who had FLC ratio ≥ 100; of these only 7 had any cPCs and only 3 had ≥ 150 or more cPCs. The median TTP was 40 months in these patients with FLC ratio ≥ 100. There were only 3 patients who had BMPC ≥ 60%, none of whom had any cPCs and their median TTP was 17 months. Overall 22 patients had either one of the newly defined MDE and when they were excluded from the analysis, it left only 78 patients. Of these patients, the median TTP to MM in patients with cPCs (N = 17) was still 9 months compared to not reached for patients without cPCs (N = 61) (P < 0.001). The progression to MM within 24 months was 59% for patients with cPCs compared to 5% for patients without cPCs (P < 0.001). Similarly, the median TTP to MM in patients with ≥ 150 cPCs (N = 6) was 8 months compared to not reached for patients with less than 150 cPCs (N = 72) (P < 0.001). The progression to MM within 24 months was 83% for patients with ≥ 150 cPCs compared to 11% for patients with less than 150 cPCs (P < 0.002).
Overall Survival in SMM from the time of assessment for cPCs
Given the short follow up time, the median OS from the time of assessment for cPCs was not reached for this cohort of patients. However, the estimated three and five year OS was 81% and 70% for patients with cPCs and 97% and 95% for patients without cPCs (P = 0.075). The estimated three and five year OS was 79% and 67% for patients with ≥ 150 cPCs and 97% and 95% for patients with less than 150 cPCs (P = 0.043) (Supplemental Figure 3).
DISCUSSION
The overall risk of progression in SMM is 10% per year in the first 5 years, but then decreases to 3% per year in the following 5 years, and 1% per year thereafter.(15) This observation can be explained if patients with SMM are comprised of two separate groups: 1) a high-risk group consisting of patients with SMM who have disease that has already transformed to active MM and 2) a standard-risk group consisting of patients with a more indolent form of disease, similar to MGUS. The ongoing standard of care is to observe patients with a SMM due to the knowledge that a proportion of these patients are in the standard-risk group and can remain progression free for many years while being spared the toxicities of therapy. However, it is not always possible to identify the progression to MM and initiate therapy prior to the emergence of serious end-organ damage.(16) Thus, there has been an ongoing effort to identify the high-risk group of SMM patients who will likely progress to MM within 2–3 years of diagnosis in an attempt to decrease their risk of experiencing irreversible end-organ damage. Furthermore, recent randomized trial data has suggested that early intervention with novel agents may improve outcomes for such patients with high-risk SMM making it all the more important to accurately identify such patients.(17) Thus, most recently, the IMWG guidelines have recognized the presence of FLC ratio ≥ 100(3, 4), BMPC ≥ 60%(4, 5) and the presence of a single lesion on the MRI(6) as new myeloma defining events due to their high risk of progression (80% or more) to symptomatic MM within 2 years.(8)
The presence of cPCs in patients with SMM is believed to be a marker of more aggressive disease resulting in the ability of cPCs to migrate away from the supportive bone marrow microenvironment into the systemic circulation.(14) Bianchi et al demonstrated that the presence of high cPCs defined as absolute peripheral blood PCs > 5 ×10⁶/l and/or > 5% PCs per 100 cytoplasmic immunoglobulin (Ig)-positive peripheral blood mononuclear cells identified patients with SMM at high risk of progression to MM (i.e. 71% and 86% progressing to MM within 2 and 3 years respectively).(14) However, this study utilized a slide-based immunofluorescence assay to detect cPCs, which is a labor intensive process requiring fluorescence microscopy, thus limiting its clinical availability. More importantly, slide based assays have low sensitivity given the relatively small number of cells examined. Conversely, flow cytometry is a readily available tool that can not only detect cPCs rapidly with good correlation with the immunofluorescence-based method but in addition, can also quantify the absolute number of cPCs detected in a more sensitive and reproducible manner. This methodology holds promise for being able to be adopted universally in the future unlike the slide-based method.
This study expectedly demonstrates that the presence of cPCs detected by flow cytometry in patients with SMM predicts for a shorter median TTP (10 months vs. not reached) (Figure 2) and higher 2-year probability of progression (58% vs. 9%) to MM compared to those patients with SMM without detectable cPCs. Furthermore, increasing number of cPCs led to higher PPV and specificity of identifying patients with SMM progressing to MM within 2 years of their cPCs assessment by flow cytometry. Of the nine patients with ≥ 150 cPCs, seven (78%) progressed to MM within 2 years leading to a PPV of 78% and specificity of 97%. The PPV and specificity offered by the cutoff of ≥ 150 cPCs appears to be better than that provided by the current Mayo Clinic risk stratification system for SMM.
The presence of an abnormal serum (i/u) FLC ratio > 8 has been demonstrated to be a predictor of early progression to MM from SMM.(18) It has been hypothesized that clonal evolution of the pre-malignant PC to malignant PC leads to imbalances in the heavy and light chain production thus, predicting for a shorter TTP in SMM.(18) Similarly, in this study serum (i/u) FLC ratio > 8 also predicted for shorted TTP in SMM patients however, only 24% of patients progressed to MM within 24 months (Figure 4). The presence of immunoparesis has also been shown to be a predictor of early progression to MM in both MGUS and SMM.(19) In this study, patients with no immunoparesis (~13%) had no progression in MM based on their short median follow up time of 30 months. The role of immune system impairment in the risk of progression to MM has also been suggested by Paiva et al suggesting that high risk SMM patients have an impaired immune system.(20) Also, treatment with immunomodulators such as lenalidomide results in therapeutic immunomodulation associated with marked increases in functional T-lymphocytes and NK-cells to delay the progression to MM.(20) Nevertheless, only the presence of either any cPCs or just ≥ 150 cPCs were independent predictors of progression of SMM to MM within two years of cPC assessment in multivariable models that included both (i/u) FLC ratio > 8 and the presence of immunoparesis.
The EuroFlow-International Myeloma Foundation (IMF) next generation flow (NGF-MM) minimal residual disease (MRD) panel has been in development by the EuroFlow Consortium and the IMF for ultrasensitive and standardized detection of MRD in MM. This NGF-MM approach analyzes between 2 to 15 million events per sample compared to 150,000 events per sample in this study and is likely to be the standardized approach for MRD detection for MM in the future. This approach has been recently adopted for the high sensitive detection of cPCs and has detected them in virtually every SMM patient with a median absolute cPCs of 0.14 cPCs/μl (range: 0.022–14.58 cPCs/μl) and a median percentage of 0.0026% (range: 0.0002% – 0.23%).(21) The lower limit of detection of cPCs by the flow cytometry methodology used in this study is only 0.013%. Similar studies evaluating the utility of the new EuroFlow methodology in quantifying cPCs in SMM patients to identify a numeric cutoff predictive of early risk of progression should be done in the future if we are to adopt a universal standard.
There are other limitations to this study that need to be considered. First, the sample size is relatively small since this is a rare plasma cell disorder compared with MM or MGUS and the six-color multiparametric flow cytometer was utilized in clinical practice only over the last eight years. Second, not all patients had their peripheral blood assessed for cPCs at the same time of their original bone marrow biopsy confirming the diagnosis of SMM. Thus, it is not possible to know whether at the time of assessment for cPCs whether the BMPC% could have already increased to ≥ 60% implying a high risk status and currently defined as a MDE.8 Similarly, none of the patients with SMM at this institution underwent whole body skeletal MRI imaging to assess for focal myeloma lesions which has also been included as an MDE.8 We were unable to assess the utility of the Spanish model for risk stratification of SMM in our cohort of patients since we did not routinely utilize the same flow cytometry methodologies to determine the percentage of aberrant PCs in the BMPC compartment.(19) Hence, we were only able to assess the prognostic effect of the Mayo Clinic model.(15) Finally, majority of patients were not followed routinely with PET/CT scans which has been recently found to be useful in detecting early myeloma related osteolytic bone lesions thus possibly underestimating the number of patients that progressed.(22, 23)
Nevertheless, our study still demonstrates the utility of quantifying cPCs by multiparameter flow cytometry in order to identify patients with SMM at very high risk of progression to MM. Additional studies to further evaluate the cPCs using NGF-MM flow cytometry methodology should be pursued in ongoing clinical trials for patients with SMM. This will allow us to consider the initiation of therapy in such high-risk SMM patients prior to them enduring end-organ damage.
Supplementary Material
Example of a multiparametric flow cytometry assessment for cPCs in the peripheral blood.
Kaplan-Meier plot comparing TTP between patients with intermediate-risk and high-risk SMM based on the Mayo Clinic risk stratification model.
Kaplan-Meier plot comparing OS between patients with SMM based on the presence of 150 or more cPCs.
Key points.
The quantification of circulating clonal plasma cells by multiparametric flow cytometry identifies patients with smoldering myeloma at high risk of progression.
Acknowledgments
This work is supported in part by: Mayo Clinic Hematological Malignancies Program and in part by grants CA107476, CA62242, CA100707, CA168762 and CA83724 from the National Cancer Institute, Rockville, MD, USA. It is also supported in part by the Jabbs Foundation, Birmingham, United Kingdom and the Henry J. Predolin Foundation, USA as well as the CTSA Grant UL1 TR000135 from the National Center for Advancing Translational Sciences (NCATS), a component of the National Institutes of Health (NIH). Finally, the Marion Schwarz Foundation for Multiple Myeloma has also provided support for this study.
Footnotes
AUTHORSHIP
Contribution: S.K.K., S.V.R. and W.I.G designed the study and analyzed the data and wrote the manuscript; M.A.G., A.D., M.Q.L., W.G.M., M.M.T., F.K.B., Y.L., D.D., R.S.G, S.R.H., J.A.L., N.L., R.A.K., S.R.Z., S.R. and P.K. contributed to writing and reviewing the manuscript.
Conflict-of-interest disclosure:
S.K.K., S.V.R., M.A.G., A.D., M.Q.L., W.G.M., M.M.T., F.K.B., Y.L., D.D., R.S.G, S.R.H., J.A.L., N.L., R.A.K., S.R.Z., S.R. and P.K.: These authors declare no competing financial interests.
References
- 1.Kyle RA, Rajkumar SV. Criteria for diagnosis, staging, risk stratification and response assessment of multiple myeloma. Leukemia. 2009 Jan;23(1):3–9. doi: 10.1038/leu.2008.291. [DOI] [PMC free article] [PubMed] [Google Scholar]
- 2.Criteria for the classification of monoclonal gammopathies, multiple myeloma and related disorders: a report of the International Myeloma Working Group. Br J Haematol. 2003 Jun;121(5):749–757. [PubMed] [Google Scholar]
- 3.Larsen JT, Kumar SK, Dispenzieri A, Kyle RA, Katzmann JA, Rajkumar SV. Serum free light chain ratio as a biomarker for high-risk smoldering multiple myeloma. Leukemia. 2013 Apr;27(4):941–946. doi: 10.1038/leu.2012.296. [DOI] [PMC free article] [PubMed] [Google Scholar]
- 4.Kastritis E, Terpos E, Moulopoulos L, Spyropoulou-Vlachou M, Kanellias N, Eleftherakis-Papaiakovou E, et al. Extensive bone marrow infiltration and abnormal free light chain ratio identifies patients with asymptomatic myeloma at high risk for progression to symptomatic disease. Leukemia. 2013 Apr;27(4):947–953. doi: 10.1038/leu.2012.309. [DOI] [PubMed] [Google Scholar]
- 5.Rajkumar SV, Larson D, Kyle RA. Diagnosis of smoldering multiple myeloma. N Engl J Med. 2011 Aug 4;365(5):474–475. doi: 10.1056/NEJMc1106428. [DOI] [PMC free article] [PubMed] [Google Scholar]
- 6.Hillengass J, Fechtner K, Weber MA, Bauerle T, Ayyaz S, Heiss C, et al. Prognostic significance of focal lesions in whole-body magnetic resonance imaging in patients with asymptomatic multiple myeloma. J Clin Oncol. 2010 Mar 20;28(9):1606–1610. doi: 10.1200/JCO.2009.25.5356. [DOI] [PubMed] [Google Scholar]
- 7.Kastritis E, Moulopoulos LA, Terpos E, Koutoulidis V, Dimopoulos MA. The prognostic importance of the presence of more than one focal lesion in spine MRI of patients with asymptomatic (smoldering) multiple myeloma. Leukemia. 2014 Dec;28(12):2402–2403. doi: 10.1038/leu.2014.230. [DOI] [PubMed] [Google Scholar]
- 8.Rajkumar SV, Dimopoulos MA, Palumbo A, Blade J, Merlini G, Mateos MV, et al. International Myeloma Working Group updated criteria for the diagnosis of multiple myeloma. Lancet Oncol. 2014 Nov;15(12):e538–548. doi: 10.1016/S1470-2045(14)70442-5. [DOI] [PubMed] [Google Scholar]
- 9.Rajkumar SV. Evolving diagnostic criteria for multiple myeloma. Hematology Am Soc Hematol Educ Program. 2015 Dec 5;2015(1):272–278. doi: 10.1182/asheducation-2015.1.272. [DOI] [PubMed] [Google Scholar]
- 10.Gonsalves WI, Rajkumar SV, Go RS, Dispenzieri A, Gupta V, Singh PP, et al. Trends in survival of patients with primary plasma cell leukemia: a population-based analysis. Blood. 2014 Aug 7;124(6):907–912. doi: 10.1182/blood-2014-03-565051. [DOI] [PMC free article] [PubMed] [Google Scholar]
- 11.Gonsalves WI, Morice WG, Rajkumar V, Gupta V, Timm MM, Dispenzieri A, et al. Quantification of clonal circulating plasma cells in relapsed multiple myeloma. Br J Haematol. 2014 Nov;167(4):500–505. doi: 10.1111/bjh.13067. [DOI] [PMC free article] [PubMed] [Google Scholar]
- 12.Nowakowski GS, Witzig TE, Dingli D, Tracz MJ, Gertz MA, Lacy MQ, et al. Circulating plasma cells detected by flow cytometry as a predictor of survival in 302 patients with newly diagnosed multiple myeloma. Blood. 2005 Oct 1;106(7):2276–2279. doi: 10.1182/blood-2005-05-1858. [DOI] [PMC free article] [PubMed] [Google Scholar]
- 13.Kumar S, Rajkumar SV, Kyle RA, Lacy MQ, Dispenzieri A, Fonseca R, et al. Prognostic value of circulating plasma cells in monoclonal gammopathy of undetermined significance. J Clin Oncol. 2005 Aug 20;23(24):5668–5674. doi: 10.1200/JCO.2005.03.159. [DOI] [PubMed] [Google Scholar]
- 14.Bianchi G, Kyle RA, Larson DR, Witzig TE, Kumar S, Dispenzieri A, et al. High levels of peripheral blood circulating plasma cells as a specific risk factor for progression of smoldering multiple myeloma. Leukemia. 2013 Mar;27(3):680–685. doi: 10.1038/leu.2012.237. [DOI] [PMC free article] [PubMed] [Google Scholar]
- 15.Kyle RA, Remstein ED, Therneau TM, Dispenzieri A, Kurtin PJ, Hodnefield JM, et al. Clinical course and prognosis of smoldering (asymptomatic) multiple myeloma. N Engl J Med. 2007 Jun 21;356(25):2582–2590. doi: 10.1056/NEJMoa070389. [DOI] [PubMed] [Google Scholar]
- 16.Bianchi G, Kyle RA, Colby CL, Larson DR, Kumar S, Katzmann JA, et al. Impact of optimal follow-up of monoclonal gammopathy of undetermined significance on early diagnosis and prevention of myeloma-related complications. Blood. 2010 Sep 23;116(12):2019–2025. doi: 10.1182/blood-2010-04-277566. quiz 2197. [DOI] [PMC free article] [PubMed] [Google Scholar]
- 17.Mateos MV, Hernandez MT, Giraldo P, de la Rubia J, de Arriba F, Lopez Corral L, et al. Lenalidomide plus dexamethasone for high-risk smoldering multiple myeloma. N Engl J Med. 2013 Aug 1;369(5):438–447. doi: 10.1056/NEJMoa1300439. [DOI] [PubMed] [Google Scholar]
- 18.Dispenzieri A, Kyle RA, Katzmann JA, Therneau TM, Larson D, Benson J, et al. Immunoglobulin free light chain ratio is an independent risk factor for progression of smoldering (asymptomatic) multiple myeloma. Blood. 2008 Jan 15;111(2):785–789. doi: 10.1182/blood-2007-08-108357. [DOI] [PMC free article] [PubMed] [Google Scholar]
- 19.Perez-Persona E, Vidriales MB, Mateo G, Garcia-Sanz R, Mateos MV, de Coca AG, et al. New criteria to identify risk of progression in monoclonal gammopathy of uncertain significance and smoldering multiple myeloma based on multiparameter flow cytometry analysis of bone marrow plasma cells. Blood. 2007 Oct 1;110(7):2586–2592. doi: 10.1182/blood-2007-05-088443. [DOI] [PubMed] [Google Scholar]
- 20.Paiva B, Mateos MV, Sanchez-Abarca LI, Puig N, Vidriales MB, Lopez-Corral L, et al. Immune status of high-risk smoldering multiple myeloma patients and its therapeutic modulation under LenDex: a longitudinal analysis. Blood. 2015 Dec 14; doi: 10.1182/blood-2015-10-662320. [DOI] [PubMed] [Google Scholar]
- 21.Sanoja-Flores L, Paiva B, Flores-Montero JA, Puig N, Burgos L, García O, et al. Next Generation Flow (NGF): A High Sensitive Technique to Detect Circulating Peripheral Blood (PB) Clonal Plasma Cells (cPC) in Patients with Newly Diagnosed of Plasma Cell Neoplasms (PCN). American Society of Hematology (ASH) 57th Annual Meeting; 2015. [Google Scholar]
- 22.Siontis B, Kumar S, Dispenzieri A, Drake MT, Lacy MQ, Buadi F, et al. Positron emission tomography-computed tomography in the diagnostic evaluation of smoldering multiple myeloma: identification of patients needing therapy. Blood Cancer J. 2015;5:e364. doi: 10.1038/bcj.2015.87. [DOI] [PMC free article] [PubMed] [Google Scholar]
- 23.Zamagni E, Nanni C, Gay F, Pezzi A, Patriarca F, Bello M, et al. 18F-FDG PET/CT focal, but not osteolytic, lesions predict the progression of smoldering myeloma to active disease. Leukemia. 2015 Oct 22; doi: 10.1038/leu.2015.291. [DOI] [PubMed] [Google Scholar]
Associated Data
This section collects any data citations, data availability statements, or supplementary materials included in this article.
Supplementary Materials
Example of a multiparametric flow cytometry assessment for cPCs in the peripheral blood.
Kaplan-Meier plot comparing TTP between patients with intermediate-risk and high-risk SMM based on the Mayo Clinic risk stratification model.
Kaplan-Meier plot comparing OS between patients with SMM based on the presence of 150 or more cPCs.


