Abstract
It has been hypothesized that the brain organizes concepts into a mental map, allowing conceptual relationships to be navigated in a similar fashion to space. Grid cells use a hexagonally-symmetric code to organize spatial representations and are the likely source of a precise hexagonal symmetry in the functional magnetic resonance imaging signal. Humans navigating conceptual two-dimensional knowledge showed the same hexagonal signal in a strikingly similar set of brain regions to those activated during spatial navigation. This grid-like signal is consistent across sessions acquired within an hour and more than a week apart. Our findings suggest that global relational codes may be used to organize non-spatial conceptual representations and that these codes may have hexagonal grid-like pattern when conceptual knowledge is laid out in two continuous dimensions.
Humans have a remarkable capacity for generalizing experiences to novel situations(1, 2). It has been hypothesized that this capacity relies on a ‘cognitive map’, allowing conceptual relationships to be navigated in a similar fashion to space(3–6). Grid cells use a hexagonally-symmetric code to organize spatial representations(7). Here we ask whether conceptual knowledge may also be organized by grid-like codes.
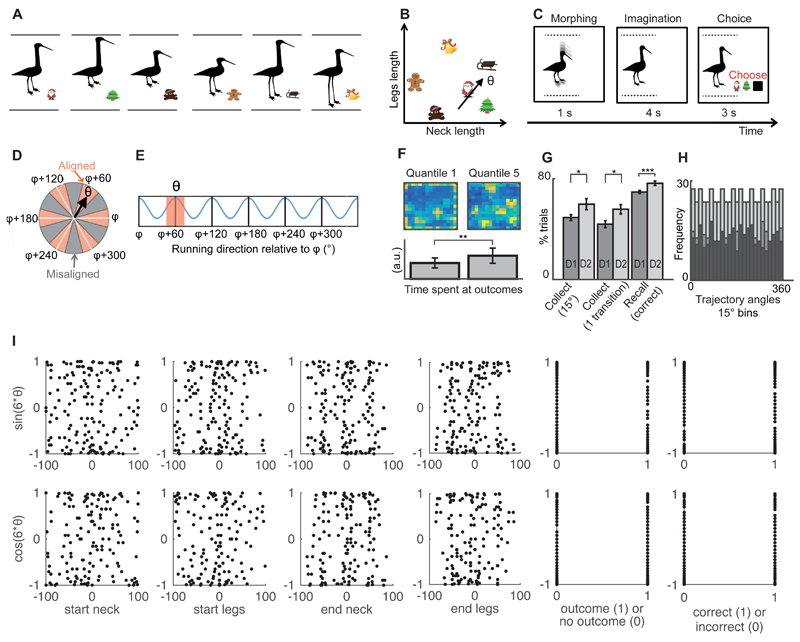
Human grid cells have been identified during intra-operative recordings(8) and are the likely source of a precise six-fold (hexagonal) symmetry in the functional magnetic resonance imaging (fMRI) signal, as a function of movement direction during virtual navigation(9–11).This hexagonal signal varies depending on whether the direction of moving in space is aligned or misaligned with the orientation of the grid (Fig. 1D-E). Such a signal is a precise and unusual prediction for fMRI (Supplementary text): it is predicted in the bulk activity because grid cells share a common grid axis (12–14), and conjunctive grid cells fire faster on average when movement is aligned to this axis (9). It pertains to the moving direction and cannot be explained by any characteristics of the currently experienced visual scene. It is hexagonal and therefore does not align on average to the cardinal directions. Its temporal waveform is different in every scan and every subject (Fig. S4) and thus cannot be easily predicted by imaging artefacts (Supplementary text and Table S1).
Fig. 1. Experimental design for navigation in abstract space.
(A) Subjects were trained to associate stimuli (birds) with outcomes (Christmas symbols). (B) Example trajectory in abstract space. A location in this abstract space was represented by a bird stimulus. A trajectory was equivalent to visually morphing one bird into another (Fig. 1C). The direction θ of the trajectory depended on the ratio of the rates of change of the legs and the neck (Movie S1). Subjects were not consciously aware that these associations could be organized in a continuous “bird space”. (C) Example trial corresponding to the trajectory with direction θ. (D) Trajectories can be categorized as aligned (red sectors) or misaligned (grey sectors) with the mean orientation φ of the hexagonal grid Note that φ is different for each participant (see(26) for details on how φ was calculated). Here, the direction θ is aligned with the grid. (E) fMRI markers of grid cells showing hexagonal symmetry: the signal is bigger for trajectories aligned versus those misaligned with the grid. (F) Color-coded trajectory maps illustrating time spent in each part of the environment during the “explore” task in the first (quantile1) and last parts of training (quantile5). Yellow is maximum and dark blue is 0. Barplots showing the amount of time spent at the locations/stimuli paired with outcomes in each epoch relative to the total time spent navigating (“time at outcomes” quantile1 vs quantile5, t22=-3.17, ** p<0.01). (G) In the “collect” task, participants made significant improvements in training day 2 compared to training day 1: the percentage of trials with an angle error < 15° (t33=2.37, * p<0.05) and with only one transition increased (t33=2.55, * p<0.05). In the “recall” task, participants made significantly more correct responses in day 2 compared to day 1 (t41=3.89, *** p<0.001). (H) Example data from the most commonly used schedule: even distribution of trajectory angles across all trials (light grey), outcome trials (medium grey) and non-outcome trials (dark grey). (I) Example data from the most commonly used schedule: we tested if the sin(6θ) and cos(6θ) regressors correlated with multiple confounding factors. These regressors did not correlate with the start neck, start legs, end neck and end legs lengths, whether the subject responded accurately or whether the morph passed through an outcome (all coefficients of determination R2 averaged across all subjects < 0.02). (D and E are adapted by permission from Nature, Doeller et al, 2010).
This grid-like signal is not unique to the entorhinal cortex, but can be measured during spatial navigation in prescribed parts of the medial frontal, medial parietal and lateral temporal cortices(9). Despite no report in rodents of grid cells outside the hippocampal formation, direct recordings during brain surgery in humans have confirmed grid-like firing patterns in some of these areas(8). This same network of brain regions, often referred to as the 'default mode network'(15), is also regularly activated in non-spatial tasks that involve the manipulation of conceptual knowledge, such as memory(16), imagination(17), scene construction(18), valuation(19) and theory of mind (20), and in situations when subjects must generalize learnt concepts to novel situations(1, 2, 21).
The ability to interact with knowledge in this flexible and generalizable fashion is the central advantage of maintaining an explicit cognitive map(3). Together with the regions’ established role in non-spatial conceptual generalization, the finding of grid-like activity in these brain regions during spatial navigation therefore raises the possibility of common neural coding mechanisms for storing spatial and conceptual representations. Indeed, this hypothesis is strengthened by the findings that hippocampal cells (analogous to rodent place-cells) encode individual concepts in humans (22) and sound frequency in rodents(23), and that rodent grid cell coding may not be restricted to spatial dimensions, but also represent time(24).
We used fMRI to test if humans use a hexagonally symmetric code when navigating through abstract conceptual representations. We designed a task analogous to the one used for navigation in physical space(9), with the notable difference that our dimensions were organized in an abstract, rather than physical, space.
Twenty-eight healthy subjects performed a stimulus-outcome (S-O) learning task where they learnt that bird stimuli(25) were associated with different Christmas symbols (Fig. 1A). The study therefore resembles other S-O learning tasks except that here, the bird stimuli were not independent fractals or symbols but, instead, they varied according to two continuous dimensions: the lengths of the neck and legs. Each stimulus could therefore be described within a two-dimensional conceptual “bird space” (Fig. 1B). Even though the features of this “bird space” were lengths as in physical maps, here they had to be extracted from a one-dimensional (vertical) visual space where different stimuli did not form any angles (Fig. 1A) and transformed into a two-dimensional conceptual map (Fig. 1B).
Participants had extensive experience of the bird space the day before scanning (26). Briefly, we first trained them to morph birds with specific neck:legs ratios, using a non-spatial controller (Fig. S1). Next, the participants learned which bird stimuli were paired with outcomes by freely morphing the neck and legs dimensions. The outcome symbols would appear on screen whenever the morph matched the associated bird (Fig. S2). This ensured that subjects became familiar with the entire bird space and not just with the S-O pairings. Indeed, participants progressively refined the locations of the outcomes through training (Fig. 1F and Fig. S6). We periodically tested their knowledge of the bird space by asking them to find specific outcomes from arbitrary start positions, by correctly choosing the appropriate neck:legs ratio. When asked to make such ballistic movements, subjects significantly increased their precision through training, and therefore learned to visualize the target bird (Fig. 1G and Fig. S7). In the scanner, participants continued to improve performance each day, possibly because they received fresh training before each day’s scanning (Fig. 1G and Fig. S8).
Each subject participated in 2-4 separate fMRI sessions, spanning two separate days, at least one week apart. In each trial during scanning, subjects watched a video of a bird morphing according to a pre-defined neck:legs ratio (Fig. 1C, Movie S1). They were then instructed to imagine the outcome if the bird continued to morph with the same neck:legs ratio. In some trials, they had to choose one of three offered outcomes: two outcomes they were trained with and a “no outcome” option (black square). Participants reached a performance of 72.8 ± 1.0 % accuracy in predicting outcomes, and 0 out of 28 reported conceiving of the relationships between birds or outcomes as lying in a spatial map(26).
With the ambition to test whether the fMRI signal had hexagonal symmetry, as a proxy for grid cells, we ensured that the orientation of the trajectories for movement in bird-space were dissociated from the properties of the visual scene. That is, trajectories with the same orientation were formed by different stimuli, and trajectories with different orientations could pass through the same stimulus. Indeed, the critical hexagonal symmetry regressors described below never shared more than 5% variance with any tested basic visual property of the stimuli, outcomes, or behavioral accuracy in any subject (Fig. 1I). The trajectories were sampled evenly across directions both in sum, and when separated according to outcome (Fig. 1H, S5).
Despite the absence of any hexagonal modulation of these confounding factors, we found a hexagonal modulation effect in the neural activity. We first identified hexagonally symmetric signals across the whole brain and then we focused on those regions where the effect was strongest. This approach allowed us to test in an unbiased fashion if this hexagonal symmetry had a consistent grid angle across two sessions acquired on the same day, and more than a week apart.
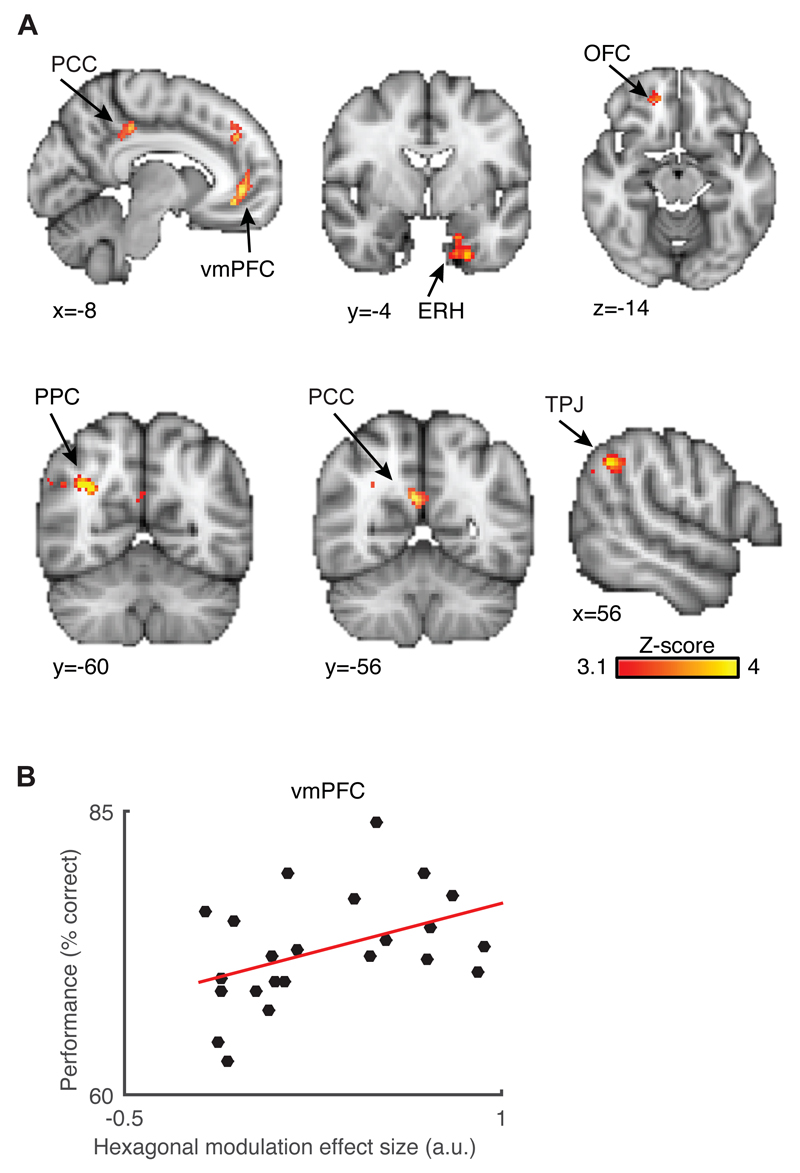
To identify brain regions sensitive to hexagonal symmetry, we used a Z-transformed F-statistic to test for a significant modulation of the fMRI signal by any linear combination of sin(6θ) and cos(6θ), where θ is the trajectory angle in bird space ((26) and Fig. S3). We found hexagonal symmetry in a network of brain regions that overlapped anatomically with the network found during navigation in physical space(8, 9) and with the default-mode network(15) (Fig. 2A, Fig. S10). However, although these brain regions all survived whole-brain cluster correction, this quadrature test could overestimate the Z-scores(26). Thus, we did not use this test for statistical inference per se but rather to create orthogonal regions of interest that allowed us to test in an unbiased fashion if the grid angle was consistent across separate experimental sessions. This was possible because the quadrature test was independent from the phase of the periodic signal, that is, the grid angle. We focused on brain regions where grid cells have been recorded in humans during spatial tasks(8), that is, the anterior cingulate/medial prefrontal cortex (mPFC) and entorhinal cortex (ERH).
Fig. 2. Identifying hexagonally symmetric signals across the whole brain.
(A) Hexagonal modulation in a network of brain regions including the medial prefrontal cortex, with a peak in its ventral region (vmPFC; peak Montreal Neurological Institute coordinates -8/42/0, peak Z-score = 4.09), the medial entorhinal (ERH; -18/0/-38; Z = 4.41), the orbitofrontal (OFC; 6/44/-10; Z = 4.27), the posterior cingulate (PCC; 0/-32/28; Z = 4.3), retrosplenial (RSC; 6/-52/24; Z = 4.73) and lateral parietal cortices (LPC; 30/-62/28; Z = 4.96) and the temporoparietal junction (TPJ; 52/-42/40; Z = 4.13). For visualization purposes, the maps are cluster corrected at a cluster threshold Z = 3.1 and p < 0.05 for all brain regions apart from the ERH where we used a more lenient threshold of Z = 2.3 and p < 0.05. (B) Subjects who performed better at the task had significantly more hexagonal signal modulation in the vmPFC (correlation coefficient r = 0.432, p = 0.039).
Using the peak coordinate of the hexagonal modulation signal in the mPFC located ventrally (vmPFC), we found that subjects with greater hexagonal modulation had a more accurate performance at the task (Fig. 2B). This region has also been shown to correlate with the performance in memory and conceptual knowledge tests(1, 21). As previously described for spatial hexagonal symmetries(9, 10), we next asked whether the grid angle to which this hexagonal modulation was aligned was consistent between separate experimental sessions. We thus used the data from one session to estimate the grid angle for a given participant, using the beta coefficients for the sin(6θ) and cos(6θ) regressors ((26)and Fig. S3). We then took the data from a separate session and looked for differences in activation between trials in which the trajectories were aligned versus misaligned to this hexagonal grid. This was achieved using the regressor cos(6[θ(t) - φ]), where θ(t) is the trajectory orientation in trial t and φ is the mean grid orientation across the region on interest(9, 10). This “cross-validation” procedure was counter-balanced across sessions. We then performed a one-sample t-test across the group on the resulting regression coefficients.
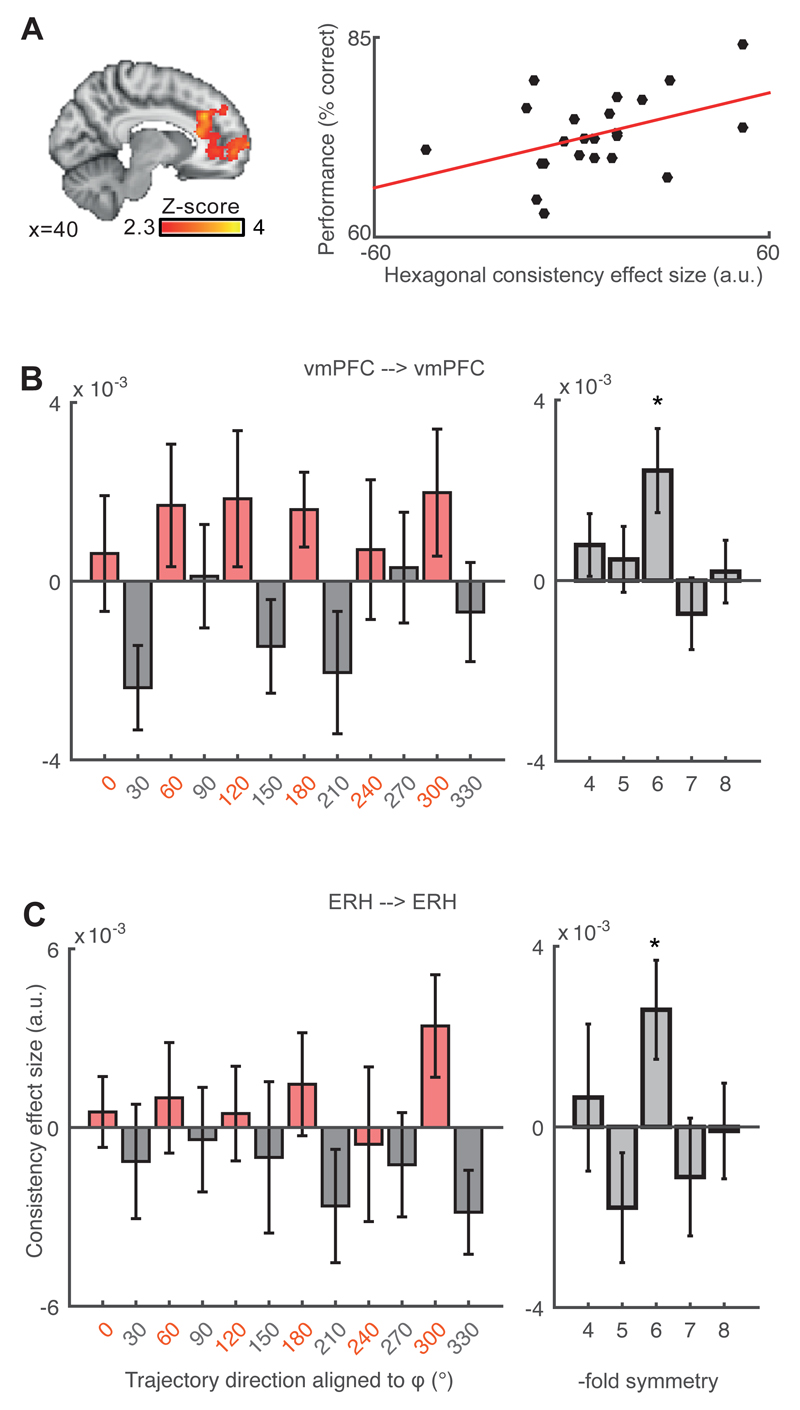
Using this approach, we tested for hexagonal consistency between separate sessions acquired half an hour apart. We found such an effect at the whole brain level in the vmPFC (Fig. 3A, left). To test if this effect was a function of the presence of outcomes, we included in the design matrix a confound regressor that modeled out the effect of outcomes. We found that the map did not change (Fig. S11). Again, the consistency effect correlated with behavior in subjects who performed better at the task (Fig 3A, right). Thus, we replicated the finding that participants with more grid-like representations performed better at the task, using two independent analyses. The same neural signal was not predicted by the speed of learning of the task during training ((26) and Fig. 1F, G). Grid-like activity was therefore related to the current performance rather than the trajectory of learning.
Fig. 3. Grid angle consistency between separate sessions acquired within the same day.
(A) Left: Whole brain level grid angle consistency in vmPFC (cluster corrected Z = 2.3 and p < 0.05; 16/54/-2; Z = 3.76, p < 0.0001). Right: participants with higher hexagonal consistency performed more accurately on the task (r = 0.431, p = 0.039). (B-C) Left panels: 6-fold modulation signals aligned to the same grid angle in the vmPFC (t26 = 2.61, * p < 0.05) and ERH (t27 = 2.36, * p < 0.05). The effect is plotted separately for all aligned (red) and misaligned (grey) trajectories. Right panels: this effect was specific for 6-fold, but not any other control periodicities between 4- and 8-fold (all p > 0.15).
Next, to examine the pattern underlying this hexagonal effect, we separated all aligned (red) and misaligned (grey) trajectories ((26) and Fig. 1D). The signal in the vmPFC was significantly higher for aligned than misaligned trajectories (Fig. 3B). The same pattern appeared in ERH (Fig. 3C). This effect was significant only for six-fold but not control four-, five-, seven- and eight-fold symmetries (Fig. 3B-C, right panels).
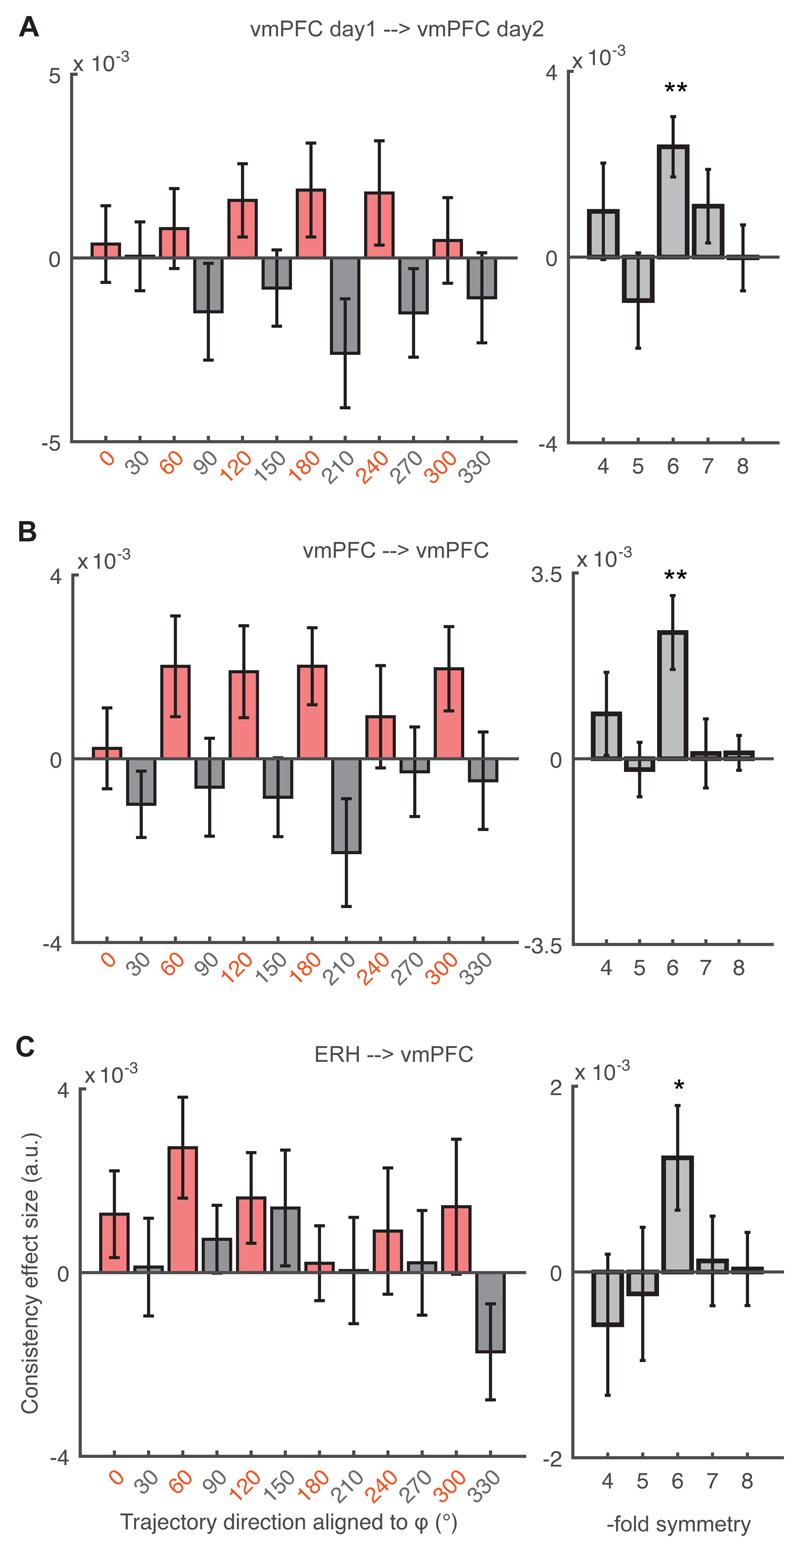
We also tested for hexagonal consistency between separate sessions acquired more than a week apart. We found a significant effect in the vmPFC (Fig. 4A). When grouping together within- and between-day data, the consistency effect was strongest in the vmPFC (Fig. 4B). Moreover, we found hexagonal consistency also between the ERH and vmPFC, suggesting that different brain regions may contain grid-like activity that is aligned to the same angle (Fig 4C). Again, all these effects were significant only in hexagonal but not control symmetries (Fig. 4, right panels).
Fig. 4. Grid angle consistency between separate sessions acquired more than a week apart.
(A) Cross-day consistency of the grid angle in vmPFC (left panel t20 = 3.65, ** p<0.01; right panel all p > 0.18 for control periodicities). (B) Within- and cross-day consistency in vmPFC (left panel t20 = 3.41, ** p < 0.01; right panel all control p > 0.15). (C) Cross-region consistency between the ERH and vmPFC (left panel t21 = 2.18, * p < 0.05; right panel all control p > 0.46).
Whilst the coarse nature of the fMRI signal forces caution in making conclusions at the level of neuronal codes, we have reported an unusually precise hexagonal modulation of the fMRI signal during non-spatial cognition. When subjects perform this abstract cognitive task, this signal exists in a strikingly similar set of brain regions to those observed when subjects run in a virtual reality spatial environment((9) and Fig. S9), despite profound differences in the cognitive and perceptual demands of the two tasks. The hexagonal grid is consistently oriented across sessions that are acquired both half an hour and more than a week apart. Together, this evidence suggests that grid-like codes that are known to underlie spatial navigation, and recently discovered in the temporal dimension(24), can also be used to organize abstract knowledge of the type that is difficult to study in nonhuman species. In the event that such conceptual grid cells can be recorded directly, it will be of interest to know whether they share relationships (such as relative phases) across spatial and conceptual tasks, suggesting conceptual tasks can be solved by subconsciously mapping abstract dimensions onto pre-existing spatial maps, or whether new organizations can emerge to represent conceptual problems. It will also be informative to study how such cells behave in conceptual problems that are not easily mapped onto continuous 2-dimensional spaces(27, 28).
Supplementary Material
One Sentence Summary.
Non-spatial conceptual knowledge can be organized using a grid-like code in the human brain.
Acknowledgments
We thank Neil Burgess, Zeb Kurth-Nelson, Helen Barron, Laurence Hunt, Mona Garvert and Tim Muller for helpful discussions and comments on this manuscript, as well as the anonymous peer reviewers who greatly improved the manuscript. We thank Saad Jbabdi for help with data collection and analysis, as well as Anderson Winkler and Ludovica Griffanti for guidance. We also thank all participants for volunteering in this study. The study was supported by a Wellcome Trust 4-year PhD studentship (099715/Z/12/Z) to AOC, an MRC Career Development Award (MR/L019639/1) to JXOR, and a Wellcome Trust Senior Research Fellowship (WT104765MA) together with a James S McDonnell Foundation Award (JSMF220020372) to TEJB.
Footnotes
The authors declare no conflicts of interest. All raw data are archived at the Oxford Centre for Functional MRI of the Brain.
References
- 1.Kumaran D, Summerfield JJ, Hassabis D, Maguire EA. Tracking the emergence of conceptual knowledge during human decision making. Neuron. 2009;63:889–901. doi: 10.1016/j.neuron.2009.07.030. [DOI] [PMC free article] [PubMed] [Google Scholar]
- 2.Barron HC, Dolan RJ, Behrens TEJ. Online evaluation of novel choices by simultaneous representation of multiple memories. Nat Neurosci. 2013;16:1492–1498. doi: 10.1038/nn.3515. [DOI] [PMC free article] [PubMed] [Google Scholar]
- 3.Tolman EC. Cognitive maps in rats and men. Psychol Rev. 1948;55:189–208. doi: 10.1037/h0061626. [DOI] [PubMed] [Google Scholar]
- 4.O’Keefe J, Nadel L. The Hippocampus as a Cognitive Map. Oxford Univ. Press; 1978. [Google Scholar]
- 5.Buzsáki G, Moser EI. Memory, navigation and theta rhythm in the hippocampal-entorhinal system. Nat Neurosci. 2013;16:130–138. doi: 10.1038/nn.3304. [DOI] [PMC free article] [PubMed] [Google Scholar]
- 6.Eichenbaum H, Cohen NJ. Can we reconcile the declarative memory and spatial navigation views on hippocampal function? Neuron. 2014;83:764–770. doi: 10.1016/j.neuron.2014.07.032. [DOI] [PMC free article] [PubMed] [Google Scholar]
- 7.Hafting T, Fyhn M, Molden S, Moser M-B, Moser EI. Microstructure of a spatial map in the entorhinal cortex. Nature. 2005;436:801–806. doi: 10.1038/nature03721. [DOI] [PubMed] [Google Scholar]
- 8.Jacobs J, Weidemann CT, Miller JF, Solway A, Burke JF, Wei XX, Suthana N, Sperling MR, Sharan AD, Fried I, Kahana MJ. Direct recordings of grid-like neuronal activity in human spatial navigation. Nat Neurosci. 2013;16:1188–1190. doi: 10.1038/nn.3466. [DOI] [PMC free article] [PubMed] [Google Scholar]
- 9.Doeller CF, Barry C, Burgess N. Evidence for grid cells in a human memory network. Nature. 2010;463:657–661. doi: 10.1038/nature08704. [DOI] [PMC free article] [PubMed] [Google Scholar]
- 10.Kunz L, Schröder TN, Lee H, Montag C, Lachmann B, Sariyska R, Reuter M, Stirnberg R, Stöcker T, Messing-Floeter PC, Fell J, et al. Reduced grid-cell-like representations in adults at genetic risk for Alzheimer’s disease. Science. 2015;350:430–433. doi: 10.1126/science.aac8128. [DOI] [PubMed] [Google Scholar]
- 11.Horner AJ, Bisby JA, Zotow E, Bush D, Burgess N. Grid-like Processing of Imagined Navigation. Curr Biol. 2016;26:842–847. doi: 10.1016/j.cub.2016.01.042. [DOI] [PMC free article] [PubMed] [Google Scholar]
- 12.Barry C, Hayman R, Burgess N, Jeffery KJ. Experience-dependent rescaling of entorhinal grids. Nat Neurosci. 2007;10:682–684. doi: 10.1038/nn1905. [DOI] [PubMed] [Google Scholar]
- 13.Stensola H, Stensola T, Solstad T, Frøland K, Moser MB, Moser EI. The entorhinal grid map is discretized. Nature. 2012;492:72–78. doi: 10.1038/nature11649. [DOI] [PubMed] [Google Scholar]
- 14.Stensola T, Stensola H, Moser M-B, Moser EI. Shearing-induced asymmetry in entorhinal grid cells. Nature. 2015;518:207–212. doi: 10.1038/nature14151. [DOI] [PubMed] [Google Scholar]
- 15.Fox MD, Raichle ME. Spontaneous fluctuations in brain activity observed with functional magnetic resonance imaging. Nat Rev Neurosci. 2007;8:700–711. doi: 10.1038/nrn2201. [DOI] [PubMed] [Google Scholar]
- 16.Binder JR, Desai RH, Graves WW, Conant LL. Where is the semantic system? A critical review and meta-analysis of 120 functional neuroimaging studies. Cereb Cortex. 2009;19:2767–2796. doi: 10.1093/cercor/bhp055. [DOI] [PMC free article] [PubMed] [Google Scholar]
- 17.Schacter DL, Addis DR, Hassabis D, Martin VC, Spreng RN, Szpunar KK. The future of memory: Remembering, imagining, and the brain. Neuron. 2012;76:677–694. doi: 10.1016/j.neuron.2012.11.001. [DOI] [PMC free article] [PubMed] [Google Scholar]
- 18.Hassabis D, Maguire EA. Deconstructing episodic memory with construction. Trends Cogn Sci (Regul Ed) 2007;11:299–306. doi: 10.1016/j.tics.2007.05.001. [DOI] [PubMed] [Google Scholar]
- 19.Clithero JA, Rangel A. Informatic parcellation of the network involved in the computation of subjective value. Soc Cogn Affect Neurosci. 2014;9:1289–1302. doi: 10.1093/scan/nst106. [DOI] [PMC free article] [PubMed] [Google Scholar]
- 20.Saxe R, Carey S, Kanwisher N. Understanding other minds: Linking developmental psychology and functional neuroimaging. Annu Rev Psychol. 2004;55:87–124. doi: 10.1146/annurev.psych.55.090902.142044. [DOI] [PubMed] [Google Scholar]
- 21.Benoit RG, Szpunar KK, Schacter DL. Ventromedial prefrontal cortex supports affective future simulation by integrating distributed knowledge. Proc Natl Acad Sci USA. 2014;111:16550–16555. doi: 10.1073/pnas.1419274111. [DOI] [PMC free article] [PubMed] [Google Scholar]
- 22.Quiroga RQ, Reddy L, Kreiman G, Koch C, Fried I. Invariant visual representation by single neurons in the human brain. Nature. 2005;435:1102–1107. doi: 10.1038/nature03687. [DOI] [PubMed] [Google Scholar]
- 23.Aronov D, Nevers R, Tank DW. CA1 firing fields represent an abstract coordinate during non-spatial navigation. Proceedings of the Meeting of Computational and Systems Neuroscience. 2016;T-29:41. [Google Scholar]
- 24.Kraus BJ, Brandon MP, Robinson RJ, 2nd, Connerney MA, Hasselmo ME, Eichenbaum H. During Running in Place, Grid Cells Integrate Elapsed Time and Distance Run. Neuron. 2015;88:578–589. doi: 10.1016/j.neuron.2015.09.031. [DOI] [PMC free article] [PubMed] [Google Scholar]
- 25.Davis T, Poldrack RA. Quantifying the internal structure of categories using a neural typicality measure. Cereb Cortex. 2014;24:1720–1737. doi: 10.1093/cercor/bht014. [DOI] [PubMed] [Google Scholar]
- 26.Materials and methods are available as supplementary materials on Science Online
- 27.Dordek Y, Soudry D, Meir R, Derdikman D. Extracting grid cell characteristics from place cell inputs using non-negative principal component analysis. eLife. 2016;5:682. doi: 10.7554/eLife.10094. [DOI] [PMC free article] [PubMed] [Google Scholar]
- 28.Stachenfeld KL, Botvinick MM, Gershman SJ. Design Principles of the Hippocampal Cognitive Map. NIPS Proceedings, Advances in Neural Information Processing Systems. 2014:2528–2536. [Google Scholar]
Associated Data
This section collects any data citations, data availability statements, or supplementary materials included in this article.


